Intel Core i7-13650HX
The Intel Core i5-13650HX is a fast high-end mobile processor of the Raptor Lake series. Is was announced in early 2023. The CPU integrates 6 fast Raptor Cove performance cores (P-cores) with Hyper-Threading and 8 Gracemont efficiency cores without HyperThreading. The P-Cores clock between 2.6 GHz (base) up to 4.9 GHz (single core boost, all-core 4.5 GHz). The smaller E-Cores clock between 1.9 and 3.6 GHz.
Compared to Alder Lake, Raptor Lake offers improved P-Cores (Raptor Cove micro-architecture) with bigger Caches and more E-Cores (same Gracemont micro-architecture). Furthermore, the chip supports faster DDR5 memory (up to 5600 MHz for the 13980HX, but only 4800 MHz for the i5).
Performance
The average 13650HX in our database is in the same league as the Core i7-13700HX and the Core i9-12950HX , as far as multi-thread benchmark scores are concerned.
Your mileage may vary depending on how high the CPU power limits are and how competent the cooling solution of your system is.
The CPU is still produced on a further improved 10nm FinFET process (Intel 7) that allows the higher clock speeds. The power consumption is specified at 55W base power up to 157 Watt max. Turbo power.
Series Intel Raptor Lake-HX Codename Raptor Lake-HX Series: Raptor Lake-HX Raptor Lake-HX Clock Rate 1900 - 4900 MHz Level 3 Cache 24 MB Number of Cores / Threads 14 / 20 Power Consumption (TDP = Thermal Design Power) 55 Watt Manufacturing Technology 10 nm Die Size 257 mm2 Max. Temperature 100 °C Socket BGA1964 Features DDR4-3200/DDR5-4800 RAM, PCIe 5, Thr. Dir., DL B., GNA, MMX, SSE, SSE2, SSE3, SSSE3, SSE4.1, SSE4.2, AVX, AVX2, BMI2, ABM, FMA, ADX, SMEP, SMAP, EIST, TM1, TM2, HT, Turbo, SST, AES-NI, RDRAND, RDSEED, SHA GPU Intel UHD Graphics Xe 16EUs (Tiger Lake-H) ( - 1550 MHz)64 Bit 64 Bit support Architecture x86 Announcement Date 01/04/2023 Product Link (external) ark.intel.com
Benchmarks Performance Rating - CB R15 + R20 + 7-Zip + X265 + Blender + 3DM11 CPU
46 pt (64%)
...
...
max:
Cinebench 2024 - CB24 CPU Single Core
min: 107.2 avg: 109.6 median: 109.6 (76%) max: 111.9 Points
CPU TDP 45 W TDP 55 W 96% 100%
...
...
Cinebench 2024 - CB24 CPU Multi Core
min: 805 avg: 991 median: 990.5 (18%) max: 1176 Points
CPU TDP 45 W TDP 55 W 68% 100%
...
max:
Cinebench R23 - Cinebench R23 Multi Core
min: 18879 avg: 20359 median: 20774.5 (19%) max: 21006 Points
CPU TDP 45 W TDP 55 W TDP 110 W TDP 191 W 90% 98% 100% 100%
...
...
max:
Cinebench R23 - Cinebench R23 Single Core
min: 1813 avg: 1858 median: 1857.5 (79%) max: 1903 Points
CPU TDP 45 W TDP 55 W TDP 110 W TDP 191 W 95% 99% 100% 96%
...
...
max:
Cinebench R20 - Cinebench R20 CPU (Single Core)
min: 700 avg: 715 median: 716 (80%) max: 728 Points
CPU TDP 45 W TDP 55 W TDP 110 W TDP 191 W 96% 99% 100% 98%
...
...
max:
Cinebench R20 - Cinebench R20 CPU (Multi Core)
min: 7197 avg: 7760 median: 7910 (19%) max: 8021 Points
CPU TDP 45 W TDP 55 W TDP 110 W TDP 191 W 90% 98% 100% 100%
...
...
max:
Cinebench R15 - Cinebench R15 CPU Multi 64 Bit
min: 2864 avg: 3041 median: 3075.5 (19%) max: 3147 Points
CPU TDP 45 W TDP 55 W TDP 110 W TDP 191 W 91% 96% 100% 100%
...
...
max:
0 160 320 480 640 800 960 1120 1280 1440 1600 1760 1920 2080 2240 2400 2560 2720 2880 3040 Tooltip Gigabyte G6X 9KG (2024): Ø2018 (1801.23-2863.69)
Dell G16, i7-13650HX, RTX 4060: Ø2933 (2802.3-3015.45)
Asus ROG Strix G18 G814JI: Ø3111 (3067.01-3136.03)
Dell G15 5530: Ø2985 (2897.29-3146.63)
Cinebench R15 - Cinebench R15 CPU Single 64 Bit
min: 256 avg: 268.3 median: 271 (82%) max: 275 Points
CPU TDP 45 W TDP 55 W TDP 110 W TDP 191 W 93% 98% 100% 99%
...
...
max:
Cinebench R11.5 - Cinebench R11.5 CPU Multi 64 Bit
37.4 Points (49%)
...
max:
Cinebench R11.5 - Cinebench R11.5 CPU Single 64 Bit
3.3 Points (82%)
...
...
max:
Cinebench R10 - Cinebench R10 Rend. Single (32bit)
10616 points (64%)
...
max:
Cinebench R10 - Cinebench R10 Rend. Multi (32bit)
68755 points (50%)
...
max:
8422 points (13%)
...
...
max:
7-Zip 18.03 - 7-Zip 18.03 Multli Thread 4 runs
min: 73927 avg: 77006 median: 77020 (44%) max: 80057 MIPS
CPU TDP 45 W TDP 55 W TDP 110 W TDP 191 W 92% 95% 100% 97%
...
...
max:
7-Zip 18.03 - 7-Zip 18.03 Single Thread 4 runs
min: 5828 avg: 5934 median: 5891 (70%) max: 6125 MIPS
CPU TDP 45 W TDP 55 W TDP 110 W TDP 191 W 95% 97% 100% 95%
...
...
max:
X264 HD Benchmark 4.0 - x264 Pass 2
175.1 fps (61%)
...
max:
X264 HD Benchmark 4.0 - x264 Pass 1
345.8 fps (80%)
...
max:
HWBOT x265 Benchmark v2.2 - HWBOT x265 4k Preset
min: 18.9 avg: 21.3 median: 21.4 (38%) max: 23.6 fps
CPU TDP 45 W TDP 55 W TDP 110 W TDP 191 W 80% 85% 100% 96%
...
...
max:
0 5 10 15 20 25 30 Tooltip Gigabyte G6X 9KG (2024): Ø21.2 (1.83-33)
Dell G16, i7-13650HX, RTX 4060: Ø19.3 (0.38-21.5)
Dell G15 5530: Ø23.2 (1.52-33.1)
Asus ROG Strix G18 G814JI: Ø23.6 (1.12-31.9)
TrueCrypt - TrueCrypt Serpent
1.6 GB/s (0%)
...
...
max:
TrueCrypt - TrueCrypt Twofish
2.9 GB/s (50%)
...
max:
TrueCrypt - TrueCrypt AES
16.7 GB/s (43%)
...
max:
Blender - Blender 3.3 Classroom CPU *
min: 272 avg: 308.5 median: 280.5 (4%) max: 401 Seconds
CPU TDP 45 W TDP 55 W TDP 110 W TDP 191 W 100% 102% 102% 102%
...
...
Blender - Blender 2.79 BMW27 CPU *
min: 158 avg: 178.5 median: 165 (1%) max: 226 Seconds
CPU TDP 45 W TDP 55 W TDP 110 W TDP 191 W 100% 100% 100% 100%
...
...
R Benchmark 2.5 - R Benchmark 2.5 *
min: 0.4217 avg: 0.4 median: 0.4 (9%) max: 0.4407 sec
CPU TDP 45 W TDP 55 W TDP 110 W TDP 191 W 100% 100% 100% 100%
...
...
3DMark 06 - CPU - 3DMark 06 - CPU
16051 Points (34%)
...
max:
Super Pi mod 1.5 XS 1M - Super Pi mod 1.5 XS 1M *
6.7 s (1%)
...
VIA C3-M C3-M-1200
Super Pi mod 1.5 XS 2M - Super Pi mod 1.5 XS 2M *
14.8 s (1%)
...
...
Super Pi Mod 1.5 XS 32M - Super Pi mod 1.5 XS 32M *
370.4 s (2%)
...
Intel Core i5-11500B
...
VIA C3-M C3-M-1200
3DMark 11 - 3DM11 Performance Physics
min: 21967 avg: 23883 median: 24468.5 (66%) max: 24629 Points
CPU TDP 45 W TDP 55 W TDP 110 W TDP 191 W 89% 99% 100% 99%
...
max:
3DMark - 3DMark Ice Storm Physics
90187 Points (73%)
...
...
max:
3DMark - 3DMark Ice Storm Extreme Physics
89359 Points (73%)
...
...
max:
3DMark - 3DMark Ice Storm Unlimited Physics
92195 Points (78%)
...
...
max:
3DMark - 3DMark Cloud Gate Physics
min: 21558 avg: 21733 median: 21744 (55%) max: 21896 Points
CPU TDP 55 W TDP 110 W TDP 191 W 100% 98% 99%
...
max:
3DMark - 3DMark Fire Strike Standard Physics
min: 27723 avg: 31118 median: 31955.5 (57%) max: 32839 Points
CPU TDP 45 W TDP 55 W TDP 110 W TDP 191 W 84% 97% 97% 100%
...
...
max:
3DMark - 3DMark Time Spy CPU
min: 13526 avg: 14070 median: 14032 (59%) max: 14690 Points
CPU TDP 45 W TDP 55 W TDP 110 W TDP 191 W 92% 100% 96% 96%
...
...
max:
Geekbench 6.2 - Geekbench 6.2 Single-Core
min: 2505 avg: 2534 median: 2533.5 (77%) max: 2562 points
CPU TDP 45 W TDP 55 W 98% 100%
...
...
Geekbench 6.2 - Geekbench 6.2 Multi-Core
min: 13554 avg: 13633 median: 13632.5 (54%) max: 13711 points
CPU TDP 45 W TDP 55 W 99% 100%
...
...
max:
Geekbench 5.5 - Geekbench 5.1 - 5.4 64 Bit Single-Core
min: 1810 avg: 1842 median: 1845 (78%) max: 1866 points
CPU TDP 45 W TDP 55 W TDP 110 W TDP 191 W 97% 100% 98% 99%
...
...
Geekbench 5.5 - Geekbench 5.1 - 5.4 64 Bit Multi-Core
min: 12509 avg: 13584 median: 13729.5 (25%) max: 14367 points
CPU TDP 45 W TDP 55 W TDP 110 W TDP 191 W 94% 87% 100% 98%
...
...
max:
Geekbench 5.0 - Geekbench 5.0 64 Bit Single-Core
1795 points (8%)
...
...
max:
Geekbench 5.0 - Geekbench 5.0 64 Bit Multi-Core
12356 points (39%)
...
...
max:
Geekbench 4.4 - Geekbench 4.1 - 4.4 64 Bit Single-Core
7895 points (79%)
...
...
max:
Geekbench 4.4 - Geekbench 4.1 - 4.4 64 Bit Multi-Core
52742 points (59%)
...
max:
Mozilla Kraken 1.1 - Kraken 1.1 Total Score *
min: 502 avg: 506 median: 507 (1%) max: 511 ms
CPU TDP 45 W TDP 55 W TDP 110 W TDP 191 W 100% 100% 100% 100%
...
...
max:
Octane V2 - Octane V2 Total Score
94168 Points (85%)
...
...
WebXPRT 4 - WebXPRT 4 Score
min: 260 avg: 272.5 median: 276.5 (79%) max: 277 Points
CPU TDP 45 W TDP 110 W TDP 191 W 94% 100% 100%
...
...
max:
WebXPRT 3 - WebXPRT 3 Score
min: 268 avg: 297 median: 302 (63%) max: 312 Points
CPU TDP 45 W TDP 55 W TDP 110 W TDP 191 W 97% 86% 100% 93%
...
...
CrossMark - CrossMark Overall
min: 1839 avg: 1877 median: 1842 (71%) max: 1951 Points
CPU TDP 45 W TDP 55 W TDP 191 W 100% 94% 94%
...
...
max:
Power Consumption - Prime95 Power Consumption - external Monitor *
min: 100.9 avg: 151.5 median: 161.9 (28%) max: 181.3 Watt
CPU TDP 45 W TDP 55 W TDP 110 W TDP 191 W 120% 101% 109% 100%
...
...
max:
0 15 30 45 60 75 90 105 120 135 150 165 180 195 210 Tooltip Gigabyte G6X 9KG (2024): Ø100.9 (83.9-141.4)
Asus ROG Strix G18 G814JI: Ø146.8 (136.8-168.9)
Dell G16, i7-13650HX, RTX 4060: Ø176.7 (168.74-182.35)
Dell G15 5530: Ø181.3 (152.3-224)
Power Consumption - Cinebench R15 Multi Power Consumption - external Monitor *
min: 158 avg: 180.7 median: 181 (33%) max: 203 Watt
CPU TDP 55 W TDP 110 W TDP 191 W 106% 113% 100%
...
...
max:
0 15 30 45 60 75 90 105 120 135 150 165 180 195 210 Tooltip Asus ROG Strix G18 G814JI: Ø158 (157-160.9)
Dell G16, i7-13650HX, RTX 4060: Ø181.3 (174.56-185.44)
Dell G15 5530: Ø203 (194.5-220)
Power Consumption - Idle Power Consumption - external Monitor *
min: 16.7 avg: 21.8 median: 20.4 (15%) max: 29.8 Watt
CPU TDP 45 W TDP 55 W TDP 110 W TDP 191 W 107% 110% 112% 100%
...
...
max:
0 5 10 15 20 25 30 35 Tooltip Asus ROG Strix G18 G814JI: Ø16.7 (10-25.8)
Dell G16, i7-13650HX, RTX 4060: Ø19.2 (2.9589-35.758)
Gigabyte G6X 9KG (2024): Ø21.7 (20.2-25.8)
Dell G15 5530: Ø29.8 (23.8-37.2)
Power Consumption - Idle Power Consumption 150cd 1min *
min: 13.1 avg: 14 median: 14 (16%) max: 15 Watt
CPU TDP 45 W TDP 55 W TDP 110 W 103% 101% 100%
...
...
max:
0 5 10 15 20 25 Tooltip Gigabyte G6X 9KG (2024): Ø13.1 (11.9-27.1)
Dell G16, i7-13650HX, RTX 4060: Ø14.6 (0.8094-28.274)
Asus ROG Strix G18 G814JI: Ø15 (9.02-20)
Power Consumption - Cinebench R15 Multi Power Efficiency - external Monitor
min: 15.5 avg: 17.3 median: 16.7 (12%) max: 19.8 Points per Watt
CPU TDP 55 W TDP 110 W TDP 191 W 84% 100% 78%
...
...
- Range of benchmark values for this graphics card
- Average benchmark values for this graphics card
* Smaller numbers mean a higher performance
v1.26
log 28. 04:56:32
#0 no ids found in url (should be separated by "_") +0s ... 0s
#1 not redirecting to Ajax server +0s ... 0s
#2 did not recreate cache, as it is less than 5 days old! Created at Mon, 25 Mar 2024 05:38:27 +0100 +0.001s ... 0.001s
#3 composed specs +0.014s ... 0.015s
#4 did output specs +0s ... 0.015s
#5 getting avg benchmarks for device 14669 +0.018s ... 0.033s
#6 got single benchmarks 14669 +0.024s ... 0.058s
#7 got avg benchmarks for devices +0s ... 0.058s
#8 min, max, avg, median took s +1.078s ... 1.135s
#9 return log +0.031s ... 1.166s
Reviews for the Intel Core i7-13650HX processor
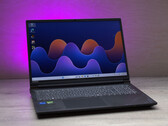
Dell G16 (2024) laptop review: An affordable Alienware alternative from the same manufacturer? 
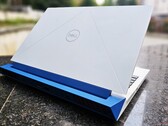
In contrast to Dell's Alienware series, the Dell G16 covers the mid-range segment of gaming laptops. The 2024 model relies neither on Intel's new Gen 14 chips n...
Intel Core i7-13650HX | NVIDIA GeForce RTX 4060 Laptop GPU | 16.00" | 2.8 kg
Dell G15 5530 Review: A viable Alienware alternative now with Raptor Lake-HX The Dell G15 5530 now offers Intel Raptor Lake-HX options and positions itself as a capable upper mid-range gaming laptop. While the Core i7-13650HX and RTX 406...
Intel Core i7-13650HX | NVIDIA GeForce RTX 4060 Laptop GPU | 15.60" | 3 kg
Asus ROG Strix G18 G814JI laptop review: Light and shade with the 18-inch gaming machine In 2023, more and more 18-inch laptops are entering the gaming segment. One particular candidate is the ROG Strix G18, which shows up trumps with the latest, hi...
Intel Core i7-13650HX | NVIDIA GeForce RTX 4070 Laptop GPU | 18.00" | 3 kg
Asus ROG Strix G16 G614JU, i7-13650HX : NVIDIA GeForce RTX 4050 Laptop GPU, 16.00", 2.5 kg
External Review » Asus ROG Strix G16 G614JU, i7-13650HX
Dell G15 5530, RTX 4050 : NVIDIA GeForce RTX 4050 Laptop GPU, 15.60", 2.8 kg
External Review » Dell G15 5530, RTX 4050
Dell G16 7630 : NVIDIA GeForce RTX 4060 Laptop GPU, 15.60", 2.9 kg
External Review » Dell G16 7630
Asus ROG Strix G16 G614JV, i7-13650HX : NVIDIA GeForce RTX 4060 Laptop GPU, 16.00", 2.5 kg
External Review » Asus ROG Strix G16 G614JV, i7-13650HX
Dell G15 5530 : NVIDIA GeForce RTX 4060 Laptop GPU, 15.60", 3 kg
External Review » Dell G15 5530
Asus Vivobook Pro 15 K6502, i7-13650HX RTX 3050 : NVIDIA GeForce RTX 3050 4GB Laptop GPU, 15.60", 1.8 kg
External Review » Asus Vivobook Pro 15 K6502, i7-13650HX RTX 3050
Asus ROG Strix G18 G814JI : NVIDIA GeForce RTX 4070 Laptop GPU, 18.00", 3 kg
External Review » Asus ROG Strix G18 G814JI
Dell G16, i7-13650HX, RTX 4060 : NVIDIA GeForce RTX 4060 Laptop GPU, 16.00", 2.8 kg
» The new Dell G16 reviewed: An affordable gamer with a huge power supply
Dell G16 7630 : NVIDIA GeForce RTX 4060 Laptop GPU, 15.60", 2.9 kg
» Dell G16 gaming laptop with Core i9-13900HX, RTX 4070 and 165Hz QHD display now on sale at Amazon
Dell G15 5530 : NVIDIA GeForce RTX 4060 Laptop GPU, 15.60", 3 kg
» Dell G15 gaming laptop with RTX 4060 and AMD Ryzen 7 7840HS now 22% off
Dell G16 7630 : NVIDIA GeForce RTX 4060 Laptop GPU, 15.60", 2.9 kg
» Dell G16 gaming laptop with RTX 4070, i9-13900HX and 240Hz QHD display now 18% off
»
2023 Lenovo Legion Slim 5 price sees whopping 38% cut for open-box SKU with Ryzen 5 7640HS CPU and RTX 4060 GPU
Dell G15 5530 : NVIDIA GeForce RTX 4060 Laptop GPU, 15.60", 3 kg
» Dell G15 5530 gaming laptop with RTX 4060 and Core i7-13650HX now 25% off
Please share our article, every link counts!
Other CPUs of the series Raptor Lake-HX Surrounding CPUs
Working For Notebookcheck
Are you a techie who knows how to translate? Then join our Team!
Details here
Top 10 Laptops Multimedia , Budget Multimedia , Gaming , Budget Gaming , Lightweight Gaming , Business , Budget Office , Workstation , Subnotebooks , Ultrabooks , Chromebooks
under 300 USD/Euros , under 500 USD/Euros , 1,000 USD/Euros , for University Students , Best Displays
Top 10 Smartphones Smartphones , Phablets , ≤6-inch , Camera Smartphones
Klaus Hinum (Update: 2022-12-28)