Notebookcheck Logo

Intel UHD Graphics 615 vs NVIDIA RTX A500 Laptop GPU vs Intel HD Graphics P630

Intel UHD Graphics 615

► remove from comparison Intel UHD Graphics 615

The Intel UHD Graphics 615 (GT2) is a low-end integrated graphics unit, which can be found in the Y-series of the Amber-Lake generation. This "GT2" version offers 24 Execution Units (EUs) clocked at up to 1000 MHz (depending on the CPU model). Due to its lack of dedicated graphics memory or eDRAM cache, the UHD 615 has to access the main memory (2x 64bit DDR3L/LPDDR3). Compared to the old HD Graphics 615 in Kaby-Lake-Y CPUs, the UHD 615 is the same GPU with slightly different clock speeds (depending on the model) and slight power/performance improvements due to the improved 14nm++ process .

Performance

The 3D performance of the UHD 615 depends on the CPU model and the cooling / TDP-setting of the laptop. Furthermore, the used main memory (single channel, DDR3(L), amount) is influencing performance. On average the UHD graphics 615 should be very similar to the Kaby-Lake HD Graphics 615 due to the same architecture and similar speeds. That means that only low demanding games like Farming Simulator 17 or Rocket League are playable in lowest detail settings.

Features

The revised video engine in the HD 615 and UHD 615 now supports H.265/HEVC Main10 profile in hardware with 10 bit colors. Furthermore, Googles VP9 codec can also be hardware decoded. The UHD 615 should support HDCP 2.2 and therefore Netflix 4K. HDMI 2.0 however is still only supported with an external converter chip (LSPCon).

Power Consumption

The UHD Graphics 615 can be found in Y processors with 5 W TDP (can be manipulated by the laptop manufacturers, and up 0,5 Watt from the previous generation) and is therefore suited for very thin, mostly passively cooled 2-in-1 notebooks and tablets.

NVIDIA RTX A500 Laptop GPU

► remove from comparison NVIDIA RTX A500 Laptop GPU

The NVIDIA RTX A500 Laptop GPU or A500 Mobile is a professional graphics card for mobile workstations. It is based on the GA107 Ampere chip and offers a slower performance than the GeForce RTX 3050 Laptop GPU. It offers 2,048 CUDA, 16 Raytracing and 64 Tensor cores paired with a 64 Bit memory bus. It is available in different variants from 20 - 60 Watt (TGP) with different clock speeds (and performance). The GPU supports eDP 1.4b to connect the internal monitor and DisplayPort 1.4 and HDMI 2.1 for external connections.

There is no more Max-Q variant (formerly used for the low power variants) but every OEM can choose to implement Max-Q technologies (Dynamic Boost, WhisperMode).

The raw performance should be slower than the GeForce RTX 3050 for laptops at the same TGP level. Both GPUs depend heavily on good cooling and a high TGP for good performance. At a similar power consumption level the RTX A500 should be clearly faster than the old T500 and T550. 

The GA107 chip offers 2.560 FP32 ALUs of which half can also execute INT32 instructions (i.e. 1,280 INT32 ALUs). With Ampere all shaders could still execute FP32 or INT32 instructions. The raytracing and tensor cores on the chip were also improved according to Nvidia. The A500 can only use 2048 CUDA cores. The Ampere chips also include an improved 5th generation video encoder (NVENC for H.264 and H.265) and a 7th generation decoder (for various formats now including AV1).

The GA107 chip is manufactured by Samsung in 8nm (8N), which is not quite able to keep up with the 7nm node at TSMC (e.g. used by AMD and also for the professional GA100 Ampere chip).

Intel HD Graphics P630

► remove from comparison Intel HD Graphics P630

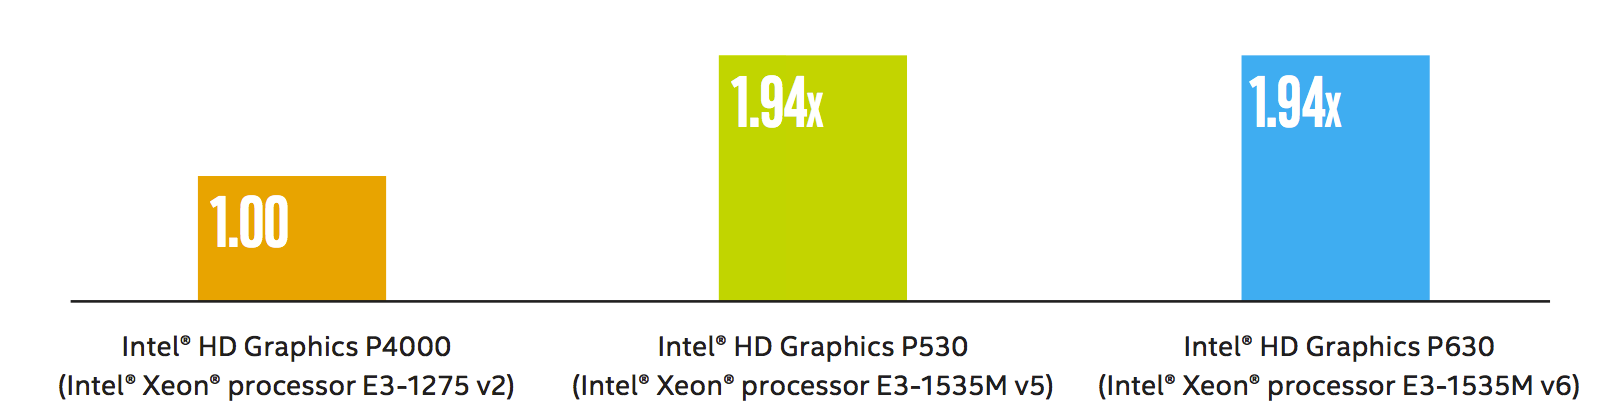
The Intel HD Graphics P630 (GT2) is an integrated graphics unit, which can be found in various Xeon workstation processors of the Kaby Lake generation. The "GT2" version of the Skylake GPU offers 24 Execution Units (EUs) clocked at up to 1050 MHz (depending on the CPU model). Due to its lack of dedicated graphics memory or eDRAM cache, the P630 has to access the main memory (2x 64bit DDR3L-1600 / DDR4-2133). It uses the same silicon as the consumer HD Graphics 630 in Kaby-Lake-H processors but features optimized drivers for workstaion and CAD software. According to Intel it is certified for 15 applications (see list).

Performance

According to Intel, the performance of the P630 is identical to the Intel HD Graphis P530 (Skylake predecessor) processor graphics card and 1.94x faster than the old Intel HD Graphics P4000. Compared to consumer cards, the gaming performance should be on a similar level to the dedicated GeForce 920M and will handle old games (as of 2015) in low or medium settings.

Features

The revised video engine in the Kaby Lake chips now supports H.265/HEVC Main10 profile at 10-bit color depth and also the VP9 codec in hardware. Furthermore, HDCP 2.2 is also supported in all chips, which allows Netflix 4K videos, for instance.

Power Consumption

The HD Graphics P630 can be found in mobile quad-core Xeon processors with 45 W TDP and also desktop processors of the Xeon range with higher TDPs.

Sourcehttp://www.intel.com/content/dam/www/public/us/en/documents/guides/hd-graphics-performance-guide.pdf

Intel UHD Graphics 615NVIDIA RTX A500 Laptop GPUIntel HD Graphics P630
Gen. 9.5 Series
Iris Plus Graphics 655 48 @ 0.3 - 1.2 GHz
Iris Plus Graphics 650 48 @ 0.3 - 1.1 GHz64/128 Bit
Iris Plus Graphics 645 48 @ 0.3 - 1.15 GHz
Iris Plus Graphics 640 48 @ 0.3 - 1.05 GHz64/128 Bit
UHD Graphics 630 24 @ 0.3 - 1.15 GHz64/128 Bit
UHD Graphics P630 24 @ 0.3 - 1.2 GHz64/128 Bit
HD Graphics 630 24 @ 0.3 - 1.15 GHz64/128 Bit
HD Graphics P630 24 64/128 Bit
UHD Graphics 620 24 @ 0.3 - 1.15 GHz
HD Graphics 620 24 @ 0.3 - 1.05 GHz64/128 Bit
UHD Graphics 617 24 @ 0.3 - 1.15 GHz64/128 Bit
UHD Graphics 615 24 @ 0.3 - 1 GHz64/128 Bit
HD Graphics 615 24 @ 0.3 - 1.05 GHz64/128 Bit
RTX A5500 Laptop GPU 7424 256 Bit @ 16000 MHz
RTX A4500 Laptop GPU 5888 @ 0.93 - 1.5 GHz256 Bit @ 16000 MHz
RTX A5000 Laptop GPU 6144 @ 1.22 - 1.77 GHz256 Bit @ 14000 MHz
RTX A4000 Laptop GPU 5120 @ 0.78 - 1.68 GHz256 Bit @ 12000 MHz
RTX A3000 Laptop GPU 4096 @ 1.08 - 1.56 GHz192 Bit @ 14000 MHz
RTX A2000 3328 @ 0.56 - 1.2 GHz192 Bit @ 12000 MHz
RTX A2000 Laptop GPU 2560 @ 0.89 - 1.69 GHz128 Bit @ 14000 MHz
RTX A1000 Laptop GPU 2048 128 Bit @ 14000 MHz
RTX A500 Laptop GPU 2048 64 Bit @ 14000 MHz
Iris Plus Graphics 655 48 @ 0.3 - 1.2 GHz
Iris Plus Graphics 650 48 @ 0.3 - 1.1 GHz64/128 Bit
Iris Plus Graphics 645 48 @ 0.3 - 1.15 GHz
Iris Plus Graphics 640 48 @ 0.3 - 1.05 GHz64/128 Bit
UHD Graphics 630 24 @ 0.3 - 1.15 GHz64/128 Bit
UHD Graphics P630 24 @ 0.3 - 1.2 GHz64/128 Bit
HD Graphics 630 24 @ 0.3 - 1.15 GHz64/128 Bit
HD Graphics P630 24 64/128 Bit
UHD Graphics 620 24 @ 0.3 - 1.15 GHz
HD Graphics 620 24 @ 0.3 - 1.05 GHz64/128 Bit
UHD Graphics 617 24 @ 0.3 - 1.15 GHz64/128 Bit
UHD Graphics 615 24 @ 0.3 - 1 GHz64/128 Bit
HD Graphics 615 24 @ 0.3 - 1.05 GHz64/128 Bit
CodenameKaby-Lake GT2GA107Kaby-Lake-H-GT2
ArchitectureGen. 9 Amber LakeAmpereGen. 9.5 Kaby Lake
Pipelines24 - unified2048 - unified24 - unified
Core Speed300 - 1000 (Boost) MHz
Memory Bus Width64/128 Bit64 Bit64/128 Bit
Memory TypeDDR3L/LPDDR3GDDR6
Shared Memoryyesnoyes
APIDirectX 12_1, OpenGL 4.4DirectX 12_2, Shader 6.7, OpenGL 4.6DirectX 12_1, OpenGL 4.4
Power Consumption5 Watt60 Watt (20 - 60 Watt TGP)
technology14 nm8 nm14 nm
FeaturesQuickSyncQuickSync
Date of Announcement30.08.2018 30.03.2022 05.08.2015
Raytracing Cores16
Tensor / AI Cores64
Theoretical Performance7.3 TFLOPS FP32
Memory Speed14000 MHz
Max. Amount of Memory4 GB
Memory Bandwidth112 GB/s
PCIe4
Link to Manufacturer Pagenvdam.widen.net
CPU in UHD Graphics 615GPU Base SpeedGPU Boost / Turbo
Intel Core i5-10310Y4 x 1100 MHz, 7 W300 MHz1050 MHz
Intel Core i5-10210Y4 x 1000 MHz, 7 W300 MHz1050 MHz
Intel Core i7-8500Y2 x 1500 MHz, 5 W300 MHz1000 MHz
min. - max.300 MHz850 - 1050 MHz
CPU in HD Graphics P630GPU Base SpeedGPU Boost / Turbo
Intel Xeon E3-1535M v64 x 3100 MHz, 45 W300 MHz1150 MHz
Intel Xeon E3-1505M v64 x 3000 MHz, 45 W300 MHz1150 MHz
min. - max.300 MHz1150 MHz

Benchmarks

Performance Rating - 3DMark 11 + Fire Strike + Time Spy - UHD Graphics 615
0.3 pt (1%)
Restrict / Search: Model: Max. age: years
Performance Rating - 3DMark 11 + Fire Strike + Time Spy - RTX A500 Laptop GPU
2.8 pt (9%)
Restrict / Search: Model: Max. age: years
3DMark - 3DMark Time Spy Score
min: 232     avg: 277.2     median: 275 (1%)     max: 328 Points
min: 3127     avg: 3273     median: 3273 (9%)     max: 3419 Points
400 Points (1%)
3DMark - 3DMark Time Spy Graphics
min: 205     avg: 244.7     median: 242.5 (0%)     max: 289 Points
min: 2873     avg: 2995     median: 2994.5 (6%)     max: 3116 Points
3DMark - 3DMark Ice Storm Unlimited Graphics
min: 50702     avg: 60159     median: 57024 (6%)     max: 73265 Points
3DMark - 3DMark Ice Storm Extreme Graphics
min: 23099     avg: 26792     median: 25456 (3%)     max: 35452 Points
3DMark - 3DMark Cloud Gate Score
min: 3490     avg: 4533     median: 4423 (4%)     max: 5622 Points
min: 27001     avg: 28765     median: 28764.5 (27%)     max: 30528 Points
8280 Points (8%)
3DMark - 3DMark Cloud Gate Graphics
min: 4521     avg: 6316     median: 6583 (2%)     max: 7568 Points
min: 46927     avg: 48496     median: 48495.5 (12%)     max: 50064 Points
3DMark - 3DMark Fire Strike Standard Score
min: 509     avg: 730     median: 738 (1%)     max: 881 Points
min: 6899     avg: 6955     median: 6954.5 (10%)     max: 7010 Points
1040 Points (2%)
3DMark - 3DMark Fire Strike Standard Graphics
min: 563     avg: 816     median: 819 (1%)     max: 976 Points
min: 7578     avg: 7598     median: 7597.5 (7%)     max: 7617 Points
3DMark - 3DMark Ice Storm Graphics
min: 34728     avg: 42945     median: 42909 (5%)     max: 53693 Points
88367 Points (10%)
3DMark - 3DMark Sling Shot (ES 3.0)
2413 Points (21%)
3DMark - 3DMark Sling Shot (ES 3.0) Graphics
3161 Points (19%)
3DMark - 3DMark Sling Shot Extreme (ES 3.1)
1838 Points (9%)
3DMark - 3DMark Sling Shot Extreme (ES 3.1) Graphics
2049 Points (7%)
3DMark - 3DMark Wild Life Unlimited
1911 Points (1%)
3DMark - 3DMark Wild Life Extreme Unlimited
530 Points (1%)
3DMark - 3DMark Night Raid
min: 2535     avg: 2962     median: 2975 (3%)     max: 3376 Points
3DMark - 3DMark Night Raid Graphics Score
min: 2887     avg: 3543     median: 3810 (1%)     max: 3933 Points
min: 11213     avg: 11289     median: 11288.5 (14%)     max: 11364 Points
min: 10748     avg: 10818     median: 10818 (8%)     max: 10888 Points
3DMark Vantage
3DM Vant. Perf. total + Intel UHD Graphics 615
3DMark Vantage - 3DM Vant. Perf. total
3813 Points (1%)
3DM Vant. Perf. total + NVIDIA RTX A500 Laptop GPU
40923 Points (12%)
3DM Vant. Perf. GPU no PhysX + Intel UHD Graphics 615
3DMark Vantage - 3DM Vant. Perf. GPU no PhysX
3240 Points (2%)
3DM Vant. Perf. GPU no PhysX + NVIDIA RTX A500 Laptop GPU
39319 Points (21%)
3DMark 06 3DMark 06 - Standard 1280x1024 + Intel UHD Graphics 615
3DMark 06
min: 6386     avg: 6602     median: 6601.5 (9%)     max: 6817 Points
3DMark 06 - Standard 1280x1024 + NVIDIA RTX A500 Laptop GPU
40862 Points (53%)
Blender - Blender 3.3 Classroom CUDA *
min: 142     avg: 146     median: 146 (22%)     max: 150 Seconds
Blender - Blender 3.3 Classroom OPTIX *
min: 88     avg: 91.5     median: 91.5 (34%)     max: 95 Seconds
SPECviewperf 12
specvp12 sw-03 + NVIDIA RTX A500 Laptop GPU
SPECviewperf 12 - specvp12 sw-03
126.4 fps (31%)
specvp12 snx-02 + NVIDIA RTX A500 Laptop GPU
SPECviewperf 12 - specvp12 snx-02
88.4 fps (13%)
specvp12 showcase-01 + NVIDIA RTX A500 Laptop GPU
SPECviewperf 12 - specvp12 showcase-01
31.8 fps (6%)
specvp12 maya-04 + NVIDIA RTX A500 Laptop GPU
SPECviewperf 12 - specvp12 maya-04
76.9 fps (21%)
specvp12 creo-01 + NVIDIA RTX A500 Laptop GPU
SPECviewperf 12 - specvp12 creo-01
88 fps (35%)
specvp12 catia-04 + NVIDIA RTX A500 Laptop GPU
SPECviewperf 12 - specvp12 catia-04
108.2 fps (18%)
SPECviewperf 13 specvp13 sw-04 + NVIDIA RTX A500 Laptop GPU
SPECviewperf 13 - specvp13 sw-04
min: 127.43     avg: 129.5     median: 129.5 (35%)     max: 131.64 fps
specvp13 snx-03 + NVIDIA RTX A500 Laptop GPU
SPECviewperf 13 - specvp13 snx-03
min: 145.61     avg: 153.2     median: 153.2 (17%)     max: 160.83 fps
specvp13 showcase-02 + NVIDIA RTX A500 Laptop GPU
SPECviewperf 13 - specvp13 showcase-02
min: 31.69     avg: 34.6     median: 34.6 (6%)     max: 37.51 fps
specvp13 medical-02 + NVIDIA RTX A500 Laptop GPU
SPECviewperf 13 - specvp13 medical-02
min: 73.93     avg: 78.3     median: 78.3 (13%)     max: 82.72 fps
specvp13 maya-05 + NVIDIA RTX A500 Laptop GPU
SPECviewperf 13 - specvp13 maya-05
min: 121.4     avg: 123.5     median: 123.5 (14%)     max: 125.67 fps
specvp13 energy-02 + NVIDIA RTX A500 Laptop GPU
SPECviewperf 13 - specvp13 energy-02
min: 20.53     avg: 21.4     median: 21.4 (7%)     max: 22.26 fps
specvp13 creo-02 + NVIDIA RTX A500 Laptop GPU
SPECviewperf 13 - specvp13 creo-02
min: 120.07     avg: 121.6     median: 121.6 (18%)     max: 123.09 fps
specvp13 catia-05 + NVIDIA RTX A500 Laptop GPU
SPECviewperf 13 - specvp13 catia-05
min: 146.08     avg: 154.4     median: 154.4 (17%)     max: 162.65 fps
specvp13 3dsmax-06 + NVIDIA RTX A500 Laptop GPU
SPECviewperf 13 - specvp13 3dsmax-06
min: 80.81     avg: 84     median: 84 (13%)     max: 87.19 fps
SPECviewperf 2020 specvp2020 solidworks-07 4k + NVIDIA RTX A500 Laptop GPU
SPECviewperf 2020 - specvp2020 solidworks-07 4k
10.8 fps (3%)
specvp2020 solidworks-07 1080p + NVIDIA RTX A500 Laptop GPU
SPECviewperf 2020 - specvp2020 solidworks-07 1080p
88.5 fps (19%)
specvp2020 solidworks-05 1080p + NVIDIA RTX A500 Laptop GPU
SPECviewperf 2020 - specvp2020 solidworks-05 1080p
79.9 fps (15%)
specvp2020 snx-04 1080p + NVIDIA RTX A500 Laptop GPU
SPECviewperf 2020 - specvp2020 snx-04 1080p
min: 139.98     avg: 148.5     median: 148.5 (18%)     max: 157.04 fps
specvp2020 medical-03 1080p + NVIDIA RTX A500 Laptop GPU
SPECviewperf 2020 - specvp2020 medical-03 1080p
min: 27.58     avg: 28.3     median: 28.3 (8%)     max: 28.96 fps
specvp2020 maya-06 1080p + NVIDIA RTX A500 Laptop GPU
SPECviewperf 2020 - specvp2020 maya-06 1080p
min: 143.05     avg: 143.6     median: 143.6 (15%)     max: 144.17 fps
specvp2020 energy-03 1080p + NVIDIA RTX A500 Laptop GPU
SPECviewperf 2020 - specvp2020 energy-03 1080p
min: 20.44     avg: 21.4     median: 21.4 (3%)     max: 22.29 fps
specvp2020 creo-03 1080p + NVIDIA RTX A500 Laptop GPU
SPECviewperf 2020 - specvp2020 creo-03 1080p
min: 50.44     avg: 61.4     median: 61.4 (21%)     max: 72.31 fps
specvp2020 catia-06 1080p + NVIDIA RTX A500 Laptop GPU
SPECviewperf 2020 - specvp2020 catia-06 1080p
min: 34.65     avg: 36.9     median: 36.9 (18%)     max: 39.09 fps
specvp2020 3dsmax-07 1080p + NVIDIA RTX A500 Laptop GPU
SPECviewperf 2020 - specvp2020 3dsmax-07 1080p
min: 32.99     avg: 35.4     median: 35.4 (9%)     max: 37.79 fps
specvp2020 snx-04 4k + NVIDIA RTX A500 Laptop GPU
SPECviewperf 2020 - specvp2020 snx-04 4k
98.2 fps (10%)
specvp2020 medical-03 4k + NVIDIA RTX A500 Laptop GPU
SPECviewperf 2020 - specvp2020 medical-03 4k
11.9 fps (8%)
specvp2020 maya-06 4k + NVIDIA RTX A500 Laptop GPU
SPECviewperf 2020 - specvp2020 maya-06 4k
66.7 fps (10%)
specvp2020 energy-03 4k + NVIDIA RTX A500 Laptop GPU
SPECviewperf 2020 - specvp2020 energy-03 4k
143.3 fps (20%)
specvp2020 creo-03 4k + NVIDIA RTX A500 Laptop GPU
SPECviewperf 2020 - specvp2020 creo-03 4k
37.6 fps (17%)
specvp2020 catia-06 4k + NVIDIA RTX A500 Laptop GPU
SPECviewperf 2020 - specvp2020 catia-06 4k
12.9 fps (8%)
specvp2020 3dsmax-07 4k + NVIDIA RTX A500 Laptop GPU
SPECviewperf 2020 - specvp2020 3dsmax-07 4k
17.1 fps (6%)
Cinebench R10 Cinebench R10 Shading (32bit) + Intel UHD Graphics 615
Cinebench R10 - Cinebench R10 Shading (32bit)
min: 4302     avg: 6351     median: 6378 (5%)     max: 8347 Points
Cinebench R10 Shading (32bit) + NVIDIA RTX A500 Laptop GPU
6844 Points (5%)
Cinebench R11.5 Cinebench R11.5 OpenGL 64 Bit + Intel UHD Graphics 615
Cinebench R11.5 - Cinebench R11.5 OpenGL 64 Bit
min: 19.94     avg: 24.9     median: 25.6 (8%)     max: 28.49 fps
Cinebench R11.5 OpenGL 64 Bit + NVIDIA RTX A500 Laptop GPU
212.8 fps (70%)
Cinebench R15
Cinebench R15 OpenGL 64 Bit + Intel UHD Graphics 615
Cinebench R15 - Cinebench R15 OpenGL 64 Bit
min: 22.54     avg: 32.9     median: 35.2 (2%)     max: 44.49 fps
Cinebench R15 OpenGL 64 Bit + NVIDIA RTX A500 Laptop GPU
min: 232     avg: 247     median: 247 (14%)     max: 262 fps
Cinebench R15 OpenGL Ref. Match 64 Bit + Intel UHD Graphics 615
Cinebench R15 OpenGL Ref. Match 64 Bit + NVIDIA RTX A500 Laptop GPU
99.6 % (100%)
GFXBench - GFXBench 5.0 4K Aztec Ruins High Tier Offscreen
28.5 fps (11%)
GFXBench - GFXBench 5.0 Aztec Ruins High Tier Offscreen
min: 6.5     avg: 7.1     median: 7.1 (1%)     max: 7.6 fps
64.7 fps (12%)
GFXBench - GFXBench 5.0 Aztec Ruins Normal Tier Offscreen
min: 16     avg: 18.1     median: 18.1 (1%)     max: 20.2 fps
166.1 fps (12%)
GFXBench - GFXBench Car Chase Offscreen
min: 15     avg: 17.7     median: 17.3 (2%)     max: 20.9 fps
174.1 fps (16%)
GFXBench 3.1 - GFXBench Manhattan ES 3.1 Offscreen
min: 22     avg: 24.7     median: 24.4 (1%)     max: 27.7 fps
232.7 fps (5%)
GFXBench 3.0 - GFXBench 3.0 Manhattan Offscreen
min: 32     avg: 36.6     median: 36.8 (2%)     max: 40.9 fps
321.7 fps (13%)
GFXBench (DX / GLBenchmark) 2.7
GFXBench T-Rex HD Offscreen C24Z16 + Intel UHD Graphics 615
GFXBench (DX / GLBenchmark) 2.7 - GFXBench T-Rex HD Offscreen C24Z16
min: 65     avg: 74.2     median: 69.6 (1%)     max: 88 fps
GFXBench T-Rex HD Offscreen C24Z16 + NVIDIA RTX A500 Laptop GPU
554 fps (4%)
Basemark GPU 1.2 - Basemark GPU 1.2 Vulkan Official Medium Offscreen 1080
104.6 fps (3%)
Basemark GPU 1.2 - Basemark GPU 1.2 Vulkan Official High Offscreen 2160
3.6 fps (1%)
Geekbench 6.4 - Geekbench 6.4 GPU OpenCL
3272 Points (1%)
min: 40215     avg: 41313     median: 41313 (11%)     max: 42411 Points
Geekbench 6.4 - Geekbench 6.4 GPU Vulkan
4154 Points (1%)
min: 20666     avg: 30177     median: 30176.5 (8%)     max: 39687 Points
LuxMark v2.0 64Bit - LuxMark v2.0 Room GPU
198 Samples/s (1%)
1023 Samples/s (4%)
LuxMark v2.0 64Bit - LuxMark v2.0 Sala GPU
473 Samples/s (1%)
2268 Samples/s (4%)
ComputeMark v2.1 - ComputeMark v2.1 Result
860 Points (1%)
8197 Points (7%)
Power Consumption - Furmark Stress Test Power Consumption - external Monitor *
21 Watt (3%)
min: 49.1     avg: 51.7     median: 51.7 (7%)     max: 54.3 Watt
Power Consumption - The Witcher 3 Power Consumption - external Monitor *
54.5 Watt (8%)
Power Consumption - Witcher 3 Power Consumption *
56.5 Watt (12%)
Power Consumption - Power Efficiency - Witcher 3 ultra
0.6 fps per Watt (50%)
Power Consumption - Power Efficiency - Witcher 3 ultra external Monitor
0.6 fps per Watt (47%)
Power Consumption - Cyberpunk 2077 Power Consumption 150cd *
63.4 Watt (18%)
Power Consumption - Cyberpunk 2077 Power Consumption - external Monitor *
58.1 Watt (7%)
Emissions Witcher 3 Fan Noise + NVIDIA RTX A500 Laptop GPU
Emissions - Witcher 3 Fan Noise
46 dB(A) (66%)

Average Benchmarks Intel UHD Graphics 615 → 100% n=3

Average Benchmarks NVIDIA RTX A500 Laptop GPU → 928% n=3

Average Benchmarks Intel HD Graphics P630 → 158% n=3

- Range of benchmark values for this graphics card
red legend - Average benchmark values for this graphics card
* Smaller numbers mean a higher performance
1 This benchmark is not used for the average calculation

Game Benchmarks

The following benchmarks stem from our benchmarks of review laptops. The performance depends on the used graphics memory, clock rate, processor, system settings, drivers, and operating systems. So the results don't have to be representative for all laptops with this GPU. For detailed information on the benchmark results, click on the fps number.

F1 24

F1 24

2024
low 1920x1080
RTX A500 Laptop GPU:
82.4  fps
med. 1920x1080
RTX A500 Laptop GPU:
71.9  fps
high 1920x1080
RTX A500 Laptop GPU:
32.9  fps
ultra 1920x1080
RTX A500 Laptop GPU:
11.7  fps
low 1920x1080
RTX A500 Laptop GPU:
34.6  fps
med. 1920x1080
RTX A500 Laptop GPU:
27.5  fps
high 1920x1080
RTX A500 Laptop GPU:
19.1  fps
ultra 1920x1080
RTX A500 Laptop GPU:
14.1  fps
low 1920x1080
RTX A500 Laptop GPU:
80.1  fps
med. 1920x1080
RTX A500 Laptop GPU:
68.6  fps
high 1920x1080
RTX A500 Laptop GPU:
58.6  fps
ultra 1920x1080
RTX A500 Laptop GPU:
43.8  fps
low 1920x1080
RTX A500 Laptop GPU:
23.6  fps
high 1920x1080
RTX A500 Laptop GPU:
14.5  fps
low 1920x1080
RTX A500 Laptop GPU:
76.7  fps
med. 1920x1080
RTX A500 Laptop GPU:
58.2  fps
high 1920x1080
RTX A500 Laptop GPU:
49.3  fps
ultra 1920x1080
RTX A500 Laptop GPU:
33.3  fps
low 1920x1080
RTX A500 Laptop GPU:
19.5  fps
med. 1920x1080
RTX A500 Laptop GPU:
12.8  fps
high 1920x1080
RTX A500 Laptop GPU:
12  fps
ultra 1920x1080
RTX A500 Laptop GPU:
10.9  fps
low 1920x1080
RTX A500 Laptop GPU:
24.4  fps
med. 1920x1080
RTX A500 Laptop GPU:
18.7  fps
high 1920x1080
RTX A500 Laptop GPU:
14.3  fps
ultra 1920x1080
RTX A500 Laptop GPU:
8.3  fps
low 1920x1080
RTX A500 Laptop GPU:
39.8 43.3 ~ 42 fps
med. 1920x1080
RTX A500 Laptop GPU:
31.1 32.1 ~ 32 fps
high 1920x1080
RTX A500 Laptop GPU:
23.6 25.1 ~ 24 fps
ultra 1920x1080
RTX A500 Laptop GPU:
19.6 20.4 ~ 20 fps
QHD 2560x1440
RTX A500 Laptop GPU:
10.4  fps
4K 3840x2160
RTX A500 Laptop GPU:
4.3  fps
low 1920x1080
RTX A500 Laptop GPU:
39.2 39.9 ~ 40 fps
med. 1920x1080
RTX A500 Laptop GPU:
30.8 34.5 ~ 33 fps
high 1920x1080
RTX A500 Laptop GPU:
26.2 31.2 ~ 29 fps
ultra 1920x1080
RTX A500 Laptop GPU:
25.8 30.2 ~ 28 fps
QHD 2560x1440
RTX A500 Laptop GPU:
17.8  fps
F1 23

F1 23

2023
low 1920x1080
RTX A500 Laptop GPU:
57  fps
med. 1920x1080
RTX A500 Laptop GPU:
56.3  fps
high 1920x1080
RTX A500 Laptop GPU:
43.1  fps
ultra 1920x1080
RTX A500 Laptop GPU:
10.9  fps
QHD 2560x1440
RTX A500 Laptop GPU:
6.6  fps
low 1920x1080
RTX A500 Laptop GPU:
23  fps
med. 1920x1080
RTX A500 Laptop GPU:
19.6  fps
high 1920x1080
RTX A500 Laptop GPU:
10.6  fps
ultra 1920x1080
RTX A500 Laptop GPU:
5.4  fps
F1 22

F1 22

2022
low 1920x1080
RTX A500 Laptop GPU:
92.5  fps
med. 1920x1080
RTX A500 Laptop GPU:
85.2  fps
high 1920x1080
RTX A500 Laptop GPU:
57.8  fps
ultra 1920x1080
RTX A500 Laptop GPU:
16.9  fps
low 1920x1080
RTX A500 Laptop GPU:
66.2  fps
med. 1920x1080
RTX A500 Laptop GPU:
53.5  fps
high 1920x1080
RTX A500 Laptop GPU:
36.2  fps
ultra 1920x1080
RTX A500 Laptop GPU:
27.6  fps
GRID 2019

GRID 2019

2019
low 1280x720
100%
UHD Graphics 615:
17.7  fps
med. 1920x1080
100%
UHD Graphics 615:
6.9  fps
low 1280x720
100%
UHD Graphics 615:
7.3  fps
med. 1920x1080
100%
UHD Graphics 615:
3.1  fps
Control

Control

2019
low 1280x720
100%
UHD Graphics 615:
7.6  fps
med. 1920x1080
100%
UHD Graphics 615:
2.4  fps
F1 2019

F1 2019

2019
low 1280x720
100%
UHD Graphics 615:
12  fps
low 1280x720
100%
UHD Graphics 615:
15.2  fps
Anno 1800

Anno 1800

2019
low 1280x720
100%
UHD Graphics 615:
9.7 15.1 ~ 12 fps
med. 1920x1080
100%
UHD Graphics 615:
5.2  fps
low 1280x720
100%
UHD Graphics 615:
5  fps
low 1280x720
100%
UHD Graphics 615:
19.2  fps
low 1280x720
100%
UHD Graphics 615:
7  fps
low 1280x720
100%
UHD Graphics 615:
6.2  fps
med. 1920x1080
100%
UHD Graphics 615:
3.5  fps
low 1280x720
100%
UHD Graphics 615:
8.8  fps
low 1280x720
100%
UHD Graphics 615:
10.5  fps
low 1280x720
100%
UHD Graphics 615:
15.7  fps
med. 1920x1080
100%
UHD Graphics 615:
5  fps
low 1280x720
100%
UHD Graphics 615:
5.8  fps
low 1280x720
100%
UHD Graphics 615:
42.1  fps
med. 1920x1080
100%
UHD Graphics 615:
15.8  fps
Hitman 2

Hitman 2

2018
low 1280x720
100%
UHD Graphics 615:
7.6  fps
low 1280x720
100%
UHD Graphics 615:
7  fps
low 1280x720
100%
UHD Graphics 615:
13  fps
low 1280x720
100%
UHD Graphics 615:
10  fps
Strange Brigade

Strange Brigade

2018
low 1280x720
RTX A500 Laptop GPU:
168.9 183.5 ~ 176 fps
med. 1920x1080
RTX A500 Laptop GPU:
74.9 76.5 ~ 76 fps
high 1920x1080
RTX A500 Laptop GPU:
61.9 62.5 ~ 62 fps
ultra 1920x1080
RTX A500 Laptop GPU:
53.6 54.5 ~ 54 fps
QHD 2560x1440
RTX A500 Laptop GPU:
39.2  fps
F1 2018

F1 2018

2018
low 1280x720
100%
UHD Graphics 615:
19  fps
med. 1920x1080
100%
UHD Graphics 615:
12  fps
low 1280x720
100%
UHD Graphics 615:
11.5  fps
Far Cry 5

Far Cry 5

2018
low 1280x720
100%
UHD Graphics 615:
6  fps
1367%
RTX A500 Laptop GPU:
81 83 ~ 82 fps
med. 1920x1080
RTX A500 Laptop GPU:
51 57 ~ 54 fps
high 1920x1080
RTX A500 Laptop GPU:
46 50 ~ 48 fps
ultra 1920x1080
RTX A500 Laptop GPU:
44 44 ~ 44 fps
World of Tanks enCore

World of Tanks enCore

2018
low 1366x768
100%
UHD Graphics 615:
95.1  fps
med. 1920x1080
100%
UHD Graphics 615:
11.8  fps
low 1280x720
100%
UHD Graphics 615:
7.8 8.1 10 10.2 19.2 ~ 11 fps
1055%
RTX A500 Laptop GPU:
113.3 117.7 ~ 116 fps
med. 1920x1080
100%
UHD Graphics 615:
6.3 6.5 7.2 8.2 12.5 ~ 8 fps
1175%
RTX A500 Laptop GPU:
89.2 98 ~ 94 fps
high 1920x1080
100%
UHD Graphics 615:
6 6.1 7.7 11.3 ~ 8 fps
975%
RTX A500 Laptop GPU:
73.9 81.6 ~ 78 fps
low 1280x720
100%
UHD Graphics 615:
6.1  fps
1393%
RTX A500 Laptop GPU:
78.6 90.4 ~ 85 fps
med. 1920x1080
100%
UHD Graphics 615:
3.3  fps
1364%
RTX A500 Laptop GPU:
44.2 45.8 ~ 45 fps
high 1920x1080
RTX A500 Laptop GPU:
31.4 32.9 ~ 32 fps
QHD 2560x1440
RTX A500 Laptop GPU:
23.3  fps
Fortnite

Fortnite

2018
low 1280x720
100%
UHD Graphics 615:
15.9  fps
med. 1920x1080
100%
UHD Graphics 615:
8  fps
ELEX

ELEX

2017
low 1280x720
100%
UHD Graphics 615:
9.2  fps
low 1280x720
100%
UHD Graphics 615:
15 17 ~ 16 fps
med. 1920x1080
100%
UHD Graphics 615:
7  fps
low 1280x720
100%
UHD Graphics 615:
51.8  fps
med. 1366x768
100%
UHD Graphics 615:
45.6  fps
high 1920x1080
100%
UHD Graphics 615:
29  fps
low 1280x720
100%
UHD Graphics 615:
33.2 49.1 ~ 41 fps
med. 1920x1080
100%
UHD Graphics 615:
16  fps
high 1920x1080
100%
UHD Graphics 615:
10.3  fps
Prey

Prey

2017
low 1280x720
100%
UHD Graphics 615:
14.1 16.8 ~ 15 fps
med. 1920x1080
100%
UHD Graphics 615:
6.9 8.6 ~ 8 fps
low 1280x720
100%
UHD Graphics 615:
8.1  fps
For Honor

For Honor

2017
low 1280x720
100%
UHD Graphics 615:
16.4  fps
low 1024x768
100%
UHD Graphics 615:
29.5  fps
Overwatch

Overwatch

2016
low 1280x720
100%
UHD Graphics 615:
29.9  fps
med. 1366x768
100%
UHD Graphics 615:
21.6  fps
low 1024x768
100%
UHD Graphics 615:
10.5 10.6 15.2 ~ 12 fps
med. 1366x768
100%
UHD Graphics 615:
6.3 9.9 ~ 8 fps
high 1920x1080
100%
UHD Graphics 615:
5.3  fps
low 1024x768
100%
UHD Graphics 615:
31.3  fps
med. 1366x768
100%
UHD Graphics 615:
19.5  fps
low 1366x768
100%
UHD Graphics 615:
53  fps
med. 1366x768
100%
UHD Graphics 615:
34.6  fps
low 1280x720
100%
UHD Graphics 615:
40.8 49.5 52 52.6 55.3 56.6 57.2 60.1 ~ 53 fps
300%
RTX A500 Laptop GPU:
157.7 160.4 ~ 159 fps
med. 1366x768
100%
UHD Graphics 615:
17.4 17.7 25.9 25.9 26.3 27.3 29.3 32.1 ~ 25 fps
524%
RTX A500 Laptop GPU:
130.5 131.1 ~ 131 fps
high 1920x1080
100%
UHD Graphics 615:
8.5 11.3 12.1 12.9 13.4 13.6 15.2 15.4 ~ 13 fps
800%
RTX A500 Laptop GPU:
96.2 111.9 ~ 104 fps
ultra 1920x1080
100%
UHD Graphics 615:
7.6 10.3 11.3 11.6 11.8 12.3 13.7 ~ 11 fps
891%
RTX A500 Laptop GPU:
91.6 104.8 ~ 98 fps
low 1024x768
100%
UHD Graphics 615:
9.3 9.5 12.1 ~ 10 fps
1550%
RTX A500 Laptop GPU:
134.6 174.5 ~ 155 fps
med. 1366x768
100%
UHD Graphics 615:
5.9  fps
1576%
RTX A500 Laptop GPU:
81.6 104.1 ~ 93 fps
high 1920x1080
RTX A500 Laptop GPU:
53.4 56.8 ~ 55 fps
ultra 1920x1080
RTX A500 Laptop GPU:
26.3 31.1 ~ 29 fps
GTA V

GTA V

2015
low 1024x768
100%
UHD Graphics 615:
16.4  fps
1057%
RTX A500 Laptop GPU:
173.3  fps
med. 1366x768
100%
UHD Graphics 615:
16.9  fps
957%
RTX A500 Laptop GPU:
161.7  fps
high 1920x1080
RTX A500 Laptop GPU:
89.7  fps
ultra 1920x1080
RTX A500 Laptop GPU:
42.9  fps
QHD 2560x1440
RTX A500 Laptop GPU:
29.8  fps
low 1280x720
100%
UHD Graphics 615:
27.8  fps
med. 1344x756
100%
UHD Graphics 615:
16.7  fps
low 1024x768
100%
UHD Graphics 615:
97.4  fps
med. 1366x768
100%
UHD Graphics 615:
34.4  fps
high 1920x1080
100%
UHD Graphics 615:
24.7  fps
low 1024x768
100%
UHD Graphics 615:
25.3 31.3 ~ 28 fps
med. 1366x768
100%
UHD Graphics 615:
18.4 21.2 ~ 20 fps
high 1366x768
100%
UHD Graphics 615:
12.1 16.4 ~ 14 fps
low 1280x720
100%
UHD Graphics 615:
27.5 31.1 38.3 38.8 39.2 41.6 49.1 50.2 ~ 39 fps
med. 1366x768
100%
UHD Graphics 615:
15.8 18.1 19.8 22.4 23.6 25 26.5 28.6 ~ 22 fps
high 1366x768
100%
UHD Graphics 615:
13.3 15.8 17.5 18.1 18.2 20.3 22.5 ~ 18 fps
ultra 1920x1080
100%
UHD Graphics 615:
0 (!) 4.4 5.7 6.1 7 7.6 ~ 5 fps
low 1024x768
100%
UHD Graphics 615:
51.2 59.9 ~ 56 fps
med. 1366x768
100%
UHD Graphics 615:
25.7 31.4 ~ 29 fps
high 1366x768
100%
UHD Graphics 615:
16.9 21.2 ~ 19 fps
ultra 1920x1080
100%
UHD Graphics 615:
7.9  fps
low 1024x768
100%
UHD Graphics 615:
100.2  fps
med. 1366x768
100%
UHD Graphics 615:
61.4  fps
high 1366x768
100%
UHD Graphics 615:
36  fps
low 1024x768
100%
UHD Graphics 615:
54.7  fps
med. 1366x768
100%
UHD Graphics 615:
37.5  fps
high 1366x768
100%
UHD Graphics 615:
33.9  fps
ultra 1920x1080
100%
UHD Graphics 615:
19.4  fps
low 1280x720
100%
UHD Graphics 615:
41.7  fps
med. 1366x768
100%
UHD Graphics 615:
23.3  fps
low 1024x768
100%
UHD Graphics 615:
58  fps
high 1366x768
100%
UHD Graphics 615:
39.6  fps
ultra 1920x1080
100%
UHD Graphics 615:
16  fps
low 1024x768
100%
UHD Graphics 615:
144.1  fps
med. 1360x768
100%
UHD Graphics 615:
36.3  fps
high 1360x768
100%
UHD Graphics 615:
23.5  fps

Average Gaming Intel UHD Graphics 615 → 100%

Average Gaming 30-70 fps → 100%

Average Gaming NVIDIA RTX A500 Laptop GPU → 1070%

Average Gaming 30-70 fps → 1364%

Intel UHD Graphics 615NVIDIA RTX A500 Laptop GPUIntel HD Graphics P630
lowmed.highultraQHD4Klowmed.highultraQHD4Klowmed.highultraQHD4K
F1 2482.471.932.911.7
Ghost of Tsushima34.627.519.114.1
Alone in the Dark80.168.658.643.8
Dragon's Dogma 223.614.5
Last Epoch76.758.249.333.3
Helldivers 219.512.81210.9
Enshrouded24.418.714.38.28
Cyberpunk 2077 2.2 Phantom Liberty4232242010.44.29
Baldur's Gate 34033292817.8
F1 235756.343.110.96.63
Hogwarts Legacy2319.610.65.43
F1 2292.585.257.816.9
Tiny Tina's Wonderlands66.253.536.227.6
Strange Brigade17676625439.2
Far Cry 5682544844
X-Plane 11.1111881169478
Final Fantasy XV Benchmark6.13.385453223.3
Dota 2 Reborn5325131115913110498
The Witcher 3105.9155935529
GTA V16.416.9173.3161.789.742.929.8
Intel UHD Graphics 615NVIDIA RTX A500 Laptop GPUIntel HD Graphics P630
lowmed.highultraQHD4Klowmed.highultraQHD4Klowmed.highultraQHD4K
< 30 fps
< 60 fps
< 120 fps
≥ 120 fps
5
1

5


2


1


< 30 fps
< 60 fps
< 120 fps
≥ 120 fps
4
4
8
4
4
7
6
2
7
9
4
11
5
1
5
1

1


< 30 fps
< 60 fps
< 120 fps
≥ 120 fps


For more games that might be playable and a list of all games and graphics cards visit our Gaming List

v1.33
log 11. 13:30:17

#0 ran 0s before starting gpusingle class +0s ... 0s

#1 checking url part for id 8832 +0s ... 0s

#2 checking url part for id 11322 +0s ... 0s

#3 checking url part for id 7657 +0s ... 0s

#4 redirected to Ajax server, took 1757590217s time from redirect:0 +0s ... 0s

#5 did not recreate cache, as it is less than 5 days old! Created at Wed, 10 Sep 2025 11:38:50 +0200 +0s ... 0s

#6 composed specs +0.036s ... 0.036s

#7 did output specs +0s ... 0.036s

#8 start showIntegratedCPUs +0s ... 0.036s

#9 getting avg benchmarks for device 8832 +0.025s ... 0.061s

#10 got single benchmarks 8832 +0.019s ... 0.079s

#11 getting avg benchmarks for device 11322 +0.004s ... 0.083s

#12 got single benchmarks 11322 +0.008s ... 0.091s

#13 getting avg benchmarks for device 7657 +0s ... 0.092s

#14 got single benchmarks 7657 +0.003s ... 0.094s

#15 got avg benchmarks for devices +0s ... 0.094s

#16 min, max, avg, median took s +0.05s ... 0.145s

#17 before gaming benchmark output +0s ... 0.145s

#18 Got 293 rows for game benchmarks. +0.02s ... 0.165s

#19 composed SQL query for gamebenchmarks +0s ... 0.165s

#20 got data and put it in $dataArray +0.006s ... 0.172s

#21 benchmarks composed for output. +0.021s ... 0.193s

#22 calculated avg scores. +0s ... 0.193s

#23 return log +0.001s ... 0.193s

Please share our article, every link counts!
Mail Logo
> Expert Reviews and News on Laptops, Smartphones and Tech Innovations > Benchmarks / Tech > Graphics Card Comparison - Head 2 Head
Redaktion, 2017-09- 8 (Update: 2023-07- 1)