AMD Radeon R5 (Stoney Ridge) vs Intel Iris Plus Graphics 650 vs Intel UHD Graphics 615
AMD Radeon R5 (Stoney Ridge) ► remove from comparison
The AMD Radeon R5 (Stoney Ridge) is an integrated graphics adapter of the weaker mobile dual-core Stoney Ridge APUs. At its launch, it is being used in the AMD A9-9410 and has 3 active Compute Cores (384 shaders). Depending on the model, the maximum clock is 800 MHz. The performance can vary heavily depending on the configured TDP and the system memory. Compared to the Radeon R5 from the Bristol Ridge series, it only has 3 instead of 6 GCN cores (and is the full configuration of the Stoney Ridge chip).
Architecture and Features
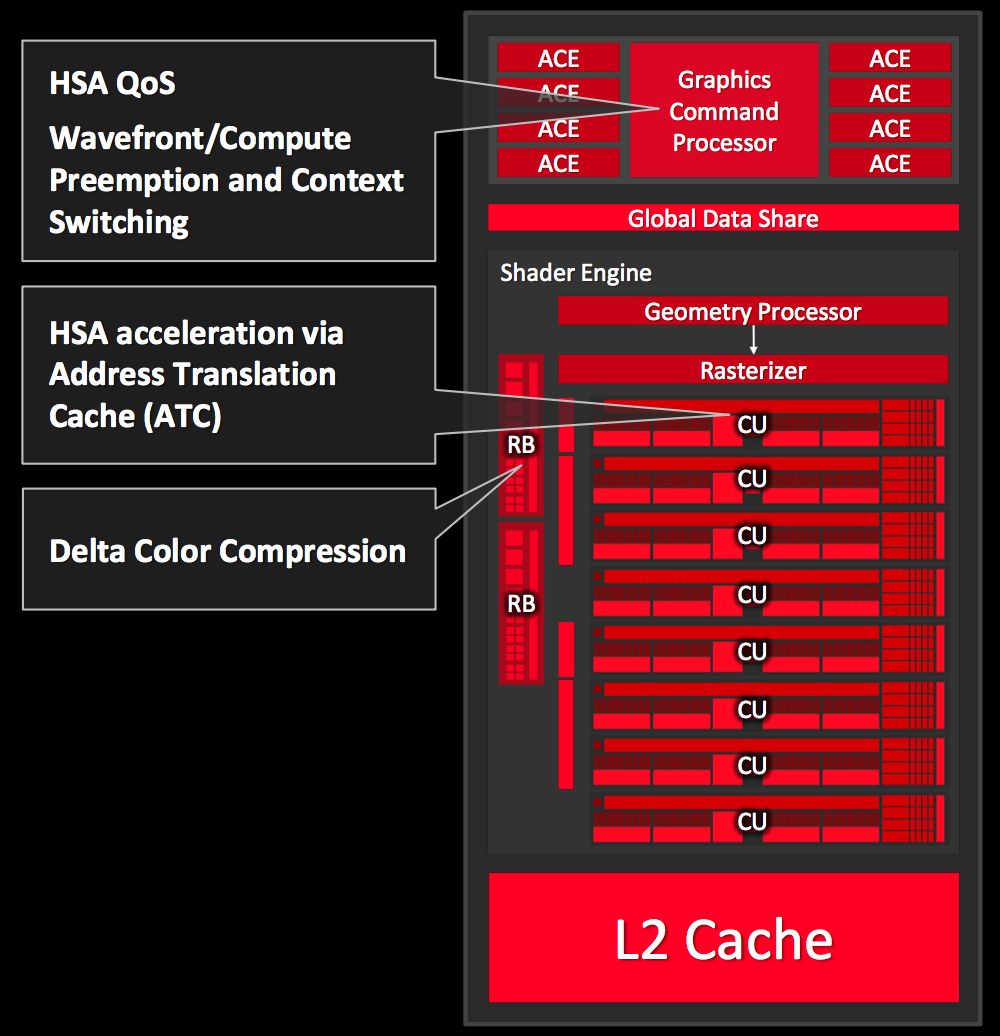
The Radeon R5 is equipped with three cores from the third GCN generation (often called GCN 1.2 or 2.0 by the press). This means it is very similar to the Tonga desktop chip and supports DirectX 12 (FL 12_0), but the graphics cores can also be accessed via Mantle, OpenGL, and OpenCL. The GPU supports the HSA 1.0 standard as well and can therefore use the connection with the CPU cores very efficiently. The technical specifications are identical to the Carrizo predecessor.
The video unit includes the UVD 6 (Unified Video Decoder), which can decode HEVC/H.265 and 4K with support from the hardware. More details are available in our dedicated Stoney Ridge article .
Power Consumption
Depending on the model and configured TDP (cTDP), the 28 nm chip is specified with 10 up to 25 Watts. This means it can also be used for thin and light notebooks.
Intel Iris Plus Graphics 650 ► remove from comparison
The Intel Iris Plus Graphics 650 (GT3e) is a processor graphics card for Kaby Lake models announced in January 2017. As the successor to the Intel Iris Graphics 550 (Skylake), the Iris Plus Graphics 650 is used for 28-Watt models and is equipped with 64 MB eDRAM cache. There should not be any big changes compared to the Iris Graphics 550.
The so called GT3e version of the Kaby Lake GPU probably still has 48 Execution Units (EUs), which can reach up to 1100 MHz depending on the model. Besides eDRAM cache, the Iris 650 can also access the system memory (2x 64 Bit DDR3L-1600/DDR4-2400) via processor interface.
Compared to the Iris Plus 640 from the 15-Watt models, the Iris 650 only has a slightly higher maximum clock as well as almost twice the TDP, which allows a better utilization of the Turbo Boost potential.
Performance
The exact performance of the Iris Plus Graphics 650 depends on the CPU model, because maximum clock as well as the size of the L3 cache can differ a bit. The system memory (DDR3/DDR4) will influence the performance as well.
The fastest chips are high-clocked Core i7 models like the Core i7-7567U . Depending on the game, the Iris Plus 650 will probably be on par with a dedicated GeForce 930M and can handle smooth gameplay in modern titles in low up to medium settings.
Features
The reworked video engine now fully supports hardware decoding of H.265/HEVC videos. Contrary to Skylake, however, Kaby Lake can now also decode H.265/HEVC Main 10 with a 10-bit color depth as well as Google's VP9 codec. The video output is possible via DP 1.2/eDP 1.3 (up to 3840 x 2160 @60 Hz), whereas HDMI is also supported in the older 1.4a standard. An HDMI 2.0 output can be added via converter from DisplayPort. The GPU can drive up to three displays simultaneously.
Power Consumption
The Iris Plus Graphics 650 is used for 28-Watt processor and therefore medium-sized notebooks.
Intel UHD Graphics 615 ► remove from comparison
The Intel UHD Graphics 615 (GT2) is a low-end integrated graphics unit, which can be found in the Y-series of the Amber-Lake generation. This "GT2" version offers 24 Execution Units (EUs) clocked at up to 1000 MHz (depending on the CPU model). Due to its lack of dedicated graphics memory or eDRAM cache, the UHD 615 has to access the main memory (2x 64bit DDR3L/LPDDR3). Compared to the old HD Graphics 615 in Kaby-Lake-Y CPUs , the UHD 615 is the same GPU with slightly different clock speeds (depending on the model) and slight power/performance improvements due to the improved 14nm++ process .
Performance
The 3D performance of the UHD 615 depends on the CPU model and the cooling / TDP-setting of the laptop. Furthermore, the used main memory (single channel, DDR3(L), amount) is influencing performance. On average the UHD graphics 615 should be very similar to the Kaby-Lake HD Graphics 615 due to the same architecture and similar speeds. That means that only low demanding games like Farming Simulator 17 or Rocket League are playable in lowest detail settings.
Features
The revised video engine in the HD 615 and UHD 615 now supports H.265/HEVC Main10 profile in hardware with 10 bit colors. Furthermore, Googles VP9 codec can also be hardware decoded. The UHD 615 should support HDCP 2.2 and therefore Netflix 4K. HDMI 2.0 however is still only supported with an external converter chip (LSPCon).
Power Consumption
The UHD Graphics 615 can be found in Y processors with 5 W TDP (can be manipulated by the laptop manufacturers, and up 0,5 Watt from the previous generation) and is therefore suited for very thin, mostly passively cooled 2-in-1 notebooks and tablets.
AMD Radeon R5 (Stoney Ridge) Intel Iris Plus Graphics 650 Intel UHD Graphics 615 Gen. 9.5 Series Codename Stoney Ridge Kaby Lake GT3e Kaby-Lake GT2 Architecture GCN 1.2/2.0 Gen. 9.5 Kaby Lake Gen. 9 Amber Lake Pipelines 192 - unified 48 - unified 24 - unified Core Speed 800 (Boost) MHz 300 - 1100 (Boost) MHz 300 - 1000 (Boost) MHz Memory Bus Width 64 Bit 64/128 Bit 64/128 Bit Shared Memory yes yes yes API DirectX 12 (FL 12_0), OpenGL 4.4 DirectX 12_1, OpenGL 4.4 DirectX 12_1, OpenGL 4.4 Power Consumption 12-45 Watt 5 Watt technology 28 nm 14 nm 14 nm Features UVD 6, VCE QuickSync QuickSync Notebook Size medium sized Date of Announcement 01.06.2016 03.01.2017 30.08.2018 Memory Type DDR4 DDR3L/LPDDR3
CPU in Radeon R5 (Stoney Ridge) GPU Base Speed GPU Boost / Turbo AMD A9-9425 2 x 3100 MHz, 15 W ? MHz 900 MHz AMD A9-9420e 2 x ? MHz ? MHz ? MHz AMD A9-9420 2 x 3000 MHz, 10-25 W ? MHz 800 MHz » show 2 more AMD A9-9410 2 x 2900 MHz, 10-25 W ? MHz 800 MHz AMD A6-9220C 2 x 1800 MHz, 6 W ? MHz 720 MHz min. - max. ? MHz 720 - 900 MHz
CPU in Iris Plus Graphics 650 GPU Base Speed GPU Boost / Turbo Intel Core i7-7567U 2 x 3500 MHz, 28 W 300 MHz 1100 MHz Intel Core i5-7287U 2 x 3300 MHz, 28 W 300 MHz 1100 MHz Intel Core i5-7267U 2 x 3100 MHz, 28 W 300 MHz 1050 MHz Intel Core i3-7167U 2 x 2800 MHz, 28 W 300 MHz 1000 MHz min. - max. 300 - ? MHz 720 - 1100 MHz
CPU in UHD Graphics 615 GPU Base Speed GPU Boost / Turbo Intel Core i5-10310Y 4 x 1100 MHz, 7 W 300 MHz 1050 MHz Intel Core i5-10210Y 4 x 1000 MHz, 7 W 300 MHz 1050 MHz Intel Core i7-8500Y 2 x 1500 MHz, 5 W 300 MHz 1000 MHz » show 6 more Intel Core i3-10110Y 2 x 1000 MHz, 7 W 300 MHz 1000 MHz Intel Core i5-8200Y 2 x 1300 MHz, 5 W 300 MHz 950 MHz Intel Core i3-10100Y 2 x 1300 MHz, 5 W 300 MHz 1000 MHz Intel Core m3-8100Y 2 x 1100 MHz, 5 W 300 MHz 950 MHz Intel Pentium Gold 6500Y 2 x 1100 MHz, 5 W 300 MHz 900 MHz Intel Pentium Gold 4425Y 2 x 1700 MHz, 6 W 300 MHz 850 MHz min. - max. 300 - ? MHz 720 - 1100 MHz
Benchmarks Performance Rating - 3DMark 11 + Fire Strike + Time Spy - Radeon R5 (Stoney Ridge)
0.4 pt (1%)
...
AMD Radeon R5 (Stoney Ridge)
...
max:
Performance Rating - 3DMark 11 + Fire Strike + Time Spy - UHD Graphics 615
0.4 pt (1%)
...
...
max:
3DMark - 3DMark Time Spy Score
min: 274 avg: 281.5 median: 281.5 (1%) max: 289 Points
623 Points (2%)
min: 232 avg: 277.2 median: 275 (1%) max: 328 Points
3DMark - 3DMark Time Spy Graphics
min: 247 avg: 254.5 median: 254.5 (1%) max: 262 Points
555 Points (1%)
min: 205 avg: 244.7 median: 242.5 (1%) max: 289 Points
3DMark - 3DMark Ice Storm Unlimited Graphics
min: 46978 avg: 50907 median: 51382 (6%) max: 54361 Points
161538 Points (18%)
min: 50702 avg: 60159 median: 57024 (6%) max: 73265 Points
3DMark - 3DMark Ice Storm Extreme Graphics
min: 32172 avg: 33058 median: 33057.5 (4%) max: 33943 Points
min: 23099 avg: 26792 median: 25456 (3%) max: 35452 Points
3DMark - 3DMark Cloud Gate Score
min: 2673 avg: 2893 median: 2995 (3%) max: 3010 Points
min: 8403 avg: 9150 median: 9149.5 (10%) max: 9896 Points
min: 3490 avg: 4533 median: 4423 (5%) max: 5622 Points
3DMark - 3DMark Cloud Gate Graphics
min: 3661 avg: 4439 median: 4755 (1%) max: 4902 Points
13153 Points (3%)
min: 4521 avg: 6316 median: 6583 (2%) max: 7568 Points
3DMark - 3DMark Fire Strike Standard Score
min: 596 avg: 688 median: 712 (1%) max: 757 Points
min: 1586 avg: 1655 median: 1655 (3%) max: 1724 Points
min: 509 avg: 730 median: 738 (1%) max: 881 Points
3DMark - 3DMark Fire Strike Standard Graphics
min: 642 avg: 765 median: 772 (1%) max: 881 Points
1698 Points (2%)
min: 563 avg: 816 median: 819 (1%) max: 976 Points
3DMark - 3DMark Ice Storm Graphics
min: 49964 avg: 51392 median: 51392 (6%) max: 52820 Points
min: 34728 avg: 42945 median: 42909 (5%) max: 53693 Points
3DMark - 3DMark Wild Life Unlimited
1911 Points (1%)
3DMark - 3DMark Wild Life Extreme Unlimited
530 Points (1%)
3DMark - 3DMark Night Raid
min: 2535 avg: 2962 median: 2975 (3%) max: 3376 Points
3DMark - 3DMark Night Raid Graphics Score
min: 2887 avg: 3543 median: 3810 (1%) max: 3933 Points
3DMark 11 - 3DM11 Performance Score
min: 1103 avg: 1254 median: 1263 (2%) max: 1387 Points
2924 Points (4%)
min: 893 avg: 1271 median: 1312.5 (2%) max: 1504 Points
3DMark 11 - 3DM11 Performance GPU
min: 1096 avg: 1245 median: 1264 (1%) max: 1356 Points
2762 Points (2%)
min: 821 avg: 1175 median: 1221 (1%) max: 1378 Points
3DMark Vantage + AMD Radeon R5 (Stoney Ridge) 3DMark Vantage - 3DM Vant. Perf. total
3346 Points (1%)
3DM Vant. Perf. total + Intel UHD Graphics 615
3813 Points (1%)
3DM Vant. Perf. GPU no PhysX + AMD Radeon R5 (Stoney Ridge) 3DMark Vantage - 3DM Vant. Perf. GPU no PhysX
3044 Points (2%)
3DM Vant. Perf. GPU no PhysX + Intel UHD Graphics 615
3240 Points (2%)
3DMark 06 3DMark 06 - Standard 1280x1024 + AMD Radeon R5 (Stoney Ridge)
min: 5141 avg: 5174 median: 5174 (7%) max: 5207 Points
3DMark 06 - Standard 1280x1024 + Intel Iris Plus Graphics 650
15175 Points (20%)
3DMark 06 - Standard 1280x1024 + Intel UHD Graphics 615
min: 6386 avg: 6602 median: 6601.5 (9%) max: 6817 Points
Unigine Heaven 3.0 - Unigine Heaven 3.0 DX 11
13.7 fps (5%)
Unigine Heaven 3.0 - Unigine Heaven 3.0 OpenGL
10.5 fps (5%)
Unigine Heaven 2.1 - Heaven 2.1 high
10.8 fps (2%)
Cinebench R10 Cinebench R10 Shading (32bit) + AMD Radeon R5 (Stoney Ridge) Cinebench R10 - Cinebench R10 Shading (32bit)
min: 2752 avg: 3847 median: 3773 (3%) max: 5088 Points
Cinebench R10 Shading (32bit) + Intel Iris Plus Graphics 650
8773 Points (6%)
Cinebench R10 Shading (32bit) + Intel UHD Graphics 615
min: 4302 avg: 6351 median: 6378 (5%) max: 8347 Points
Cinebench R11.5 Cinebench R11.5 OpenGL 64 Bit + AMD Radeon R5 (Stoney Ridge) Cinebench R11.5 - Cinebench R11.5 OpenGL 64 Bit
min: 16.4 avg: 17.8 median: 16.6 (6%) max: 20.39 fps
Cinebench R11.5 OpenGL 64 Bit + Intel Iris Plus Graphics 650
45.2 fps (16%)
Cinebench R11.5 OpenGL 64 Bit + Intel UHD Graphics 615
min: 19.94 avg: 24.9 median: 25.6 (9%) max: 28.49 fps
Cinebench R15 + AMD Radeon R5 (Stoney Ridge) Cinebench R15 - Cinebench R15 OpenGL 64 Bit
min: 19.66 avg: 22.3 median: 23 (1%) max: 23.42 fps
Cinebench R15 OpenGL 64 Bit + Intel Iris Plus Graphics 650
min: 41.21 avg: 59.1 median: 59.1 (3%) max: 77 fps
Cinebench R15 OpenGL 64 Bit + Intel UHD Graphics 615
min: 22.54 avg: 32.9 median: 35.2 (2%) max: 44.49 fps
Cinebench R15 OpenGL Ref. Match 64 Bit + AMD Radeon R5 (Stoney Ridge) Cinebench R15 - Cinebench R15 OpenGL Ref. Match 64 Bit
98 % (98%)
Cinebench R15 OpenGL Ref. Match 64 Bit + Intel Iris Plus Graphics 650
99.3 % (99%)
Cinebench R15 OpenGL Ref. Match 64 Bit + Intel UHD Graphics 615
97.8 % (98%)
GFXBench - GFXBench 5.0 Aztec Ruins High Tier Offscreen
min: 6.5 avg: 7.1 median: 7.1 (1%) max: 7.6 fps
GFXBench - GFXBench 5.0 Aztec Ruins Normal Tier Offscreen
min: 16 avg: 18.1 median: 18.1 (1%) max: 20.2 fps
GFXBench - GFXBench Car Chase Offscreen
15.6 fps (2%)
min: 15 avg: 17.7 median: 17.3 (2%) max: 20.9 fps
GFXBench 3.1 - GFXBench Manhattan ES 3.1 Offscreen
20.4 fps (0%)
min: 22 avg: 24.7 median: 24.4 (1%) max: 27.7 fps
GFXBench 3.0 - GFXBench 3.0 Manhattan Offscreen
21.8 fps (1%)
min: 32 avg: 36.6 median: 36.8 (2%) max: 40.9 fps
GFXBench (DX / GLBenchmark) 2.7 + AMD Radeon R5 (Stoney Ridge) GFXBench (DX / GLBenchmark) 2.7 - GFXBench T-Rex HD Offscreen C24Z16
67.8 fps (1%)
GFXBench T-Rex HD Offscreen C24Z16 + Intel UHD Graphics 615
min: 65 avg: 74.2 median: 69.6 (1%) max: 88 fps
Geekbench 6.2 - Geekbench 6.2 GPU OpenCL
3272 Points (1%)
Geekbench 6.2 - Geekbench 6.2 GPU Vulkan
4154 Points (1%)
LuxMark v2.0 64Bit - LuxMark v2.0 Room GPU
92 Samples/s (0%)
336 Samples/s (2%)
198 Samples/s (1%)
LuxMark v2.0 64Bit - LuxMark v2.0 Sala GPU
124 Samples/s (0%)
813 Samples/s (1%)
473 Samples/s (1%)
ComputeMark v2.1 - ComputeMark v2.1 Result
min: 458 avg: 597 median: 597 (1%) max: 736 Points
1730 Points (2%)
860 Points (1%)
Power Consumption - Furmark Stress Test Power Consumption - external Monitor *
51.4 Watt (7%)
21 Watt (3%)
Power Consumption - The Witcher 3 Power Consumption - external Monitor *
51.4 Watt (7%)
Emissions Witcher 3 Fan Noise + Intel Iris Plus Graphics 650 Emissions - Witcher 3 Fan Noise
39.1 dB(A) (63%)
Clock Speed - GPU Clock Witcher 3 ultra
998 MHz (39%)
Clock Speed - GPU Clock Speed Furmark
848 MHz (34%)
Average Benchmarks AMD Radeon R5 (Stoney Ridge) → 100% n=17 Average Benchmarks Intel Iris Plus Graphics 650 → 277% n=17 Average Benchmarks Intel UHD Graphics 615 → 144% n=17
- Range of benchmark values for this graphics card
- Average benchmark values for this graphics card
* Smaller numbers mean a higher performance
1 This benchmark is not used for the average calculation
Game Benchmarks The following benchmarks stem from our benchmarks of review laptops. The performance depends on the used graphics memory, clock rate, processor, system settings, drivers, and operating systems. So the results don't have to be representative for all laptops with this GPU. For detailed information on the benchmark results, click on the fps number.
UHD Graphics 615:
17.7 fps
UHD Graphics 615:
15.2 fps
100%
Radeon R5 (Stoney Ridge):
30.9 fps
62%
UHD Graphics 615:
19.2 fps
100%
Radeon R5 (Stoney Ridge):
9.9 fps
100%
Radeon R5 (Stoney Ridge):
6 fps
117%
UHD Graphics 615:
7 [X] HP Spectre Folio 13-ak0020ng Intel Core i7-8500Y 1.5GHz
UHD Graphics 615
fps
100%
Radeon R5 (Stoney Ridge):
2 fps
100%
Radeon R5 (Stoney Ridge):
8.4 fps
74%
UHD Graphics 615:
6.2 fps
100%
Radeon R5 (Stoney Ridge):
4.3 fps
81%
UHD Graphics 615:
3.5 fps
100%
Radeon R5 (Stoney Ridge):
15.4 fps
57%
UHD Graphics 615:
8.8 fps
100%
Radeon R5 (Stoney Ridge):
7 fps
100%
Radeon R5 (Stoney Ridge):
12.3 fps
85%
UHD Graphics 615:
10.5 [X] HP Spectre Folio 13-ak0020ng Intel Core i7-8500Y 1.5GHz
UHD Graphics 615
fps
100%
Radeon R5 (Stoney Ridge):
7 fps
100%
Radeon R5 (Stoney Ridge):
22.5 fps
70%
UHD Graphics 615:
15.7 [X] HP Spectre Folio 13-ak0020ng Intel Core i7-8500Y 1.5GHz
UHD Graphics 615
fps
100%
Radeon R5 (Stoney Ridge):
11.8 fps
42%
UHD Graphics 615:
5 [X] HP Spectre Folio 13-ak0020ng Intel Core i7-8500Y 1.5GHz
UHD Graphics 615
fps
100%
Radeon R5 (Stoney Ridge):
39 fps
108%
UHD Graphics 615:
42.1 [X] HP Spectre Folio 13-ak0020ng Intel Core i7-8500Y 1.5GHz
UHD Graphics 615
fps
100%
Radeon R5 (Stoney Ridge):
14 fps
113%
UHD Graphics 615:
15.8 [X] HP Spectre Folio 13-ak0020ng Intel Core i7-8500Y 1.5GHz
UHD Graphics 615
fps
100%
Radeon R5 (Stoney Ridge):
7.4 fps
103%
UHD Graphics 615:
7.6 [X] HP Spectre Folio 13-ak0020ng Intel Core i7-8500Y 1.5GHz
UHD Graphics 615
fps
100%
Radeon R5 (Stoney Ridge):
3.5 fps
100%
Radeon R5 (Stoney Ridge):
10 fps
70%
UHD Graphics 615:
7 [X] HP Spectre Folio 13-ak0020ng Intel Core i7-8500Y 1.5GHz
UHD Graphics 615
fps
100%
Radeon R5 (Stoney Ridge):
4 fps
100%
Radeon R5 (Stoney Ridge):
13 fps
100%
UHD Graphics 615:
13 [X] HP Spectre Folio 13-ak0020ng Intel Core i7-8500Y 1.5GHz
UHD Graphics 615
fps
100%
Radeon R5 (Stoney Ridge):
5 fps
100%
Radeon R5 (Stoney Ridge):
13 fps
77%
UHD Graphics 615:
10 [X] HP Spectre Folio 13-ak0020ng Intel Core i7-8500Y 1.5GHz
UHD Graphics 615
fps
100%
Radeon R5 (Stoney Ridge):
4 fps
100%
Radeon R5 (Stoney Ridge):
12 fps
158%
UHD Graphics 615:
19 [X] HP Spectre Folio 13-ak0020ng Intel Core i7-8500Y 1.5GHz
UHD Graphics 615
fps
100%
Radeon R5 (Stoney Ridge):
12 fps
100%
UHD Graphics 615:
12 [X] HP Spectre Folio 13-ak0020ng Intel Core i7-8500Y 1.5GHz
UHD Graphics 615
fps
100%
Radeon R5 (Stoney Ridge):
4 fps
288%
UHD Graphics 615:
11.5 [X] HP Spectre Folio 13-ak0020ng Intel Core i7-8500Y 1.5GHz
UHD Graphics 615
fps
100%
Radeon R5 (Stoney Ridge):
1 fps
100%
Radeon R5 (Stoney Ridge):
4 fps
150%
UHD Graphics 615:
6 fps
100%
Radeon R5 (Stoney Ridge):
1 fps
UHD Graphics 615:
95.1 fps
UHD Graphics 615:
11.8 fps
100%
Radeon R5 (Stoney Ridge):
13.7 fps
80%
UHD Graphics 615:
7.8 [X] Microsoft Surface Go 2 Pentium Gold 4425Y Intel Pentium Gold 4425Y 1.7GHz
UHD Graphics 615
8.1 10 10.2 19.2 ~ 11 fps
100%
Radeon R5 (Stoney Ridge):
9.4 fps
85%
UHD Graphics 615:
6.3 6.5 [X] Microsoft Surface Go 2 Pentium Gold 4425Y Intel Pentium Gold 4425Y 1.7GHz
UHD Graphics 615
7.2 8.2 12.5 ~ 8 fps
UHD Graphics 615:
6 [X] Microsoft Surface Go 2 Pentium Gold 4425Y Intel Pentium Gold 4425Y 1.7GHz
UHD Graphics 615
6.1 7.7 11.3 ~ 8 fps
100%
Radeon R5 (Stoney Ridge):
7.5 fps
100%
Radeon R5 (Stoney Ridge):
3 fps
100%
Radeon R5 (Stoney Ridge):
8.1 fps
75%
UHD Graphics 615:
6.1 fps
100%
Radeon R5 (Stoney Ridge):
4.3 fps
77%
UHD Graphics 615:
3.3 fps
100%
Radeon R5 (Stoney Ridge):
28 fps
57%
UHD Graphics 615:
15.9 fps
100%
Radeon R5 (Stoney Ridge):
7 fps
114%
UHD Graphics 615:
8 fps
100%
Radeon R5 (Stoney Ridge):
10 fps
100%
Radeon R5 (Stoney Ridge):
6 fps
153%
UHD Graphics 615:
9.2 [X] HP Spectre Folio 13-ak0020ng Intel Core i7-8500Y 1.5GHz
UHD Graphics 615
fps
100%
Radeon R5 (Stoney Ridge):
6 fps
100%
Radeon R5 (Stoney Ridge):
8 fps
200%
UHD Graphics 615:
15 17 [X] HP Spectre Folio 13-ak0020ng Intel Core i7-8500Y 1.5GHz
UHD Graphics 615
~ 16 fps
100%
Radeon R5 (Stoney Ridge):
42.6 fps
100%
Radeon R5 (Stoney Ridge):
19.4 fps
100%
Radeon R5 (Stoney Ridge):
15 fps
100%
Radeon R5 (Stoney Ridge):
6.2 fps
100%
Radeon R5 (Stoney Ridge):
18 fps
100%
Radeon R5 (Stoney Ridge):
13 fps
100%
Radeon R5 (Stoney Ridge):
10 fps
100%
Radeon R5 (Stoney Ridge):
12.1 fps
100%
Radeon R5 (Stoney Ridge):
35.2 fps
147%
UHD Graphics 615:
51.8 [X] HP Spectre Folio 13-ak0020ng Intel Core i7-8500Y 1.5GHz
UHD Graphics 615
fps
100%
Radeon R5 (Stoney Ridge):
32.8 fps
139%
UHD Graphics 615:
45.6 [X] HP Spectre Folio 13-ak0020ng Intel Core i7-8500Y 1.5GHz
UHD Graphics 615
fps
UHD Graphics 615:
29 [X] HP Spectre Folio 13-ak0020ng Intel Core i7-8500Y 1.5GHz
UHD Graphics 615
fps
100%
Radeon R5 (Stoney Ridge):
32.8 fps
195%
Iris Plus Graphics 650:
64 fps
Iris Plus Graphics 650:
21.3 fps
Iris Plus Graphics 650:
14.2 fps
100%
Radeon R5 (Stoney Ridge):
41.4 47.8 ~ 45 fps
251%
Iris Plus Graphics 650:
113 fps
91%
UHD Graphics 615:
33.2 49.1 [X] HP Spectre Folio 13-ak0020ng Intel Core i7-8500Y 1.5GHz
UHD Graphics 615
~ 41 fps
100%
Radeon R5 (Stoney Ridge):
19.9 25.6 ~ 23 fps
247%
Iris Plus Graphics 650:
56.8 fps
70%
UHD Graphics 615:
16 fps
100%
Radeon R5 (Stoney Ridge):
16.3 fps
239%
Iris Plus Graphics 650:
38.9 fps
63%
UHD Graphics 615:
10.3 fps
100%
Radeon R5 (Stoney Ridge):
21.5 fps
239%
Iris Plus Graphics 650:
51.4 fps
70%
UHD Graphics 615:
14.1 16.8 [X] HP Spectre Folio 13-ak0020ng Intel Core i7-8500Y 1.5GHz
UHD Graphics 615
~ 15 fps
Iris Plus Graphics 650:
20.2 fps
UHD Graphics 615:
6.9 8.6 [X] HP Spectre Folio 13-ak0020ng Intel Core i7-8500Y 1.5GHz
UHD Graphics 615
~ 8 fps
100%
Radeon R5 (Stoney Ridge):
12.2 fps
211%
Iris Plus Graphics 650:
25.8 fps
Iris Plus Graphics 650:
10.5 fps
100%
Radeon R5 (Stoney Ridge):
10.9 fps
161%
Iris Plus Graphics 650:
17.6 fps
74%
UHD Graphics 615:
8.1 [X] HP Spectre Folio 13-ak0020ng Intel Core i7-8500Y 1.5GHz
UHD Graphics 615
fps
100%
Radeon R5 (Stoney Ridge):
5.2 fps
100%
Radeon R5 (Stoney Ridge):
19.9 fps
199%
Iris Plus Graphics 650:
39.7 fps
82%
UHD Graphics 615:
16.4 [X] HP Spectre Folio 13-ak0020ng Intel Core i7-8500Y 1.5GHz
UHD Graphics 615
fps
100%
Radeon R5 (Stoney Ridge):
7.3 fps
208%
Iris Plus Graphics 650:
15.2 fps
100%
Radeon R5 (Stoney Ridge):
28.6 fps
100%
Radeon R5 (Stoney Ridge):
13.2 fps
Iris Plus Graphics 650:
15 fps
Iris Plus Graphics 650:
32.4 fps
Iris Plus Graphics 650:
54.1 fps
Iris Plus Graphics 650:
37.9 fps
100%
Radeon R5 (Stoney Ridge):
53.4 fps
100%
Radeon R5 (Stoney Ridge):
36.1 fps
Iris Plus Graphics 650:
36.8 fps
Iris Plus Graphics 650:
19.9 fps
Iris Plus Graphics 650:
46.1 fps
Iris Plus Graphics 650:
29.5 fps
100%
Radeon R5 (Stoney Ridge):
29.4 fps
144%
Iris Plus Graphics 650:
42.2 fps
100%
UHD Graphics 615:
29.5 [X] HP Spectre Folio 13-ak0020ng Intel Core i7-8500Y 1.5GHz
UHD Graphics 615
fps
100%
Radeon R5 (Stoney Ridge):
12.1 fps
167%
Iris Plus Graphics 650:
20.2 fps
Iris Plus Graphics 650:
19.2 fps
Iris Plus Graphics 650:
14.6 fps
Iris Plus Graphics 650:
8.2 fps
100%
Radeon R5 (Stoney Ridge):
30.4 fps
261%
Iris Plus Graphics 650:
79.2 fps
98%
UHD Graphics 615:
29.9 [X] HP Spectre Folio 13-ak0020ng Intel Core i7-8500Y 1.5GHz
UHD Graphics 615
fps
100%
Radeon R5 (Stoney Ridge):
24.6 fps
233%
Iris Plus Graphics 650:
57.4 fps
88%
UHD Graphics 615:
21.6 [X] HP Spectre Folio 13-ak0020ng Intel Core i7-8500Y 1.5GHz
UHD Graphics 615
fps
Iris Plus Graphics 650:
25.6 fps
Iris Plus Graphics 650:
21.4 fps
100%
Radeon R5 (Stoney Ridge):
7 fps
100%
Radeon R5 (Stoney Ridge):
4 fps
100%
Radeon R5 (Stoney Ridge):
2 fps
100%
Radeon R5 (Stoney Ridge):
18.2 fps
165%
Iris Plus Graphics 650:
30 fps
100%
Radeon R5 (Stoney Ridge):
11.3 fps
Iris Plus Graphics 650:
32 fps
Iris Plus Graphics 650:
15 fps
100%
Radeon R5 (Stoney Ridge):
14 16.1 ~ 15 fps
173%
Iris Plus Graphics 650:
25.9 fps
100%
Radeon R5 (Stoney Ridge):
8 10.4 ~ 9 fps
203%
Iris Plus Graphics 650:
18.3 fps
89%
UHD Graphics 615:
6.3 9.9 ~ 8 fps
100%
Radeon R5 (Stoney Ridge):
26.9 fps
201%
Iris Plus Graphics 650:
54.2 fps
116%
UHD Graphics 615:
31.3 [X] HP Spectre Folio 13-ak0020ng Intel Core i7-8500Y 1.5GHz
UHD Graphics 615
fps
100%
Radeon R5 (Stoney Ridge):
21.6 fps
165%
Iris Plus Graphics 650:
35.6 fps
90%
UHD Graphics 615:
19.5 [X] HP Spectre Folio 13-ak0020ng Intel Core i7-8500Y 1.5GHz
UHD Graphics 615
fps
Iris Plus Graphics 650:
20.8 fps
100%
Radeon R5 (Stoney Ridge):
37.7 fps
141%
UHD Graphics 615:
53 [X] HP Spectre Folio 13-ak0020ng Intel Core i7-8500Y 1.5GHz
UHD Graphics 615
fps
100%
Radeon R5 (Stoney Ridge):
28.8 fps
120%
UHD Graphics 615:
34.6 [X] HP Spectre Folio 13-ak0020ng Intel Core i7-8500Y 1.5GHz
UHD Graphics 615
fps
100%
Radeon R5 (Stoney Ridge):
34.1 fps
100%
Radeon R5 (Stoney Ridge):
24.9 fps
100%
Radeon R5 (Stoney Ridge):
33.1 35.2 ~ 34 fps
279%
Iris Plus Graphics 650:
95 fps
156%
UHD Graphics 615:
40.8 49.5 [X] Microsoft Surface Go 2 Pentium Gold 4425Y Intel Pentium Gold 4425Y 1.7GHz
UHD Graphics 615
min:
40.6 fps, max:
-1 fps
52 52.6 55.3 [X] HP Spectre Folio 13-ak0020ng Intel Core i7-8500Y 1.5GHz
UHD Graphics 615
56.6 57.2 60.1 ~ 53 fps
100%
Radeon R5 (Stoney Ridge):
19.2 23.2 ~ 21 fps
305%
Iris Plus Graphics 650:
64 fps
119%
UHD Graphics 615:
17.4 17.7 25.9 25.9 26.3 27.3 [X] HP Spectre Folio 13-ak0020ng Intel Core i7-8500Y 1.5GHz
UHD Graphics 615
29.3 32.1 [X] Microsoft Surface Go 2 Pentium Gold 4425Y Intel Pentium Gold 4425Y 1.7GHz
UHD Graphics 615
min:
27.7 fps, max:
-1 fps
~ 25 fps
Iris Plus Graphics 650:
29.7 fps
UHD Graphics 615:
8.5 11.3 12.1 12.9 13.4 [X] Microsoft Surface Go 2 Pentium Gold 4425Y Intel Pentium Gold 4425Y 1.7GHz
UHD Graphics 615
min:
12.1 fps, max:
-1 fps
13.6 15.2 15.4 [X] HP Spectre Folio 13-ak0020ng Intel Core i7-8500Y 1.5GHz
UHD Graphics 615
~ 13 fps
Iris Plus Graphics 650:
25 fps
UHD Graphics 615:
7.6 10.3 11.3 11.6 11.8 [X] Microsoft Surface Go 2 Pentium Gold 4425Y Intel Pentium Gold 4425Y 1.7GHz
UHD Graphics 615
min:
10.8 fps, max:
-1 fps
12.3 13.7 ~ 11 fps
100%
Radeon R5 (Stoney Ridge):
8 fps
100%
Radeon R5 (Stoney Ridge):
5 fps
100%
Radeon R5 (Stoney Ridge):
9 fps
238%
Iris Plus Graphics 650:
21.4 fps
100%
Radeon R5 (Stoney Ridge):
59.7 fps
100%
Radeon R5 (Stoney Ridge):
22 fps
Iris Plus Graphics 650:
56.5 fps
UHD Graphics 615:
16.4 fps
Iris Plus Graphics 650:
49.9 fps
UHD Graphics 615:
16.9 fps
Iris Plus Graphics 650:
11.6 fps
Iris Plus Graphics 650:
5 fps
100%
Radeon R5 (Stoney Ridge):
19.3 fps
100%
Radeon R5 (Stoney Ridge):
14.8 fps
100%
Radeon R5 (Stoney Ridge):
12 fps
100%
Radeon R5 (Stoney Ridge):
39 fps
100%
Radeon R5 (Stoney Ridge):
30 fps
100%
Radeon R5 (Stoney Ridge):
27 fps
100%
Radeon R5 (Stoney Ridge):
17 fps
100%
Radeon R5 (Stoney Ridge):
16 22.3 ~ 19 fps
146%
UHD Graphics 615:
27.8 [X] HP Spectre Folio 13-ak0020ng Intel Core i7-8500Y 1.5GHz
UHD Graphics 615
fps
100%
Radeon R5 (Stoney Ridge):
11 13.8 ~ 12 fps
139%
UHD Graphics 615:
16.7 [X] HP Spectre Folio 13-ak0020ng Intel Core i7-8500Y 1.5GHz
UHD Graphics 615
fps
100%
Radeon R5 (Stoney Ridge):
111.9 fps
100%
Radeon R5 (Stoney Ridge):
34.3 fps
100%
Radeon R5 (Stoney Ridge):
20.9 fps
100%
Radeon R5 (Stoney Ridge):
12.9 fps
100%
Radeon R5 (Stoney Ridge):
65.1 fps
150%
UHD Graphics 615:
97.4 [X] HP Spectre Folio 13-ak0020ng Intel Core i7-8500Y 1.5GHz
UHD Graphics 615
fps
100%
Radeon R5 (Stoney Ridge):
29.7 fps
116%
UHD Graphics 615:
34.4 [X] HP Spectre Folio 13-ak0020ng Intel Core i7-8500Y 1.5GHz
UHD Graphics 615
fps
UHD Graphics 615:
24.7 [X] HP Spectre Folio 13-ak0020ng Intel Core i7-8500Y 1.5GHz
UHD Graphics 615
fps
100%
Radeon R5 (Stoney Ridge):
31.7 fps
100%
Radeon R5 (Stoney Ridge):
17.7 fps
100%
Radeon R5 (Stoney Ridge):
9.6 fps
100%
Radeon R5 (Stoney Ridge):
44 fps
100%
Radeon R5 (Stoney Ridge):
26 fps
100%
Radeon R5 (Stoney Ridge):
14 fps
100%
Radeon R5 (Stoney Ridge):
13 fps
100%
Radeon R5 (Stoney Ridge):
10 fps
100%
Radeon R5 (Stoney Ridge):
5 fps
100%
Radeon R5 (Stoney Ridge):
52.9 fps
100%
Radeon R5 (Stoney Ridge):
31.8 fps
100%
Radeon R5 (Stoney Ridge):
26 fps
100%
Radeon R5 (Stoney Ridge):
12.5 fps
100%
Radeon R5 (Stoney Ridge):
13 fps
100%
Radeon R5 (Stoney Ridge):
10 fps
100%
Radeon R5 (Stoney Ridge):
6 fps
195%
Iris Plus Graphics 650:
84 fps
286%
Iris Plus Graphics 650:
54.4 fps
291%
Iris Plus Graphics 650:
46.5 fps
100%
Radeon R5 (Stoney Ridge):
0 (!) 7.5 ~ 4 fps
333%
Iris Plus Graphics 650:
13.3 fps
100%
Radeon R5 (Stoney Ridge):
51.9 fps
108%
UHD Graphics 615:
51.2 59.9 [X] HP Spectre Folio 13-ak0020ng Intel Core i7-8500Y 1.5GHz
UHD Graphics 615
~ 56 fps
100%
Radeon R5 (Stoney Ridge):
25.7 fps
113%
UHD Graphics 615:
25.7 31.4 [X] HP Spectre Folio 13-ak0020ng Intel Core i7-8500Y 1.5GHz
UHD Graphics 615
~ 29 fps
100%
Radeon R5 (Stoney Ridge):
18.2 fps
104%
UHD Graphics 615:
16.9 21.2 [X] HP Spectre Folio 13-ak0020ng Intel Core i7-8500Y 1.5GHz
UHD Graphics 615
~ 19 fps
100%
Radeon R5 (Stoney Ridge):
63.9 fps
100%
Radeon R5 (Stoney Ridge):
31 fps
100%
Radeon R5 (Stoney Ridge):
26.6 fps
100%
Radeon R5 (Stoney Ridge):
39.2 fps
256%
UHD Graphics 615:
100.2 [X] HP Spectre Folio 13-ak0020ng Intel Core i7-8500Y 1.5GHz
UHD Graphics 615
fps
100%
Radeon R5 (Stoney Ridge):
28.5 fps
215%
UHD Graphics 615:
61.4 [X] HP Spectre Folio 13-ak0020ng Intel Core i7-8500Y 1.5GHz
UHD Graphics 615
fps
100%
Radeon R5 (Stoney Ridge):
25 fps
144%
UHD Graphics 615:
36 [X] HP Spectre Folio 13-ak0020ng Intel Core i7-8500Y 1.5GHz
UHD Graphics 615
fps
100%
Radeon R5 (Stoney Ridge):
59.6 fps
92%
UHD Graphics 615:
54.7 [X] HP Spectre Folio 13-ak0020ng Intel Core i7-8500Y 1.5GHz
UHD Graphics 615
fps
100%
Radeon R5 (Stoney Ridge):
41.8 fps
90%
UHD Graphics 615:
37.5 [X] HP Spectre Folio 13-ak0020ng Intel Core i7-8500Y 1.5GHz
UHD Graphics 615
fps
100%
Radeon R5 (Stoney Ridge):
33.6 fps
101%
UHD Graphics 615:
33.9 [X] HP Spectre Folio 13-ak0020ng Intel Core i7-8500Y 1.5GHz
UHD Graphics 615
fps
UHD Graphics 615:
19.4 [X] HP Spectre Folio 13-ak0020ng Intel Core i7-8500Y 1.5GHz
UHD Graphics 615
fps
100%
Radeon R5 (Stoney Ridge):
32.7 fps
128%
UHD Graphics 615:
41.7 [X] HP Spectre Folio 13-ak0020ng Intel Core i7-8500Y 1.5GHz
UHD Graphics 615
fps
100%
Radeon R5 (Stoney Ridge):
22.2 fps
105%
UHD Graphics 615:
23.3 [X] HP Spectre Folio 13-ak0020ng Intel Core i7-8500Y 1.5GHz
UHD Graphics 615
fps
100%
Radeon R5 (Stoney Ridge):
15.4 fps
100%
Radeon R5 (Stoney Ridge):
35 fps
100%
Radeon R5 (Stoney Ridge):
27 fps
100%
Radeon R5 (Stoney Ridge):
13 fps
100%
Radeon R5 (Stoney Ridge):
62.4 fps
93%
UHD Graphics 615:
58 [X] HP Spectre Folio 13-ak0020ng Intel Core i7-8500Y 1.5GHz
UHD Graphics 615
fps
100%
Radeon R5 (Stoney Ridge):
29 fps
137%
UHD Graphics 615:
39.6 [X] HP Spectre Folio 13-ak0020ng Intel Core i7-8500Y 1.5GHz
UHD Graphics 615
fps
UHD Graphics 615:
16 [X] HP Spectre Folio 13-ak0020ng Intel Core i7-8500Y 1.5GHz
UHD Graphics 615
fps
100%
Radeon R5 (Stoney Ridge):
26 fps
100%
Radeon R5 (Stoney Ridge):
21 fps
100%
Radeon R5 (Stoney Ridge):
17 fps
100%
Radeon R5 (Stoney Ridge):
81.4 fps
177%
UHD Graphics 615:
144.1 [X] HP Spectre Folio 13-ak0020ng Intel Core i7-8500Y 1.5GHz
UHD Graphics 615
fps
100%
Radeon R5 (Stoney Ridge):
24.3 fps
149%
UHD Graphics 615:
36.3 [X] HP Spectre Folio 13-ak0020ng Intel Core i7-8500Y 1.5GHz
UHD Graphics 615
fps
100%
Radeon R5 (Stoney Ridge):
18.6 fps
126%
UHD Graphics 615:
23.5 [X] HP Spectre Folio 13-ak0020ng Intel Core i7-8500Y 1.5GHz
UHD Graphics 615
fps
100%
Radeon R5 (Stoney Ridge):
12.4 fps
100%
Radeon R5 (Stoney Ridge):
82.6 fps
100%
Radeon R5 (Stoney Ridge):
43.7 fps
Average Gaming AMD Radeon R5 (Stoney Ridge) → 100% Average Gaming 30-70 fps → 100%
Average Gaming Intel Iris Plus Graphics 650 → 224% Average Gaming 30-70 fps → 229%
Average Gaming Intel UHD Graphics 615 → 112% Average Gaming 30-70 fps → 124%
For more games that might be playable and a list of all games and graphics cards visit our Gaming List
v1.26
log 12. 04:39:27
#0 checking url part for id 7447 +0s ... 0s
#1 checking url part for id 7655 +0s ... 0s
#2 checking url part for id 8832 +0s ... 0s
#3 not redirecting to Ajax server +0s ... 0s
#4 did not recreate cache, as it is less than 5 days old! Created at Fri, 10 May 2024 05:38:50 +0200 +0.001s ... 0.001s
#5 composed specs +0.133s ... 0.134s
#6 did output specs +0s ... 0.134s
#7 start showIntegratedCPUs +0s ... 0.134s
#8 getting avg benchmarks for device 7447 +0.059s ... 0.193s
#9 got single benchmarks 7447 +0.025s ... 0.219s
#10 getting avg benchmarks for device 7655 +0.002s ... 0.22s
#11 got single benchmarks 7655 +0.011s ... 0.231s
#12 getting avg benchmarks for device 8832 +0.016s ... 0.247s
#13 got single benchmarks 8832 +0.056s ... 0.303s
#14 got avg benchmarks for devices +0s ... 0.303s
#15 min, max, avg, median took s +0.415s ... 0.718s
#16 before gaming benchmark output +0s ... 0.718s
#17 Got 401 rows for game benchmarks. +0.066s ... 0.784s
#18 composed SQL query for gamebenchmarks +0s ... 0.784s
#19 got data and put it in $dataArray +0.074s ... 0.858s
#20 benchmarks composed for output. +0.22s ... 1.078s
#21 calculated avg scores. +0s ... 1.078s
#22 return log +0.004s ... 1.082s
Please share our article, every link counts!
Redaktion, 2017-09- 8 (Update: 2023-07- 1)
 Deutsch
 English
 Español
 Français
 Italiano
 Nederlands
 Polski
 Português
 Русский
 Türkçe
 Svenska
 Chinese
 Magyar