

iBuyPower Battalion 101 W670SJQ Notebook Review
Battalion power. Aside from the MSI-based Valkyrie series, the iBuyPower Battalion series is a less expensive alternative based on Clevo barebones. We take this $1000 gamer for a spin to see if it is worth the entry-level price.
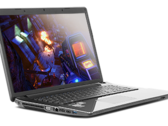
Intel Core i7-4900MQ, NVIDIA GeForce GTX 850M, 17.3", 3.1 kg