

WDC PC SN810 1TB vs Samsung PM981a MZVLB1T0HBLR
WDC PC SN810 1TB
► remove from comparison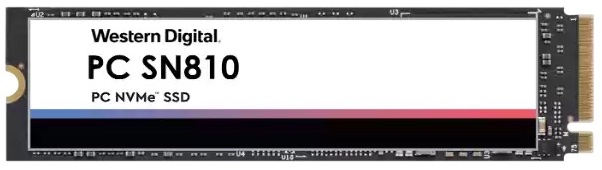
The Western Digital PC SN810 1TB NVMe SSD (SDCPNRY-1T00 Non-SED, SDCQNRY-1T00 with SED) is a high end M.2 2280 SSD with a PCIe Gen4 interface. It is rated at 6,600 MB/s read and 5,000 MB/s write speeds (sequential), 200 mW active power and an endurace of 400 TB written (MTTF 1,752,000 hours).
Samsung PM981a MZVLB1T0HBLR
► remove from comparison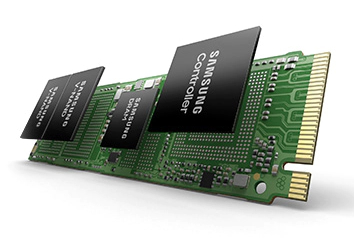
The Samsung SSD PM981a 1TB nVME SSD (MZVLB1T0HBLR-00000) is a high end M.2 2280 SSD based on the Samsung Phoenix Controller (S4LR020) with 8 channels. It is specified with 3,500 MB/s read and 3,000 MB/s write speeds (max) and 580k/500k IOPS 4k. The power consumption is specified with 0.03 W in idle and 5.6 W under load. The PM981a uses Samsung 3D-NAND TLC with 96 layers (V-NAND v5) and uses NVMe 1.3.
| WDC PC SN810 1TB | Samsung PM981a MZVLB1T0HBLR | |
| Type | SSD | SSD |
| Size | M.2 2280 | M.2 2280 |
| Capacity | 1024 GB | 1024 GB |
| Interface | NVMe | NVMe |
| Announced | 16.02.2022 | 04.08.2019 |
Benchmarks
| Model | CPU | GPU | RAM | Value |
|---|---|---|---|---|
| HP EliteBook 845 G9 6F6H6EA | R9 PRO 6950HS 50 W / 40 W | Radeon 680M ? / 3200 MHz 32 GB | 32 GB | 954 |
| HP Omen 17-ck1075ng | i7-12700H 106 W / 75 W | GeForce RTX 3070 Ti Laptop GPU 135 W 8 GB | 16 GB | 1142.39 |
| Lenovo ThinkPad X1 Carbon G11-21HNS00000 | i7-1365U 55 W / 25 W | Iris Xe G7 96EUs 1200 / 2600 MHz | 32 GB | 1391.54 |
| Acer Swift X SFX16-52G-77RX | i7-1260P 64 W / 35 W | A370M 35 W 2050 / 1750 MHz 4 GB | 16 GB | 1613 |
| Alienware x14 i7 RTX 3060 | i7-12700H 100 W / 55 W | GeForce RTX 3060 Laptop GPU 75 W 1687 / 1500 MHz 6 GB | 16 GB | 1625 |
| HP Omen Transcend 14-fb0014 | Ultra 7 155H 83 W / 65 W | NVIDIA GeForce RTX 4060 Laptop GPU 65 W 1470 / 2000 MHz 8 GB | 16 GB | 1763.13 |
| HP Pavilion Plus 16-ab0456tx | i7-13700H 61 W / 60 W | GeForce RTX 3050 6GB Laptop GPU 60 W 6 GB | 16 GB | 1885.65 |
| Alienware x16 R2 P120F | Ultra 9 185H 151 W / 105 W | NVIDIA GeForce RTX 4080 Laptop GPU 175 W 2125 / 2263 MHz 12 GB | 32 GB | 1889.15 |
| Framework Laptop 16 | R9 7940HS 79 W / 54 W | Radeon RX 7700S 100 W ? / 912 MHz 8 GB | 32 GB | 2325.18 |
| Model | CPU | GPU | RAM | Value |
|---|---|---|---|---|
| HP EliteBook 845 G9 6F6H6EA | R9 PRO 6950HS 50 W / 40 W | Radeon 680M ? / 3200 MHz 32 GB | 32 GB | 329 |
| HP Omen 17-ck1075ng | i7-12700H 106 W / 75 W | GeForce RTX 3070 Ti Laptop GPU 135 W 8 GB | 16 GB | 384.09 |
| Lenovo ThinkPad X1 Carbon G11-21HNS00000 | i7-1365U 55 W / 25 W | Iris Xe G7 96EUs 1200 / 2600 MHz | 32 GB | 409.34 |
| HP Omen Transcend 14-fb0014 | Ultra 7 155H 83 W / 65 W | NVIDIA GeForce RTX 4060 Laptop GPU 65 W 1470 / 2000 MHz 8 GB | 16 GB | 510.65 |
| Acer Swift X SFX16-52G-77RX | i7-1260P 64 W / 35 W | A370M 35 W 2050 / 1750 MHz 4 GB | 16 GB | 658.6 |
| Alienware x14 i7 RTX 3060 | i7-12700H 100 W / 55 W | GeForce RTX 3060 Laptop GPU 75 W 1687 / 1500 MHz 6 GB | 16 GB | 746 |
| Alienware x16 R2 P120F | Ultra 9 185H 151 W / 105 W | NVIDIA GeForce RTX 4080 Laptop GPU 175 W 2125 / 2263 MHz 12 GB | 32 GB | 834.88 |
| Framework Laptop 16 | R9 7940HS 79 W / 54 W | Radeon RX 7700S 100 W ? / 912 MHz 8 GB | 32 GB | 857.99 |
| HP Pavilion Plus 16-ab0456tx | i7-13700H 61 W / 60 W | GeForce RTX 3050 6GB Laptop GPU 60 W 6 GB | 16 GB | 984.56 |
| Model | CPU | GPU | RAM | Value |
|---|---|---|---|---|
| HP Omen Transcend 14-fb0014 | Ultra 7 155H 83 W / 65 W | NVIDIA GeForce RTX 4060 Laptop GPU 65 W 1470 / 2000 MHz 8 GB | 16 GB | 382.79 |
| HP Omen 17-ck1075ng | i7-12700H 106 W / 75 W | GeForce RTX 3070 Ti Laptop GPU 135 W 8 GB | 16 GB | 1813.44 |
| Acer Swift X SFX16-52G-77RX | i7-1260P 64 W / 35 W | A370M 35 W 2050 / 1750 MHz 4 GB | 16 GB | 2309 |
| Alienware x14 i7 RTX 3060 | i7-12700H 100 W / 55 W | GeForce RTX 3060 Laptop GPU 75 W 1687 / 1500 MHz 6 GB | 16 GB | 2451 |
| Lenovo ThinkPad X1 Carbon G11-21HNS00000 | i7-1365U 55 W / 25 W | Iris Xe G7 96EUs 1200 / 2600 MHz | 32 GB | 2681.9 |
| HP Pavilion Plus 16-ab0456tx | i7-13700H 61 W / 60 W | GeForce RTX 3050 6GB Laptop GPU 60 W 6 GB | 16 GB | 2730.95 |
| HP EliteBook 845 G9 6F6H6EA | R9 PRO 6950HS 50 W / 40 W | Radeon 680M ? / 3200 MHz 32 GB | 32 GB | 3085 |
| Alienware x16 R2 P120F | Ultra 9 185H 151 W / 105 W | NVIDIA GeForce RTX 4080 Laptop GPU 175 W 2125 / 2263 MHz 12 GB | 32 GB | 3290.8 |
| Framework Laptop 16 | R9 7940HS 79 W / 54 W | Radeon RX 7700S 100 W ? / 912 MHz 8 GB | 32 GB | 4143.45 |
| Model | CPU | GPU | RAM | Value |
|---|---|---|---|---|
| Lenovo Legion Y540-15IRH | i7-9750H | GeForce RTX 2060 Mobile 960 / 1750 MHz 6 GB | 16 GB | 396.1 |
| Lenovo IdeaPad S540-15IWL 81SW0015GE | i7-8565U | GeForce GTX 1650 Max-Q 3.0.4 x64 1000 MB [C: 8.9% (85.1/952.6 GB)] (x5) | 12 GB | 456.6 |
| Model | CPU | GPU | RAM | Value |
|---|---|---|---|---|
| Lenovo Legion Y540-15IRH | i7-9750H | GeForce RTX 2060 Mobile 960 / 1750 MHz 6 GB | 16 GB | 450.7 |
| Lenovo IdeaPad S540-15IWL 81SW0015GE | i7-8565U | GeForce GTX 1650 Max-Q 3.0.4 x64 1000 MB [C: 8.9% (85.1/952.6 GB)] (x5) | 12 GB | 538 |
| Model | CPU | GPU | RAM | Value |
|---|---|---|---|---|
| Lenovo Legion Y540-15IRH | i7-9750H | GeForce RTX 2060 Mobile 960 / 1750 MHz 6 GB | 16 GB | 105 |
| Lenovo IdeaPad S540-15IWL 81SW0015GE | i7-8565U | GeForce GTX 1650 Max-Q 3.0.4 x64 1000 MB [C: 8.9% (85.1/952.6 GB)] (x5) | 12 GB | 173.6 |
| Model | CPU | GPU | RAM | Value |
|---|---|---|---|---|
| Lenovo Legion Y540-15IRH | i7-9750H | GeForce RTX 2060 Mobile 960 / 1750 MHz 6 GB | 16 GB | 56.5 |
| Lenovo IdeaPad S540-15IWL 81SW0015GE | i7-8565U | GeForce GTX 1650 Max-Q 3.0.4 x64 1000 MB [C: 8.9% (85.1/952.6 GB)] (x5) | 12 GB | 69.6 |
| Model | CPU | GPU | RAM | Value |
|---|---|---|---|---|
| Lenovo IdeaPad S540-15IWL 81SW0015GE | i7-8565U | GeForce GTX 1650 Max-Q 3.0.4 x64 1000 MB [C: 8.9% (85.1/952.6 GB)] (x5) | 12 GB | 1361 |
| Lenovo Legion Y540-15IRH | i7-9750H | GeForce RTX 2060 Mobile 960 / 1750 MHz 6 GB | 16 GB | 2613 |
| Model | CPU | GPU | RAM | Value |
|---|---|---|---|---|
| Lenovo IdeaPad S540-15IWL 81SW0015GE | i7-8565U | GeForce GTX 1650 Max-Q 3.0.4 x64 1000 MB [C: 8.9% (85.1/952.6 GB)] (x5) | 12 GB | 591 |
| Lenovo Legion Y540-15IRH | i7-9750H | GeForce RTX 2060 Mobile 960 / 1750 MHz 6 GB | 16 GB | 997 |
| Model | CPU | GPU | RAM | Value |
|---|---|---|---|---|
| Lenovo IdeaPad S540-15IWL 81SW0015GE | i7-8565U | GeForce GTX 1650 Max-Q 3.0.4 x64 1000 MB [C: 8.9% (85.1/952.6 GB)] (x5) | 12 GB | 1081 |
| Lenovo Legion Y540-15IRH | i7-9750H | GeForce RTX 2060 Mobile 960 / 1750 MHz 6 GB | 16 GB | 2637 |
| Model | CPU | GPU | RAM | Value |
|---|---|---|---|---|
| Lenovo IdeaPad S540-15IWL 81SW0015GE | i7-8565U | GeForce GTX 1650 Max-Q 3.0.4 x64 1000 MB [C: 8.9% (85.1/952.6 GB)] (x5) | 12 GB | 1055 |
| Lenovo Legion Y540-15IRH | i7-9750H | GeForce RTX 2060 Mobile 960 / 1750 MHz 6 GB | 16 GB | 1297 |
| Model | CPU | GPU | RAM | Value |
|---|---|---|---|---|
| HP Omen Transcend 14-fb0014 | Ultra 7 155H 83 W / 65 W | NVIDIA GeForce RTX 4060 Laptop GPU 65 W 1470 / 2000 MHz 8 GB | 16 GB | 81.65 |
| Framework Laptop 16 | R9 7940HS 79 W / 54 W | Radeon RX 7700S 100 W ? / 912 MHz 8 GB | 32 GB | 130.4 |
| Lenovo Legion Slim 7 16APH8 | R7 7840HS | NVIDIA GeForce RTX 4060 Laptop GPU 140 W 2010 / 2000 MHz 8 GB | 32 GB | 140.9 |
| Lenovo ThinkPad X1 Carbon G11-21HNS00000 | i7-1365U 55 W / 25 W | Iris Xe G7 96EUs 1200 / 2600 MHz 6.0.1 x64 1024 MiB [C: 5.5% (52.1/951.6 GiB)] (x5) [Interval=5 sec] | 32 GB | 149.9 |
| HP Pavilion Plus 16-ab0456tx | i7-13700H 61 W / 60 W | GeForce RTX 3050 6GB Laptop GPU 60 W 6 GB | 16 GB | 158.5 |
| HP Omen 16-b1090ng | i7-12700H 115 W / 90 W | GeForce RTX 3070 Ti Laptop GPU 115 W 1035 / 1500 MHz 8 GB | 32 GB | 188.3 |
| Alienware x14 i7 RTX 3060 | i7-12700H 100 W / 55 W | GeForce RTX 3060 Laptop GPU 75 W 1687 / 1500 MHz 6 GB 6.0.1 x64 1024 MiB [C: 14.4% (133.9/932.2 GiB)] (x5) [Interval=5 sec] | 16 GB | 206.1 |
| Alienware x16 R2 P120F | Ultra 9 185H 151 W / 105 W | NVIDIA GeForce RTX 4080 Laptop GPU 175 W 2125 / 2263 MHz 12 GB | 32 GB | 231.9 |
| MSI Stealth GS66 12UGS | i7-12700H 200 W / 200 W | GeForce RTX 3070 Ti Laptop GPU 105 W 1035 / 1500 MHz 8 GB | 32 GB | 330.8 |
| Model | CPU | GPU | RAM | Value |
|---|---|---|---|---|
| Framework Laptop 16 | R9 7940HS 79 W / 54 W | Radeon RX 7700S 100 W ? / 912 MHz 8 GB | 32 GB | 59.81 |
| HP Omen Transcend 14-fb0014 | Ultra 7 155H 83 W / 65 W | NVIDIA GeForce RTX 4060 Laptop GPU 65 W 1470 / 2000 MHz 8 GB | 16 GB | 63 |
| Lenovo Legion Slim 7 16APH8 | R7 7840HS | NVIDIA GeForce RTX 4060 Laptop GPU 140 W 2010 / 2000 MHz 8 GB | 32 GB | 64.62 |
| HP Pavilion Plus 16-ab0456tx | i7-13700H 61 W / 60 W | GeForce RTX 3050 6GB Laptop GPU 60 W 6 GB | 16 GB | 71.58 |
| Lenovo ThinkPad X1 Carbon G11-21HNS00000 | i7-1365U 55 W / 25 W | Iris Xe G7 96EUs 1200 / 2600 MHz 6.0.1 x64 1024 MiB [C: 5.5% (52.1/951.6 GiB)] (x5) [Interval=5 sec] | 32 GB | 72 |
| HP Omen 16-b1090ng | i7-12700H 115 W / 90 W | GeForce RTX 3070 Ti Laptop GPU 115 W 1035 / 1500 MHz 8 GB | 32 GB | 74.61 |
| Alienware x16 R2 P120F | Ultra 9 185H 151 W / 105 W | NVIDIA GeForce RTX 4080 Laptop GPU 175 W 2125 / 2263 MHz 12 GB | 32 GB | 77.86 |
| Alienware x14 i7 RTX 3060 | i7-12700H 100 W / 55 W | GeForce RTX 3060 Laptop GPU 75 W 1687 / 1500 MHz 6 GB 6.0.1 x64 1024 MiB [C: 14.4% (133.9/932.2 GiB)] (x5) [Interval=5 sec] | 16 GB | 78.7 |
| MSI Stealth GS66 12UGS | i7-12700H 200 W / 200 W | GeForce RTX 3070 Ti Laptop GPU 105 W 1035 / 1500 MHz 8 GB | 32 GB | 91.4 |
| Model | CPU | GPU | RAM | Value |
|---|---|---|---|---|
| HP Omen Transcend 14-fb0014 | Ultra 7 155H 83 W / 65 W | NVIDIA GeForce RTX 4060 Laptop GPU 65 W 1470 / 2000 MHz 8 GB | 16 GB | 2754 |
| Framework Laptop 16 | R9 7940HS 79 W / 54 W | Radeon RX 7700S 100 W ? / 912 MHz 8 GB | 32 GB | 3661 |
| HP Pavilion Plus 16-ab0456tx | i7-13700H 61 W / 60 W | GeForce RTX 3050 6GB Laptop GPU 60 W 6 GB | 16 GB | 3738 |
| Lenovo Legion Slim 7 16APH8 | R7 7840HS | NVIDIA GeForce RTX 4060 Laptop GPU 140 W 2010 / 2000 MHz 8 GB | 32 GB | 3847 |
| HP Omen 16-b1090ng | i7-12700H 115 W / 90 W | GeForce RTX 3070 Ti Laptop GPU 115 W 1035 / 1500 MHz 8 GB | 32 GB | 4001 |
| MSI Stealth GS66 12UGS | i7-12700H 200 W / 200 W | GeForce RTX 3070 Ti Laptop GPU 105 W 1035 / 1500 MHz 8 GB | 32 GB | 5141 |
| Alienware x16 R2 P120F | Ultra 9 185H 151 W / 105 W | NVIDIA GeForce RTX 4080 Laptop GPU 175 W 2125 / 2263 MHz 12 GB | 32 GB | 5158 |
| Model | CPU | GPU | RAM | Value |
|---|---|---|---|---|
| Framework Laptop 16 | R9 7940HS 79 W / 54 W | Radeon RX 7700S 100 W ? / 912 MHz 8 GB | 32 GB | 3144 |
| HP Pavilion Plus 16-ab0456tx | i7-13700H 61 W / 60 W | GeForce RTX 3050 6GB Laptop GPU 60 W 6 GB | 16 GB | 3243 |
| HP Omen Transcend 14-fb0014 | Ultra 7 155H 83 W / 65 W | NVIDIA GeForce RTX 4060 Laptop GPU 65 W 1470 / 2000 MHz 8 GB | 16 GB | 3313 |
| Lenovo Legion Slim 7 16APH8 | R7 7840HS | NVIDIA GeForce RTX 4060 Laptop GPU 140 W 2010 / 2000 MHz 8 GB | 32 GB | 3442 |
| HP Omen 16-b1090ng | i7-12700H 115 W / 90 W | GeForce RTX 3070 Ti Laptop GPU 115 W 1035 / 1500 MHz 8 GB | 32 GB | 3682 |
| MSI Stealth GS66 12UGS | i7-12700H 200 W / 200 W | GeForce RTX 3070 Ti Laptop GPU 105 W 1035 / 1500 MHz 8 GB | 32 GB | 3979 |
| Alienware x16 R2 P120F | Ultra 9 185H 151 W / 105 W | NVIDIA GeForce RTX 4080 Laptop GPU 175 W 2125 / 2263 MHz 12 GB | 32 GB | 4186 |
| Model | CPU | GPU | RAM | Value |
|---|---|---|---|---|
| HP Omen Transcend 14-fb0014 | Ultra 7 155H 83 W / 65 W | NVIDIA GeForce RTX 4060 Laptop GPU 65 W 1470 / 2000 MHz 8 GB | 16 GB | 182.2 |
| Lenovo ThinkPad X1 Carbon G11-21HNS00000 | i7-1365U 55 W / 25 W | Iris Xe G7 96EUs 1200 / 2600 MHz 6.0.1 x64 1024 MiB [C: 5.5% (52.1/951.6 GiB)] (x5) [Interval=5 sec] | 32 GB | 412 |
| Alienware x16 R2 P120F | Ultra 9 185H 151 W / 105 W | NVIDIA GeForce RTX 4080 Laptop GPU 175 W 2125 / 2263 MHz 12 GB | 32 GB | 447.5 |
| HP Pavilion Plus 16-ab0456tx | i7-13700H 61 W / 60 W | GeForce RTX 3050 6GB Laptop GPU 60 W 6 GB | 16 GB | 476.7 |
| Lenovo Legion Slim 7 16APH8 | R7 7840HS | NVIDIA GeForce RTX 4060 Laptop GPU 140 W 2010 / 2000 MHz 8 GB | 32 GB | 485.1 |
| Framework Laptop 16 | R9 7940HS 79 W / 54 W | Radeon RX 7700S 100 W ? / 912 MHz 8 GB | 32 GB | 553.2 |
| HP Omen 16-b1090ng | i7-12700H 115 W / 90 W | GeForce RTX 3070 Ti Laptop GPU 115 W 1035 / 1500 MHz 8 GB | 32 GB | 599.2 |
| Alienware x14 i7 RTX 3060 | i7-12700H 100 W / 55 W | GeForce RTX 3060 Laptop GPU 75 W 1687 / 1500 MHz 6 GB 6.0.1 x64 1024 MiB [C: 14.4% (133.9/932.2 GiB)] (x5) [Interval=5 sec] | 16 GB | 619 |
| MSI Stealth GS66 12UGS | i7-12700H 200 W / 200 W | GeForce RTX 3070 Ti Laptop GPU 105 W 1035 / 1500 MHz 8 GB | 32 GB | 884 |
| Model | CPU | GPU | RAM | Value |
|---|---|---|---|---|
| HP Omen Transcend 14-fb0014 | Ultra 7 155H 83 W / 65 W | NVIDIA GeForce RTX 4060 Laptop GPU 65 W 1470 / 2000 MHz 8 GB | 16 GB | 375 |
| Framework Laptop 16 | R9 7940HS 79 W / 54 W | Radeon RX 7700S 100 W ? / 912 MHz 8 GB | 32 GB | 552.2 |
| Alienware x14 i7 RTX 3060 | i7-12700H 100 W / 55 W | GeForce RTX 3060 Laptop GPU 75 W 1687 / 1500 MHz 6 GB 6.0.1 x64 1024 MiB [C: 14.4% (133.9/932.2 GiB)] (x5) [Interval=5 sec] | 16 GB | 581 |
| Lenovo Legion Slim 7 16APH8 | R7 7840HS | NVIDIA GeForce RTX 4060 Laptop GPU 140 W 2010 / 2000 MHz 8 GB | 32 GB | 636 |
| HP Pavilion Plus 16-ab0456tx | i7-13700H 61 W / 60 W | GeForce RTX 3050 6GB Laptop GPU 60 W 6 GB | 16 GB | 675.8 |
| Lenovo ThinkPad X1 Carbon G11-21HNS00000 | i7-1365U 55 W / 25 W | Iris Xe G7 96EUs 1200 / 2600 MHz 6.0.1 x64 1024 MiB [C: 5.5% (52.1/951.6 GiB)] (x5) [Interval=5 sec] | 32 GB | 693 |
| HP Omen 16-b1090ng | i7-12700H 115 W / 90 W | GeForce RTX 3070 Ti Laptop GPU 115 W 1035 / 1500 MHz 8 GB | 32 GB | 734.8 |
| Alienware x16 R2 P120F | Ultra 9 185H 151 W / 105 W | NVIDIA GeForce RTX 4080 Laptop GPU 175 W 2125 / 2263 MHz 12 GB | 32 GB | 739.4 |
| MSI Stealth GS66 12UGS | i7-12700H 200 W / 200 W | GeForce RTX 3070 Ti Laptop GPU 105 W 1035 / 1500 MHz 8 GB | 32 GB | 1113 |
| Model | CPU | GPU | RAM | Value |
|---|---|---|---|---|
| HP Omen Transcend 14-fb0014 | Ultra 7 155H 83 W / 65 W | NVIDIA GeForce RTX 4060 Laptop GPU 65 W 1470 / 2000 MHz 8 GB | 16 GB | 2723 |
| Lenovo ThinkPad X1 Carbon G11-21HNS00000 | i7-1365U 55 W / 25 W | Iris Xe G7 96EUs 1200 / 2600 MHz 6.0.1 x64 1024 MiB [C: 5.5% (52.1/951.6 GiB)] (x5) [Interval=5 sec] | 32 GB | 4135 |
| MSI Stealth GS66 12UGS | i7-12700H 200 W / 200 W | GeForce RTX 3070 Ti Laptop GPU 105 W 1035 / 1500 MHz 8 GB | 32 GB | 5156 |
| Alienware x16 R2 P120F | Ultra 9 185H 151 W / 105 W | NVIDIA GeForce RTX 4080 Laptop GPU 175 W 2125 / 2263 MHz 12 GB | 32 GB | 5174 |
| Framework Laptop 16 | R9 7940HS 79 W / 54 W | Radeon RX 7700S 100 W ? / 912 MHz 8 GB | 32 GB | 5188 |
| HP Omen 16-b1090ng | i7-12700H 115 W / 90 W | GeForce RTX 3070 Ti Laptop GPU 115 W 1035 / 1500 MHz 8 GB | 32 GB | 5214 |
| Lenovo Legion Slim 7 16APH8 | R7 7840HS | NVIDIA GeForce RTX 4060 Laptop GPU 140 W 2010 / 2000 MHz 8 GB | 32 GB | 5242 |
| HP Pavilion Plus 16-ab0456tx | i7-13700H 61 W / 60 W | GeForce RTX 3050 6GB Laptop GPU 60 W 6 GB | 16 GB | 5251 |
| Alienware x14 i7 RTX 3060 | i7-12700H 100 W / 55 W | GeForce RTX 3060 Laptop GPU 75 W 1687 / 1500 MHz 6 GB 6.0.1 x64 1024 MiB [C: 14.4% (133.9/932.2 GiB)] (x5) [Interval=5 sec] | 16 GB | 5336 |
| Model | CPU | GPU | RAM | Value |
|---|---|---|---|---|
| HP Omen Transcend 14-fb0014 | Ultra 7 155H 83 W / 65 W | NVIDIA GeForce RTX 4060 Laptop GPU 65 W 1470 / 2000 MHz 8 GB | 16 GB | 5777 |
| Lenovo ThinkPad X1 Carbon G11-21HNS00000 | i7-1365U 55 W / 25 W | Iris Xe G7 96EUs 1200 / 2600 MHz 6.0.1 x64 1024 MiB [C: 5.5% (52.1/951.6 GiB)] (x5) [Interval=5 sec] | 32 GB | 6589 |
| HP Pavilion Plus 16-ab0456tx | i7-13700H 61 W / 60 W | GeForce RTX 3050 6GB Laptop GPU 60 W 6 GB | 16 GB | 6649.9 |
| HP Omen 16-b1090ng | i7-12700H 115 W / 90 W | GeForce RTX 3070 Ti Laptop GPU 115 W 1035 / 1500 MHz 8 GB | 32 GB | 6771 |
| Alienware x16 R2 P120F | Ultra 9 185H 151 W / 105 W | NVIDIA GeForce RTX 4080 Laptop GPU 175 W 2125 / 2263 MHz 12 GB | 32 GB | 6797 |
| Framework Laptop 16 | R9 7940HS 79 W / 54 W | Radeon RX 7700S 100 W ? / 912 MHz 8 GB | 32 GB | 6916 |
| Alienware x14 i7 RTX 3060 | i7-12700H 100 W / 55 W | GeForce RTX 3060 Laptop GPU 75 W 1687 / 1500 MHz 6 GB 6.0.1 x64 1024 MiB [C: 14.4% (133.9/932.2 GiB)] (x5) [Interval=5 sec] | 16 GB | 6922 |
| MSI Stealth GS66 12UGS | i7-12700H 200 W / 200 W | GeForce RTX 3070 Ti Laptop GPU 105 W 1035 / 1500 MHz 8 GB | 32 GB | 6937 |
| Lenovo Legion Slim 7 16APH8 | R7 7840HS | NVIDIA GeForce RTX 4060 Laptop GPU 140 W 2010 / 2000 MHz 8 GB | 32 GB | 6958 |
| Model | CPU | GPU | RAM | Value |
|---|---|---|---|---|
| Lenovo ThinkPad X1 Carbon G11-21HNS00000 | i7-1365U 55 W / 25 W | Iris Xe G7 96EUs 1200 / 2600 MHz 6.0.1 x64 1024 MiB [C: 5.5% (52.1/951.6 GiB)] (x5) [Interval=5 sec] | 32 GB | 406 |
| HP Pavilion Plus 16-ab0456tx | i7-13700H 61 W / 60 W | GeForce RTX 3050 6GB Laptop GPU 60 W 6 GB | 16 GB | 460.7 |
| Alienware x14 i7 RTX 3060 | i7-12700H 100 W / 55 W | GeForce RTX 3060 Laptop GPU 75 W 1687 / 1500 MHz 6 GB 6.0.1 x64 1024 MiB [C: 14.4% (133.9/932.2 GiB)] (x5) [Interval=5 sec] | 16 GB | 627 |
| Model | CPU | GPU | RAM | Value |
|---|---|---|---|---|
| Lenovo ThinkPad T495s-20QKS01E00 | R7 PRO 3700U | Vega 10 6.0.1 x64 1024 MiB [C: 5.6% (52.9/953.3 GiB)] (x5) [Interval=5 sec] | 16 GB | 1491 |
| Model | CPU | GPU | RAM | Value |
|---|---|---|---|---|
| Lenovo ThinkPad X1 Carbon G11-21HNS00000 | i7-1365U 55 W / 25 W | Iris Xe G7 96EUs 1200 / 2600 MHz 6.0.1 x64 1024 MiB [C: 5.5% (52.1/951.6 GiB)] (x5) [Interval=5 sec] | 32 GB | 716 |
| HP Pavilion Plus 16-ab0456tx | i7-13700H 61 W / 60 W | GeForce RTX 3050 6GB Laptop GPU 60 W 6 GB | 16 GB | 993.2 |
| Alienware x14 i7 RTX 3060 | i7-12700H 100 W / 55 W | GeForce RTX 3060 Laptop GPU 75 W 1687 / 1500 MHz 6 GB 6.0.1 x64 1024 MiB [C: 14.4% (133.9/932.2 GiB)] (x5) [Interval=5 sec] | 16 GB | 1296 |
| Model | CPU | GPU | RAM | Value |
|---|---|---|---|---|
| Lenovo ThinkPad T495s-20QKS01E00 | R7 PRO 3700U | Vega 10 6.0.1 x64 1024 MiB [C: 5.6% (52.9/953.3 GiB)] (x5) [Interval=5 sec] | 16 GB | 1499 |
Average Benchmarks WDC PC SN810 1TB → 100% n=33
Average Benchmarks Samsung PM981a MZVLB1T0HBLR → 97% n=33
* Smaller numbers mean a higher performance
1 This benchmark is not used for the average calculation
#0 ran 0s before starting gpusingle class +0s ... 0s
#1 checking url part for id 3794 +0s ... 0s
#2 checking url part for id 3386 +0s ... 0s
#3 redirected to Ajax server, took 1759362736s time from redirect:0 +0s ... 0s
#4 did not recreate cache, as it is less than 5 days old! Created at Mon, 29 Sep 2025 19:58:04 +0200 +0s ... 0s
#5 composed specs +0.002s ... 0.003s
#6 did output specs +0s ... 0.003s
#7 getting avg benchmarks for device 3794 +0.007s ... 0.009s
#8 got single benchmarks 3794 +0.012s ... 0.021s
#9 getting avg benchmarks for device 3386 +0.005s ... 0.026s
#10 got single benchmarks 3386 +0.03s ... 0.056s
#11 got avg benchmarks for devices +0s ... 0.056s
#12 min, max, avg, median took s +0.141s ... 0.198s
#13 return log +0s ... 0.198s