Notebookcheck Logo

Intel HD Graphics 500 vs Intel HD Graphics 6000

Intel HD Graphics 500

► remove from comparison Intel HD Graphics 500

The Intel HD Graphics 500 is an integrated processor graphics unit from the Apollo Lake generation (e. g. Celeron N3450 and Celeron N3350), which was announced mid 2016. The GPU can convince with low consumption figures, but the performance is only in the low-end segment and is rarely sufficient for modern games. Being a partial configuration of the Apollo Lake GPU, the HD Graphics 505 is equipped with just 12 Execution Units (EUs) (HD Graphics 505: 18 EUs) running at up to 650-700 MHz depending on the model. The technical specifications of the GPU are based on Intel's Gen9 architecture, which is also used for the more expensive Skylake series.

Due to its lack of dedicated graphics memory or eDRAM cache, the HD 505 has to access the main memory via processor (2x 64bit DDR3L-/LPDDR3-1866, LPDDR4-2400).

Performance

The HD Graphics 505 should be slightly slower than the older Broadwell GPU HD Graphics (Broadwell), so modern games (as of 2016) will rarely run smoothly even at the lowest settings.

Features

The revised video engine now decodes H.265/HEVC completely in hardware and thereby much more efficiently than before. Up to three displays can be connected via DP/eDP or HDMI (4K probably only at 30 Hz via HDMI 1.4).

Power Consumption

The TDP of the whole Pentium N4200 chip is 6 Watts by default, so the GPU is primarily used for (often passively cooled) netbooks or thin notebooks. The TDP can also be reduced to 4 Watts, but this will obviously affect the performance.

Intel HD Graphics 6000

► remove from comparison Intel HD Graphics 6000

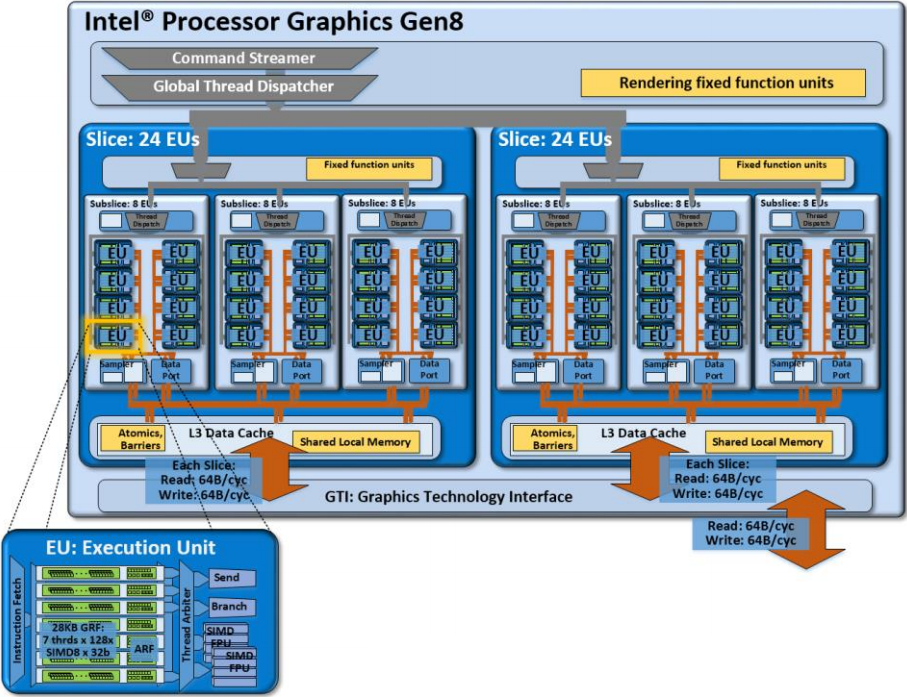
The Intel HD Graphics 6000 (GT3) is an integrated Broadwell graphics card revealed in Q1 2015. It can be found in several ULV SoCs (15 W TDP) such as the Core i5-5250U or i7-5650U. The so-called GT3 GPU offers 48 EUs (Execution Units) and therefore somewhat more shader power than the previous HD 5000 (40 EUs). Depending on the specific CPU, the maximum GPU frequency varies between 950 and 1000 MHz.

Architecture and Features

Broadwell features a GPU based on the Intel Gen8 architecture, which has been optimized in various aspects compared to the previous Gen7.5 (Haswell). Inter alia, the shader arrays called "subslice" have been reorganized and now offer 8 Execution Units (EUs) each. Three subslices form a "slice" for a total of 24 EUs. Combined with other improvements such as larger L1 caches and an optimized frontend, the integrated GPU has become faster and more efficient than its predecessor.

The HD Graphics 6000 represents the top-end version of the Broadwell GPU family and consists of two slices with 48 EUs. Beyond that, there is also a low-end (GT1, 12 EUs), a mid-range (GT2, 24 EUs) and a high-end variant (GT3e, 48 EUs + eDRAM).

All Broadwell GPUs support OpenCL 2.0 and DirectX 12 (FL 11_1). The video engine can now decode H.265 using both fixed function hardware as well as available GPU shaders. Up to three displays can be connected via DP 1.2/eDP 1.3 (max. 3840 x 2160 @ 60 Hz) or HDMI 1.4a (max. 3840 x 2160 @ 24 Hz). HDMI 2.0, however, is not supported.

Performance

Depending on the specific CPU, the maximum GPU frequency varies between 950 and 1000 MHz. Due to the low TDP, however, the average clock in 3D applications will be significantly lower. Overall, the HD Graphics 6000 outperforms the previous HD 5000 by 20 - 25 percent and offers a performance slightly below a dedicated GeForce 820M.

Games as of 2014/2015 will usually run fluently only at (very) low settings.

Power Consumption

Utilizing a new 14 nm process, the Broadwell ULV chips are specified at just 15 W TDP and therefore suited for thin ultrabooks. The TDP is flexible and can be further reduced (9.5 W), which has a significant impact on performance.

Intel HD Graphics 500Intel HD Graphics 6000
HD Graphics Series
Iris Pro Graphics P580 compare 72 @ 0.35 - 1.1 GHzeDRAM + 64/128 Bit
Iris Pro Graphics 580 compare 72 @ 0.35 - 1.05 GHzeDRAM + 64/128 Bit
Iris Graphics 550 compare 48 @ 0.3 - 1.1 GHzeDRAM + 64/128 Bit
Iris Graphics 540 compare 48 @ 0.3 - 1.05 GHzeDRAM + 64/128 Bit
HD Graphics 530 compare 24 @ 0.35 - 1.15 GHz64/128 Bit
HD Graphics 520 compare 24 @ 0.3 - 1.05 GHz64/128 Bit
HD Graphics 515 compare 24 @ 0.3 - 1 GHz64/128 Bit
UHD Graphics 610 compare 12 @ 0.3 - 0.95 GHz64/128 Bit
HD Graphics 610 compare 12 @ 0.3 - 0.95 GHz64/128 Bit
HD Graphics 510 compare 12 @ 0.3 - 0.95 GHz64/128 Bit
UHD Graphics 605 compare 18 @ 0.3 - 0.75 GHz64/128 Bit
HD Graphics 505 compare 18 @ 0.3 - 0.75 GHz64/128 Bit
UHD Graphics 600 compare 12 @ 0.3 - 0.7 GHz64/128 Bit
HD Graphics 500 12 @ 0.3 - 0.7 GHz64/128 Bit
HD Graphics P530 compare 24 @ 0.35 - 1.05 GHz64/128 Bit
HD Graphics 5600 compare 24 @ 0.3 - 1.05 GHz64/128 Bit
HD Graphics 6000 48 @ 0.3 - 1 GHz64/128 Bit
HD Graphics 4600 compare 20 @ 0.2 - 1.35 GHz64/128 Bit
HD Graphics 5500 compare 24 @ 0.3 - 0.95 GHz64/128 Bit
HD Graphics 5000 compare 40 @ 0.2 - 1.1 GHz64/128 Bit
HD Graphics 4400 compare 20 @ 0.2 - 1.1 GHz64/128 Bit
HD Graphics 5300 compare 24 @ 0.1 - 0.9 GHz64/128 Bit
HD Graphics 4000 compare 16 @ 0.35 - 1.35 GHz64/128 Bit
HD Graphics (Broadwell) compare 12 @ 0.1 - 0.85 GHz64/128 Bit
HD Graphics 4200 compare 20 @ 0.2 - 0.85 GHz64/128 Bit
HD Graphics (Skylake) compare 12 @ 0.3 - 0.8 GHz64/128 Bit
HD Graphics 405 (Braswell) compare 16 @ 0.32 - 0.7 GHz64/128 Bit
HD Graphics (Braswell) compare 16 @ 0.32 - 0.7 GHz64/128 Bit
HD Graphics 400 (Braswell) compare 12 @ 0.32 - 0.64 GHz64/128 Bit
HD Graphics (Haswell) compare 10 @ 0.2 - 1 GHz64/128 Bit
HD Graphics (Cherry Trail) compare 16 @ 0.2 - 0.6 GHz64/128 Bit
HD Graphics 3000 compare 12 @ 0.35 - 1.35 GHz64/128 Bit
HD Graphics 2500 compare 6 @ 0.65 - 1.15 GHz64/128 Bit
HD Graphics (Ivy Bridge) compare 6 @ 0.35 - 1.1 GHz64/128 Bit
HD Graphics 2000 compare 6 @ 0.85 - 1.35 GHz64/128 Bit
HD Graphics (Sandy Bridge) compare 6 @ 0.35 - 1.1 GHz64/128 Bit
HD Graphics (Bay Trail) compare 4 @ 0.31 - 0.9 GHz32/64/128 Bit
CodenameApollo LakeBroadwell GT3
ArchitectureGen. 9 Apollo LakeGen. 8 Broadwell
Pipelines12 - unified48 - unified
Core Speed300 - 700 (Boost) MHz300 - 1000 (Boost) MHz
Memory Bus Width64/128 Bit64/128 Bit
Shared Memoryyesyes
APIDirectX 12_1, OpenGL 4.4DirectX 12 (FL 11_1), OpenGL 4.3
technology14 nm14 nm
FeaturesQuickSyncQuickSync
Date of Announcement01.09.2016 05.01.2015
Transistors1.9 Billion
CPU in HD Graphics 500GPU Base SpeedGPU Boost / Turbo
Intel Celeron J34554 x 1500 MHz, 10 W250 MHz750 MHz
Intel Celeron N34504 x 1100 MHz, 6 W200 MHz700 MHz
Intel Celeron J33552 x 2000 MHz, 10 W250 MHz700 MHz
Intel Celeron N33502 x 1100 MHz, 6 W200 MHz650 MHz
min. - max.200 - 250 MHz650 - 750 MHz
CPU in HD Graphics 6000GPU Base SpeedGPU Boost / Turbo
Intel Core i7-5650U2 x 2200 MHz, 15 W300 MHz1000 MHz
Intel Core i7-5550U2 x 2000 MHz, 15 W300 MHz1000 MHz
Intel Core i5-5350U2 x 1800 MHz, 15 W300 MHz1000 MHz
Intel Core i5-5250U2 x 1600 MHz, 15 W300 MHz1000 MHz
min. - max.300 MHz1000 MHz

Benchmarks

Performance Rating - 3DMark 11 + Fire Strike + Time Spy - HD Graphics 500
0.1 pt (0%)
Restrict / Search: Model: Max. age: years
Performance Rating - 3DMark 11 + Fire Strike + Time Spy - HD Graphics 6000
0.4 pt (1%)
Restrict / Search: Model: Max. age: years
3DMark - 3DMark Time Spy Score
374 Points (1%)
3DMark - 3DMark Time Spy Graphics
334 Points (1%)
3DMark - 3DMark Ice Storm Unlimited Graphics
min: 19294     avg: 24491     median: 24609 (2%)     max: 29579 Points
3DMark - 3DMark Ice Storm Extreme Graphics
min: 12299     avg: 15195     median: 15085 (2%)     max: 18200 Points
3DMark - 3DMark Cloud Gate Score
min: 1932     avg: 2140     median: 2116 (2%)     max: 2306 Points
min: 5425     avg: 5737     median: 5872 (6%)     max: 6061 Points
min: 7378     avg: 7700     median: 7660 (2%)     max: 8102 Points
3DMark - 3DMark Fire Strike Standard Score
min: 271     avg: 321.5     median: 307 (0%)     max: 401 Points
min: 844     avg: 906     median: 903 (1%)     max: 971 Points
min: 858     avg: 947     median: 951 (1%)     max: 1033 Points
3DMark - 3DMark Ice Storm Graphics
min: 20140     avg: 26074     median: 23761 (3%)     max: 34320 Points
min: 61674     avg: 62508     median: 61979 (7%)     max: 63871 Points
3DMark - 3DMark Sling Shot (ES 3.0)
2013 Points (18%)
3DMark - 3DMark Sling Shot (ES 3.0) Graphics
2516 Points (15%)
3DMark - 3DMark Sling Shot Extreme (ES 3.1)
2208 Points (11%)
3DMark - 3DMark Sling Shot Extreme (ES 3.1) Graphics
2731 Points (9%)
min: 1328     avg: 1487     median: 1513.5 (2%)     max: 1591 Points
min: 1210     avg: 1372     median: 1395.5 (1%)     max: 1487 Points
3DMark Vantage
3DM Vant. Perf. total + Intel HD Graphics 6000
3DMark Vantage - 3DM Vant. Perf. total
min: 5797     avg: 6106     median: 6188 (2%)     max: 6333 Points
3DM Vant. Perf. GPU no PhysX + Intel HD Graphics 6000
3DMark Vantage - 3DM Vant. Perf. GPU no PhysX
min: 5129     avg: 5410     median: 5432 (3%)     max: 5670 Points
3DMark 06 3DMark 06 - Standard 1280x1024 + Intel HD Graphics 500
3DMark 06
min: 3393     avg: 3551     median: 3506 (5%)     max: 3753 Points
3DMark 06 - Standard 1280x1024 + Intel HD Graphics 6000
min: 7844     avg: 8448     median: 8091 (11%)     max: 9408 Points
Unigine Valley 1.0 - Unigine Valley 1.0 DX
3.7 fps (1%)
Unigine Heaven 2.1 - Heaven 2.1 high
min: 18.6     avg: 19     median: 18.7 (4%)     max: 19.8 fps
SPECviewperf 12
specvp12 sw-03 + Intel HD Graphics 6000
SPECviewperf 12 - specvp12 sw-03
16.6 fps (4%)
specvp12 snx-02 + Intel HD Graphics 6000
SPECviewperf 12 - specvp12 snx-02
2.5 fps (0%)
specvp12 showcase-01 + Intel HD Graphics 6000
SPECviewperf 12 - specvp12 showcase-01
5.6 fps (1%)
specvp12 mediacal-01 + Intel HD Graphics 6000
SPECviewperf 12 - specvp12 mediacal-01
1.6 fps (0%)
specvp12 maya-04 + Intel HD Graphics 6000
SPECviewperf 12 - specvp12 maya-04
3.3 fps (1%)
specvp12 energy-01 + Intel HD Graphics 6000
SPECviewperf 12 - specvp12 energy-01
0.1 fps (0%)
specvp12 creo-01 + Intel HD Graphics 6000
SPECviewperf 12 - specvp12 creo-01
9.9 fps (4%)
specvp12 catia-04 + Intel HD Graphics 6000
SPECviewperf 12 - specvp12 catia-04
11.3 fps (2%)
Windows 7 Experience Index - Win7 Gaming graphics
6.9 Points (87%)
Windows 7 Experience Index - Win7 Graphics
5.9 Points (75%)
Cinebench R10 Cinebench R10 Shading (32bit) + Intel HD Graphics 500
Cinebench R10 - Cinebench R10 Shading (32bit)
min: 2791     avg: 2888     median: 2894 (2%)     max: 3031 Points
Cinebench R10 Shading (32bit) + Intel HD Graphics 6000
min: 6148     avg: 6928     median: 6527 (5%)     max: 8110 Points
Cinebench R11.5 Cinebench R11.5 OpenGL 64 Bit + Intel HD Graphics 500
Cinebench R11.5 - Cinebench R11.5 OpenGL 64 Bit
min: 7.05     avg: 8.2     median: 8.1 (3%)     max: 9.61 fps
Cinebench R11.5 OpenGL 64 Bit + Intel HD Graphics 6000
min: 21.27     avg: 23.7     median: 23.9 (8%)     max: 25.67 fps
Cinebench R15
Cinebench R15 OpenGL 64 Bit + Intel HD Graphics 500
Cinebench R15 OpenGL 64 Bit + Intel HD Graphics 6000
min: 25.89     avg: 30.1     median: 30.7 (2%)     max: 34.45 fps
Cinebench R15 OpenGL Ref. Match 64 Bit + Intel HD Graphics 500
Cinebench R15 OpenGL Ref. Match 64 Bit + Intel HD Graphics 6000
min: 98     avg: 98.5     median: 98 (98%)     max: 99.3 %
GFXBench - GFXBench 5.0 Aztec Ruins High Tier Offscreen
3.6 fps (1%)
GFXBench - GFXBench 5.0 Aztec Ruins Normal Tier Offscreen
9.7 fps (1%)
GFXBench - GFXBench Car Chase Offscreen
8.4 fps (1%)
GFXBench 3.1 - GFXBench Manhattan ES 3.1 Offscreen
15 fps (0%)
GFXBench 3.0 - GFXBench 3.0 Manhattan Offscreen
20 fps (1%)
min: 34.22     avg: 39.5     median: 39.5 (2%)     max: 44.7 fps
GFXBench (DX / GLBenchmark) 2.7
GFXBench T-Rex HD Offscreen C24Z16 + Intel HD Graphics 500
GFXBench (DX / GLBenchmark) 2.7 - GFXBench T-Rex HD Offscreen C24Z16
42 fps (0%)
Basemark GPU 1.2 - Basemark GPU 1.2 Vulkan Official Medium Offscreen 1080
16.3 fps (0%)
LuxMark v2.0 64Bit - LuxMark v2.0 Room GPU
49 Samples/s (0%)
min: 127     avg: 136     median: 135 (0%)     max: 146 Samples/s
LuxMark v2.0 64Bit - LuxMark v2.0 Sala GPU
79 Samples/s (0%)
min: 342     avg: 357     median: 350 (1%)     max: 379 Samples/s
ComputeMark v2.1 - ComputeMark v2.1 Result
min: 296     avg: 320     median: 324 (0%)     max: 336 Points
min: 941     avg: 1032     median: 1021 (1%)     max: 1134 Points
Power Consumption - Furmark Stress Test Power Consumption - external Monitor *
8.9 Watt (1%)
32.9 Watt (4%)
Power Consumption - The Witcher 3 Power Consumption - external Monitor *
32.1 Watt (4%)
Clock Speed - GPU Clock Witcher 3 ultra
850 MHz (33%)
Clock Speed - GPU Clock Speed Furmark
450 MHz (18%)
649 MHz (26%)

Average Benchmarks Intel HD Graphics 500 → 100% n=17

Average Benchmarks Intel HD Graphics 6000 → 258% n=17

- Range of benchmark values for this graphics card
red legend - Average benchmark values for this graphics card
* Smaller numbers mean a higher performance
1 This benchmark is not used for the average calculation

Game Benchmarks

The following benchmarks stem from our benchmarks of review laptops. The performance depends on the used graphics memory, clock rate, processor, system settings, drivers, and operating systems. So the results don't have to be representative for all laptops with this GPU. For detailed information on the benchmark results, click on the fps number.

Valorant

Valorant

2020
low 1280x720
100%
HD Graphics 500:
9.1  fps
low 1920x1080
100%
HD Graphics 500:
23.9  fps
med. 1920x1080
100%
HD Graphics 500:
24  fps
high 1920x1080
100%
HD Graphics 500:
11.2  fps
low 1280x720
100%
HD Graphics 500:
28.2  fps
med. 1920x1080
100%
HD Graphics 500:
20.2  fps
high 1920x1080
100%
HD Graphics 500:
13.9  fps
ultra 1920x1080
100%
HD Graphics 500:
12.6  fps
low 1280x720
HD Graphics 6000:
18.4  fps
low 1280x720
100%
HD Graphics 500:
2  fps
low 1280x720
100%
HD Graphics 500:
3  fps
Strange Brigade

Strange Brigade

2018
low 1280x720
HD Graphics 500:
0 (!)  fps
F1 2018

F1 2018

2018
low 1280x720
100%
HD Graphics 500:
12  fps
low 1280x720
100%
HD Graphics 500:
5.5  fps
Far Cry 5

Far Cry 5

2018
low 1280x720
100%
HD Graphics 500:
1  fps
QHD 2560x1440
100%
HD Graphics 500:
1  fps
World of Tanks enCore

World of Tanks enCore

2018
low 1366x768
100%
HD Graphics 500:
34.4 (!)  fps
med. 1920x1080
100%
HD Graphics 500:
4.6 (!)  fps
low 1280x720
100%
HD Graphics 500:
5.3 5.5 7.6 ~ 6 fps
303%
HD Graphics 6000:
18.2  fps
med. 1920x1080
100%
HD Graphics 500:
3.9 4.7 ~ 4 fps
323%
HD Graphics 6000:
12.9  fps
high 1920x1080
100%
HD Graphics 500:
3.6 4.3 ~ 4 fps
290%
HD Graphics 6000:
11.6  fps
low 1280x720
100%
HD Graphics 500:
10  fps
low 1280x720
100%
HD Graphics 500:
18.2 21.2 ~ 20 fps
321%
HD Graphics 6000:
64.2  fps
med. 1366x768
100%
HD Graphics 500:
17.2  fps
high 1920x1080
HD Graphics 6000:
37.4 (!)  fps
Dirt 4

Dirt 4

2017
low 1280x720
100%
HD Graphics 500:
10  fps
413%
HD Graphics 6000:
41.3  fps
med. 1920x1080
100%
HD Graphics 500:
5.6  fps
low 1280x720
100%
HD Graphics 500:
18.1  fps
157%
HD Graphics 6000:
28.4  fps
med. 1920x1080
100%
HD Graphics 500:
6.2  fps
Prey

Prey

2017
low 1280x720
100%
HD Graphics 500:
4.9  fps
For Honor

For Honor

2017
low 1280x720
100%
HD Graphics 500:
8.7  fps
low 1280x720
HD Graphics 6000:
55.3 61 ~ 58 fps
med. 1366x768
HD Graphics 6000:
32.7  fps
high 1920x1080
HD Graphics 6000:
18.9  fps
low 1280x720
HD Graphics 6000:
20.8  fps
Overwatch

Overwatch

2016
low 1280x720
100%
HD Graphics 500:
15.9  fps
157%
HD Graphics 6000:
25  fps
low 1024x768
100%
HD Graphics 500:
15.5  fps
186%
HD Graphics 6000:
28.9  fps
med. 1366x768
HD Graphics 6000:
18.2  fps
high 1920x1080
HD Graphics 6000:
10.9  fps
ultra 1920x1080
HD Graphics 6000:
9.1  fps
low 1024x768
HD Graphics 6000:
18.6  fps
med. 1366x768
HD Graphics 6000:
14  fps
low 1024x768
HD Graphics 6000:
24.6  fps
med. 1366x768
HD Graphics 6000:
16.6  fps
FIFA 16

FIFA 16

2015
low 1280x720
HD Graphics 6000:
53 (!)  fps
high 1366x768
HD Graphics 6000:
39 (!)  fps
ultra 1920x1080
HD Graphics 6000:
21.3  fps
low 1366x768
100%
HD Graphics 500:
19.1  fps
274%
HD Graphics 6000:
52.3  fps
ultra 1920x1080
HD Graphics 6000:
16  fps
low 1024x768
100%
HD Graphics 500:
16.4  fps
213%
HD Graphics 6000:
35  fps
med. 1366x768
100%
HD Graphics 500:
9.7  fps
256%
HD Graphics 6000:
24.8  fps
high 1920x1080
HD Graphics 6000:
9.5  fps
Mad Max

Mad Max

2015
med. 1366x768
HD Graphics 6000:
19.3  fps
low 1280x720
100%
HD Graphics 500:
15.9 22.1 27.6 ~ 22 fps
249%
HD Graphics 6000:
54.7  fps
med. 1366x768
100%
HD Graphics 500:
15.3 15.3 ~ 15 fps
226%
HD Graphics 6000:
33.9  fps
high 1920x1080
100%
HD Graphics 500:
5.6  fps
298%
HD Graphics 6000:
16.7  fps
ultra 1920x1080
100%
HD Graphics 500:
5.1  fps
302%
HD Graphics 6000:
15.4  fps
low 1280x720
HD Graphics 6000:
11  fps
med. 1366x768
HD Graphics 6000:
10  fps
low 1024x768
HD Graphics 6000:
13.4 13.8 ~ 14 fps
low 1024x768
100%
HD Graphics 500:
28.5  fps
326%
HD Graphics 6000:
93  fps
med. 1366x768
100%
HD Graphics 500:
12.5  fps
182%
HD Graphics 6000:
22.8  fps
high 1920x1080
HD Graphics 6000:
12.9  fps
low 1024x768
HD Graphics 6000:
35.3  fps
med. 1366x768
HD Graphics 6000:
26.9  fps
high 1920x1080
HD Graphics 6000:
9.1  fps
Evolve

Evolve

2015
low 1024x768
HD Graphics 6000:
18.7  fps
med. 1366x768
HD Graphics 6000:
13.5  fps
low 1024x768
HD Graphics 6000:
20.9  fps
med. 1366x768
HD Graphics 6000:
16.8  fps
high 1920x1080
HD Graphics 6000:
6.1  fps
low 1024x768
HD Graphics 6000:
0 (!)  fps
low 1024x768
HD Graphics 6000:
33  fps
med. 1366x768
HD Graphics 6000:
17.6  fps
low 1024x768
HD Graphics 6000:
40.9  fps
med. 1366x768
HD Graphics 6000:
20.8  fps
high 1920x1080
HD Graphics 6000:
13.3  fps
ultra 1920x1080
HD Graphics 6000:
10.7  fps
F1 2014

F1 2014

2014
low 1024x768
100%
HD Graphics 500:
22  fps
250%
HD Graphics 6000:
55  fps
med. 1366x768
100%
HD Graphics 500:
16  fps
231%
HD Graphics 6000:
37  fps
high 1920x1080
HD Graphics 6000:
21  fps
ultra 1920x1080
HD Graphics 6000:
13  fps
low 1024x768
HD Graphics 6000:
19  fps
med. 1366x768
HD Graphics 6000:
12  fps
low 1024x768
HD Graphics 6000:
34  fps
med. 1366x768
HD Graphics 6000:
26.4  fps
low 1280x720
100%
HD Graphics 500:
17.7  fps
Fifa 15

Fifa 15

2014
low 1280x720
HD Graphics 6000:
50  fps
high 1366x768
HD Graphics 6000:
35.7  fps
ultra 1920x1080
HD Graphics 6000:
23.3  fps
Sims 4

Sims 4

2014
low 1024x768
100%
HD Graphics 500:
71.6  fps
201%
HD Graphics 6000:
144  fps
med. 1366x768
100%
HD Graphics 500:
13.7  fps
331%
HD Graphics 6000:
45.4  fps
high 1920x1080
HD Graphics 6000:
21.8  fps
ultra 1920x1080
HD Graphics 6000:
14.1  fps
low 1024x768
100%
HD Graphics 500:
10  fps
med. 1366x768
100%
HD Graphics 500:
6.3  fps
low 1024x768
100%
HD Graphics 500:
43.8  fps
215%
HD Graphics 6000:
94  fps
med. 1366x768
100%
HD Graphics 500:
19.1  fps
168%
HD Graphics 6000:
32  fps
high 1920x1080
HD Graphics 6000:
22  fps
ultra 1920x1080
HD Graphics 6000:
13  fps
Thief

Thief

2014
low 1024x768
HD Graphics 6000:
18  fps
med. 1366x768
HD Graphics 6000:
12  fps
low 1024x768
HD Graphics 6000:
40  fps
med. 1366x768
HD Graphics 6000:
13  fps
high 1366x768
HD Graphics 6000:
6.9  fps
low 1024x768
HD Graphics 6000:
32  fps
med. 1366x768
HD Graphics 6000:
22.2  fps
high 1366x768
HD Graphics 6000:
15.6  fps
ultra 1920x1080
HD Graphics 6000:
5.6  fps
low 1024x768
HD Graphics 6000:
48  fps
med. 1366x768
HD Graphics 6000:
36  fps
high 1366x768
HD Graphics 6000:
28  fps
low 1024x768
HD Graphics 6000:
23  fps
GRID 2

GRID 2

2013
low 1024x768
100%
HD Graphics 500:
29.3  fps
med. 1366x768
100%
HD Graphics 500:
14.4  fps
low 1024x768
HD Graphics 6000:
19  fps
med. 1366x768
HD Graphics 6000:
15.7  fps
high 1366x768
HD Graphics 6000:
12  fps
ultra 1920x1080
HD Graphics 6000:
6  fps
low 1280x720
100%
HD Graphics 500:
16.2 18 18.7 21 21.2 22.5 24.3 ~ 20 fps
215%
HD Graphics 6000:
42.9 43.9 ~ 43 fps
med. 1366x768
100%
HD Graphics 500:
8.8 9.6 9.8 11 13 ~ 10 fps
270%
HD Graphics 6000:
26.4 26.6 ~ 27 fps
high 1366x768
100%
HD Graphics 500:
7.9 8.9 9.7 ~ 9 fps
245%
HD Graphics 6000:
22.1  fps
ultra 1920x1080
100%
HD Graphics 500:
2.7  fps
low 1024x768
100%
HD Graphics 500:
21.5  fps
288%
HD Graphics 6000:
60 64.7 ~ 62 fps
med. 1366x768
100%
HD Graphics 500:
9.3  fps
366%
HD Graphics 6000:
33 34.5 ~ 34 fps
high 1366x768
HD Graphics 6000:
22 22.9 ~ 22 fps
Crysis 3

Crysis 3

2013
low 1024x768
HD Graphics 6000:
20.9  fps
med. 1366x768
HD Graphics 6000:
13.9  fps
low 1024x768
100%
HD Graphics 500:
19.3  fps
med. 1366x768
100%
HD Graphics 500:
9.1  fps
low 1024x768
100%
HD Graphics 500:
14 16.6 ~ 15 fps
med. 1366x768
100%
HD Graphics 500:
14  fps
low 1024x768
HD Graphics 6000:
57  fps
med. 1366x768
HD Graphics 6000:
36  fps
high 1366x768
HD Graphics 6000:
23  fps
ultra 1920x1080
HD Graphics 6000:
10  fps
low 1024x768
100%
HD Graphics 500:
12.7 22 ~ 17 fps
400%
HD Graphics 6000:
68  fps
med. 1366x768
100%
HD Graphics 500:
13.6  fps
287%
HD Graphics 6000:
39  fps
high 1366x768
HD Graphics 6000:
31  fps
ultra 1920x1080
HD Graphics 6000:
24  fps
Anno 2070

Anno 2070

2011
low 1024x768
100%
HD Graphics 500:
27.8  fps
med. 1366x768
100%
HD Graphics 500:
12.2  fps
low 1280x720
100%
HD Graphics 500:
11.2  fps
med. 1366x768
100%
HD Graphics 500:
7.6  fps
low 1024x768
100%
HD Graphics 500:
22.9  fps
high 1366x768
100%
HD Graphics 500:
11.1  fps
Dirt 3

Dirt 3

2011
low 800x600
100%
HD Graphics 500:
40.1  fps
med. 1024x768
100%
HD Graphics 500:
14.7  fps
low 1024x768
100%
HD Graphics 500:
54.5  fps
217%
HD Graphics 6000:
118  fps
med. 1360x768
100%
HD Graphics 500:
14.1  fps
305%
HD Graphics 6000:
43  fps
high 1360x768
HD Graphics 6000:
21  fps
ultra 1920x1080
HD Graphics 6000:
14  fps
Trackmania Nations Forever

Trackmania Nations Forever

2008
low 640x480
100%
HD Graphics 500:
119  fps
high 1024x768
100%
HD Graphics 500:
27.2  fps
World of Warcraft

World of Warcraft

2005
low 800x600
100%
HD Graphics 500:
46  fps
267%
HD Graphics 6000:
123  fps
med. 1024x768
HD Graphics 6000:
47  fps
high 1280x1024
HD Graphics 6000:
18  fps
ultra 1920x1080
HD Graphics 6000:
10  fps

Average Gaming Intel HD Graphics 500 → 100%

Average Gaming 30-70 fps → 100%

Average Gaming Intel HD Graphics 6000 → 265%

Average Gaming 30-70 fps → 284%

Intel HD Graphics 500Intel HD Graphics 6000
lowmed.highultraQHD4Klowmed.highultraQHD4K
Valorant9.09
Hearthstone23.92411.2
League of Legends28.220.213.912.6
Assassin´s Creed Odyssey2
Shadow of the Tomb Raider3
Strange Brigade
F1 201812
The Crew 25.5
Far Cry 511
World of Tanks enCore34.44.6
X-Plane 11.1164418.212.911.6
Middle-earth: Shadow of War10
Team Fortress 22017.264.237.4
Dirt 4105.641.3
Rocket League18.16.228.4
Prey4.9
For Honor8.7
Overwatch15.925
Rainbow Six Siege15.528.918.210.99.1
World of Warships19.152.316
Metal Gear Solid V16.49.73524.89.5
Dota 2 Reborn22155.65.154.733.916.715.4
Dirt Rally28.512.59322.812.9
F1 2014221655372113
Middle-earth: Shadow of Mordor17.7
Sims 471.613.714445.421.814.1
Risen 3: Titan Lords106.3
GRID: Autosport43.819.194322213
GRID 229.314.4
BioShock Infinite201092.7432722.08
Tomb Raider21.59.3623422
Dead Space 319.39.1
Counter-Strike: GO1514
Diablo III1713.668393124
Anno 207027.812.2
The Elder Scrolls V: Skyrim11.27.6
Deus Ex Human Revolution22.911.1
Dirt 340.114.7
StarCraft 254.514.1118432114
Trackmania Nations Forever11927.2
World of Warcraft46123471810
Intel HD Graphics 500Intel HD Graphics 6000
lowmed.highultraQHD4Klowmed.highultraQHD4K
< 30 fps
< 60 fps
< 120 fps
≥ 120 fps
33
5
2
24


7


3


1


< 30 fps
< 60 fps
< 120 fps
≥ 120 fps
4
6
6
2
5
8

12
2

9


For more games that might be playable and a list of all games and graphics cards visit our Gaming List

Add one or more devices and compare

In the following list you can select (and also search for) devices that should be added to the comparison. You can select more than one device.

restrict list:
v1.33
log 30. 17:51:52

#0 ran 0s before starting gpusingle class +0s ... 0s

#1 checking url part for id 7543 +0s ... 0s

#2 checking url part for id 5943 +0s ... 0s

#3 redirected to Ajax server, took 1759247512s time from redirect:0 +0s ... 0s

#4 did not recreate cache, as it is less than 5 days old! Created at Mon, 29 Sep 2025 12:07:01 +0200 +0s ... 0s

#5 composed specs +0.02s ... 0.02s

#6 did output specs +0s ... 0.02s

#7 start showIntegratedCPUs +0s ... 0.02s

#8 getting avg benchmarks for device 7543 +0.024s ... 0.044s

#9 got single benchmarks 7543 +0.014s ... 0.058s

#10 getting avg benchmarks for device 5943 +0.003s ... 0.061s

#11 got single benchmarks 5943 +0.005s ... 0.067s

#12 got avg benchmarks for devices +0s ... 0.067s

#13 min, max, avg, median took s +0.032s ... 0.099s

#14 before gaming benchmark output +0s ... 0.099s

#15 Got 220 rows for game benchmarks. +0.008s ... 0.107s

#16 composed SQL query for gamebenchmarks +0s ... 0.107s

#17 got data and put it in $dataArray +0.002s ... 0.109s

#18 benchmarks composed for output. +0.018s ... 0.127s

#19 calculated avg scores. +0s ... 0.127s

#20 return log +0.001s ... 0.128s

Please share our article, every link counts!
Mail Logo
> Expert Reviews and News on Laptops, Smartphones and Tech Innovations > Benchmarks / Tech > Graphics Card Comparison - Head 2 Head
Redaktion, 2017-09- 8 (Update: 2023-07- 1)