NVIDIA Quadro P5000 vs NVIDIA GeForce GTX 1050 Ti Max-Q vs NVIDIA Quadro P3200
NVIDIA Quadro P5000 ► remove from comparison
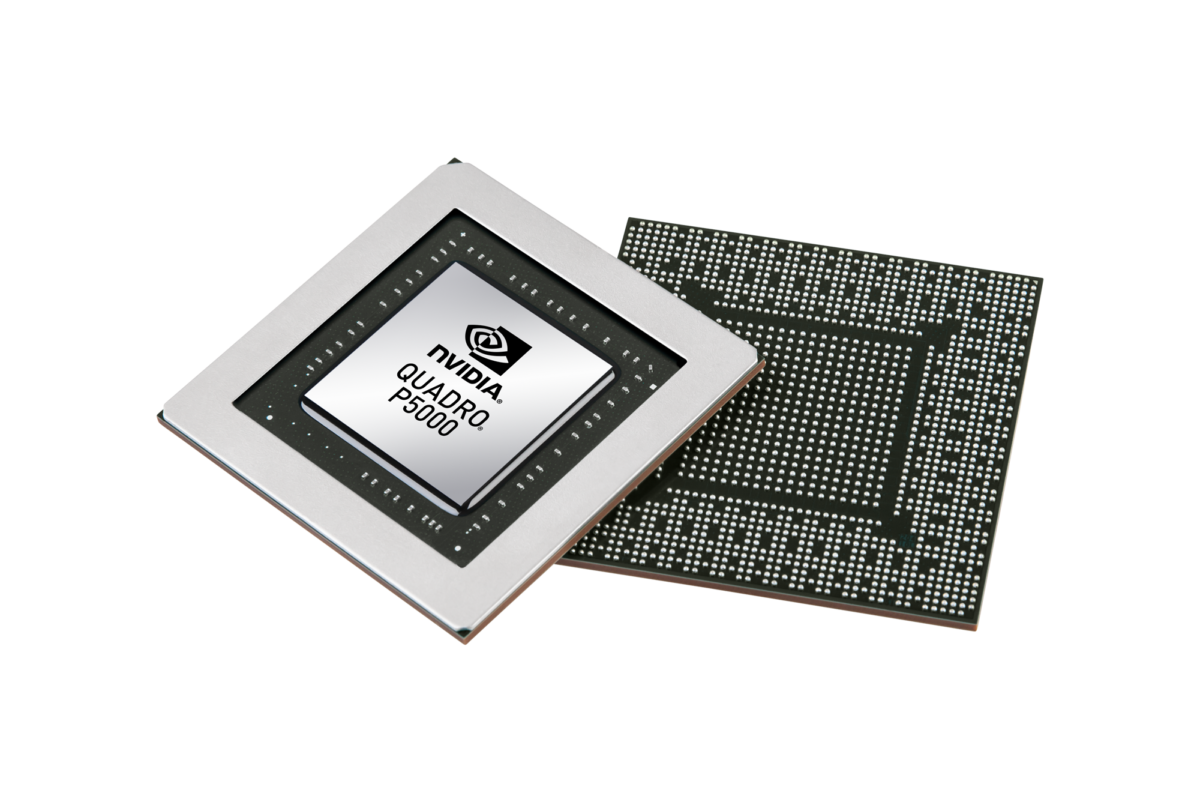
The Nvidia Quadro P5000 is a mobile high-end workstation graphics card for notebooks. Similar to the consumer GeForce GTX 1070 (Laptop), it is based on a slimmed-down GP104 chip with 2048 shaders. The graphics card is designed for the Kaby Lake generation and is the successor to the Quadro M5000M (Maxwell). However, the P5000 is equipped with 16 GB GDDR5 video memory (at a lower bandwidth), while GTX 1070 is limited to 8 GB. The clock rates range between 1164 MHz (base) to 1506 MHz (typical Boost) and up to 1657 MHz (max.).
The Quadro GPUs offer certified drivers , which are optimized for stability and performance in professional applications (CAD, DCC, medical, prospection, and visualizing applications). The performance in these areas is therefore much better compared to corresponding consumer GPUs.
Performance
The theoretical performance should be on par with the GTX 1070 (if the clocks did not take a massive hit), so the GPU should be significantly faster than the previous M5000M . Even the old M5500M could be beaten.
Power Consumption
The power consumption of the Quadro P5000 is similar to the old Quadro M5000M at 100 Watts TGP (max power consumption incl. memory) resp. 73.4 W TDP according to Nvidia. The card is therefore suited for large 17-inch notebooks.
NVIDIA GeForce GTX 1050 Ti Max-Q ► remove from comparison
The Nvidia GTX 1050 Ti with Max-Q design is a power efficient mainstream GPU for laptops based on the Pascal architecture and was announced in January 2017. Contrary to the faster models, the GTX 1050 uses the GP107 chip, which is manufactured in a 14 nm process at Samsung.
The clock is not the only difference compared to the regular GTX 1050 Ti though. The drivers for the Max-Q version were optimized for efficiency (and not performance; only for Max-Q models), there are optimized voltage converters for 1V operation, high-end cooling methods, and a 40 dB limit for the fan noise (with clock adjustments to ensure this at all times).
Features
The GP107 chip is manufactured in a 14 nm FinFET process at Samsung and offers a number of new features, including support for DisplayPort 1.4 (ready), HDMI 2.0b, HDR, Simultaneous Multi-Projection (SMP) as well as improved H.265 video de- and encoding (PlayReady 3.0). A full list of improvements and the new Pascal desktop GPUs is available in our dedicated Pascal architecture article .
Performance
The performance of the GeForce GTX 1050 Ti can vary quite a lot depending on the cooling performance of the laptop. Nvidia states that the Max-Q variant should be about 10 to 15% slower than a regular GTX 1050 Ti for laptops. Therefore, the GPU is most suited for Full HD and high quality settings for games of 2016.
Power Consumption
The power consumption of the GeForce GTX 1050 Ti with Max-Q design is rated at 40 to 46 Watt and therefore a lot lower than a regular GTX 1050 Ti for laptops (53 Watt). This means that the Max-Q GTX 1050 Ti is also suited for thin and light laptops.
NVIDIA Quadro P3200 ► remove from comparison
The Nvidia Quadro P3200 is a mobile high-end workstation graphics card for notebooks. As the slightly faster Quadro P4000 , it is based on the GP104 chip and uses 1792 CUDA cores. The memory bus however is slightly narrower at 192 versus 256 Bit. The clock rate should be similar, as Nvidia also specifies 5.3 TFLOPs of peak performance.
The Quadro GPUs offer certified drivers , which are optimized for stability and performance in professional applications (CAD, DCC, medical, prospection, and visualizing applications). The performance in these areas is therefore much better compared to corresponding consumer GPUs.
Performance
The performance should be slightly below the older Quadro P4000 , due to the same peak performance of the shaders but a slower memory bus. Compared to the old Quadro M3000M , the P3200 should offer a 93% better overall performance in SpecViewPerf 12.
Power Consumption
The power consumption of the Quadro P3200 is 75 Watts TGP (including memory) and therefore similar to the Quadro P3000.
NVIDIA Quadro P5000 NVIDIA GeForce GTX 1050 Ti Max-Q NVIDIA Quadro P3200 Quadro P Series Codename N17E-Q5 N17P-G1 Max-Q N18E-Q1 Architecture Pascal Pascal Pascal Pipelines 2048 - unified 768 - unified 1792 - unified Core Speed 1164 - 1506 (Boost) MHz 1151 – 1290 - 1290 – 1417 (Boost) MHz 708 - 1202 - 1228 (Boost) MHz Memory Speed 6006 MHz 7000 MHz 7008 MHz Memory Bus Width 256 Bit 128 Bit 192 Bit Memory Type GDDR5 GDDR5 GDDR5 Max. Amount of Memory 16 GB 4 GB 5.9 GB Shared Memory no no no API DirectX 12_1, Shader 5.0, OpenGL 4.5 DirectX 12_1, OpenGL 4.5 DirectX 12_1, Shader 5.0, OpenGL 4.5 Power Consumption 100 Watt 40 - 46 Watt 78 Watt technology 16 nm 16 nm 16 nm Features Optimus, PhysX, 3D Vision Pro, nView, Optimus Multi-Projection, VR Ready, G-SYNC, Vulkan, Multi Monitor Optimus,
PhysX, 3D Vision Pro, nView, Optimus Notebook Size large medium sized large Date of Announcement 11.01.2017 03.01.2018 27.02.2017 Link to Manufacturer Page www.nvidia.com www.nvidia.com
Benchmarks Performance Rating - 3DMark 11 + Fire Strike + Time Spy - Quadro P5000
6.7 pt (20%)
...
...
max:
Performance Rating - 3DMark 11 + Fire Strike + Time Spy - GeForce GTX 1050 Ti Max-Q
3.3 pt (10%)
...
NVIDIA GeForce GTX 1050 Ti Max-Q
...
max:
Performance Rating - 3DMark 11 + Fire Strike + Time Spy - Quadro P3200
5.7 pt (17%)
...
...
max:
3DMark - 3DMark Time Spy Score
min: 4823 avg: 4836 median: 4836 (14%) max: 4849 Points
min: 2361 avg: 2453 median: 2485 (7%) max: 2513 Points
min: 3979 avg: 4397 median: 4508.5 (13%) max: 4593 Points
3DMark - 3DMark Time Spy Graphics
min: 2898 avg: 3883 median: 3882.5 (10%) max: 4867 Points
min: 2196 avg: 2245 median: 2261 (6%) max: 2278 Points
min: 3732 avg: 4155 median: 4356 (12%) max: 4378 Points
3DMark - 3DMark Ice Storm Unlimited Graphics
401246 Points (45%)
324705 Points (37%)
419543 Points (48%)
3DMark - 3DMark Ice Storm Extreme Graphics
310648 Points (40%)
39641 Points (5%)
min: 109402 avg: 115672 median: 115672 (15%) max: 121942 Points
3DMark - 3DMark Cloud Gate Score
min: 28992 avg: 29216 median: 28999 (31%) max: 29658 Points
min: 20755 avg: 24100 median: 24021 (26%) max: 28253 Points
min: 30100 avg: 33023 median: 34178 (37%) max: 34702 Points
3DMark - 3DMark Cloud Gate Graphics
min: 83316 avg: 90788 median: 86679 (23%) max: 102368 Points
min: 41871 avg: 46017 median: 46952 (12%) max: 50801 Points
min: 57501 avg: 76643 median: 82506.5 (22%) max: 84059 Points
3DMark - 3DMark Fire Strike Standard Score
min: 12298 avg: 12367 median: 12363 (22%) max: 12441 Points
min: 6175 avg: 6548 median: 6688 (12%) max: 6753 Points
min: 10128 avg: 10881 median: 11058 (20%) max: 11116 Points
3DMark - 3DMark Fire Strike Standard Graphics
min: 14665 avg: 14774 median: 14666 (17%) max: 14990 Points
min: 6957 avg: 7281 median: 7324 (8%) max: 7428 Points
min: 11316 avg: 12246 median: 12554.5 (14%) max: 12558 Points
3DMark - 3DMark Ice Storm Graphics
min: 59012 avg: 208837 median: 208837 (25%) max: 358662 Points
min: 41029 avg: 73224 median: 60442 (7%) max: 118202 Points
min: 47258 avg: 93497 median: 110415 (13%) max: 122818 Points
3DMark 11 - 3DM11 Performance Score
min: 16158 avg: 16404 median: 16450 (23%) max: 16603 Points
min: 8250 avg: 8936 median: 9106 (13%) max: 9414 Points
min: 14244 avg: 14898 median: 15085.5 (21%) max: 15178 Points
3DMark 11 - 3DM11 Performance GPU
min: 19569 avg: 20096 median: 20096 (17%) max: 20623 Points
min: 8317 avg: 8781 median: 8752 (8%) max: 9079 Points
min: 14673 avg: 16233 median: 16619 (14%) max: 17021 Points
3DMark Vantage + NVIDIA Quadro P5000 3DMark Vantage - 3DM Vant. Perf. total
44689 Points (13%)
3DM Vant. Perf. total + NVIDIA GeForce GTX 1050 Ti Max-Q
min: 24827 avg: 29504 median: 29503.5 (9%) max: 34180 Points
3DM Vant. Perf. total + NVIDIA Quadro P3200
min: 45851 avg: 45999 median: 45999 (13%) max: 46147 Points
3DM Vant. Perf. GPU no PhysX + NVIDIA Quadro P5000 3DMark Vantage - 3DM Vant. Perf. GPU no PhysX
52917 Points (30%)
3DM Vant. Perf. GPU no PhysX + NVIDIA GeForce GTX 1050 Ti Max-Q
min: 25707 avg: 29448 median: 29448 (17%) max: 33189 Points
3DM Vant. Perf. GPU no PhysX + NVIDIA Quadro P3200
min: 46149 avg: 46624 median: 46624 (26%) max: 47099 Points
3DMark 06 3DMark 06 - Standard 1280x1024 + NVIDIA Quadro P5000
33236 Points (43%)
3DMark 06 - Standard 1280x1024 + NVIDIA GeForce GTX 1050 Ti Max-Q
min: 26796 avg: 28797 median: 28797 (38%) max: 30798 Points
3DMark 06 - Standard 1280x1024 + NVIDIA Quadro P3200
min: 24576 avg: 29207 median: 29206.5 (38%) max: 33837 Points
3DMark 06 - Standard 1024x768 + NVIDIA Quadro P5000
34781 Points (45%)
Model CPU GPU RAM Value 3DMark 06 - Standard 1024x768 HP ZBook 17 G4-Y3J82AV E3-1535M v6 Quadro P5000 1647 / 1647 MHz 16 GB 32 GB 34781
3DMark 06 - Standard 1024x768 + NVIDIA GeForce GTX 1050 Ti Max-Q
34786 Points (45%)
Unigine Valley 1.0 - Unigine Valley 1.0 DX
min: 73.9 avg: 74.4 median: 74.4 (24%) max: 74.8 fps
40.1 fps (13%)
min: 57.1 avg: 60 median: 59.9 (20%) max: 63 fps
Unigine Heaven 2.1 - Heaven 2.1 high
86 fps (16%)
SPECviewperf 11 + NVIDIA Quadro P5000 SPECviewperf 11 - specvp11 snx-01
min: 56.5 avg: 56.6 median: 56.6 (34%) max: 56.7 fps
specvp11 tcvis-02 + NVIDIA Quadro P5000 SPECviewperf 11 - specvp11 tcvis-02
min: 52.5 avg: 53 median: 53 (30%) max: 53.4 fps
specvp11 sw-02 + NVIDIA Quadro P5000 SPECviewperf 11 - specvp11 sw-02
min: 55.5 avg: 56.2 median: 56.2 (43%) max: 56.9 fps
specvp11 proe-05 + NVIDIA Quadro P5000 SPECviewperf 11 - specvp11 proe-05
min: 20.8 avg: 21.2 median: 21.2 (25%) max: 21.62 fps
specvp11 maya-03 + NVIDIA Quadro P5000 SPECviewperf 11 - specvp11 maya-03
57.9 fps (44%)
specvp11 lightwave-01 + NVIDIA Quadro P5000 SPECviewperf 11 - specvp11 lightwave-01
min: 57.7 avg: 58 median: 58 (62%) max: 58.2 fps
specvp11 ensight-04 + NVIDIA Quadro P5000 SPECviewperf 11 - specvp11 ensight-04
59.3 fps (28%)
specvp11 catia-03 + NVIDIA Quadro P5000 SPECviewperf 11 - specvp11 catia-03
min: 50.7 avg: 51.2 median: 51.2 (27%) max: 51.7 fps
SPECviewperf 12 + NVIDIA Quadro P5000 SPECviewperf 12 - specvp12 sw-03
min: 142.3 avg: 156.6 median: 159 (39%) max: 166.2 fps
specvp12 sw-03 + NVIDIA Quadro P3200
min: 102 avg: 130.4 median: 139.5 (35%) max: 148.4 fps
specvp12 snx-02 + NVIDIA Quadro P5000 SPECviewperf 12 - specvp12 snx-02
min: 155 avg: 168.7 median: 168.1 (25%) max: 183.6 fps
specvp12 snx-02 + NVIDIA Quadro P3200
min: 108.4 avg: 124.1 median: 126.3 (19%) max: 134.5 fps
specvp12 showcase-01 + NVIDIA Quadro P5000 SPECviewperf 12 - specvp12 showcase-01
min: 62.3 avg: 67.4 median: 67.2 (15%) max: 73 fps
specvp12 showcase-01 + NVIDIA Quadro P3200
min: 58.5 avg: 59.1 median: 59 (13%) max: 59.9 fps
specvp12 mediacal-01 + NVIDIA Quadro P5000 SPECviewperf 12 - specvp12 mediacal-01
min: 55.6 avg: 64.5 median: 65.4 (17%) max: 71.5 fps
specvp12 mediacal-01 + NVIDIA Quadro P3200
min: 43.68 avg: 46.2 median: 47.1 (12%) max: 48.7 fps
specvp12 maya-04 + NVIDIA Quadro P5000 SPECviewperf 12 - specvp12 maya-04
min: 88.8 avg: 97 median: 98.6 (27%) max: 102.1 fps
specvp12 maya-04 + NVIDIA Quadro P3200
min: 64.9 avg: 79.8 median: 81.5 (22%) max: 92.7 fps
specvp12 energy-01 + NVIDIA Quadro P5000 SPECviewperf 12 - specvp12 energy-01
min: 12 avg: 14 median: 14.5 (13%) max: 14.95 fps
specvp12 energy-01 + NVIDIA Quadro P3200
min: 9.04 avg: 10.2 median: 10.5 (9%) max: 10.72 fps
specvp12 creo-01 + NVIDIA Quadro P5000 SPECviewperf 12 - specvp12 creo-01
min: 117.2 avg: 125.3 median: 126.3 (51%) max: 131.5 fps
specvp12 creo-01 + NVIDIA Quadro P3200
min: 97.2 avg: 106.4 median: 107.1 (43%) max: 112.6 fps
specvp12 catia-04 + NVIDIA Quadro P5000 SPECviewperf 12 - specvp12 catia-04
min: 139.9 avg: 149 median: 150.2 (25%) max: 155.6 fps
specvp12 catia-04 + NVIDIA Quadro P3200
min: 105.1 avg: 117.3 median: 121.8 (20%) max: 126.8 fps
specvp12 3dsmax-05 + NVIDIA Quadro P5000 SPECviewperf 12 - specvp12 3dsmax-05
125 fps (22%)
specvp12 3dsmax-05 + NVIDIA Quadro P3200
min: 110 avg: 110.2 median: 110.2 (19%) max: 110.3 fps
SPECviewperf 13 specvp13 sw-04 + NVIDIA Quadro P3200 SPECviewperf 13 - specvp13 sw-04
min: 108.5 avg: 121 median: 121.1 (32%) max: 133.5 fps
specvp13 snx-03 + NVIDIA Quadro P3200 SPECviewperf 13 - specvp13 snx-03
min: 204.4 avg: 228.8 median: 233.7 (26%) max: 243.5 fps
specvp13 showcase-02 + NVIDIA Quadro P3200 SPECviewperf 13 - specvp13 showcase-02
min: 58.4 avg: 58.8 median: 58.7 (13%) max: 59.2 fps
specvp13 medical-02 + NVIDIA Quadro P3200 SPECviewperf 13 - specvp13 medical-02
min: 27.49 avg: 31.6 median: 30.4 (6%) max: 37.93 fps
specvp13 maya-05 + NVIDIA Quadro P3200 SPECviewperf 13 - specvp13 maya-05
min: 148.2 avg: 157.8 median: 157.1 (18%) max: 168.6 fps
specvp13 energy-02 + NVIDIA Quadro P3200 SPECviewperf 13 - specvp13 energy-02
min: 8.39 avg: 12.6 median: 8.5 (3%) max: 25.15 fps
specvp13 creo-02 + NVIDIA Quadro P3200 SPECviewperf 13 - specvp13 creo-02
min: 146.4 avg: 156.3 median: 156.8 (23%) max: 165.3 fps
specvp13 catia-05 + NVIDIA Quadro P3200 SPECviewperf 13 - specvp13 catia-05
min: 168.9 avg: 185.3 median: 185.8 (21%) max: 200.5 fps
specvp13 3dsmax-06 + NVIDIA Quadro P3200 SPECviewperf 13 - specvp13 3dsmax-06
min: 92.5 avg: 103.5 median: 106.7 (19%) max: 108 fps
Cinebench R10 Cinebench R10 Shading (32bit) + NVIDIA Quadro P5000 Cinebench R10 - Cinebench R10 Shading (32bit)
6830 Points (5%)
Cinebench R10 Shading (32bit) + NVIDIA GeForce GTX 1050 Ti Max-Q
min: 4597 avg: 5340 median: 4972 (4%) max: 6451 Points
Cinebench R10 Shading (32bit) + NVIDIA Quadro P3200
min: 6739 avg: 6793 median: 6819 (5%) max: 6822 Points
Cinebench R11.5 Cinebench R11.5 OpenGL 64 Bit + NVIDIA Quadro P5000 Cinebench R11.5 - Cinebench R11.5 OpenGL 64 Bit
min: 108.3 avg: 113.2 median: 113.2 (39%) max: 118.1 fps
Cinebench R11.5 OpenGL 64 Bit + NVIDIA GeForce GTX 1050 Ti Max-Q
min: 66.9 avg: 71.7 median: 71.7 (25%) max: 76.5 fps
Cinebench R11.5 OpenGL 64 Bit + NVIDIA Quadro P3200
min: 120 avg: 121.9 median: 120 (42%) max: 125.7 fps
Cinebench R15 + NVIDIA Quadro P5000 Cinebench R15 - Cinebench R15 OpenGL 64 Bit
min: 137.1 avg: 147.8 median: 138.4 (8%) max: 167.8 fps
Cinebench R15 OpenGL 64 Bit + NVIDIA GeForce GTX 1050 Ti Max-Q
min: 92.1 avg: 105.4 median: 102 (6%) max: 120.7 fps
Cinebench R15 OpenGL 64 Bit + NVIDIA Quadro P3200
min: 148.3 avg: 167.8 median: 172 (10%) max: 179.3 fps
Cinebench R15 OpenGL Ref. Match 64 Bit + NVIDIA Quadro P5000 Cinebench R15 - Cinebench R15 OpenGL Ref. Match 64 Bit
99.6 % (100%)
Cinebench R15 OpenGL Ref. Match 64 Bit + NVIDIA GeForce GTX 1050 Ti Max-Q
99.6 % (100%)
Cinebench R15 OpenGL Ref. Match 64 Bit + NVIDIA Quadro P3200
min: 99.6 avg: 99.7 median: 99.6 (100%) max: 100 %
GFXBench - GFXBench 5.0 Aztec Ruins High Tier Offscreen
49.5 fps (9%)
GFXBench - GFXBench 5.0 Aztec Ruins Normal Tier Offscreen
119.1 fps (9%)
GFXBench - GFXBench Car Chase Offscreen
262.2 fps (30%)
min: 108.8 avg: 124.2 median: 124.2 (14%) max: 139.5 fps
215.1 fps (24%)
GFXBench 3.1 - GFXBench Manhattan ES 3.1 Offscreen
377.6 fps (8%)
min: 168 avg: 184.9 median: 184.9 (4%) max: 201.7 fps
GFXBench 3.0 - GFXBench 3.0 Manhattan Offscreen
448.1 fps (26%)
min: 229.8 avg: 253.2 median: 253.2 (15%) max: 276.5 fps
GFXBench (DX / GLBenchmark) 2.7 + NVIDIA Quadro P5000 GFXBench (DX / GLBenchmark) 2.7 - GFXBench T-Rex HD Offscreen C24Z16
1192 fps (9%)
GFXBench T-Rex HD Offscreen C24Z16 + NVIDIA GeForce GTX 1050 Ti Max-Q
min: 501 avg: 531 median: 531 (4%) max: 561 fps
LuxMark v2.0 64Bit - LuxMark v2.0 Room GPU
min: 2299 avg: 2312 median: 2301 (10%) max: 2337 Samples/s
min: 1167 avg: 1201 median: 1200.5 (5%) max: 1234 Samples/s
min: 1842 avg: 2052 median: 2170 (10%) max: 2206 Samples/s
LuxMark v2.0 64Bit - LuxMark v2.0 Sala GPU
min: 4322 avg: 4334 median: 4323 (8%) max: 4357 Samples/s
min: 2100 avg: 2222 median: 2221.5 (4%) max: 2343 Samples/s
min: 3612 avg: 4038 median: 4192 (7%) max: 4383 Samples/s
ComputeMark v2.1 - ComputeMark v2.1 Result
min: 11533 avg: 11544 median: 11544 (12%) max: 11555 Points
min: 4515 avg: 4879 median: 4879 (5%) max: 5243 Points
min: 8654 avg: 8927 median: 8791 (10%) max: 9335 Points
Power Consumption - Furmark Stress Test Power Consumption - external Monitor *
140.7 Watt (20%)
73.1 Watt (10%)
Power Consumption - The Witcher 3 Power Consumption - external Monitor *
min: 141.8 avg: 147.9 median: 147.9 (21%) max: 154 Watt
75.8 Watt (11%)
111.4 Watt (16%)
Power Consumption - Witcher 3 Power Consumption *
min: 145.9 avg: 147.2 median: 147.2 (32%) max: 148.5 Watt
min: 82 avg: 90 median: 85 (19%) max: 103 Watt
min: 86 avg: 118.6 median: 127.1 (28%) max: 134 Watt
Power Consumption - Witcher 3 ultra Power Efficiency
min: 0.3468 avg: 0.4 median: 0.4 (36%) max: 0.3701 fps per Watt
min: 0.2379 avg: 0.3 median: 0.3 (29%) max: 0.3073 fps per Watt
min: 0.3171 avg: 0.4 median: 0.4 (36%) max: 0.536 fps per Watt
Power Consumption - Witcher 3 ultra Power Efficiency - external Monitor
min: 0.3468 avg: 0.4 median: 0.4 (29%) max: 0.3632 fps per Watt
0.3 fps per Watt (27%)
0.4 fps per Watt (31%)
Emissions Witcher 3 Fan Noise + NVIDIA Quadro P5000 Emissions - Witcher 3 Fan Noise
min: 41 avg: 43.2 median: 43.1 (69%) max: 45.6 dB(A)
Witcher 3 Fan Noise + NVIDIA GeForce GTX 1050 Ti Max-Q
min: 36.4 avg: 40.2 median: 38.4 (61%) max: 47.6 dB(A)
Witcher 3 Fan Noise + NVIDIA Quadro P3200
min: 35.7 avg: 41.1 median: 39.5 (63%) max: 49.5 dB(A)
Clock Speed - GPU Clock Witcher 3 ultra
1392 MHz (55%)
1240 MHz (49%)
Average Benchmarks NVIDIA Quadro P5000 → 100% n=23 Average Benchmarks NVIDIA GeForce GTX 1050 Ti Max-Q → 58% n=23 Average Benchmarks NVIDIA Quadro P3200 → 91% n=23
- Range of benchmark values for this graphics card
- Average benchmark values for this graphics card
* Smaller numbers mean a higher performance
1 This benchmark is not used for the average calculation
Game Benchmarks The following benchmarks stem from our benchmarks of review laptops. The performance depends on the used graphics memory, clock rate, processor, system settings, drivers, and operating systems. So the results don't have to be representative for all laptops with this GPU. For detailed information on the benchmark results, click on the fps number.
GeForce GTX 1050 Ti Max-Q:
133.2 fps
GeForce GTX 1050 Ti Max-Q:
56.7 fps
GeForce GTX 1050 Ti Max-Q:
44.3 fps
GeForce GTX 1050 Ti Max-Q:
27.2 fps
GeForce GTX 1050 Ti Max-Q:
11.3 fps
GeForce GTX 1050 Ti Max-Q:
67.1 fps
GeForce GTX 1050 Ti Max-Q:
40.5 fps
GeForce GTX 1050 Ti Max-Q:
34 fps
GeForce GTX 1050 Ti Max-Q:
30.4 fps
GeForce GTX 1050 Ti Max-Q:
9 fps
GeForce GTX 1050 Ti Max-Q:
83 89 [X] MSI GF75 8RD-001 Intel Core i7-8750H 2.2GHz
GeForce GTX 1050 Ti Max-Q
min:
61 fps, max:
89 fps
~ 86 fps
GeForce GTX 1050 Ti Max-Q:
47 50 [X] MSI GF75 8RD-001 Intel Core i7-8750H 2.2GHz
GeForce GTX 1050 Ti Max-Q
min:
40 fps, max:
60 fps
~ 49 fps
GeForce GTX 1050 Ti Max-Q:
43 46 [X] MSI GF75 8RD-001 Intel Core i7-8750H 2.2GHz
GeForce GTX 1050 Ti Max-Q
min:
38 fps, max:
56 fps
~ 45 fps
GeForce GTX 1050 Ti Max-Q:
40 43 [X] MSI GF75 8RD-001 Intel Core i7-8750H 2.2GHz
GeForce GTX 1050 Ti Max-Q
min:
33 fps, max:
53 fps
~ 42 fps
GeForce GTX 1050 Ti Max-Q:
29 [X] MSI GF75 8RD-001 Intel Core i7-8750H 2.2GHz
GeForce GTX 1050 Ti Max-Q
min:
24 fps, max:
37 fps
fps
GeForce GTX 1050 Ti Max-Q:
14 15 [X] MSI GF75 8RD-001 Intel Core i7-8750H 2.2GHz
GeForce GTX 1050 Ti Max-Q
min:
11 fps, max:
19 fps
~ 15 fps
GeForce GTX 1050 Ti Max-Q:
55.5 60.4 [X] MSI GF75 8RD-001 Intel Core i7-8750H 2.2GHz
GeForce GTX 1050 Ti Max-Q
min:
31.8 fps, max:
115.6 fps
~ 58 fps
GeForce GTX 1050 Ti Max-Q:
31.4 [X] MSI GF75 8RD-001 Intel Core i7-8750H 2.2GHz
GeForce GTX 1050 Ti Max-Q
min:
15.8 fps, max:
53.7 fps
49.8 ~ 41 fps
GeForce GTX 1050 Ti Max-Q:
23.5 [X] MSI GF75 8RD-001 Intel Core i7-8750H 2.2GHz
GeForce GTX 1050 Ti Max-Q
min:
12.1 fps, max:
39.8 fps
36.5 ~ 30 fps
GeForce GTX 1050 Ti Max-Q:
19.3 [X] MSI GF75 8RD-001 Intel Core i7-8750H 2.2GHz
GeForce GTX 1050 Ti Max-Q
min:
10.4 fps, max:
19.3 fps
28.3 ~ 24 fps
GeForce GTX 1050 Ti Max-Q:
4.7 fps
GeForce GTX 1050 Ti Max-Q:
73.2 fps
GeForce GTX 1050 Ti Max-Q:
47.9 fps
GeForce GTX 1050 Ti Max-Q:
36.1 fps
GeForce GTX 1050 Ti Max-Q:
35.3 fps
GeForce GTX 1050 Ti Max-Q:
12.9 fps
GeForce GTX 1050 Ti Max-Q:
134.5 fps
GeForce GTX 1050 Ti Max-Q:
87.4 fps
GeForce GTX 1050 Ti Max-Q:
73.7 fps
GeForce GTX 1050 Ti Max-Q:
65 fps
GeForce GTX 1050 Ti Max-Q:
13.2 fps
GeForce GTX 1050 Ti Max-Q:
100.1 fps
GeForce GTX 1050 Ti Max-Q:
57.3 fps
GeForce GTX 1050 Ti Max-Q:
47.9 fps
GeForce GTX 1050 Ti Max-Q:
44.8 fps
GeForce GTX 1050 Ti Max-Q:
17.3 fps
GeForce GTX 1050 Ti Max-Q:
193.6 fps
GeForce GTX 1050 Ti Max-Q:
128.7 fps
GeForce GTX 1050 Ti Max-Q:
80.5 fps
GeForce GTX 1050 Ti Max-Q:
61 fps
GeForce GTX 1050 Ti Max-Q:
22 fps
GeForce GTX 1050 Ti Max-Q:
64.8 fps
GeForce GTX 1050 Ti Max-Q:
41 fps
GeForce GTX 1050 Ti Max-Q:
37.5 fps
GeForce GTX 1050 Ti Max-Q:
35.9 fps
GeForce GTX 1050 Ti Max-Q:
11.3 fps
GeForce GTX 1050 Ti Max-Q:
118.7 fps
GeForce GTX 1050 Ti Max-Q:
46.3 fps
GeForce GTX 1050 Ti Max-Q:
45 fps
GeForce GTX 1050 Ti Max-Q:
37.5 fps
GeForce GTX 1050 Ti Max-Q:
10.1 fps
GeForce GTX 1050 Ti Max-Q:
67 fps
Quadro P3200:
89 [X] Lenovo ThinkPad P72-20MB000EGE Intel Core i7-8850H 2.6GHz
Quadro P3200
fps
GeForce GTX 1050 Ti Max-Q:
43 fps
Quadro P3200:
65 [X] Lenovo ThinkPad P72-20MB000EGE Intel Core i7-8850H 2.6GHz
Quadro P3200
fps
GeForce GTX 1050 Ti Max-Q:
34 fps
Quadro P3200:
56 [X] Lenovo ThinkPad P72-20MB000EGE Intel Core i7-8850H 2.6GHz
Quadro P3200
fps
GeForce GTX 1050 Ti Max-Q:
18 fps
Quadro P3200:
40 [X] Lenovo ThinkPad P72-20MB000EGE Intel Core i7-8850H 2.6GHz
Quadro P3200
fps
GeForce GTX 1050 Ti Max-Q:
7 fps
GeForce GTX 1050 Ti Max-Q:
122 fps
Quadro P3200:
147 [X] Lenovo ThinkPad P72-20MB000EGE Intel Core i7-8850H 2.6GHz
Quadro P3200
fps
GeForce GTX 1050 Ti Max-Q:
67 fps
Quadro P3200:
95 [X] Lenovo ThinkPad P72-20MB000EGE Intel Core i7-8850H 2.6GHz
Quadro P3200
fps
GeForce GTX 1050 Ti Max-Q:
61 fps
Quadro P3200:
88 [X] Lenovo ThinkPad P72-20MB000EGE Intel Core i7-8850H 2.6GHz
Quadro P3200
fps
GeForce GTX 1050 Ti Max-Q:
47 fps
Quadro P3200:
72 [X] Lenovo ThinkPad P72-20MB000EGE Intel Core i7-8850H 2.6GHz
Quadro P3200
fps
GeForce GTX 1050 Ti Max-Q:
20 fps
GeForce GTX 1050 Ti Max-Q:
97 fps
Quadro P3200:
129 [X] Lenovo ThinkPad P72-20MB000EGE Intel Core i7-8850H 2.6GHz
Quadro P3200
fps
GeForce GTX 1050 Ti Max-Q:
39 fps
Quadro P3200:
63 [X] Lenovo ThinkPad P72-20MB000EGE Intel Core i7-8850H 2.6GHz
Quadro P3200
fps
GeForce GTX 1050 Ti Max-Q:
35 fps
Quadro P3200:
57 [X] Lenovo ThinkPad P72-20MB000EGE Intel Core i7-8850H 2.6GHz
Quadro P3200
fps
GeForce GTX 1050 Ti Max-Q:
29 fps
Quadro P3200:
49 [X] Lenovo ThinkPad P72-20MB000EGE Intel Core i7-8850H 2.6GHz
Quadro P3200
fps
GeForce GTX 1050 Ti Max-Q:
11 fps
GeForce GTX 1050 Ti Max-Q:
134 fps
Quadro P3200:
199 [X] Lenovo ThinkPad P72-20MB000EGE Intel Core i7-8850H 2.6GHz
Quadro P3200
fps
GeForce GTX 1050 Ti Max-Q:
80 fps
Quadro P3200:
129 [X] Lenovo ThinkPad P72-20MB000EGE Intel Core i7-8850H 2.6GHz
Quadro P3200
fps
GeForce GTX 1050 Ti Max-Q:
62 fps
Quadro P3200:
103 [X] Lenovo ThinkPad P72-20MB000EGE Intel Core i7-8850H 2.6GHz
Quadro P3200
fps
GeForce GTX 1050 Ti Max-Q:
38 fps
Quadro P3200:
66 [X] Lenovo ThinkPad P72-20MB000EGE Intel Core i7-8850H 2.6GHz
Quadro P3200
fps
GeForce GTX 1050 Ti Max-Q:
17 fps
GeForce GTX 1050 Ti Max-Q:
100.3 fps
GeForce GTX 1050 Ti Max-Q:
39.2 fps
GeForce GTX 1050 Ti Max-Q:
34.9 fps
GeForce GTX 1050 Ti Max-Q:
26.8 fps
GeForce GTX 1050 Ti Max-Q:
8.3 fps
GeForce GTX 1050 Ti Max-Q:
60 fps
GeForce GTX 1050 Ti Max-Q:
49.1 fps
GeForce GTX 1050 Ti Max-Q:
45.3 fps
GeForce GTX 1050 Ti Max-Q:
42 fps
GeForce GTX 1050 Ti Max-Q:
14 fps
GeForce GTX 1050 Ti Max-Q:
76 91 91 ~ 86 fps
Quadro P3200:
98 [X] HP ZBook 17 G5-2ZC48EA Intel Core i7-8850H 2.6GHz
Quadro P3200
120 122 [X] Lenovo ThinkPad P72-20MB000EGE Intel Core i7-8850H 2.6GHz
Quadro P3200
~ 113 fps
GeForce GTX 1050 Ti Max-Q:
45 48 48 ~ 47 fps
Quadro P3200:
66 [X] HP ZBook 17 G5-2ZC48EA Intel Core i7-8850H 2.6GHz
Quadro P3200
79 80 [X] Lenovo ThinkPad P72-20MB000EGE Intel Core i7-8850H 2.6GHz
Quadro P3200
~ 75 fps
GeForce GTX 1050 Ti Max-Q:
41 44 44 ~ 43 fps
Quadro P3200:
62 [X] HP ZBook 17 G5-2ZC48EA Intel Core i7-8850H 2.6GHz
Quadro P3200
74 [X] Lenovo ThinkPad P72-20MB000EGE Intel Core i7-8850H 2.6GHz
Quadro P3200
74 ~ 70 fps
GeForce GTX 1050 Ti Max-Q:
38 38 41 ~ 39 fps
Quadro P3200:
59 [X] HP ZBook 17 G5-2ZC48EA Intel Core i7-8850H 2.6GHz
Quadro P3200
70 [X] Lenovo ThinkPad P72-20MB000EGE Intel Core i7-8850H 2.6GHz
Quadro P3200
70 ~ 66 fps
GeForce GTX 1050 Ti Max-Q:
13 13 14 ~ 13 fps
GeForce GTX 1050 Ti Max-Q:
92.7 fps
Quadro P3200:
100 101 ~ 101 fps
GeForce GTX 1050 Ti Max-Q:
80.3 fps
Quadro P3200:
86 86 ~ 86 fps
GeForce GTX 1050 Ti Max-Q:
69.4 fps
Quadro P3200:
72 73 ~ 73 fps
GeForce GTX 1050 Ti Max-Q:
39.5 fps
GeForce GTX 1050 Ti Max-Q:
61.5 75.1 ~ 68 fps
GeForce GTX 1050 Ti Max-Q:
36.6 37.7 ~ 37 fps
GeForce GTX 1050 Ti Max-Q:
23.3 25 ~ 24 fps
GeForce GTX 1050 Ti Max-Q:
9.2 fps
GeForce GTX 1050 Ti Max-Q:
92.3 fps
GeForce GTX 1050 Ti Max-Q:
42 fps
GeForce GTX 1050 Ti Max-Q:
34.3 fps
GeForce GTX 1050 Ti Max-Q:
30.4 fps
GeForce GTX 1050 Ti Max-Q:
58 fps
GeForce GTX 1050 Ti Max-Q:
41 fps
GeForce GTX 1050 Ti Max-Q:
33 fps
GeForce GTX 1050 Ti Max-Q:
27 fps
GeForce GTX 1050 Ti Max-Q:
13 fps
GeForce GTX 1050 Ti Max-Q:
119.5 fps
GeForce GTX 1050 Ti Max-Q:
69.4 fps
GeForce GTX 1050 Ti Max-Q:
64.3 fps
GeForce GTX 1050 Ti Max-Q:
57.9 fps
GeForce GTX 1050 Ti Max-Q:
18.9 fps
GeForce GTX 1050 Ti Max-Q:
105 fps
GeForce GTX 1050 Ti Max-Q:
55 fps
GeForce GTX 1050 Ti Max-Q:
41 fps
GeForce GTX 1050 Ti Max-Q:
31 fps
GeForce GTX 1050 Ti Max-Q:
13 fps
GeForce GTX 1050 Ti Max-Q:
129.8 fps
GeForce GTX 1050 Ti Max-Q:
123.6 fps
GeForce GTX 1050 Ti Max-Q:
115.7 fps
GeForce GTX 1050 Ti Max-Q:
112.6 fps
GeForce GTX 1050 Ti Max-Q:
65.2 fps
GeForce GTX 1050 Ti Max-Q:
249.1 fps
GeForce GTX 1050 Ti Max-Q:
169.1 fps
GeForce GTX 1050 Ti Max-Q:
112.5 fps
GeForce GTX 1050 Ti Max-Q:
42.3 fps
GeForce GTX 1050 Ti Max-Q:
142.4 fps
GeForce GTX 1050 Ti Max-Q:
85.6 fps
GeForce GTX 1050 Ti Max-Q:
68.3 fps
100%
Quadro P5000:
125.2 fps
47%
GeForce GTX 1050 Ti Max-Q:
58.9 fps
100%
Quadro P5000:
47.8 fps
45%
GeForce GTX 1050 Ti Max-Q:
21.7 fps
GeForce GTX 1050 Ti Max-Q:
68.6 96.7 ~ 83 fps
Quadro P3200:
133.7 [X] Lenovo ThinkPad P72-20MB000EGE Intel Core i7-8850H 2.6GHz
Quadro P3200
fps
100%
Quadro P5000:
83.9 fps
86%
Quadro P3200:
72 [X] Lenovo ThinkPad P72-20MB000EGE Intel Core i7-8850H 2.6GHz
Quadro P3200
fps
100%
Quadro P5000:
76.5 76.7 [X] HP ZBook 17 G4-Y3J82AV Intel Xeon E3-1535M v6 3.1GHz
Quadro P5000
~ 77 fps
51%
GeForce GTX 1050 Ti Max-Q:
35.3 40 41.9 ~ 39 fps
86%
Quadro P3200:
66 [X] Lenovo ThinkPad P72-20MB000EGE Intel Core i7-8850H 2.6GHz
Quadro P3200
fps
100%
Quadro P5000:
42.8 42.9 [X] HP ZBook 17 G4-Y3J82AV Intel Xeon E3-1535M v6 3.1GHz
Quadro P5000
~ 43 fps
86%
Quadro P3200:
36.8 [X] Lenovo ThinkPad P72-20MB000EGE Intel Core i7-8850H 2.6GHz
Quadro P3200
fps
100%
Quadro P5000:
27.5 27.6 [X] HP ZBook 17 G4-Y3J82AV Intel Xeon E3-1535M v6 3.1GHz
Quadro P5000
~ 28 fps
50%
GeForce GTX 1050 Ti Max-Q:
13.9 14.5 ~ 14 fps
Quadro P3200:
230.5 [X] Lenovo ThinkPad P72-20MB000EGE Intel Core i7-8850H 2.6GHz
Quadro P3200
fps
100%
Quadro P5000:
127.9 fps
52%
GeForce GTX 1050 Ti Max-Q:
63.8 68.2 ~ 66 fps
86%
Quadro P3200:
109.6 [X] Lenovo ThinkPad P72-20MB000EGE Intel Core i7-8850H 2.6GHz
Quadro P3200
fps
100%
Quadro P5000:
121.1 fps
54%
GeForce GTX 1050 Ti Max-Q:
64.9 65.5 ~ 65 fps
86%
Quadro P3200:
104.7 [X] Lenovo ThinkPad P72-20MB000EGE Intel Core i7-8850H 2.6GHz
Quadro P3200
fps
100%
Quadro P5000:
95.1 95.3 [X] HP ZBook 17 G4-Y3J82AV Intel Xeon E3-1535M v6 3.1GHz
Quadro P5000
~ 95 fps
53%
GeForce GTX 1050 Ti Max-Q:
49.5 50.4 ~ 50 fps
88%
Quadro P3200:
84 [X] Lenovo ThinkPad P72-20MB000EGE Intel Core i7-8850H 2.6GHz
Quadro P3200
fps
100%
Quadro P5000:
37.6 38.4 [X] HP ZBook 17 G4-Y3J82AV Intel Xeon E3-1535M v6 3.1GHz
Quadro P5000
~ 38 fps
50%
GeForce GTX 1050 Ti Max-Q:
19.2 19.2 ~ 19 fps
100%
Quadro P5000:
110.6 [X] HP ZBook 17 G4-Y3J82AV Intel Xeon E3-1535M v6 3.1GHz
Quadro P5000
fps
100%
Quadro P5000:
55 [X] HP ZBook 17 G4-Y3J82AV Intel Xeon E3-1535M v6 3.1GHz
Quadro P5000
fps
100%
Quadro P5000:
107 [X] HP ZBook 17 G4-Y3J82AV Intel Xeon E3-1535M v6 3.1GHz
Quadro P5000
fps
GeForce GTX 1050 Ti Max-Q:
137.3 fps
GeForce GTX 1050 Ti Max-Q:
104.6 fps
GeForce GTX 1050 Ti Max-Q:
89.5 154.8 ~ 122 fps
Quadro P3200:
172.5 [X] Lenovo ThinkPad P72-20MB000EGE Intel Core i7-8850H 2.6GHz
Quadro P3200
fps
GeForce GTX 1050 Ti Max-Q:
85.2 120 ~ 103 fps
Quadro P3200:
147.5 [X] Lenovo ThinkPad P72-20MB000EGE Intel Core i7-8850H 2.6GHz
Quadro P3200
fps
GeForce GTX 1050 Ti Max-Q:
51.7 58.1 ~ 55 fps
Quadro P3200:
97.2 [X] Lenovo ThinkPad P72-20MB000EGE Intel Core i7-8850H 2.6GHz
Quadro P3200
fps
100%
Quadro P5000:
98.6 [X] HP ZBook 17 G4-Y3J82AV Intel Xeon E3-1535M v6 3.1GHz
Quadro P5000
fps
52%
GeForce GTX 1050 Ti Max-Q:
49.8 53.1 ~ 51 fps
90%
Quadro P3200:
89 [X] Lenovo ThinkPad P72-20MB000EGE Intel Core i7-8850H 2.6GHz
Quadro P3200
fps
100%
Quadro P5000:
40.8 41.2 [X] HP ZBook 17 G4-Y3J82AV Intel Xeon E3-1535M v6 3.1GHz
Quadro P5000
~ 41 fps
51%
GeForce GTX 1050 Ti Max-Q:
20.7 21.1 ~ 21 fps
GeForce GTX 1050 Ti Max-Q:
112.5 fps
GeForce GTX 1050 Ti Max-Q:
85.8 fps
GeForce GTX 1050 Ti Max-Q:
51 fps
GeForce GTX 1050 Ti Max-Q:
43 fps
100%
Quadro P5000:
70.8 [X] HP ZBook 17 G4-Y3J82AV Intel Xeon E3-1535M v6 3.1GHz
Quadro P5000
fps
100%
Quadro P5000:
37.8 [X] HP ZBook 17 G4-Y3J82AV Intel Xeon E3-1535M v6 3.1GHz
Quadro P5000
fps
100%
Quadro P5000:
24 [X] HP ZBook 17 G4-Y3J82AV Intel Xeon E3-1535M v6 3.1GHz
Quadro P5000
fps
GeForce GTX 1050 Ti Max-Q:
285.4 fps
GeForce GTX 1050 Ti Max-Q:
233.9 fps
GeForce GTX 1050 Ti Max-Q:
117.7 fps
GeForce GTX 1050 Ti Max-Q:
70.5 fps
GeForce GTX 1050 Ti Max-Q:
37 fps
GeForce GTX 1050 Ti Max-Q:
63 fps
GeForce GTX 1050 Ti Max-Q:
41.3 fps
GeForce GTX 1050 Ti Max-Q:
35.8 fps
GeForce GTX 1050 Ti Max-Q:
15.7 fps
Quadro P3200:
212.9 [X] Lenovo ThinkPad P72-20MB000EGE Intel Core i7-8850H 2.6GHz
Quadro P3200
fps
GeForce GTX 1050 Ti Max-Q:
83.4 89.5 ~ 86 fps
Quadro P3200:
152 [X] Lenovo ThinkPad P72-20MB000EGE Intel Core i7-8850H 2.6GHz
Quadro P3200
fps
GeForce GTX 1050 Ti Max-Q:
41.9 42.5 ~ 42 fps
Quadro P3200:
113.6 [X] Lenovo ThinkPad P72-20MB000EGE Intel Core i7-8850H 2.6GHz
Quadro P3200
fps
GeForce GTX 1050 Ti Max-Q:
32.2 34.8 ~ 34 fps
Quadro P3200:
86.3 [X] Lenovo ThinkPad P72-20MB000EGE Intel Core i7-8850H 2.6GHz
Quadro P3200
fps
GeForce GTX 1050 Ti Max-Q:
14.6 15.7 ~ 15 fps
Quadro P3200:
143.7 [X] HP ZBook 17 G5-2ZC48EA Intel Core i7-8850H 2.6GHz
Quadro P3200
180.9 181.7 182 189 [X] Lenovo ThinkPad P72-20MB000EGE Intel Core i7-8850H 2.6GHz
Quadro P3200
~ 175 fps
Quadro P3200:
122.3 [X] HP ZBook 17 G5-2ZC48EA Intel Core i7-8850H 2.6GHz
Quadro P3200
139.7 144 146.3 148.7 [X] Lenovo ThinkPad P72-20MB000EGE Intel Core i7-8850H 2.6GHz
Quadro P3200
~ 140 fps
100%
Quadro P5000:
97.9 fps
86%
Quadro P3200:
77.4 84.6 85.2 [X] Lenovo ThinkPad P72-20MB000EGE Intel Core i7-8850H 2.6GHz
Quadro P3200
86 86.3 [X] HP ZBook 17 G5-2ZC48EA Intel Core i7-8850H 2.6GHz
Quadro P3200
~ 84 fps
100%
Quadro P5000:
84 84.8 [X] HP ZBook 17 G4-Y3J82AV Intel Xeon E3-1535M v6 3.1GHz
Quadro P5000
90 ~ 86 fps
83%
Quadro P3200:
65.8 71.1 72.1 [X] HP ZBook 17 G5-2ZC48EA Intel Core i7-8850H 2.6GHz
Quadro P3200
73 74 [X] Lenovo ThinkPad P72-20MB000EGE Intel Core i7-8850H 2.6GHz
Quadro P3200
~ 71 fps
100%
Quadro P5000:
35.8 36 [X] HP ZBook 17 G4-Y3J82AV Intel Xeon E3-1535M v6 3.1GHz
Quadro P5000
~ 36 fps
47%
GeForce GTX 1050 Ti Max-Q:
16.8 17.1 ~ 17 fps
77%
Quadro P3200:
27.6 fps
Quadro P3200:
184.1 [X] Lenovo ThinkPad P72-20MB000EGE Intel Core i7-8850H 2.6GHz
Quadro P3200
fps
Quadro P3200:
226.7 [X] Lenovo ThinkPad P72-20MB000EGE Intel Core i7-8850H 2.6GHz
Quadro P3200
fps
GeForce GTX 1050 Ti Max-Q:
90.2 92.7 ~ 91 fps
Quadro P3200:
145.1 [X] Lenovo ThinkPad P72-20MB000EGE Intel Core i7-8850H 2.6GHz
Quadro P3200
fps
100%
Quadro P5000:
127.7 [X] HP ZBook 17 G4-Y3J82AV Intel Xeon E3-1535M v6 3.1GHz
Quadro P5000
fps
51%
GeForce GTX 1050 Ti Max-Q:
62.5 67.5 ~ 65 fps
87%
Quadro P3200:
111.3 [X] Lenovo ThinkPad P72-20MB000EGE Intel Core i7-8850H 2.6GHz
Quadro P3200
fps
100%
Quadro P5000:
55.6 56.1 [X] HP ZBook 17 G4-Y3J82AV Intel Xeon E3-1535M v6 3.1GHz
Quadro P5000
~ 56 fps
52%
GeForce GTX 1050 Ti Max-Q:
27.7 29.3 ~ 29 fps
100%
Quadro P5000:
118.5 119 [X] HP ZBook 17 G4-Y3J82AV Intel Xeon E3-1535M v6 3.1GHz
Quadro P5000
~ 119 fps
100%
Quadro P5000:
44 44.2 [X] HP ZBook 17 G4-Y3J82AV Intel Xeon E3-1535M v6 3.1GHz
Quadro P5000
~ 44 fps
GeForce GTX 1050 Ti Max-Q:
168.6 fps
GeForce GTX 1050 Ti Max-Q:
143.9 fps
GeForce GTX 1050 Ti Max-Q:
112.7 fps
GeForce GTX 1050 Ti Max-Q:
101 fps
GeForce GTX 1050 Ti Max-Q:
34.4 fps
GeForce GTX 1050 Ti Max-Q:
111.9 fps
GeForce GTX 1050 Ti Max-Q:
104.2 fps
GeForce GTX 1050 Ti Max-Q:
98.1 fps
GeForce GTX 1050 Ti Max-Q:
93.5 fps
GeForce GTX 1050 Ti Max-Q:
46 fps
Quadro P3200:
187.6 [X] HP ZBook 17 G5-2ZC48EA Intel Core i7-8850H 2.6GHz
Quadro P3200
208.9 218.6 219.1 [X] Lenovo ThinkPad P72-20MB000EGE Intel Core i7-8850H 2.6GHz
Quadro P3200
~ 209 fps
Quadro P3200:
137.5 [X] HP ZBook 17 G5-2ZC48EA Intel Core i7-8850H 2.6GHz
Quadro P3200
141 148.2 149 [X] Lenovo ThinkPad P72-20MB000EGE Intel Core i7-8850H 2.6GHz
Quadro P3200
~ 144 fps
100%
Quadro P5000:
97.5 [X] HP ZBook 17 G4-Y3J82AV Intel Xeon E3-1535M v6 3.1GHz
Quadro P5000
fps
85%
Quadro P3200:
80.6 82.2 85 [X] HP ZBook 17 G5-2ZC48EA Intel Core i7-8850H 2.6GHz
Quadro P3200
86 [X] Lenovo ThinkPad P72-20MB000EGE Intel Core i7-8850H 2.6GHz
Quadro P3200
~ 83 fps
100%
Quadro P5000:
51.5 [X] HP ZBook 17 G4-Y3J82AV Intel Xeon E3-1535M v6 3.1GHz
Quadro P5000
53.4 54 ~ 53 fps
85%
Quadro P3200:
41.6 45.4 [X] HP ZBook 17 G5-2ZC48EA Intel Core i7-8850H 2.6GHz
Quadro P3200
46.1 [X] Lenovo ThinkPad P72-20MB000EGE Intel Core i7-8850H 2.6GHz
Quadro P3200
46.4 ~ 45 fps
100%
Quadro P5000:
35.6 [X] HP ZBook 17 G4-Y3J82AV Intel Xeon E3-1535M v6 3.1GHz
Quadro P5000
36 ~ 36 fps
78%
Quadro P3200:
28.2 fps
GeForce GTX 1050 Ti Max-Q:
150.4 fps
GeForce GTX 1050 Ti Max-Q:
143.3 fps
GeForce GTX 1050 Ti Max-Q:
78.9 fps
GeForce GTX 1050 Ti Max-Q:
34.5 fps
GeForce GTX 1050 Ti Max-Q:
35.5 fps
100%
Quadro P5000:
126.2 [X] HP ZBook 17 G4-Y3J82AV Intel Xeon E3-1535M v6 3.1GHz
Quadro P5000
129 ~ 128 fps
GeForce GTX 1050 Ti Max-Q:
228.2 fps
GeForce GTX 1050 Ti Max-Q:
202.6 fps
GeForce GTX 1050 Ti Max-Q:
202.1 fps
GeForce GTX 1050 Ti Max-Q:
170.1 fps
GeForce GTX 1050 Ti Max-Q:
433.4 fps
GeForce GTX 1050 Ti Max-Q:
200.4 fps
GeForce GTX 1050 Ti Max-Q:
186.7 fps
GeForce GTX 1050 Ti Max-Q:
126.7 fps
Average Gaming NVIDIA Quadro P5000 → 100% Average Gaming 30-70 fps → 100%
Average Gaming NVIDIA GeForce GTX 1050 Ti Max-Q → 50% Average Gaming 30-70 fps → 50%
Average Gaming NVIDIA Quadro P3200 → 84% Average Gaming 30-70 fps → 83%
 Deutsch
 English
 Español
 Français
 Italiano
 Nederlands
 Polski
 Português
 Русский
 Türkçe
 Svenska
 Chinese
 Magyar