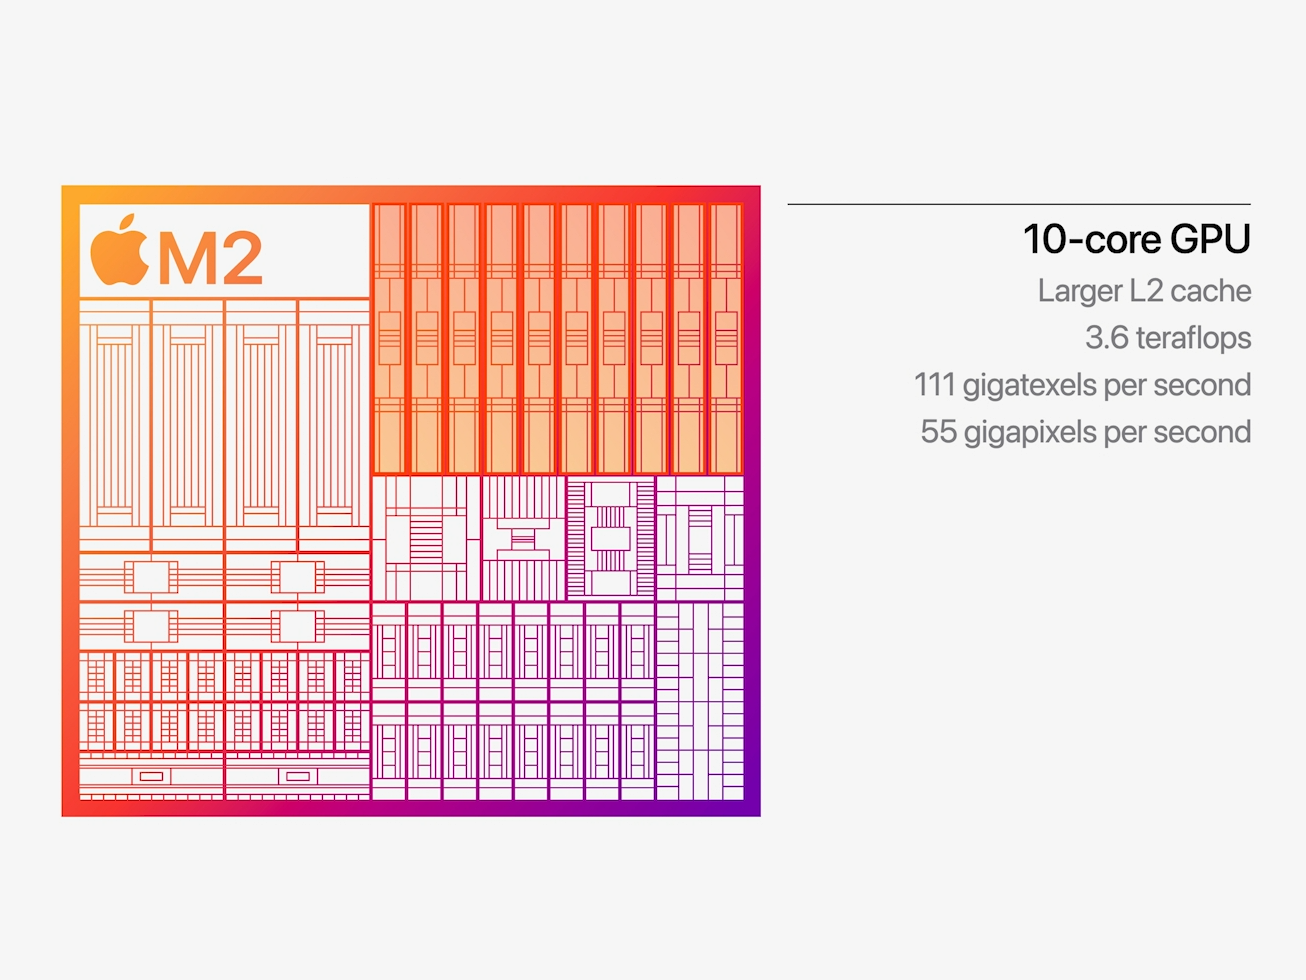
Apple M2 10-Core GPU ► remove from comparison The Apple M2 GPU is an integrated graphics card offering 10 cores designed by Apple and integrated in the Apple M2 SoC . It uses the unified memory architecture of the M2 SoC (up to 24 GB LPDDR5-6400 with 100 GB/s bandwidth) and should offer 160 execution units.
According to Apple it offers a 25% higher performance at slightly higher power consumption. The theoretical performance is rated at 3.6 Teraflops and therefore 1 TFLOP higher than the M1 8-core GPU . In our benchmarks, the GPU was able to top the M1 with up to 40%, but still stays behind the 14-core GPU in the M1 Pro. Compared to other iGPUs from AMD and Intel, the M2 benefits greatly from the unified memory architecture and the high bandwidth.
The M2 chip is manufactured in the second generation 5nm process at TSMC (most likely N5P). The power consumption is around 13.5 Watt (in our tests under load of the MBP13) and up to 15W according to Apple.
NVIDIA GeForce RTX 3060 ► remove from comparison The Nvidia GeForce RTX 3060 is a fast desktop graphics card. It is based on the GA106 Ampere chip and offers 12 GB GDDR6 graphics memory with a 192 Bit memory bus. It offers 3,584 cores and supports PCIe 4.0.
The performance is similar to the older GeForce RTX 2070 and therefore best suited for 1080p gaming of modern and demanding games in high settings.
The GA106 chip offers 3,840 FP32 ALUs of which half can also execute INT32 instructions (i.e. 1,920 INT32 ALUs). With Turing all shaders could still execute FP32 or INT32 instructions. The raytracing and tensor cores on the chip were also improved according to Nvidia. The Ampere chips also include an improved 5th generation video encoder (NVENC for H.264 and H.265) and a 7th generation decoder (for various formats now including AV1).
The GA106 chip is manufactured by Samsung in 8nm (8N), which is not quite able to keep up with the 7nm node at TSMC (e.g. used by AMD and also for the professional GA100 Ampere chip). The TDP of the RTX 3060 is specified at 170 Watt and therefore slightly higher than the previous RTX 2060 (160 Watt).
Apple M2 10-Core GPU NVIDIA GeForce RTX 3060 GeForce RTX 3000 Series Pipelines 10 - unified 3584 - unified Core Speed 1398 (Boost) MHz 1320 - 1777 (Boost) MHz Memory Type LPDDR5-6400 GDDR6 Shared Memory no no Power Consumption 15 Watt 170 Watt technology 5 nm 8 nm Date of Announcement 06.06.2022 12.01.2021 Predecessor M1 8-Core GPU Codename Ampere GA106 Architecture Ampere TMUs 112 ROPs 48 Raytracing Cores 28 Tensor / AI Cores 112 Memory Speed 15000 effective = 1875 MHz Memory Bus Width 192 Bit Max. Amount of Memory 12 GB Memory Bandwidth 360 GB/s API DirectX 12_2, Shader 6.6, OpenGL 4.6 Transistors 12 Billion Die Size 13250 mm² PCIe 4.0 Displays HDMI 2.1, DisplayPort 1.4a Features NVIDIA DLSS, NVIDIA Reflex, Resizable BAR, NVIDIA Broadcast, NVIDIA Ansel, NVIDIA ShadowPlay®, NVIDIA G-SYNC®, VR-ready, Nvidia Omniverse Link to Manufacturer Page www.nvidia.com
Performance Rating - 3DMark 11 + Fire Strike + Time Spy - NVIDIA GeForce RTX 3060
3DMark - 3DMark Speed Way Score
min: 2216 avg: 2221 median: 2220.5 (15%) max: 2225 Points
3DMark - 3DMark Steel Nomad
min: 1989 avg: 2038 median: 1995 (14%) max: 2131 Points
3DMark - 3DMark Steel Nomad Light
min: 2532 avg: 2574 median: 2573.5 (6%) max: 2615 Points
3DMark - 3DMark Wild Life Unlimited
min: 21302 avg: 23924 median: 24236 (12%) max: 25317 Points
GPU TDP ? TDP 13 W 94% 100%
3DMark - 3DMark Wild Life Extreme Unlimited
min: 5328 avg: 6533 median: 6823.5 (8%) max: 6987 Points
GPU TDP ? TDP 12 W TDP 13 W 89% 100% 98%
3DMark - 3DMark Solar Bay
min: 6654 avg: 7369 median: 7369 (3%) max: 8084 Points
GPU TDP ? TDP 170 W 18% 100%
3DMark - 3DMark Fire Strike Standard Score
min: 15750 avg: 19730 median: 20911 (32%) max: 21586 Points
GPU TDP ? TDP 170 W 100% 93%
3DMark - 3DMark Fire Strike Standard Graphics
min: 18711 avg: 21264 median: 21689 (20%) max: 22327 Points
GPU TDP ? TDP 170 W 100% 97%
3DMark - 3DMark Ice Storm Graphics
min: 326331 avg: 427886 median: 438544 (49%) max: 490039 Points
GPU TDP ? TDP 170 W 100% 95%
3DMark - 3DMark Time Spy Score
min: 7303 avg: 8886 median: 9026 (24%) max: 9782 Points
GPU TDP ? TDP 170 W 100% 98%
3DMark - 3DMark Time Spy Graphics
min: 7866 avg: 8558 median: 8578 (17%) max: 8897 Points
GPU TDP ? TDP 170 W 100% 100%
3DMark - 3DMark Ice Storm Unlimited Graphics
min: 478217 avg: 612349 median: 561364 (57%) max: 806680 Points
GPU TDP ? TDP 170 W 83% 100%
3DMark - 3DMark Ice Storm Extreme Graphics
min: 289413 avg: 358304 median: 356550 (42%) max: 419899 Points
GPU TDP ? TDP 170 W 100% 97%
3DMark - 3DMark Cloud Gate Score
min: 31438 avg: 56666 median: 56566 (53%) max: 72456 Points
GPU TDP ? TDP 170 W 100% 98%
3DMark - 3DMark Cloud Gate Graphics
min: 96330 avg: 118306 median: 120756 (30%) max: 124830 Points
GPU TDP ? TDP 170 W 100% 98%
3DMark - 3DMark Night Raid
min: 52521 avg: 62142 median: 65191 (62%) max: 68715 Points
3DMark - 3DMark Night Raid Graphics Score
min: 96914 avg: 102366 median: 104641 (40%) max: 105543 Points
3DMark 11 - 3DM11 Performance Score
min: 18861 avg: 26026 median: 26986 (33%) max: 30325 Points
GPU TDP ? TDP 170 W 100% 100%
3DMark 11 - 3DM11 Performance GPU
min: 24369 avg: 28359 median: 28939 (22%) max: 29959 Points
GPU TDP ? TDP 170 W 100% 99%
3DMark Vantage + NVIDIA GeForce RTX 3060 3DMark Vantage - 3DM Vant. Perf. total
min: 75053 avg: 83745 median: 81033 (23%) max: 100659 Points
GPU TDP ? TDP 170 W 89% 100%
3DM Vant. Perf. GPU no PhysX + NVIDIA GeForce RTX 3060 3DMark Vantage - 3DM Vant. Perf. GPU no PhysX
min: 77510 avg: 85087 median: 83168 (45%) max: 98243 Points
GPU TDP ? TDP 170 W 90% 100%
3DMark 05 - 3DMark 05 - Standard
min: 48871 avg: 65489 median: 62529 (68%) max: 84989 Points
GPU TDP ? TDP 170 W 96% 100%
3DMark 06 3DMark 06 - Standard 1280x1024 + NVIDIA GeForce RTX 3060 3DMark 06
min: 47148 avg: 54815 median: 51633 (67%) max: 66584 Points
GPU TDP ? TDP 170 W 88% 100%
Unigine Valley 1.0 - Unigine Valley 1.0 DX
min: 105.1 avg: 106.9 median: 106.7 (32%) max: 108.3 fps
GPU TDP ? TDP 170 W 100% 100%
Blender - Blender 3.3 Classroom CUDA *
min: 56 avg: 57 median: 57 (8%) max: 58 Seconds
Blender - Blender 3.3 Classroom OPTIX *
min: 31 avg: 32 median: 32 (12%) max: 33 Seconds
Blender - Blender 3.3 Classroom METAL *
min: 205 avg: 221 median: 221 (23%) max: 237 Seconds
GPU TDP 12 W TDP 13 W 104% 100%
SPECviewperf 12 + NVIDIA GeForce RTX 3060 SPECviewperf 12 - specvp12 sw-03
min: 47.8 avg: 65.3 median: 69.3 (17%) max: 75.9 fps
GPU TDP ? TDP 170 W 100% 99%
specvp12 snx-02 + NVIDIA GeForce RTX 3060 SPECviewperf 12 - specvp12 snx-02
min: 7.39 avg: 9 median: 8.9 (1%) max: 10.4 fps
GPU TDP ? TDP 170 W 100% 97%
specvp12 showcase-01 + NVIDIA GeForce RTX 3060 SPECviewperf 12 - specvp12 showcase-01
min: 72.6 avg: 108.4 median: 114.5 (20%) max: 119 fps
GPU TDP ? TDP 170 W 100% 88%
specvp12 mediacal-01 + NVIDIA GeForce RTX 3060 SPECviewperf 12 - specvp12 mediacal-01
min: 24.9 avg: 44.6 median: 43 (11%) max: 71.2 fps
GPU TDP ? TDP 170 W 95% 100%
specvp12 maya-04 + NVIDIA GeForce RTX 3060 SPECviewperf 12 - specvp12 maya-04
min: 66 avg: 167.5 median: 183 (50%) max: 204 fps
GPU TDP ? TDP 170 W 100% 85%
specvp12 energy-01 + NVIDIA GeForce RTX 3060 SPECviewperf 12 - specvp12 energy-01
min: 8.21 avg: 9.9 median: 10.1 (9%) max: 10.7 fps
GPU TDP ? TDP 170 W 100% 94%
specvp12 creo-01 + NVIDIA GeForce RTX 3060 SPECviewperf 12 - specvp12 creo-01
min: 45.4 avg: 52 median: 51.3 (21%) max: 57.9 fps
GPU TDP ? TDP 170 W 100% 96%
specvp12 catia-04 + NVIDIA GeForce RTX 3060 SPECviewperf 12 - specvp12 catia-04
min: 63.1 avg: 75.1 median: 75.8 (13%) max: 84.5 fps
GPU TDP ? TDP 170 W 100% 99%
specvp12 3dsmax-05 + NVIDIA GeForce RTX 3060 SPECviewperf 12 - specvp12 3dsmax-05
min: 98 avg: 192 median: 207.5 (31%) max: 225 fps
GPU TDP ? TDP 170 W 100% 83%
SPECviewperf 13 specvp13 sw-04 + NVIDIA GeForce RTX 3060 SPECviewperf 13 - specvp13 sw-04
min: 73.2 avg: 96.5 median: 102 (27%) max: 110 fps
GPU TDP ? TDP 170 W 100% 98%
specvp13 snx-03 + NVIDIA GeForce RTX 3060 SPECviewperf 13 - specvp13 snx-03
min: 13.4 avg: 16.3 median: 16 (2%) max: 18.8 fps
GPU TDP ? TDP 170 W 100% 97%
specvp13 showcase-02 + NVIDIA GeForce RTX 3060 SPECviewperf 13 - specvp13 showcase-02
min: 72.9 avg: 108.3 median: 114.5 (20%) max: 118 fps
GPU TDP ? TDP 170 W 100% 88%
specvp13 medical-02 + NVIDIA GeForce RTX 3060 SPECviewperf 13 - specvp13 medical-02
min: 44.9 avg: 52.8 median: 54.7 (9%) max: 55.7 fps
GPU TDP ? TDP 170 W 100% 91%
specvp13 maya-05 + NVIDIA GeForce RTX 3060 SPECviewperf 13 - specvp13 maya-05
min: 141 avg: 249 median: 264 (30%) max: 283 fps
GPU TDP ? TDP 170 W 100% 85%
specvp13 energy-02 + NVIDIA GeForce RTX 3060 SPECviewperf 13 - specvp13 energy-02
min: 13.1 avg: 14.3 median: 13.7 (4%) max: 18 fps
GPU TDP ? TDP 170 W 92% 100%
specvp13 creo-02 + NVIDIA GeForce RTX 3060 SPECviewperf 13 - specvp13 creo-02
min: 111 avg: 172.2 median: 181.5 (27%) max: 196 fps
GPU TDP ? TDP 170 W 100% 86%
specvp13 catia-05 + NVIDIA GeForce RTX 3060 SPECviewperf 13 - specvp13 catia-05
min: 92.9 avg: 105.7 median: 106.5 (12%) max: 115 fps
GPU TDP ? TDP 170 W 100% 97%
specvp13 3dsmax-06 + NVIDIA GeForce RTX 3060 SPECviewperf 13 - specvp13 3dsmax-06
min: 97.7 avg: 191.1 median: 204.5 (32%) max: 229 fps
GPU TDP ? TDP 170 W 100% 86%
SPECviewperf 2020 specvp2020 snx-04 1080p + NVIDIA GeForce RTX 3060 SPECviewperf 2020 - specvp2020 snx-04 1080p
specvp2020 medical-03 1080p + NVIDIA GeForce RTX 3060 SPECviewperf 2020 - specvp2020 medical-03 1080p
specvp2020 maya-06 1080p + NVIDIA GeForce RTX 3060 SPECviewperf 2020 - specvp2020 maya-06 1080p
specvp2020 energy-03 1080p + NVIDIA GeForce RTX 3060 SPECviewperf 2020 - specvp2020 energy-03 1080p
specvp2020 creo-03 1080p + NVIDIA GeForce RTX 3060 SPECviewperf 2020 - specvp2020 creo-03 1080p
specvp2020 catia-06 1080p + NVIDIA GeForce RTX 3060 SPECviewperf 2020 - specvp2020 catia-06 1080p
specvp2020 3dsmax-07 1080p + NVIDIA GeForce RTX 3060 SPECviewperf 2020 - specvp2020 3dsmax-07 1080p
specvp2020 solidworks-05 4k + NVIDIA GeForce RTX 3060 SPECviewperf 2020 - specvp2020 solidworks-05 4k
min: 79.7 avg: 86 median: 81.7 (20%) max: 105 fps
GPU TDP ? TDP 170 W 88% 100%
specvp2020 snx-04 4k + NVIDIA GeForce RTX 3060 SPECviewperf 2020 - specvp2020 snx-04 4k
min: 12.4 avg: 13.1 median: 12.9 (1%) max: 14.3 fps
GPU TDP ? TDP 170 W 96% 100%
specvp2020 medical-03 4k + NVIDIA GeForce RTX 3060 SPECviewperf 2020 - specvp2020 medical-03 4k
min: 8.39 avg: 11 median: 8.5 (5%) max: 22.2 fps
GPU TDP ? TDP 170 W 63% 100%
specvp2020 maya-06 4k + NVIDIA GeForce RTX 3060 SPECviewperf 2020 - specvp2020 maya-06 4k
min: 141 avg: 160 median: 162.5 (23%) max: 171 fps
GPU TDP ? TDP 170 W 100% 96%
specvp2020 energy-03 4k + NVIDIA GeForce RTX 3060 SPECviewperf 2020 - specvp2020 energy-03 4k
min: 13.1 avg: 22.4 median: 15.3 (3%) max: 38.2 fps
GPU TDP ? TDP 170 W 100% 95%
specvp2020 creo-03 4k + NVIDIA GeForce RTX 3060 SPECviewperf 2020 - specvp2020 creo-03 4k
min: 64 avg: 68.8 median: 68 (30%) max: 75.5 fps
GPU TDP ? TDP 170 W 99% 100%
specvp2020 catia-06 4k + NVIDIA GeForce RTX 3060 SPECviewperf 2020 - specvp2020 catia-06 4k
min: 17.5 avg: 26.9 median: 28.4 (19%) max: 29.6 fps
GPU TDP ? TDP 170 W 100% 88%
specvp2020 3dsmax-07 4k + NVIDIA GeForce RTX 3060 SPECviewperf 2020 - specvp2020 3dsmax-07 4k
min: 64.8 avg: 66.7 median: 65.7 (22%) max: 72.5 fps
GPU TDP ? TDP 170 W 97% 100%
Cinebench R10 Cinebench R10 Shading (32bit) + NVIDIA GeForce RTX 3060 Cinebench R10 - Cinebench R10 Shading (32bit)
min: 6811 avg: 13079 median: 13079 (9%) max: 19347 Points
GPU TDP ? TDP 170 W 100% 35%
Cinebench R11.5 Cinebench R11.5 OpenGL 64 Bit + NVIDIA GeForce RTX 3060 Cinebench R11.5 - Cinebench R11.5 OpenGL 64 Bit
Cinebench R15 + Apple M2 10-Core GPU Cinebench R15 - Cinebench R15 OpenGL 64 Bit
min: 128.65 avg: 132.8 median: 131 (8%) max: 140.5 fps
GPU TDP 12 W TDP 13 W 100% 93%
Cinebench R15 OpenGL 64 Bit + NVIDIA GeForce RTX 3060 GPU TDP 12 W TDP 13 W TDP 170 W 57% 53% 100%
Cinebench R15 OpenGL Ref. Match 64 Bit + Apple M2 10-Core GPU Cinebench R15 - Cinebench R15 OpenGL Ref. Match 64 Bit
GPU TDP 12 W TDP 13 W 100% 100%
Cinebench R15 OpenGL Ref. Match 64 Bit + NVIDIA GeForce RTX 3060 GPU TDP 12 W TDP 13 W TDP 170 W 100% 100% 100%
GFXBench - GFXBench 5.0 4K Aztec Ruins High Tier Offscreen
min: 35.6 avg: 43.9 median: 47.9 (18%) max: 48.6 fps
GPU TDP ? TDP 12 W TDP 13 W 85% 99% 100%
GFXBench - GFXBench 5.0 Aztec Ruins High Tier Offscreen
min: 68 avg: 96 median: 102.6 (18%) max: 110 fps
GPU TDP ? TDP 12 W TDP 13 W 76% 99% 100%
GFXBench - GFXBench 5.0 Aztec Ruins Normal Tier Offscreen
min: 208 avg: 267.5 median: 283.8 (21%) max: 296 fps
GPU TDP ? TDP 12 W TDP 13 W 83% 99% 100%
GFXBench - GFXBench Car Chase Offscreen
min: 136 avg: 197.6 median: 206.1 (19%) max: 232 fps
GPU TDP ? TDP 12 W TDP 13 W 82% 100% 85%
GFXBench 3.1 - GFXBench Manhattan ES 3.1 Offscreen
min: 247 avg: 318.6 median: 331.5 (7%) max: 374.6 fps
GPU TDP ? TDP 12 W TDP 13 W 82% 100% 85%
GFXBench 3.0 - GFXBench 3.0 Manhattan Offscreen
min: 411 avg: 503 median: 509.5 (21%) max: 557.2 fps
GPU TDP ? TDP 12 W TDP 13 W 83% 100% 97%
GFXBench (DX / GLBenchmark) 2.7 + Apple M2 10-Core GPU GFXBench (DX / GLBenchmark) 2.7 - GFXBench T-Rex HD Offscreen C24Z16
min: 628 avg: 824 median: 891.5 (7%) max: 931.9 fps
GPU TDP ? TDP 12 W TDP 13 W 78% 100% 98%
Antutu v9 - AnTuTu v9 GPU
min: 654168 avg: 728087 median: 728086 (73%) max: 802005 Points
Antutu v10 - AnTuTu v10 GPU
min: 781041 avg: 790061 median: 785809 (63%) max: 803332 Points
Basemark GPU 1.2 - Basemark GPU 1.2 Vulkan Official Medium Offscreen 1080
Basemark GPU 1.2 - Basemark GPU 1.2 Vulkan Official High Offscreen 2160
Geekbench 6.5 - Geekbench 6.5 GPU OpenCL
min: 27880 avg: 27900 median: 27900 (7%) max: 27920 Points
GPU TDP 12 W TDP 13 W 100% 100%
min: 90892 avg: 94285 median: 94284.5 (25%) max: 97677 Points
GPU TDP 12 W TDP 13 W TDP 170 W 30% 30% 100%
Geekbench 6.5 - Geekbench 6.5 GPU Vulkan
Geekbench 6.5 - Geekbench 6.5 GPU Metal
min: 42013 avg: 44473 median: 45460 (25%) max: 45946 Points
GPU TDP ? TDP 12 W TDP 13 W 91% 100% 99%
LuxMark v2.0 64Bit - LuxMark v2.0 Room GPU
min: 1647 avg: 2044 median: 1849.5 (7%) max: 2954 Samples/s
GPU TDP ? TDP 170 W 78% 100%
LuxMark v2.0 64Bit - LuxMark v2.0 Sala GPU
min: 6513 avg: 7115 median: 6856 (12%) max: 7996 Samples/s
GPU TDP ? TDP 170 W 100% 100%
ComputeMark v2.1 - ComputeMark v2.1 Result
min: 19540 avg: 20361 median: 20449.5 (17%) max: 20905 Points
GPU TDP ? TDP 170 W 99% 100%
Power Consumption - Furmark Stress Test Power Consumption - external Monitor *
min: 252.8 avg: 324.5 median: 296.1 (40%) max: 453 Watt
GPU TDP ? TDP 170 W 100% 129%
Power Consumption - The Witcher 3 Power Consumption - external Monitor *
min: 22.8 avg: 27.8 median: 26.9 (4%) max: 34.4 Watt
GPU TDP 12 W TDP 13 W 100% 100%
min: 229.9 avg: 276.1 median: 283.5 (40%) max: 307.5 Watt
GPU TDP ? TDP 12 W TDP 13 W TDP 170 W 100% 162% 162% 107%
Power Consumption - Witcher 3 Power Consumption *
min: 27.8 avg: 32.5 median: 30.8 (7%) max: 38.9 Watt
Power Consumption - GFXBench Aztec Ruins Normal Tier Offscreen Power Consumption 150cd *
min: 16 avg: 16.5 median: 16.7 (6%) max: 16.7 Watt
Power Consumption - Power Efficiency - Witcher 3 ultra
min: 1.007 avg: 1 median: 1 (91%) max: 1.108 fps per Watt
Power Consumption - Power Efficiency - Witcher 3 ultra external Monitor
min: 1.116 avg: 1.1 median: 1.1 (92%) max: 1.207 fps per Watt
min: 0.2059 avg: 0.3 median: 0.3 (27%) max: 0.332 fps per Watt
GPU TDP ? TDP 13 W TDP 170 W 24% 100% 29%
Power Consumption - Cyberpunk 2077 Power Consumption - external Monitor *
Emissions Witcher 3 Fan Noise + Apple M2 10-Core GPU Emissions - Witcher 3 Fan Noise
Average Benchmarks Apple M2 10-Core GPU → 100% n=4 Average Benchmarks NVIDIA GeForce RTX 3060 → 295% n=4
- Range of benchmark values for this graphics card
- Average benchmark values for this graphics card
* Smaller numbers mean a higher performance
1 This benchmark is not used for the average calculation
The following benchmarks stem from our benchmarks of review laptops. The performance depends on the used graphics memory, clock rate, processor, system settings, drivers, and operating systems. So the results don't have to be representative for all laptops with this GPU. For detailed information on the benchmark results, click on the fps number.
Apple M2 10-Core GPU NVIDIA GeForce RTX 3060 low med. high ultra QHD 4K low med. high ultra QHD 4K Borderlands 4 42.5 34.6 26.8 19.6 F1 25 228 183 138 12 7 3 Doom: The Dark Ages 61.7 54.1 49.8 47.9 32 The Elder Scrolls IV Oblivion Remastered 107.8 70.1 47 26.6 18 Assassin's Creed Shadows 47 40 32 23 19 Civilization 7 274 192.8 116.6 69.8 32.9 Monster Hunter Wilds 61.7 50.5 38.4 29.3 17.3 Kingdom Come Deliverance 2 111.2 82 67 48 34.4 19.5 Indiana Jones and the Great Circle 97 67 60 46 27 Stalker 2 64 56 47 39 28 16 Call of Duty Black Ops 6 114 104 69 65 48 30 Until Dawn 119 78 52 37 26 15 God of War Ragnarök 127 102 88 82 61 34 Final Fantasy XVI 65 64 54 49 33 18 Space Marine 2 96 78 75 67 46 24 Star Wars Outlaws 49 45 39 32 22 13 Black Myth: Wukong 75 56 42 22 17 9 Once Human 202 122 105.1 88 56 28 The First Descendant 153 99 81 68 43 23 F1 24 283 248 179 57 37 18 Alan Wake 2 54.1 36.2 18 Cyberpunk 2077 2.2 Phantom Liberty 128 98 83 72 42 18 Baldur's Gate 3 131 100 86.7 85 59 31 Hogwarts Legacy 56.4 39.7 22 The Witcher 3 v4 211 168.8 136.4 107.5 78.1 44.8 Vampire Bloodhunt 341 185 175.9 170.7 110.8 56.4 Ghostwire Tokyo 139.4 127.3 129.3 127.6 80.6 39 Tiny Tina's Wonderlands 165.7 134.5 92.8 72.4 52.9 28.4 Cyberpunk 2077 1.6 79.1 78.1 74.8 64.2 39.1 17.7 Elex 2 95.6 89.7 79.9 72.8 53.4 30.5 GRID Legends 198.9 160.2 134.2 97.9 79.1 51.2 Elden Ring 60 60 60 59.9 56.8 35.2 Dying Light 2 86 68.9 59.8 42.3 22.5 Rainbow Six Extraction 195 162 157 129 85 44 God of War 142 116 93 63 54 39 Halo Infinite 104 87.7 82.5 69.7 67.2 Farming Simulator 22 269 199 151 125 97.7 61.5 Battlefield 2042 144 116 96.5 84.5 64.3 38.7 Forza Horizon 5 192 124 110 66 57 41 Call of Duty Vanguard 102 113 96.3 86.8 62.2 35.6 Riders Republic 198 124 102 79 64 36 Guardians of the Galaxy 140 132 131 127 87 47 Back 4 Blood 214 191 178 115 57.4 Far Cry 6 156 120 105 93 70 39 Alan Wake Remastered 96.1 91.6 91.4 87 FIFA 22 282 311 306 299 282 201 New World 161 112 105 95.9 65.3 33.7 Deathloop 120 102 87.3 72 51.9 28 F1 2021 356 239 192 96 75 43 Monster Hunter Stories 2 144 144 144 144 125 Days Gone 203 137 122 89.8 64.8 36.5 Mass Effect Legendary Edition 117 112 114 78.8 Resident Evil Village 341 176 164 138 91.1 47.6 Outriders 122 146 125 104 70.2 36.9 Cyberpunk 2077 1.0 75.7 74.9 69.5 56.3 35.5 16.4 Immortals Fenyx Rising 142 100 99 91 71 45 Yakuza Like a Dragon 134 120 116 101 67.6 34.4 Call of Duty Black Ops Cold War 229 119 106 95.2 66.5 36.6 Assassin´s Creed Valhalla 118 102 85 75 60 38 Dirt 5 270 136 105 81 65 43 Watch Dogs Legion 123 108 94.7 59.1 45.1 26.8 Star Wars Squadrons 473 274 243 230 160 90.2 Mafia Definitive Edition 199 113 103 70.3 37 Crysis Remastered 281 123 77.9 57.5 37.4 22.7 Horizon Zero Dawn 198 142 118 100 77 42 Death Stranding 213 144 134 130 92.9 51.3 F1 2020 315 223 187 130 106 60 Borderlands 3 64 35 25 16 150 131 101 79 60 32 Control 240 115 84.1 54.2 26.3 Anno 1800 151 149 105 50.7 41.5 22.8 The Division 2 264 160 125 92 63 34 Far Cry New Dawn 136 114 109 97 87 50 Metro Exodus 177 99 74 56 50 32 Shadow of the Tomb Raider 79 35 31 27 20 175 133 125 116 80 43 Strange Brigade 432 214 171 149 115 67 Far Cry 5 174 137 128 120 93 48 X-Plane 11.11 157 141 114 97 Final Fantasy XV Benchmark 194 121 88 66 39 Rise of the Tomb Raider 435 267 150 128 56.8 Dota 2 Reborn 212 191 181 168 118 The Witcher 3 34 28 405 274 163 80 72 69 GTA V 180 176 165 97 81 82 Apple M2 10-Core GPU NVIDIA GeForce RTX 3060 low med. high ultra QHD 4K low med. high ultra QHD 4K < 30 fps < 60 fps < 120 fps ≥ 120 fps 2 2 1 2 3 1 < 30 fps < 60 fps < 120 fps ≥ 120 fps 3 19 55 7 30 41 1 10 41 27 4 15 38 15 9 27 40 3 25 40 11 2
log 16. 16:03:25
#0 ran 1s before starting gpusingle class +0s ... 0s
#1 checking url part for id 11368 +0s ... 0s
#2 checking url part for id 10960 +0s ... 0s
#3 redirected to Ajax server, took 1760623405s time from redirect:0 +0s ... 0s
#4 did not recreate cache, as it is less than 5 days old! Created at Thu, 16 Oct 2025 05:22:23 +0200 +0s ... 0s
#5 composed specs +0.024s ... 0.024s
#6 did output specs +0s ... 0.024s
#7 start showIntegratedCPUs +0s ... 0.024s
#8 getting avg benchmarks for device 11368 +0.013s ... 0.037s
#9 got single benchmarks 11368 +0.008s ... 0.045s
#10 getting avg benchmarks for device 10960 +0.004s ... 0.049s
#11 got single benchmarks 10960 +0.011s ... 0.06s
#12 got avg benchmarks for devices +0s ... 0.06s
#13 min, max, avg, median took s +0.049s ... 0.108s
#14 before gaming benchmark output +0s ... 0.109s
#15 Got 975 rows for game benchmarks. +0.031s ... 0.139s
#16 composed SQL query for gamebenchmarks +0s ... 0.139s
#17 got data and put it in $dataArray +0.007s ... 0.146s
#18 benchmarks composed for output. +0.037s ... 0.183s
#19 calculated avg scores. +0s ... 0.183s
#20 return log +0.002s ... 0.185s