

Intel Core i5-7200U vs AMD A10-9600P vs AMD A10-9620P
Intel Core i5-7200U
► remove from comparison
The Intel Core i5-7200U is a dual-core processor of the Kaby Lake architecture. It offers two CPU cores clocked at 2.5 - 3.1 GHz and integrates HyperThreading to work with up to 4 threads at once. The architectural differences are rather small compared to the Skylake generation, therefore the performance per MHz is very similar. The SoC includes a dual channel DDR4 memory controller and Intel HD Graphics 620 graphics card (clocked at 300 - 1000 MHz). It is manufactured in an improved 14nm FinFET process at Intel. Compared to the old Skylake based Core i5-6200U, the i5-7200U offers a 300 MHz higher clock speed.
AMD A10-9600P
► remove from comparison
The AMD A10-9600P is a mid-range APU of the Bristol Ridge series (7th generation of APUs) with 4 CPU-cores (two Excavator modules) clocked at 2.4 - 3.3 GHz. It was announced in mid 2016 and is based on the same silicon as Carrizo but with more and refined features. It is a ULV-chip with a TDP of 15 Watt and integrates a Radeon R5 graphics card (384 shader cores / 6 compute cores) and a dual-channel DDR4-1866 memory controller. As Carrizo its a full featured SoC that offers all I/O ports on the chip.
The A10-9600P is slightly faster than the old 15-Watt top model of Carrizo, the FX-8800P. Therefore, the CPU performance is similar to a Broadwell 15 Watt Core i3 like The i3-5010U. See our Bristol Ridge article for more information on the architecture and improvements compared to Carrizo.
AMD A10-9620P
► remove from comparison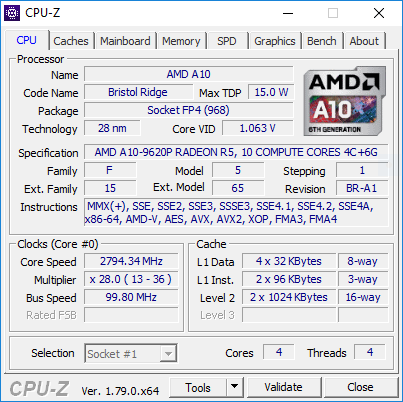
The AMD A10-9620P is a mid-range APU of the Bristol Ridge series (7th generation of APUs) with 4 CPU-cores (two Excavator modules) clocked at 2.5 - 3.4 GHz. In our tests the A10-9620P even hit 3.6 GHz.
It was announced in 2017 and is based on the same silicon as Carrizo but with more and refined features. It is a ULV-chip with a TDP of 15 Watt and integrates a Radeon R5 graphics card (384 shader cores / 6 compute cores) and a dual-channel DDR4-18600 memory controller. As Carrizo its a full featured SoC that offers all I/O ports on the chip.
The A10-9620P is a bit faster than the old 15-Watt top model of Carrizo, the FX-8800P. See our Bristol Ridge article for more information on the architecture and improvements compared to Carrizo.
| Model | Intel Core i5-7200U | AMD A10-9600P | AMD A10-9620P | ||||||||||||||||||||||||||||||||||||||||||||||||||||||||||||||||||||||||||||||||||||||||||||||||||||||||||||||||||||||||||||||||||||||||||||||||||||||||||||||||||||||||||||||||||||||||||||||||||||||||||||||||||||||||||||||||||||||||||||||||
| Codename | Kaby Lake | Bristol Ridge | Bristol Ridge | ||||||||||||||||||||||||||||||||||||||||||||||||||||||||||||||||||||||||||||||||||||||||||||||||||||||||||||||||||||||||||||||||||||||||||||||||||||||||||||||||||||||||||||||||||||||||||||||||||||||||||||||||||||||||||||||||||||||||||||||||
| Series | Intel Kaby Lake | AMD Bristol Ridge | AMD Bristol Ridge | ||||||||||||||||||||||||||||||||||||||||||||||||||||||||||||||||||||||||||||||||||||||||||||||||||||||||||||||||||||||||||||||||||||||||||||||||||||||||||||||||||||||||||||||||||||||||||||||||||||||||||||||||||||||||||||||||||||||||||||||||
| Series: Bristol Ridge Bristol Ridge |
|
|
| ||||||||||||||||||||||||||||||||||||||||||||||||||||||||||||||||||||||||||||||||||||||||||||||||||||||||||||||||||||||||||||||||||||||||||||||||||||||||||||||||||||||||||||||||||||||||||||||||||||||||||||||||||||||||||||||||||||||||||||||||
| Clock | 2500 - 3100 MHz | 2400 - 3300 MHz | 2500 - 3400 MHz | ||||||||||||||||||||||||||||||||||||||||||||||||||||||||||||||||||||||||||||||||||||||||||||||||||||||||||||||||||||||||||||||||||||||||||||||||||||||||||||||||||||||||||||||||||||||||||||||||||||||||||||||||||||||||||||||||||||||||||||||||
| L1 Cache | 128 KB | ||||||||||||||||||||||||||||||||||||||||||||||||||||||||||||||||||||||||||||||||||||||||||||||||||||||||||||||||||||||||||||||||||||||||||||||||||||||||||||||||||||||||||||||||||||||||||||||||||||||||||||||||||||||||||||||||||||||||||||||||||
| L2 Cache | 512 KB | 2 MB | 2 MB | ||||||||||||||||||||||||||||||||||||||||||||||||||||||||||||||||||||||||||||||||||||||||||||||||||||||||||||||||||||||||||||||||||||||||||||||||||||||||||||||||||||||||||||||||||||||||||||||||||||||||||||||||||||||||||||||||||||||||||||||||
| L3 Cache | 3 MB | ||||||||||||||||||||||||||||||||||||||||||||||||||||||||||||||||||||||||||||||||||||||||||||||||||||||||||||||||||||||||||||||||||||||||||||||||||||||||||||||||||||||||||||||||||||||||||||||||||||||||||||||||||||||||||||||||||||||||||||||||||
| Cores / Threads | 2 / 4 | 4 / 4 | 4 / 4 | ||||||||||||||||||||||||||||||||||||||||||||||||||||||||||||||||||||||||||||||||||||||||||||||||||||||||||||||||||||||||||||||||||||||||||||||||||||||||||||||||||||||||||||||||||||||||||||||||||||||||||||||||||||||||||||||||||||||||||||||||
| TDP | 15 Watt | 15 Watt | 15 Watt | ||||||||||||||||||||||||||||||||||||||||||||||||||||||||||||||||||||||||||||||||||||||||||||||||||||||||||||||||||||||||||||||||||||||||||||||||||||||||||||||||||||||||||||||||||||||||||||||||||||||||||||||||||||||||||||||||||||||||||||||||
| Technology | 14 nm | 28 nm | 28 nm | ||||||||||||||||||||||||||||||||||||||||||||||||||||||||||||||||||||||||||||||||||||||||||||||||||||||||||||||||||||||||||||||||||||||||||||||||||||||||||||||||||||||||||||||||||||||||||||||||||||||||||||||||||||||||||||||||||||||||||||||||
| max. Temp. | 100 °C | 90 °C | 90 °C | ||||||||||||||||||||||||||||||||||||||||||||||||||||||||||||||||||||||||||||||||||||||||||||||||||||||||||||||||||||||||||||||||||||||||||||||||||||||||||||||||||||||||||||||||||||||||||||||||||||||||||||||||||||||||||||||||||||||||||||||||
| Socket | BGA1356 | FP4 | |||||||||||||||||||||||||||||||||||||||||||||||||||||||||||||||||||||||||||||||||||||||||||||||||||||||||||||||||||||||||||||||||||||||||||||||||||||||||||||||||||||||||||||||||||||||||||||||||||||||||||||||||||||||||||||||||||||||||||||||||
| Features | Dual-Channel DDR4 Memory Controller, HyperThreading, AVX, AVX2, Quick Sync, Virtualization, AES-NI | Dual-Channel DDR3/DDR4-1866 Memory Controller, PCIe 3.0 x8 | Dual-Channel DDR3/DDR4-1866 Memory Controller, PCIe 3.0 x8 | ||||||||||||||||||||||||||||||||||||||||||||||||||||||||||||||||||||||||||||||||||||||||||||||||||||||||||||||||||||||||||||||||||||||||||||||||||||||||||||||||||||||||||||||||||||||||||||||||||||||||||||||||||||||||||||||||||||||||||||||||
| iGPU | Intel HD Graphics 620 (300 - 1000 MHz) | AMD Radeon R5 (Bristol Ridge) ( - 720 MHz) | AMD Radeon R5 (Bristol Ridge) ( - 758 MHz) | ||||||||||||||||||||||||||||||||||||||||||||||||||||||||||||||||||||||||||||||||||||||||||||||||||||||||||||||||||||||||||||||||||||||||||||||||||||||||||||||||||||||||||||||||||||||||||||||||||||||||||||||||||||||||||||||||||||||||||||||||
| Architecture | x86 | x86 | x86 | ||||||||||||||||||||||||||||||||||||||||||||||||||||||||||||||||||||||||||||||||||||||||||||||||||||||||||||||||||||||||||||||||||||||||||||||||||||||||||||||||||||||||||||||||||||||||||||||||||||||||||||||||||||||||||||||||||||||||||||||||
| $281 U.S. | |||||||||||||||||||||||||||||||||||||||||||||||||||||||||||||||||||||||||||||||||||||||||||||||||||||||||||||||||||||||||||||||||||||||||||||||||||||||||||||||||||||||||||||||||||||||||||||||||||||||||||||||||||||||||||||||||||||||||||||||||||
| Announced | |||||||||||||||||||||||||||||||||||||||||||||||||||||||||||||||||||||||||||||||||||||||||||||||||||||||||||||||||||||||||||||||||||||||||||||||||||||||||||||||||||||||||||||||||||||||||||||||||||||||||||||||||||||||||||||||||||||||||||||||||||
| Manufacturer | ark.intel.com | products.amd.com | |||||||||||||||||||||||||||||||||||||||||||||||||||||||||||||||||||||||||||||||||||||||||||||||||||||||||||||||||||||||||||||||||||||||||||||||||||||||||||||||||||||||||||||||||||||||||||||||||||||||||||||||||||||||||||||||||||||||||||||||||
| Transistors | 3100 Million | 3100 Million | |||||||||||||||||||||||||||||||||||||||||||||||||||||||||||||||||||||||||||||||||||||||||||||||||||||||||||||||||||||||||||||||||||||||||||||||||||||||||||||||||||||||||||||||||||||||||||||||||||||||||||||||||||||||||||||||||||||||||||||||||
| Die Size | 250 mm2 | 250 mm2 |

Benchmarks
| Model | CPU | GPU | RAM | Value |
|---|---|---|---|---|
| HP 17-y044ng | A10-9600P | Radeon R5 (Bristol Ridge) 720 MHz | 8 GB | 195 |
| HP Pavilion 15-aw004ng W8Y60EA | A10-9600P | Radeon R8 M445DX 1021 / 1000 MHz 2 GB | 8 GB | 215 |
| HP Pavilion 15-aw004ng | A10-9600P | Radeon R8 M445DX | 8 GB | 217 |
| HP Pavilion 15-aw004ng | A10-9600P | Radeon R5 (Bristol Ridge) | 8 GB | 217 |
| Model | CPU | GPU | RAM | Value |
|---|---|---|---|---|
| HP Pavilion 15z-bw000 | A10-9620P | Radeon R5 (Carrizo) | 8 GB | 230 |
| Model | CPU | GPU | RAM | Value |
|---|---|---|---|---|
| HP 17-y044ng | A10-9600P | Radeon R5 (Bristol Ridge) 720 MHz | 8 GB | 70 |
| HP Pavilion 15-aw004ng W8Y60EA | A10-9600P | Radeon R8 M445DX 1021 / 1000 MHz 2 GB | 8 GB | 75 |
| HP Pavilion 15-aw004ng | A10-9600P | Radeon R8 M445DX | 8 GB | 77 |
| HP Pavilion 15-aw004ng | A10-9600P | Radeon R5 (Bristol Ridge) | 8 GB | 77 |
| Model | CPU | GPU | RAM | Value |
|---|---|---|---|---|
| HP Pavilion 15z-bw000 | A10-9620P | Radeon R5 (Carrizo) | 8 GB | 72 |
| Model | CPU | GPU | RAM | Value |
|---|---|---|---|---|
| HP Pavilion 15-aw004ng W8Y60EA | A10-9600P | Radeon R8 M445DX 1021 / 1000 MHz 2 GB | 8 GB | 2.59 |
| HP Pavilion 15-aw004ng | A10-9600P | Radeon R8 M445DX | 8 GB | 2.6 |
| HP Pavilion 15-aw004ng | A10-9600P | Radeon R5 (Bristol Ridge) | 8 GB | 2.6 |
| Model | CPU | GPU | RAM | Value |
|---|---|---|---|---|
| HP Pavilion 15z-bw000 | A10-9620P | Radeon R5 (Carrizo) | 8 GB | 2.66 |
| Model | CPU | GPU | RAM | Value |
|---|---|---|---|---|
| HP Pavilion 15-aw004ng W8Y60EA | A10-9600P | Radeon R8 M445DX 1021 / 1000 MHz 2 GB | 8 GB | 0.87 |
| HP Pavilion 15-aw004ng | A10-9600P | Radeon R8 M445DX | 8 GB | 0.9 |
| HP Pavilion 15-aw004ng | A10-9600P | Radeon R5 (Bristol Ridge) | 8 GB | 0.9 |
| Model | CPU | GPU | RAM | Value |
|---|---|---|---|---|
| HP Pavilion 15z-bw000 | A10-9620P | Radeon R5 (Carrizo) | 8 GB | 0.81 |
| Model | CPU | GPU | RAM | Value |
|---|---|---|---|---|
| HP 17-y044ng | A10-9600P | Radeon R5 (Bristol Ridge) 720 MHz | 8 GB | 2340 |
| HP Pavilion 15-aw004ng | A10-9600P | Radeon R8 M445DX | 8 GB | 2447 |
| HP Pavilion 15-aw004ng | A10-9600P | Radeon R5 (Bristol Ridge) | 8 GB | 2447 |
| HP Pavilion 15-aw004ng W8Y60EA | A10-9600P | Radeon R8 M445DX 1021 / 1000 MHz 2 GB | 8 GB | 2520 |
| Model | CPU | GPU | RAM | Value |
|---|---|---|---|---|
| HP Pavilion 15z-bw000 | A10-9620P | Radeon R5 (Carrizo) | 8 GB | 2277 |
| Model | CPU | GPU | RAM | Value |
|---|---|---|---|---|
| HP 17-y044ng | A10-9600P | Radeon R5 (Bristol Ridge) 720 MHz | 8 GB | 5913 |
| HP Pavilion 15-aw004ng W8Y60EA | A10-9600P | Radeon R8 M445DX 1021 / 1000 MHz 2 GB | 8 GB | 6077 |
| HP Pavilion 15-aw004ng | A10-9600P | Radeon R8 M445DX | 8 GB | 6939 |
| HP Pavilion 15-aw004ng | A10-9600P | Radeon R5 (Bristol Ridge) | 8 GB | 6939 |
| Model | CPU | GPU | RAM | Value |
|---|---|---|---|---|
| HP Pavilion 15z-bw000 | A10-9620P | Radeon R5 (Carrizo) | 8 GB | 7420 |
| Model | CPU | GPU | RAM | Value |
|---|---|---|---|---|
| Lenovo Yoga 720-13IKB | i5-7200U | HD Graphics 620 | 8 GB | 11910 |
| Fujitsu LifeBook U937 | i5-7200U | HD Graphics 620 | 8 GB | 13012 |
| HP Elite x2 1012 G2-1LV76EA | i5-7200U | HD Graphics 620 1000 MHz | 8 GB | 13438 |
| Asus ZenBook Flip S UX370 | i5-7200U | HD Graphics 620 | 8 GB | 13479 |
| Lenovo ThinkPad X1 Carbon 2017-20HR0021GE | i5-7200U | HD Graphics 620 | 8 GB | 14137 |
| Lenovo Yoga 710-14IKB 80V4002HGE | i5-7200U | HD Graphics 620 1067 MHz | 8 GB | 14421 |
| HP Pavilion 17-x110ng | i5-7200U | Radeon R7 M440 1021 / 1000 MHz 2 GB | 8 GB | 14471 |
| Fujitsu Lifebook A557 | i5-7200U | HD Graphics 620 | 8 GB | 14554 |
| Model | CPU | GPU | RAM | Value |
|---|---|---|---|---|
| Fujitsu LifeBook U937 | i5-7200U | HD Graphics 620 | 8 GB | 5663 |
| Fujitsu Lifebook A557 | i5-7200U | HD Graphics 620 | 8 GB | 6395 |
| Lenovo ThinkPad X1 Carbon 2017-20HR0021GE | i5-7200U | HD Graphics 620 | 8 GB | 6404 |
| Asus ZenBook Flip S UX370 | i5-7200U | HD Graphics 620 | 8 GB | 6415 |
| HP Elite x2 1012 G2-1LV76EA | i5-7200U | HD Graphics 620 1000 MHz | 8 GB | 6416 |
| Lenovo Yoga 720-13IKB | i5-7200U | HD Graphics 620 | 8 GB | 6434 |
| HP Pavilion 17-x110ng | i5-7200U | Radeon R7 M440 1021 / 1000 MHz 2 GB | 8 GB | 6496 |
| Lenovo Yoga 710-14IKB 80V4002HGE | i5-7200U | HD Graphics 620 1067 MHz | 8 GB | 6524 |
| Model | CPU | GPU | RAM | Value |
|---|---|---|---|---|
| HP Pavilion 15-aw004ng | A10-9600P | Radeon R8 M445DX | 8 GB | 534 |
| HP Pavilion 15-aw004ng | A10-9600P | Radeon R5 (Bristol Ridge) | 8 GB | 534 |
| Model | CPU | GPU | RAM | Value |
|---|---|---|---|---|
| HP Pavilion 15z-bw000 | A10-9620P | Radeon R5 (Carrizo) | 8 GB | 470.9 |
| Model | CPU | GPU | RAM | Value |
|---|---|---|---|---|
| HP Pavilion 15-aw004ng | A10-9600P | Radeon R8 M445DX | 8 GB | 15.3 |
| HP Pavilion 15-aw004ng | A10-9600P | Radeon R5 (Bristol Ridge) | 8 GB | 15.3 |
| Model | CPU | GPU | RAM | Value |
|---|---|---|---|---|
| HP Pavilion 15z-bw000 | A10-9620P | Radeon R5 (Carrizo) | 8 GB | 14.41 |
| Model | CPU | GPU | RAM | Value |
|---|---|---|---|---|
| Dell XPS 13 9360 FHD i5 | i5-7200U | HD Graphics 620 1050 / 933 MHz | 7.9 GB | 464.8 |
| Model | CPU | GPU | RAM | Value |
|---|---|---|---|---|
| Dell XPS 13 9360 FHD i5 | i5-7200U | HD Graphics 620 1050 / 933 MHz | 7.9 GB | 14.9 |
| Model | CPU | GPU | RAM | Value |
|---|---|---|---|---|
| Asus Zenbook 3 UX390UA-GS041T | i5-7200U | HD Graphics 620 | 8 GB | 2094 |
| Dell XPS 13 9360 FHD i5 | i5-7200U | HD Graphics 620 1050 / 933 MHz | 7.9 GB | 2200 |
| Lenovo ThinkPad X1 Yoga 2017 20JD0015US | i5-7200U | HD Graphics 620 1000 MHz | 8 GB | 2258 |
| Lenovo ThinkPad Yoga 370-20JJS00100 | i5-7200U | HD Graphics 620 | 8 GB | 2296 |
| Lenovo ThinkPad T570-20H90002GE | i5-7200U | HD Graphics 620 | 8 GB | 2378 |
| Acer Aspire E5-575G-549D | i5-7200U | GeForce GTX 950M 928 / 5000 MHz 2 GB | 8 GB | 2418 |
| HP Pavilion x360 13t-u100 | i5-7200U | HD Graphics 620 1000 MHz | 8 GB | 2449 |
| Model | CPU | GPU | RAM | Value |
|---|---|---|---|---|
| HP Pavilion 15-aw004ng | A10-9600P | Radeon R8 M445DX | 8 GB | 1526 |
| HP Pavilion 15-aw004ng | A10-9600P | Radeon R5 (Bristol Ridge) | 8 GB | 1526 |
| Model | CPU | GPU | RAM | Value |
|---|---|---|---|---|
| HP Pavilion 15z-bw000 | A10-9620P | Radeon R5 (Carrizo) | 8 GB | 1329 |
| HP Pavilion 15z-bw000 | A10-9620P | Radeon R5 (Carrizo) | 8 GB | 1329 |
| Model | CPU | GPU | RAM | Value |
|---|---|---|---|---|
| HP Pavilion 15-aw004ng | A10-9600P | Radeon R8 M445DX | 8 GB | 16.34 |
| HP Pavilion 15-aw004ng | A10-9600P | Radeon R5 (Bristol Ridge) | 8 GB | 16.34 |
| Model | CPU | GPU | RAM | Value |
|---|---|---|---|---|
| HP Pavilion 15z-bw000 | A10-9620P | Radeon R5 (Carrizo) | 8 GB | 16.3 |
| Model | CPU | GPU | RAM | Value |
|---|---|---|---|---|
| HP Pavilion 15-aw004ng | A10-9600P | Radeon R8 M445DX | 8 GB | 85.4 |
| HP Pavilion 15-aw004ng | A10-9600P | Radeon R5 (Bristol Ridge) | 8 GB | 85.4 |
| Model | CPU | GPU | RAM | Value |
|---|---|---|---|---|
| HP Pavilion 15z-bw000 | A10-9620P | Radeon R5 (Carrizo) | 8 GB | 76.6 |
| Model | CPU | GPU | RAM | Value |
|---|---|---|---|---|
| Lenovo ThinkPad X1 Yoga 2017 20JD0015US | i5-7200U | HD Graphics 620 1000 MHz | 8 GB | 0.172 |
| Dell Latitude 5280 | i5-7200U | HD Graphics 620 300 MHz | 4 GB | 0.181 |
| HP Envy 13-ad065nr | i5-7200U | HD Graphics 620 300 / 933 MHz | 8 GB | 0.187 |
| Lenovo ThinkPad Yoga 370-20JJS00100 | i5-7200U | HD Graphics 620 | 8 GB | 0.189 |
| Dell Latitude 5580 | i5-7200U | HD Graphics 620 300 MHz | 8 GB | 0.189 |
| Microsoft Surface Laptop i5 | i5-7200U | HD Graphics 620 300 / 933 MHz | 4 GB | 0.189 |
| Asus Zenbook 3 UX390UA-GS041T | i5-7200U | HD Graphics 620 | 8 GB | 0.19 |
| Dell XPS 13 9360 FHD i5 | i5-7200U | HD Graphics 620 1050 / 933 MHz | 7.9 GB | 0.19 |
| Samsung Notebook 9 NP900X3N-K01US | i5-7200U | HD Graphics 620 300 / 1067 MHz | 8 GB | 0.19 |
| Acer Aspire E5-575G-549D | i5-7200U | GeForce GTX 950M 928 / 5000 MHz 2 GB | 8 GB | 0.196 |
| HP Pavilion x360 13t-u100 | i5-7200U | HD Graphics 620 1000 MHz | 8 GB | 0.196 |
| Lenovo ThinkPad T570-20H90002GE | i5-7200U | HD Graphics 620 | 8 GB | 0.196 |
| Asus VivoBook S15 S510UA | i5-7200U | HD Graphics 620 300 / 1067 MHz | 16 GB | 0.273 |
| Model | CPU | GPU | RAM | Value |
|---|---|---|---|---|
| HP Pavilion 15-aw004ng | A10-9600P | Radeon R8 M445DX | 8 GB | 0.211 |
| HP Pavilion 15-aw004ng | A10-9600P | Radeon R5 (Bristol Ridge) | 8 GB | 0.211 |
| Model | CPU | GPU | RAM | Value |
|---|---|---|---|---|
| Lenovo ThinkPad X1 Yoga 2017 20JD0015US | i5-7200U | HD Graphics 620 1000 MHz | 8 GB | 0.278 |
| Dell Latitude 5280 | i5-7200U | HD Graphics 620 300 MHz | 4 GB | 0.299 |
| Asus VivoBook S15 S510UA | i5-7200U | HD Graphics 620 300 / 1067 MHz | 16 GB | 0.304 |
| Asus Zenbook 3 UX390UA-GS041T | i5-7200U | HD Graphics 620 | 8 GB | 0.32 |
| Microsoft Surface Laptop i5 | i5-7200U | HD Graphics 620 300 / 933 MHz | 4 GB | 0.321 |
| Lenovo ThinkPad T570-20H90002GE | i5-7200U | HD Graphics 620 | 8 GB | 0.322 |
| Dell Latitude 5580 | i5-7200U | HD Graphics 620 300 MHz | 8 GB | 0.322 |
| HP Envy 13-ad065nr | i5-7200U | HD Graphics 620 300 / 933 MHz | 8 GB | 0.323 |
| Samsung Notebook 9 NP900X3N-K01US | i5-7200U | HD Graphics 620 300 / 1067 MHz | 8 GB | 0.325 |
| Lenovo ThinkPad Yoga 370-20JJS00100 | i5-7200U | HD Graphics 620 | 8 GB | 0.327 |
| HP Pavilion x360 13t-u100 | i5-7200U | HD Graphics 620 1000 MHz | 8 GB | 0.328 |
| Dell XPS 13 9360 FHD i5 | i5-7200U | HD Graphics 620 1050 / 933 MHz | 7.9 GB | 0.329 |
| Acer Aspire E5-575G-549D | i5-7200U | GeForce GTX 950M 928 / 5000 MHz 2 GB | 8 GB | 0.332 |
| Model | CPU | GPU | RAM | Value |
|---|---|---|---|---|
| HP Pavilion 15-aw004ng | A10-9600P | Radeon R8 M445DX | 8 GB | 0.342 |
| HP Pavilion 15-aw004ng | A10-9600P | Radeon R5 (Bristol Ridge) | 8 GB | 0.342 |
| Model | CPU | GPU | RAM | Value |
|---|---|---|---|---|
| Asus VivoBook S15 S510UA | i5-7200U | HD Graphics 620 300 / 1067 MHz | 16 GB | 1.8 |
| Lenovo ThinkPad X1 Yoga 2017 20JD0015US | i5-7200U | HD Graphics 620 1000 MHz | 8 GB | 1.8 |
| HP Envy 13-ad065nr | i5-7200U | HD Graphics 620 300 / 933 MHz | 8 GB | 1.8 |
| Acer Aspire E5-575G-549D | i5-7200U | GeForce GTX 950M 928 / 5000 MHz 2 GB | 8 GB | 1.9 |
| Asus Zenbook 3 UX390UA-GS041T | i5-7200U | HD Graphics 620 | 8 GB | 1.9 |
| Dell XPS 13 9360 FHD i5 | i5-7200U | HD Graphics 620 1050 / 933 MHz | 7.9 GB | 1.9 |
| HP Pavilion x360 13t-u100 | i5-7200U | HD Graphics 620 1000 MHz | 8 GB | 1.9 |
| Lenovo ThinkPad T570-20H90002GE | i5-7200U | HD Graphics 620 | 8 GB | 1.9 |
| Lenovo ThinkPad Yoga 370-20JJS00100 | i5-7200U | HD Graphics 620 | 8 GB | 1.9 |
| Dell Latitude 5580 | i5-7200U | HD Graphics 620 300 MHz | 8 GB | 1.9 |
| Dell Latitude 5280 | i5-7200U | HD Graphics 620 300 MHz | 4 GB | 1.9 |
| Microsoft Surface Laptop i5 | i5-7200U | HD Graphics 620 300 / 933 MHz | 4 GB | 1.9 |
| Samsung Notebook 9 NP900X3N-K01US | i5-7200U | HD Graphics 620 300 / 1067 MHz | 8 GB | 1.9 |
| Model | CPU | GPU | RAM | Value |
|---|---|---|---|---|
| HP Pavilion 15-aw004ng | A10-9600P | Radeon R8 M445DX | 8 GB | 1.5 |
| HP Pavilion 15-aw004ng | A10-9600P | Radeon R5 (Bristol Ridge) | 8 GB | 1.5 |
| Model | CPU | GPU | RAM | Value |
|---|---|---|---|---|
| Lenovo Ideapad 330-15IKB-81DC00SWGE | i5-7200U | Radeon 530 891 / 1000 MHz 2 GB | 8 GB | 3700 |
| Acer Aspire E5-575G-549D | i5-7200U | GeForce GTX 950M 928 / 5000 MHz 2 GB | 8 GB | 4225 |
| Acer Aspire 5 A515-51G-51RL | i5-7200U | GeForce MX150 1683 / 1502 MHz 2 GB | 8 GB | 4273 |
| Lenovo IdeaPad 320s-14IKB | i5-7200U | GeForce 920MX 980 / 1253 MHz 2 GB | 8 GB | 4322 |
| Lenovo V320-17IKB 81AH0002GE | i5-7200U | HD Graphics 620 1000 MHz | 8 GB | 4343 |
| Lenovo ThinkPad X1 Yoga 2017 20JD0015US | i5-7200U | HD Graphics 620 1000 MHz | 8 GB | 4344 |
| HP Pavilion x360 13-u102ng | i5-7200U | HD Graphics 620 1000 MHz | 8 GB | 4347 |
| HP Probook 650 G3 Z2W44ET | i5-7200U | HD Graphics 620 1000 MHz | 4 GB | 4348 |
| Lenovo Thinkpad L570 20J9S01600 | i5-7200U | HD Graphics 620 1000 MHz | 8 GB | 4361 |
| HP ProBook 640 G3 Z2W33ET | i5-7200U | HD Graphics 620 1000 MHz | 8 GB | 4364 |
| Acer Extensa 2540-580K | i5-7200U | HD Graphics 620 1000 MHz | 8 GB | 4379 |
| Fujitsu Lifebook A557 | i5-7200U | HD Graphics 620 | 8 GB | 4382 |
| HP Pavilion 17-x110ng | i5-7200U | Radeon R7 M440 1021 / 1000 MHz 2 GB | 8 GB | 4385 |
| HP 15-ay116ng | i5-7200U | HD Graphics 620 1000 MHz | 4 GB | 4407 |
| Model | CPU | GPU | RAM | Value |
|---|---|---|---|---|
| HP Pavilion 15-aw004ng | A10-9600P | Radeon R7 M440 | 8 GB | 2969 |
| HP Pavilion 15-aw004ng | A10-9600P | Radeon R8 M445DX | 8 GB | 3287 |
| HP Pavilion 15-aw004ng | A10-9600P | Radeon R5 (Bristol Ridge) | 8 GB | 3287 |
| HP Pavilion 15-aw004ng W8Y60EA | A10-9600P | Radeon R8 M445DX 1021 / 1000 MHz 2 GB | 8 GB | 3352 |
| Model | CPU | GPU | RAM | Value |
|---|---|---|---|---|
| HP Pavilion x360 13t-u100 | i5-7200U | HD Graphics 620 1000 MHz | 8 GB | 12 |
| Lenovo ThinkPad L570 20J80020PB | i5-7200U | HD Graphics 620 | 16 GB | 12.1 |
| HP ProBook 650 G3 Z2N47EA | i5-7200U | HD Graphics 620 | 16 GB | 12.14 |
| HP ProBook 640 G3 Z8K61EA | i5-7200U | HD Graphics 620 | 16 GB | 12.18 |
| HP EliteBook 840 G4 Z8N44EA | i5-7200U | HD Graphics 620 | 16 GB | 12.18 |
| Asus VivoBook S15 S510UA | i5-7200U | HD Graphics 620 300 / 1067 MHz | 16 GB | 12.19 |
| Dell Vostro 5468 | i5-7200U | GeForce 940MX 965 / 1000 MHz 4 GB | 16 GB | 12.2 |
| Lenovo ThinkPad T470s PL | i5-7200U | HD Graphics 620 | 8 GB | 12.24 |
| Dell Latitude 5280 N014L528012QG45 | i5-7200U | HD Graphics 620 | 16 GB | 12.25 |
| Fujitsu LifeBook A557 PL | i5-7200U | HD Graphics 620 300 MHz | 8 GB | 12.28 |
| Samsung Notebook 9 NP900X3N-K01US | i5-7200U | HD Graphics 620 300 / 1067 MHz | 8 GB | 12.28 |
| Acer Aspire E5-575G-549D | i5-7200U | GeForce GTX 950M 928 / 5000 MHz 2 GB | 8 GB | 12.31 |
| Dell Inspiron 13 5378-0K46 | i5-7200U | HD Graphics 620 300 MHz | 8 GB | 12.33 |
| Dell XPS 13 9360 FHD i5 | i5-7200U | HD Graphics 620 1050 / 933 MHz | 7.9 GB | 12.4 |
| Dell Latitude 5580 | i5-7200U | HD Graphics 620 300 MHz | 8 GB | 12.41 |
| HP Envy 13-ad065nr | i5-7200U | HD Graphics 620 300 / 933 MHz | 8 GB | 12.41 |
| Lenovo ThinkPad E470 20H1004SPB | i5-7200U | HD Graphics 620 | 8 GB | 12.43 |
| HP ProBook 450 G4 Z2Y44ES | i5-7200U | HD Graphics 620 | 8 GB | 12.44 |
| HP EliteBook 850 G4 Z8W50EA | i5-7200U | HD Graphics 620 | 8 GB | 12.44 |
| Dell Latitude 5280 | i5-7200U | HD Graphics 620 300 MHz | 4 GB | 12.45 |
| Microsoft Surface Laptop i5 | i5-7200U | HD Graphics 620 300 / 933 MHz | 4 GB | 12.48 |
| Dell Inspiron 15 5578-4G33 | i5-7200U | HD Graphics 620 300 MHz | 16 GB | 12.55 |
| HP Pavilion x360 15t X3W72AV | i5-7200U | HD Graphics 620 1050 / 798 MHz 1 GB | 8 GB | 12.56 |
| Lenovo ThinkPad L470 PL | i5-7200U | HD Graphics 620 300 MHz | 8 GB | 12.61 |
| Model | CPU | GPU | RAM | Value |
|---|---|---|---|---|
| HP Pavilion 15-aw004ng | A10-9600P | Radeon R8 M445DX | 8 GB | 18.74 |
| HP Pavilion 15-aw004ng | A10-9600P | Radeon R5 (Bristol Ridge) | 8 GB | 18.74 |
| Model | CPU | GPU | RAM | Value |
|---|---|---|---|---|
| HP Pavilion 15z-bw000 | A10-9620P | Radeon R5 (Carrizo) | 8 GB | 18.24 |
| Model | CPU | GPU | RAM | Value |
|---|---|---|---|---|
| Lenovo ThinkPad L570 20J80020PB | i5-7200U | HD Graphics 620 | 16 GB | 27.36 |
| Asus VivoBook S15 S510UA | i5-7200U | HD Graphics 620 300 / 1067 MHz | 16 GB | 27.46 |
| HP ProBook 640 G3 Z8K61EA | i5-7200U | HD Graphics 620 | 16 GB | 27.47 |
| Dell Vostro 5468 | i5-7200U | GeForce 940MX 965 / 1000 MHz 4 GB | 16 GB | 27.49 |
| HP ProBook 650 G3 Z2N47EA | i5-7200U | HD Graphics 620 | 16 GB | 27.49 |
| HP EliteBook 840 G4 Z8N44EA | i5-7200U | HD Graphics 620 | 16 GB | 27.52 |
| Dell Latitude 5280 N014L528012QG45 | i5-7200U | HD Graphics 620 | 16 GB | 27.58 |
| Dell Inspiron 13 5378-0K46 | i5-7200U | HD Graphics 620 300 MHz | 8 GB | 27.89 |
| Samsung Notebook 9 NP900X3N-K01US | i5-7200U | HD Graphics 620 300 / 1067 MHz | 8 GB | 27.96 |
| Dell Inspiron 15 5578-4G33 | i5-7200U | HD Graphics 620 300 MHz | 16 GB | 27.97 |
| Lenovo ThinkPad T470s PL | i5-7200U | HD Graphics 620 | 8 GB | 27.99 |
| HP Pavilion x360 13t-u100 | i5-7200U | HD Graphics 620 1000 MHz | 8 GB | 28 |
| Fujitsu LifeBook A557 PL | i5-7200U | HD Graphics 620 300 MHz | 8 GB | 28.07 |
| Acer Aspire E5-575G-549D | i5-7200U | GeForce GTX 950M 928 / 5000 MHz 2 GB | 8 GB | 28.29 |
| HP ProBook 450 G4 Z2Y44ES | i5-7200U | HD Graphics 620 | 8 GB | 28.32 |
| Lenovo ThinkPad E470 20H1004SPB | i5-7200U | HD Graphics 620 | 8 GB | 28.33 |
| Dell XPS 13 9360 FHD i5 | i5-7200U | HD Graphics 620 1050 / 933 MHz | 7.9 GB | 28.4 |
| HP Envy 13-ad065nr | i5-7200U | HD Graphics 620 300 / 933 MHz | 8 GB | 28.46 |
| HP Pavilion x360 15t X3W72AV | i5-7200U | HD Graphics 620 1050 / 798 MHz 1 GB | 8 GB | 28.76 |
| Dell Latitude 5280 | i5-7200U | HD Graphics 620 300 MHz | 4 GB | 28.8 |
| Microsoft Surface Laptop i5 | i5-7200U | HD Graphics 620 300 / 933 MHz | 4 GB | 28.81 |
| Dell Latitude 5580 | i5-7200U | HD Graphics 620 300 MHz | 8 GB | 28.9 |
| Lenovo ThinkPad L470 PL | i5-7200U | HD Graphics 620 300 MHz | 8 GB | 29.04 |
| HP EliteBook 850 G4 Z8W50EA | i5-7200U | HD Graphics 620 | 8 GB | 29.69 |
| Model | CPU | GPU | RAM | Value |
|---|---|---|---|---|
| HP Pavilion 15-aw004ng | A10-9600P | Radeon R8 M445DX | 8 GB | 41.33 |
| HP Pavilion 15-aw004ng | A10-9600P | Radeon R5 (Bristol Ridge) | 8 GB | 41.33 |
| Model | CPU | GPU | RAM | Value |
|---|---|---|---|---|
| HP Pavilion 15z-bw000 | A10-9620P | Radeon R5 (Carrizo) | 8 GB | 40.3 |
| Model | CPU | GPU | RAM | Value |
|---|---|---|---|---|
| HP Pavilion 15-aw004ng | A10-9600P | Radeon R8 M445DX | 8 GB | 942 |
| HP Pavilion 15-aw004ng | A10-9600P | Radeon R5 (Bristol Ridge) | 8 GB | 942 |
| Model | CPU | GPU | RAM | Value |
|---|---|---|---|---|
| HP Pavilion 15z-bw000 | A10-9620P | Radeon R5 (Carrizo) | 8 GB | 977 |
| Model | CPU | GPU | RAM | Value |
|---|---|---|---|---|
| Lenovo Yoga 510-14IKB | i5-7200U | Radeon R5 M430 1030 / 2000 MHz 2 GB | 8 GB | 9939 |
| Lenovo Ideapad 330-15IKB-81DC00SWGE | i5-7200U | Radeon 530 891 / 1000 MHz 2 GB | 8 GB | 10415 |
| Lenovo Yoga 710-14IKB 80V4002HGE | i5-7200U | HD Graphics 620 1067 MHz | 8 GB | 11673 |
| Lenovo IdeaPad 320s-14IKB | i5-7200U | GeForce 920MX 980 / 1253 MHz 2 GB | 8 GB | 11779 |
| Acer Aspire 5 A515-51G-51RL | i5-7200U | GeForce MX150 1683 / 1502 MHz 2 GB | 8 GB | 11828 |
| Fujitsu Lifebook A557 | i5-7200U | HD Graphics 620 | 8 GB | 11905 |
| HP Pavilion 17-x110ng | i5-7200U | Radeon R7 M440 1021 / 1000 MHz 2 GB | 8 GB | 12049 |
| Model | CPU | GPU | RAM | Value |
|---|---|---|---|---|
| HP Pavilion 15-aw004ng W8Y60EA | A10-9600P | Radeon R8 M445DX 1021 / 1000 MHz 2 GB | 8 GB | 7115 |
| HP Pavilion 15-aw004ng | A10-9600P | Radeon R7 M440 | 8 GB | 7916 |
| Model | CPU | GPU | RAM | Value |
|---|---|---|---|---|
| HP Pavilion 15-aw004ng | A10-9600P | Radeon R5 (Bristol Ridge) | 8 GB | 2246 |
| HP 17-y044ng | A10-9600P | Radeon R5 (Bristol Ridge) 720 MHz | 8 GB | 2316 |
| HP Pavilion 15-aw004ng | A10-9600P | Radeon R8 M445DX | 8 GB | 2387 |
| HP Pavilion 15-aw004ng W8Y60EA | A10-9600P | Radeon R8 M445DX 1021 / 1000 MHz 2 GB | 8 GB | 2509 |
| HP Pavilion 15-aw004ng | A10-9600P | Radeon R7 M440 | 8 GB | 2634 |
| Model | CPU | GPU | RAM | Value |
|---|---|---|---|---|
| HP Pavilion 15z-bw000 | A10-9620P | Radeon R5 (Carrizo) | 8 GB | 2399 |
| Model | CPU | GPU | RAM | Value |
|---|---|---|---|---|
| HP Pavilion 15-aw004ng | A10-9600P | Radeon R5 (Bristol Ridge) | 8 GB | 21570 |
| HP Pavilion 15-aw004ng W8Y60EA | A10-9600P | Radeon R8 M445DX 1021 / 1000 MHz 2 GB | 8 GB | 21652 |
| HP Pavilion 15-aw004ng | A10-9600P | Radeon R8 M445DX | 8 GB | 24534 |
| HP Pavilion 15-aw004ng | A10-9600P | Radeon R7 M440 | 8 GB | 24803 |
| Model | CPU | GPU | RAM | Value |
|---|---|---|---|---|
| HP Pavilion 15z-bw000 | A10-9620P | Radeon R5 (Carrizo) | 8 GB | 22553 |
| Model | CPU | GPU | RAM | Value |
|---|---|---|---|---|
| HP Pavilion 15-aw004ng W8Y60EA | A10-9600P | Radeon R8 M445DX 1021 / 1000 MHz 2 GB | 8 GB | 18940 |
| HP Pavilion 15-aw004ng | A10-9600P | Radeon R8 M445DX | 8 GB | 20750 |
| HP Pavilion 15-aw004ng | A10-9600P | Radeon R5 (Bristol Ridge) | 8 GB | 21381 |
| HP Pavilion 15-aw004ng | A10-9600P | Radeon R7 M440 | 8 GB | 24944 |
| Model | CPU | GPU | RAM | Value |
|---|---|---|---|---|
| HP Pavilion 15z-bw000 | A10-9620P | Radeon R5 (Carrizo) | 8 GB | 24032 |
| Model | CPU | GPU | RAM | Value |
|---|---|---|---|---|
| HP Pavilion 15-aw004ng W8Y60EA | A10-9600P | Radeon R8 M445DX 1021 / 1000 MHz 2 GB | 8 GB | 22601 |
| HP Pavilion 15-aw004ng | A10-9600P | Radeon R8 M445DX | 8 GB | 25953 |
| HP Pavilion 15-aw004ng | A10-9600P | Radeon R7 M440 | 8 GB | 26169 |
| HP Pavilion 15-aw004ng | A10-9600P | Radeon R5 (Bristol Ridge) | 8 GB | 26217 |
| Model | CPU | GPU | RAM | Value |
|---|---|---|---|---|
| HP Pavilion 15-aw004ng W8Y60EA | A10-9600P | Radeon R8 M445DX 1021 / 1000 MHz 2 GB | 8 GB | 1722 |
| HP Pavilion 15-aw004ng | A10-9600P | Radeon R8 M445DX | 8 GB | 1956 |
| HP Pavilion 15-aw004ng | A10-9600P | Radeon R5 (Bristol Ridge) | 8 GB | 2107 |
| HP Pavilion 15-aw004ng | A10-9600P | Radeon R7 M440 | 8 GB | 2214 |
| Model | CPU | GPU | RAM | Value |
|---|---|---|---|---|
| HP Pavilion 15z-bw000 | A10-9620P | Radeon R5 (Carrizo) | 8 GB | 2338 |
| Model | CPU | GPU | RAM | Value |
|---|---|---|---|---|
| HP Pavilion 15-aw004ng W8Y60EA | A10-9600P | Radeon R8 M445DX 1021 / 1000 MHz 2 GB | 8 GB | 2455 |
| HP Pavilion 15-aw004ng | A10-9600P | Radeon R5 (Bristol Ridge) | 8 GB | 2855 |
| HP Pavilion 15-aw004ng | A10-9600P | Radeon R8 M445DX | 8 GB | 3107 |
| HP Pavilion 15-aw004ng | A10-9600P | Radeon R7 M440 | 8 GB | 3229 |
| Model | CPU | GPU | RAM | Value |
|---|---|---|---|---|
| HP Pavilion 15z-bw000 | A10-9620P | Radeon R5 (Carrizo) | 8 GB | 3175 |
| Model | CPU | GPU | RAM | Value |
|---|---|---|---|---|
| Lenovo Yoga 720-13IKB | i5-7200U | HD Graphics 620 | 8 GB | 1536 |
| Fujitsu Lifebook A557 | i5-7200U | HD Graphics 620 | 8 GB | 1582 |
| Lenovo Ideapad 330-15IKB-81DC00SWGE | i5-7200U | Radeon 530 891 / 1000 MHz 2 GB | 8 GB | 1620 |
| Asus ZenBook Flip S UX370 | i5-7200U | HD Graphics 620 | 8 GB | 1639 |
| HP Elite x2 1012 G2-1LV76EA | i5-7200U | HD Graphics 620 1000 MHz | 8 GB | 1659 |
| Lenovo ThinkPad X1 Carbon 2017-20HR0021GE | i5-7200U | HD Graphics 620 | 8 GB | 1882 |
| Asus AsusPro P4540UQ-FY0056R | i5-7200U | GeForce 940MX 1163 / 1000 MHz 4 GB | 8 GB | 1917 |
| Acer Aspire 5 A515-51G-51RL | i5-7200U | GeForce MX150 1683 / 1502 MHz 2 GB | 8 GB | 1938 |
| Lenovo IdeaPad 320s-14IKB | i5-7200U | GeForce 920MX 980 / 1253 MHz 2 GB | 8 GB | 1941 |
| Lenovo ThinkPad X1 Yoga 2017 20JD0015US | i5-7200U | HD Graphics 620 1000 MHz | 8 GB | 1946 |
| Acer Extensa 2540-580K | i5-7200U | HD Graphics 620 1000 MHz | 8 GB | 1947 |
| Lenovo V320-17IKB 81AH0002GE | i5-7200U | HD Graphics 620 1000 MHz | 8 GB | 1951 |
| HP Pavilion 17-x110ng | i5-7200U | Radeon R7 M440 1021 / 1000 MHz 2 GB | 8 GB | 1991 |
| Model | CPU | GPU | RAM | Value |
|---|---|---|---|---|
| HP Pavilion 15-aw004ng W8Y60EA | A10-9600P | Radeon R8 M445DX 1021 / 1000 MHz 2 GB | 8 GB | 1045 |
| Model | CPU | GPU | RAM | Value |
|---|---|---|---|---|
| HP 17-y044ng | A10-9600P | Radeon R5 (Bristol Ridge) 720 MHz | 8 GB | 2047 |
| Model | CPU | GPU | RAM | Value |
|---|---|---|---|---|
| HP 17-y044ng | A10-9600P | Radeon R5 (Bristol Ridge) 720 MHz | 8 GB | 4711 |
| Model | CPU | GPU | RAM | Value |
|---|---|---|---|---|
| HP 17-y044ng | A10-9600P | Radeon R5 (Bristol Ridge) 720 MHz | 8 GB | 5252 |
| HP Pavilion 15-aw004ng | A10-9600P | Radeon R8 M445DX | 8 GB | 5423 |
| HP Pavilion 15-aw004ng | A10-9600P | Radeon R5 (Bristol Ridge) | 8 GB | 5423 |
| HP Pavilion 15-aw004ng W8Y60EA | A10-9600P | Radeon R8 M445DX 1021 / 1000 MHz 2 GB | 8 GB | 5445 |
| Model | CPU | GPU | RAM | Value |
|---|---|---|---|---|
| HP 17-y044ng | A10-9600P | Radeon R5 (Bristol Ridge) 720 MHz | 8 GB | 2000 |
| HP Pavilion 15-aw004ng W8Y60EA | A10-9600P | Radeon R8 M445DX 1021 / 1000 MHz 2 GB | 8 GB | 2039 |
| HP Pavilion 15-aw004ng | A10-9600P | Radeon R8 M445DX | 8 GB | 2109 |
| HP Pavilion 15-aw004ng | A10-9600P | Radeon R5 (Bristol Ridge) | 8 GB | 2109 |
| Model | CPU | GPU | RAM | Value |
|---|---|---|---|---|
| Acer Aspire E5-575G-549D | i5-7200U | GeForce GTX 950M 928 / 5000 MHz 2 GB | 8 GB | 6695 |
| Dell XPS 13 9360 QHD+ i5 | i5-7200U | HD Graphics 620 | 8 GB | 6849 |
| Model | CPU | GPU | RAM | Value |
|---|---|---|---|---|
| HP Pavilion 15-aw004ng | A10-9600P | Radeon R8 M445DX | 8 GB | 5702 |
| HP Pavilion 15-aw004ng | A10-9600P | Radeon R5 (Bristol Ridge) | 8 GB | 5702 |
| Model | CPU | GPU | RAM | Value |
|---|---|---|---|---|
| Acer Aspire E5-575G-549D | i5-7200U | GeForce GTX 950M 928 / 5000 MHz 2 GB | 8 GB | 3037 |
| Dell XPS 13 9360 QHD+ i5 | i5-7200U | HD Graphics 620 | 8 GB | 3250 |
| Model | CPU | GPU | RAM | Value |
|---|---|---|---|---|
| HP Pavilion 15-aw004ng | A10-9600P | Radeon R8 M445DX | 8 GB | 2237 |
| HP Pavilion 15-aw004ng | A10-9600P | Radeon R5 (Bristol Ridge) | 8 GB | 2237 |
| Model | CPU | GPU | RAM | Value |
|---|---|---|---|---|
 | i5-7200U | Radeon R5 M420 | 8 GB | 4907 |
| Model | CPU | GPU | RAM | Value |
|---|---|---|---|---|
| HP Pavilion 15-aw004ng W8Y60EA Edge 38 | A10-9600P | Radeon R8 M445DX 1021 / 1000 MHz 2 GB | 8 GB | 2098 |
| HP Pavilion 15-aw004ng Edge 25 | A10-9600P | Radeon R8 M445DX | 8 GB | 2328 |
| HP Pavilion 15-aw004ng Edge 25 | A10-9600P | Radeon R5 (Bristol Ridge) | 8 GB | 2328 |
| Model | CPU | GPU | RAM | Value |
|---|---|---|---|---|
| HP Pavilion 15-aw004ng Edge 25 | A10-9600P | Radeon R8 M445DX | 8 GB | 133.3 |
| HP Pavilion 15-aw004ng Edge 25 | A10-9600P | Radeon R5 (Bristol Ridge) | 8 GB | 133.3 |
| HP Pavilion 15-aw004ng W8Y60EA Edge 38 | A10-9600P | Radeon R8 M445DX 1021 / 1000 MHz 2 GB | 8 GB | 148.1 |
| Model | CPU | GPU | RAM | Value |
|---|---|---|---|---|
| HP Pavilion 15-aw004ng W8Y60EA Edge 38 | A10-9600P | Radeon R8 M445DX 1021 / 1000 MHz 2 GB | 8 GB | 18921 |
| HP Pavilion 15-aw004ng Edge 25 | A10-9600P | Radeon R8 M445DX | 8 GB | 19791 |
| HP Pavilion 15-aw004ng Edge 25 | A10-9600P | Radeon R5 (Bristol Ridge) | 8 GB | 19791 |
| Model | CPU | GPU | RAM | Value |
|---|---|---|---|---|
| Samsung Galaxy Book 12 | i5-7200U | HD Graphics 620 | 8 GB | 26.8 |
| Model | CPU | GPU | RAM | Value |
|---|---|---|---|---|
| Samsung Galaxy Book 12 | i5-7200U | HD Graphics 620 | 8 GB | 25.5 |
| Model | CPU | GPU | RAM | Value |
|---|---|---|---|---|
| Samsung Galaxy Book 12 | i5-7200U | HD Graphics 620 | 8 GB | 12.8 |
Average Benchmarks Intel Core i5-7200U → 100% n=19
Average Benchmarks AMD A10-9600P → 67% n=19
Average Benchmarks AMD A10-9620P → 68% n=19
* Smaller numbers mean a higher performance
1 This benchmark is not used for the average calculation
#0 ran 0s before starting gpusingle class +0s ... 0s
#1 checking url part for id 8152 +0s ... 0s
#2 checking url part for id 8094 +0s ... 0s
#3 checking url part for id 9188 +0s ... 0s
#4 redirected to Ajax server, took 1764687021s time from redirect:0 +0s ... 0s
#5 did not recreate cache, as it is less than 5 days old! Created at Tue, 02 Dec 2025 08:12:07 +0100 +0s ... 0s
#6 composed specs +0.005s ... 0.005s
#7 did output specs +0s ... 0.005s
#8 getting avg benchmarks for device 8152 +0.001s ... 0.006s
#9 got single benchmarks 8152 +0.086s ... 0.092s
#10 getting avg benchmarks for device 8094 +0.001s ... 0.093s
#11 got single benchmarks 8094 +0.007s ... 0.1s
#12 getting avg benchmarks for device 9188 +0.001s ... 0.1s
#13 got single benchmarks 9188 +0.003s ... 0.104s
#14 got avg benchmarks for devices +0s ... 0.104s
#15 min, max, avg, median took s +0.047s ... 0.151s
#16 return log +0s ... 0.151s