Intel Core i7-4810MQ
The Intel Core i7-4810MQ is a high-end quad-core processor for laptops which has been launched in Q1/2014. It is based on the Haswell architecture and manufactured in 22nm. Due to Hyperthreading, the four cores can handle up to eight threads in parallel leading to better utilization of the CPU. Each core offers a base speed of 2.8 GHz but can dynamically increase clock rates with Turbo Boost up to 3.6 GHz (for 4 active cores), 3.7 GHz (for 2 active cores) and 3.8 GHz (for 1 active core).
Architecture
Haswell is the successor to the Ivy Bridge architecture with improvements on both GPU and CPU performance. The CPUs are produced in 22nm and offer an optimized branch prediction as well as additional execution ports, improving the performance per clock by 5 - 10 percent. Furthermore, new features like AVX2 and FMA should increase the performance in future applications.
Performance
Compared to the Core i7-4800MQ , the 4810MQ is clocked just 100 MHz higher and therefore only slightly faster. Overall, the performance is almost similar to the Core i7-4900MQ . Even extremly demanding software or multitasking will be handled easily.
Graphics
The i7-4810MQ is rated at a TDP of 47 W including graphics card, memory controller and VRMs. Therefore, the CPU is only suited for laptops 15-inches or greater.
Series Intel Core i7 Codename Haswell Series: Core i7 Haswell Clock Rate 2800 - 3800 MHz Level 1 Cache 256 KB Level 2 Cache 1 MB Level 3 Cache 6 MB Number of Cores / Threads 4 / 8 Power Consumption (TDP = Thermal Design Power) 47 Watt Transistor Count 1400 Million Manufacturing Technology 22 nm Die Size 177 mm2 Max. Temperature 100 °C Socket rPGA Features HD Graphics 4600 (400 - 1300 MHz), DDR3(L)-1600 Memory Controller, HyperThreading, AVX, AVX2, Quick Sync, Virtualization, vPro, AES-NI GPU Intel HD Graphics 4600 (400 - 1300 MHz)64 Bit 64 Bit support Architecture x86 Starting Price $378 U.S. Announcement Date 01/19/2014 Product Link (external) ark.intel.com
Benchmarks Cinebench R15 - Cinebench R15 CPU Multi 64 Bit
min: 623 avg: 650 median: 647 (4%) max: 696 Points
...
...
max:
Cinebench R15 - Cinebench R15 CPU Single 64 Bit
min: 145 avg: 147.6 median: 148 (45%) max: 151 Points
...
...
max:
Cinebench R11.5 - Cinebench R11.5 CPU Multi 64 Bit
min: 6.66 avg: 7 median: 7 (9%) max: 7.5 Points
...
...
max:
Cinebench R11.5 - Cinebench R11.5 CPU Single 64 Bit
min: 1.64 avg: 1.7 median: 1.7 (42%) max: 1.68 Points
...
...
max:
Cinebench R10 - Cinebench R10 Rend. Single (32bit)
min: 5430 avg: 5445 median: 5445 (33%) max: 5460 points
...
...
max:
Cinebench R10 - Cinebench R10 Rend. Multi (32bit)
min: 18564 avg: 19148 median: 19147.5 (14%) max: 19731 points
...
...
max:
Cinebench R10 - Cinebench R10 Rend. Multi (64bit)
min: 23921 avg: 24926 median: 24926 (17%) max: 25931 Points
...
...
max:
Cinebench R10 - Cinebench R10 Rend. Single (64bit)
min: 6954 avg: 7059 median: 7058.5 (9%) max: 7163 Points
...
...
wPrime 2.10 - wPrime 2.0 1024m *
min: 270 avg: 326.2 median: 326.2 (4%) max: 382.3 s
...
...
VIA C3-M C3-M-1200
wPrime 2.10 - wPrime 2.0 32m *
min: 7.64 avg: 9.9 median: 9.9 (2%) max: 12.22 s
...
...
min: 3054 avg: 3467 median: 3466.5 (5%) max: 3879 points
...
...
max:
X264 HD Benchmark 4.0 - x264 Pass 2
38.3 fps (13%)
...
...
max:
X264 HD Benchmark 4.0 - x264 Pass 1
146 fps (34%)
...
...
max:
TrueCrypt - TrueCrypt Serpent
0.3 GB/s (10%)
...
...
max:
TrueCrypt - TrueCrypt Twofish
0.6 GB/s (10%)
...
...
max:
TrueCrypt - TrueCrypt AES
3.7 GB/s (10%)
...
...
max:
3DMark 06 - CPU - 3DMark 06 - CPU
7049 Points (15%)
...
...
max:
Super Pi mod 1.5 XS 1M - Super Pi mod 1.5 XS 1M *
min: 9.86 avg: 10.9 median: 10.9 (2%) max: 12 s
...
...
VIA C3-M C3-M-1200
Super Pi mod 1.5 XS 2M - Super Pi mod 1.5 XS 2M *
min: 22.26 avg: 22.6 median: 22.6 (1%) max: 23 s
...
...
Super Pi Mod 1.5 XS 32M - Super Pi mod 1.5 XS 32M *
min: 522 avg: 547 median: 546.5 (2%) max: 571 s
...
...
VIA C3-M C3-M-1200
SiSoft Sandra Dhrystone (MIPS) - SiSoft Sandra Dhrystone (MIPS)
min: 107890 avg: 126580 median: 126580 (60%) max: 145270 MIPS
...
SiSoft Sandra Whetstone (MFLOPS) - SiSoft Sandra Whetstone (MFLOPS)
min: 79690 avg: 79945 median: 79945 (61%) max: 80200 MFLOPS
...
...
max:
Windows 7 Experience Index - Win7 CPU
min: 7.6 avg: 7.7 median: 7.7 (98%) max: 7.7 Points
...
max:
3DMark Vantage - 3DM Vant. Perf. CPU no Physx
min: 22292 avg: 23470 median: 23348 (21%) max: 24893 Points
...
...
max:
3DMark 11 - 3DM11 Performance Physics
min: 7507 avg: 8043 median: 8012 (22%) max: 8498 Points
...
...
max:
3DMark - 3DMark Ice Storm Physics
min: 42114 avg: 45670 median: 46717 (38%) max: 48857 Points
...
...
max:
3DMark - 3DMark Cloud Gate Physics
min: 6064 avg: 6572 median: 6426 (16%) max: 7231 Points
...
...
max:
3DMark - 3DMark Fire Strike Standard Physics
min: 8331 avg: 9150 median: 9175 (16%) max: 10087 Points
...
...
max:
Geekbench 3 - Geekbench 3 32 Bit Multi-Core
11663 points (21%)
...
...
max:
Geekbench 3 - Geekbench 3 32 Bit Single-Core
3506 points (68%)
...
...
Geekbench 2 - 32 Bit - Geekbench Stream
min: 8714 avg: 8744 median: 8744 (71%) max: 8774 Points
...
...
max:
Geekbench 2 - 32 Bit - Geekbench Memory
min: 8038 avg: 8083 median: 8082.5 (73%) max: 8127 Points
...
max:
Geekbench 2 - 32 Bit - Geekbench Floating Point
min: 12740 avg: 13182 median: 13181.5 (26%) max: 13623 Points
...
...
max:
Geekbench 2 - 32 Bit - Geekbench Integer
min: 11277 avg: 11803 median: 11803 (24%) max: 12329 Points
...
...
max:
Geekbench 2 - 32 Bit - Geekbench Total Score
min: 10908 avg: 11235 median: 11235 (29%) max: 11562 Points
...
...
max:
- Range of benchmark values for this graphics card
- Average benchmark values for this graphics card
* Smaller numbers mean a higher performance
v1.26
log 05. 17:40:33
#0 no ids found in url (should be separated by "_") +0s ... 0s
#1 not redirecting to Ajax server +0s ... 0s
#2 did not recreate cache, as it is less than 5 days old! Created at Mon, 04 Mar 2024 05:33:13 +0100 +0.001s ... 0.001s
#3 composed specs +0.029s ... 0.03s
#4 did output specs +0s ... 0.03s
#5 getting avg benchmarks for device 5001 +0.003s ... 0.033s
#6 got single benchmarks 5001 +0.023s ... 0.056s
#7 got avg benchmarks for devices +0s ... 0.056s
#8 min, max, avg, median took s +0.649s ... 0.705s
#9 return log +0.022s ... 0.727s
Reviews for the Intel Core i7-4810MQ processor
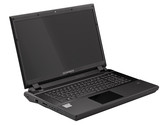
Schenker W724 (Clevo P370SM-A) Notebook Review Two GPUs. Schenker’s 17-inch Workstation is available with two Nvidia graphics cards in an SLI configuration. Read the review to find out whether the quality an...
Intel Core i7-4810MQ | NVIDIA GeForce GTX 970M SLI | 17.30" | 4.3 kg
Gigabyte P25X v2 Notebook Review Character actor. While most notebook companies rely at most on the GeForce GTX 870M for their 15-inch department, Gigabyte uses Nvidia's top model for the P25X ...
Intel Core i7-4810MQ | NVIDIA GeForce GTX 880M | 15.60" | 2.8 kg
Dell Precision M2800 Notebook Review Inexpensive entry. Dell introduces a new entry-level version of its exclusive portfolio of mobile workstations with the Precision M2800. We tested if the concep...
Intel Core i7-4810MQ | AMD FirePro W4170M | 15.60" | 2.9 kg
Review Clevo W670SJQ (Nexoc M731) Barebones Notebook Between gaming and multimedia. The M731 from Nexoc combines the advantages of an all-rounder and a high-end notebook. While the 17-inch chassis is still compara...
Intel Core i7-4810MQ | NVIDIA GeForce GTX 850M | 17.30" | 3.1 kg
Review Clevo P370SM-A (Schenker XMG P724) Barebones Notebook Chasing records. Schenker Technologies wants to offer the fastest desktop replacement with the XMG P724. The bulky 17-inch chassis can be configured with up to ...
Intel Core i7-4810MQ | NVIDIA GeForce GTX 880M SLI | 17.30" | 4.3 kg
SCHENKER XMG P304 : NVIDIA GeForce GTX 860M, 13.30", 2.1 kg
Review » Review Clevo W230SS (Schenker XMG P304) Barebones Notebook
MSI WT70-2OKi781 : NVIDIA Quadro K3100M, 17.30", 3.9 kg
External Review » MSI WT70-2OKi781
MSI GT70 2PE-1862UK : NVIDIA GeForce GTX 880M, 17.30", 3.9 kg
External Review » MSI GT70 2PE-1862UK
Gigabyte P25X v2 : NVIDIA GeForce GTX 880M, 15.60", 2.8 kg
External Review » Gigabyte P25X v2
Dell Precision M2800 : AMD FirePro W4170M, 15.60", 2.9 kg
External Review » Dell Precision M2800
AVADirect Clevo P157SM-A : NVIDIA GeForce GTX 880M, 15.60", 3.3 kg
External Review » AVADirect Clevo P157SM-A
SCHENKER XMG P304 : NVIDIA GeForce GTX 860M, 13.30", 2.1 kg
External Review » Schenker XMG P304
SCHENKER XMG P724 : NVIDIA GeForce GTX 880M SLI, 17.30", 4.3 kg
External Review » Schenker XMG P724
Please share our article, every link counts!
Other CPUs of the series Core i7 Surrounding CPUs
Working For Notebookcheck
Are you a techie who knows how to translate? Then join our Team!
Details here
Top 10 Laptops Multimedia , Budget Multimedia , Gaming , Budget Gaming , Lightweight Gaming , Business , Budget Office , Workstation , Subnotebooks , Ultrabooks , Chromebooks
under 300 USD/Euros , under 500 USD/Euros , 1,000 USD/Euros , for University Students , Best Displays
Top 10 Smartphones Smartphones , Phablets , ≤6-inch , Camera Smartphones
Klaus Hinum, 2014-01-22 (Update: 2014-01-22)