Intel Arc A770M vs Intel Arc A350M vs Intel Arc A730M
Intel Arc A770M ► remove from comparison
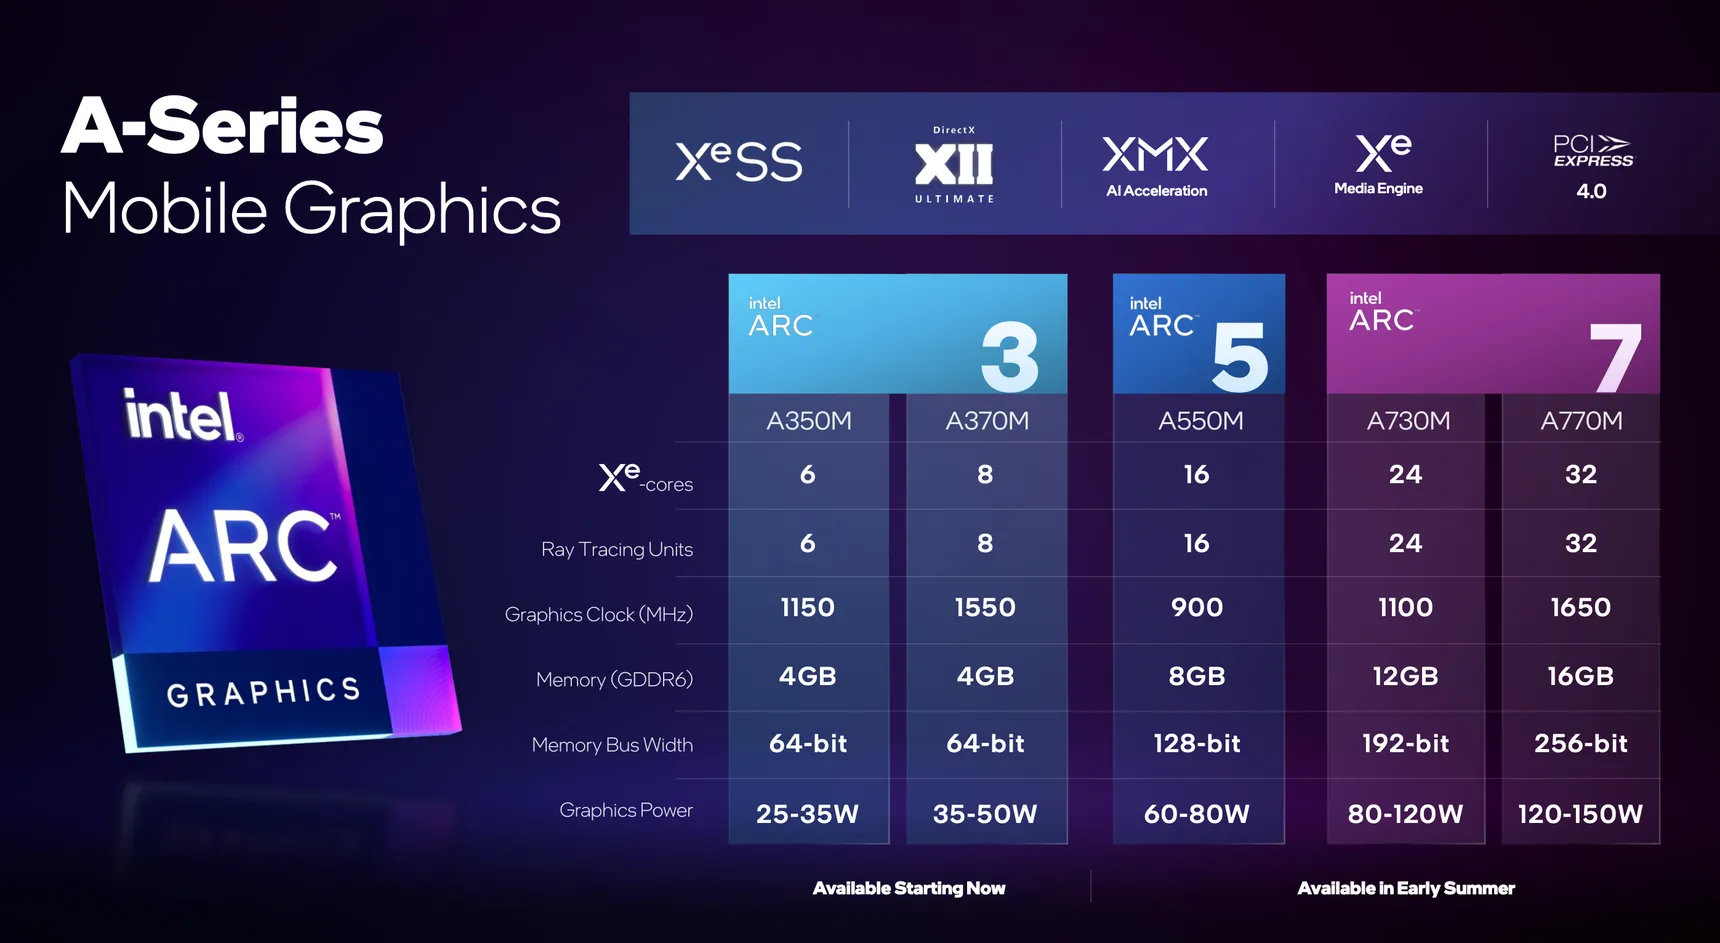
The Intel Arc A770M is a dedicated mobile lower- mid-range graphics card for laptops based on Xe HPG microarchitecture. It uses the ACM-G10 chip and offers all of the 32 Xe-cores (512 ALUs), 32 ray tracing units and a 256-bit memory bus for 12 GB GDDR6 graphics memory. The chip can clock from 300 MHz (low frequency mode) to 1650 MHz (high frequency) or in short bursts 2050 MHz (Turbo). The chip integrates 21.7 billion transistors, uses a BGA2660 package (soldered), and the die measures 406 mm2.
The performance of the Arc A770M is not yet known. The power consumption is similar to a RTX 3070 and therefore we see the performance slightly below a RTX 3070 mobile .
The chip also integrates two media engines for VP9, AVC, HEVC, and AV1 8k en- and decoding. The 4 display pipes support up to 4x 4k120 HDR via DMI 2.0B or DisplayPort 2.0 10G.
The A770M is produced in 6nm at TSMC (N6 process) and supports dynamic power share (using Deep Link) with 12th gen Intel CPUs (Alder Lake).
Intel Arc A350M ► remove from comparison
The Intel Arc A350M is a dedicated mobile entry level graphics card for laptops based on Xe HPG microarchitecture. It uses the ACM-G11 chip and offers 6 of the 8 Xe-cores (95 ALUs), 6 of the 8 ray tracing units and a 64-bit memory bus for 4 GB GDDR6 graphics memory. The chip integrates 7.2 billion transistors and the die measures 157 mm2.
The chip also integrates two media engines for VP9, AVC, HEVC, and AV1 8k en- and decoding. The 4 display pipes support up to 4x 4k120 HDR via DMI 2.0B or DisplayPort 2.0 10G.
The A350M is produced in 6nm at TSMC (N6 process) and supports dynamic power share (using Deep Link) with 12th gen Intel CPUs (Alder Lake).
Intel Arc A730M ► remove from comparison
The Intel Arc A730M (device ID 5691) is a dedicated mobile lower- mid-range graphics card for laptops based on Xe HPG microarchitecture. It uses the ACM-G10 chip and offers 24 of the 32 Xe-cores (384 ALUs), 24 ray tracing units and a 192-bit memory bus for 12 GB GDDR6 graphics memory. The cores can clock from 300 MHz (low frequency mode) to 1100 MHz (high frequency) or in short bursts 2050 MHz (Turbo). The chip integrates 21.7 billion transistors, uses a BGA2660 package (soldered), and the die measures 406 mm2.
The performance of the Arc A730M is not yet known. The power consumption is similar to a RTX 3060 and therefore we see the performance slightly below a RTX 3060 mobile .
The chip also integrates two media engines for VP9, AVC, HEVC, and AV1 8k en- and decoding. The 4 display pipes support up to 4x 4k120 HDR via DMI 2.0B or DisplayPort 2.0 10G.
The A730M is produced in 6nm at TSMC (N6 process) and supports dynamic power share (using Deep Link) with 12th gen Intel CPUs (Alder Lake).
Intel Arc A770M Intel Arc A350M Intel Arc A730M Arc Series Arc A770 4096 @ 2.1 - 2.4 GHz 256 Bit @ 16000 MHz Arc A750 3584 @ 2.05 - 2.4 GHz 256 Bit @ 16000 MHz Arc A580 3072 @ 1.7 - 2 GHz 256 Bit @ 16000 MHz A770M 512 @ 1.65 GHz 256 Bit @ 16000 MHz A730M 384 @ 1.1 GHz 192 Bit @ 14000 MHz A570M 16 @ 0.9 - 1.3 GHz 128 Bit @ 14000 MHz A550M 16 @ 0.9 - 2.01 GHz 128 Bit @ 14000 MHz A530M 12 @ 0.9 - 1.3 GHz 128 Bit @ 14000 MHz A370M 8 @ 1.55 GHz 64 Bit @ 14000 MHz Arc A380 1024 @ 2 GHz 96 Bit @ 15500 MHz A310 6 @ 2 GHz 64 Bit @ 15500 MHz A350M 6 @ 1.15 GHz 64 Bit @ 14000 MHz
Arc A770 4096 @ 2.1 - 2.4 GHz 256 Bit @ 16000 MHz Arc A750 3584 @ 2.05 - 2.4 GHz 256 Bit @ 16000 MHz Arc A580 3072 @ 1.7 - 2 GHz 256 Bit @ 16000 MHz A770M 512 @ 1.65 GHz 256 Bit @ 16000 MHz A730M 384 @ 1.1 GHz 192 Bit @ 14000 MHz A570M 16 @ 0.9 - 1.3 GHz 128 Bit @ 14000 MHz A550M 16 @ 0.9 - 2.01 GHz 128 Bit @ 14000 MHz A530M 12 @ 0.9 - 1.3 GHz 128 Bit @ 14000 MHz A370M 8 @ 1.55 GHz 64 Bit @ 14000 MHz Arc A380 1024 @ 2 GHz 96 Bit @ 15500 MHz A310 6 @ 2 GHz 64 Bit @ 15500 MHz A350M 6 @ 1.15 GHz 64 Bit @ 14000 MHz
Arc A770 4096 @ 2.1 - 2.4 GHz 256 Bit @ 16000 MHz Arc A750 3584 @ 2.05 - 2.4 GHz 256 Bit @ 16000 MHz Arc A580 3072 @ 1.7 - 2 GHz 256 Bit @ 16000 MHz A770M 512 @ 1.65 GHz 256 Bit @ 16000 MHz A730M 384 @ 1.1 GHz 192 Bit @ 14000 MHz A570M 16 @ 0.9 - 1.3 GHz 128 Bit @ 14000 MHz A550M 16 @ 0.9 - 2.01 GHz 128 Bit @ 14000 MHz A530M 12 @ 0.9 - 1.3 GHz 128 Bit @ 14000 MHz A370M 8 @ 1.55 GHz 64 Bit @ 14000 MHz Arc A380 1024 @ 2 GHz 96 Bit @ 15500 MHz A310 6 @ 2 GHz 64 Bit @ 15500 MHz A350M 6 @ 1.15 GHz 64 Bit @ 14000 MHz
Codename Alchemist Alchemist Alchemist Architecture Xe HPG Xe HPG Xe HPG Pipelines 512 - unified 6 - unified 384 - unified Raytracing Cores 32 6 24 Core Speed 1650 MHz 1150 MHz 1100 MHz Cache L1: 6 MB, L2: 16 MB L1: 1.1 MB, L2: 4 MB L1: 4.5 MB, L2: 16 MB Memory Speed 16000 MHz 14000 MHz 14000 MHz Memory Bus Width 256 Bit 64 Bit 192 Bit Memory Type GDDR6 GDDR6 GDDR6 Max. Amount of Memory 16 GB 4 GB 12 GB Shared Memory no no no Memory Bandwidth 512 GB/s 112 GB/s 336 GB/s API DirectX 12_2, OpenGL 4.6, Vulkan 1.3 DirectX 12_2, OpenGL 4.6, Vulkan 1.3 DirectX 12_2, OpenGL 4.6, Vulkan 1.3 Power Consumption 150 Watt (120 - 150 Watt TGP) 35 Watt (25 - 35 Watt TGP) 120 Watt (80 - 120 Watt TGP) Transistors 21.7 Billion 7.2 Billion 21.7 Billion Die Size 406 mm² 157 mm² 406 mm² technology 6 nm 6 nm 6 nm PCIe 4 16x 4 8x 4 16x Displays 4 Displays (max.), HDMI 2.0b, DisplayPort 2.0 10G Ready 4 Displays (max.), HDMI 2.0b, DisplayPort 2.0 10G Ready 4 Displays (max.), HDMI 2.0b, DisplayPort 2.0 10G Ready Notebook Size large medium sized Date of Announcement 30.03.2022 30.03.2022 30.03.2022 Link to Manufacturer Page ark.intel.com ark.intel.com ark.intel.com
Benchmarks Performance Rating - 3DMark 11 + Fire Strike + Time Spy - A770M
11.6 pt (35%)
...
...
max:
Performance Rating - 3DMark 11 + Fire Strike + Time Spy - A730M
9.7 pt (29%)
...
...
max:
3DMark - 3DMark Time Spy Score
10997 Points (32%)
min: 2976 avg: 3289 median: 3397 (10%) max: 3494 Points
GPU TDP ? TDP 35 W TDP 117 W 31% 27% 100%
min: 7653 avg: 9041 median: 8919.5 (26%) max: 10670 Points
GPU TDP ? TDP 35 W TDP 85 W TDP 117 W TDP 120 W 60% 27% 70% 100% 80%
3DMark - 3DMark Time Spy Graphics
10783 Points (29%)
min: 2731 avg: 2993 median: 3050 (8%) max: 3197 Points
GPU TDP ? TDP 35 W TDP 117 W 29% 25% 100%
min: 7212 avg: 8798 median: 8813 (23%) max: 10352 Points
GPU TDP ? TDP 35 W TDP 85 W TDP 117 W TDP 120 W 59% 25% 67% 100% 83%
3DMark - 3DMark Ice Storm Unlimited Graphics
467230 Points (53%)
3DMark - 3DMark Ice Storm Extreme Graphics
384531 Points (49%)
309114 Points (40%)
GPU TDP 117 W TDP 120 W 100% 80%
3DMark - 3DMark Cloud Gate Score
53345 Points (57%)
min: 23965 avg: 25147 median: 25146.5 (27%) max: 26328 Points
GPU TDP ? TDP 35 W TDP 117 W 45% 49% 100%
min: 42200 avg: 44782 median: 45257 (48%) max: 46415 Points
GPU TDP ? TDP 35 W TDP 85 W TDP 117 W TDP 120 W 72% 49% 87% 100% 79%
3DMark - 3DMark Cloud Gate Graphics
124487 Points (33%)
min: 28623 avg: 36315 median: 36314.5 (10%) max: 44006 Points
GPU TDP ? TDP 35 W TDP 117 W 23% 35% 100%
min: 75370 avg: 86896 median: 83396 (22%) max: 105420 Points
GPU TDP ? TDP 35 W TDP 85 W TDP 117 W TDP 120 W 48% 35% 73% 100% 85%
3DMark - 3DMark Fire Strike Standard Score
min: 20560 avg: 22179 median: 22178.5 (39%) max: 23797 Points
min: 5961 avg: 6267 median: 6009 (11%) max: 6832 Points
GPU TDP ? TDP 35 W TDP 117 W 29% 27% 100%
min: 16910 avg: 18480 median: 18213.5 (32%) max: 20584 Points
GPU TDP ? TDP 35 W TDP 85 W TDP 117 W TDP 120 W 59% 27% 81% 100% 76%
3DMark - 3DMark Fire Strike Standard Graphics
min: 23000 avg: 25563 median: 25563 (29%) max: 28126 Points
min: 6800 avg: 7088 median: 7147 (8%) max: 7318 Points
GPU TDP ? TDP 35 W TDP 117 W 28% 27% 100%
min: 19850 avg: 21265 median: 21294 (24%) max: 22620 Points
GPU TDP ? TDP 35 W TDP 85 W TDP 117 W TDP 120 W 56% 27% 78% 100% 88%
3DMark - 3DMark Ice Storm Graphics
426092 Points (51%)
min: 131746 avg: 207940 median: 134036 (16%) max: 358039 Points
GPU TDP ? TDP 117 W TDP 120 W 31% 100% 84%
3DMark - 3DMark Wild Life Unlimited
19449 Points (10%)
3DMark - 3DMark Wild Life Extreme Unlimited
min: 5189 avg: 5300 median: 5299.5 (6%) max: 5410 Points
GPU TDP ? TDP 35 W 100% 96%
3DMark - 3DMark Night Raid
54701 Points (52%)
3DMark - 3DMark Night Raid Graphics Score
112098 Points (43%)
3DMark 11 - 3DM11 Performance Score
29170 Points (40%)
min: 10123 avg: 10766 median: 10766 (15%) max: 11409 Points
GPU TDP ? TDP 35 W TDP 117 W 39% 35% 100%
min: 23160 avg: 24539 median: 24285.5 (34%) max: 26424 Points
GPU TDP ? TDP 35 W TDP 85 W TDP 117 W TDP 120 W 71% 35% 79% 100% 83%
3DMark 11 - 3DM11 Performance GPU
37375 Points (32%)
min: 10687 avg: 10730 median: 10730 (9%) max: 10773 Points
GPU TDP ? TDP 35 W TDP 117 W 29% 29% 100%
min: 24928 avg: 28692 median: 29144 (25%) max: 31551 Points
GPU TDP ? TDP 35 W TDP 85 W TDP 117 W TDP 120 W 62% 29% 67% 100% 84%
3DMark Vantage + Intel Arc A770M 3DMark Vantage - 3DM Vant. Perf. total
77403 Points (22%)
3DM Vant. Perf. total + Intel Arc A350M
31023 Points (9%)
GPU TDP 35 W TDP 117 W 40% 100%
3DM Vant. Perf. total + Intel Arc A730M
min: 62916 avg: 63380 median: 63380 (18%) max: 63844 Points
GPU TDP ? TDP 35 W TDP 117 W TDP 120 W 82% 40% 100% 81%
3DM Vant. Perf. GPU no PhysX + Intel Arc A770M 3DMark Vantage - 3DM Vant. Perf. GPU no PhysX
80346 Points (46%)
3DM Vant. Perf. GPU no PhysX + Intel Arc A350M
28186 Points (16%)
GPU TDP 35 W TDP 117 W 35% 100%
3DM Vant. Perf. GPU no PhysX + Intel Arc A730M
min: 64146 avg: 66003 median: 66003 (37%) max: 67860 Points
GPU TDP ? TDP 35 W TDP 117 W TDP 120 W 80% 35% 100% 84%
3DMark 05 - 3DMark 05 - Standard
55811 Points (61%)
43138 Points (47%)
GPU TDP 117 W TDP 120 W 100% 77%
3DMark 06 3DMark 06 - Standard 1280x1024 + Intel Arc A770M
48471 Points (63%)
3DMark 06 - Standard 1280x1024 + Intel Arc A350M
31625 Points (41%)
GPU TDP 35 W TDP 117 W 65% 100%
3DMark 06 - Standard 1280x1024 + Intel Arc A730M
min: 43017 avg: 44798 median: 44798 (59%) max: 46579 Points
GPU TDP ? TDP 35 W TDP 117 W TDP 120 W 96% 65% 100% 89%
Unigine Valley 1.0 - Unigine Valley 1.0 DX
75.2 fps (25%)
19.5 fps (6%)
GPU TDP 35 W TDP 117 W 26% 100%
61 fps (20%)
GPU TDP 35 W TDP 117 W TDP 120 W 26% 100% 81%
SPECviewperf 12 + Intel Arc A770M SPECviewperf 12 - specvp12 sw-03
61.1 fps (15%)
specvp12 sw-03 + Intel Arc A730M
58.8 fps (15%)
GPU TDP 117 W TDP 120 W 100% 96%
specvp12 snx-02 + Intel Arc A770M SPECviewperf 12 - specvp12 snx-02
1.3 fps (0%)
specvp12 snx-02 + Intel Arc A730M 1.3 fps (0%)
GPU TDP 117 W TDP 120 W 100% 96%
specvp12 showcase-01 + Intel Arc A770M SPECviewperf 12 - specvp12 showcase-01
104 fps (23%)
specvp12 showcase-01 + Intel Arc A730M
81.4 fps (18%)
GPU TDP 117 W TDP 120 W 100% 78%
specvp12 mediacal-01 + Intel Arc A770M SPECviewperf 12 - specvp12 mediacal-01
40.4 fps (10%)
specvp12 mediacal-01 + Intel Arc A730M
35.3 fps (9%)
GPU TDP 117 W TDP 120 W 100% 87%
specvp12 maya-04 + Intel Arc A770M SPECviewperf 12 - specvp12 maya-04
136 fps (37%)
specvp12 maya-04 + Intel Arc A730M
127 fps (35%)
GPU TDP 117 W TDP 120 W 100% 93%
specvp12 energy-01 + Intel Arc A770M SPECviewperf 12 - specvp12 energy-01
2.1 fps (2%)
specvp12 energy-01 + Intel Arc A730M
1.8 fps (2%)
GPU TDP 117 W TDP 120 W 100% 86%
specvp12 creo-01 + Intel Arc A770M SPECviewperf 12 - specvp12 creo-01
37.7 fps (15%)
specvp12 creo-01 + Intel Arc A730M
37 fps (15%)
GPU TDP 117 W TDP 120 W 100% 98%
specvp12 catia-04 + Intel Arc A770M SPECviewperf 12 - specvp12 catia-04
144 fps (24%)
specvp12 catia-04 + Intel Arc A730M
130 fps (21%)
GPU TDP 117 W TDP 120 W 100% 90%
specvp12 3dsmax-05 + Intel Arc A770M SPECviewperf 12 - specvp12 3dsmax-05
150 fps (26%)
specvp12 3dsmax-05 + Intel Arc A730M
121 fps (21%)
GPU TDP 117 W TDP 120 W 100% 81%
SPECviewperf 13 specvp13 sw-04 + Intel Arc A770M SPECviewperf 13 - specvp13 sw-04
66.2 fps (18%)
specvp13 sw-04 + Intel Arc A350M
57.6 fps (15%)
GPU TDP 35 W TDP 117 W 87% 100%
specvp13 sw-04 + Intel Arc A730M
63.8 fps (17%)
GPU TDP 35 W TDP 117 W TDP 120 W 87% 100% 96%
specvp13 snx-03 + Intel Arc A770M SPECviewperf 13 - specvp13 snx-03
2.4 fps (0%)
specvp13 snx-03 + Intel Arc A350M 3.2 fps (0%)
GPU TDP 35 W TDP 117 W 100% 76%
specvp13 snx-03 + Intel Arc A730M 2.3 fps (0%)
GPU TDP 35 W TDP 117 W TDP 120 W 100% 76% 72%
specvp13 showcase-02 + Intel Arc A770M SPECviewperf 13 - specvp13 showcase-02
105 fps (23%)
specvp13 showcase-02 + Intel Arc A350M
27.7 fps (6%)
GPU TDP 35 W TDP 117 W 26% 100%
specvp13 showcase-02 + Intel Arc A730M
83 fps (18%)
GPU TDP 35 W TDP 117 W TDP 120 W 26% 100% 79%
specvp13 medical-02 + Intel Arc A770M SPECviewperf 13 - specvp13 medical-02
70.4 fps (15%)
specvp13 medical-02 + Intel Arc A350M
19.9 fps (4%)
GPU TDP 35 W TDP 117 W 28% 100%
specvp13 medical-02 + Intel Arc A730M
61.1 fps (13%)
GPU TDP 35 W TDP 117 W TDP 120 W 28% 100% 87%
specvp13 maya-05 + Intel Arc A770M SPECviewperf 13 - specvp13 maya-05
281 fps (32%)
specvp13 maya-05 + Intel Arc A350M
63.6 fps (7%)
GPU TDP 35 W TDP 117 W 23% 100%
specvp13 maya-05 + Intel Arc A730M
230 fps (26%)
GPU TDP 35 W TDP 117 W TDP 120 W 23% 100% 82%
specvp13 energy-02 + Intel Arc A770M SPECviewperf 13 - specvp13 energy-02
19.2 fps (6%)
specvp13 energy-02 + Intel Arc A350M
11.8 fps (4%)
GPU TDP 35 W TDP 117 W 61% 100%
specvp13 energy-02 + Intel Arc A730M
8.1 fps (3%)
GPU TDP 35 W TDP 117 W TDP 120 W 61% 100% 42%
specvp13 creo-02 + Intel Arc A770M SPECviewperf 13 - specvp13 creo-02
77.6 fps (11%)
specvp13 creo-02 + Intel Arc A350M
49.1 fps (7%)
GPU TDP 35 W TDP 117 W 63% 100%
specvp13 creo-02 + Intel Arc A730M
72.9 fps (11%)
GPU TDP 35 W TDP 117 W TDP 120 W 63% 100% 94%
specvp13 catia-05 + Intel Arc A770M SPECviewperf 13 - specvp13 catia-05
211 fps (23%)
specvp13 catia-05 + Intel Arc A350M
77 fps (9%)
GPU TDP 35 W TDP 117 W 36% 100%
specvp13 catia-05 + Intel Arc A730M
194 fps (22%)
GPU TDP 35 W TDP 117 W TDP 120 W 36% 100% 92%
specvp13 3dsmax-06 + Intel Arc A770M SPECviewperf 13 - specvp13 3dsmax-06
149 fps (26%)
specvp13 3dsmax-06 + Intel Arc A350M
55.7 fps (10%)
GPU TDP 35 W TDP 117 W 37% 100%
specvp13 3dsmax-06 + Intel Arc A730M
122 fps (21%)
GPU TDP 35 W TDP 117 W TDP 120 W 37% 100% 82%
SPECviewperf 2020 specvp2020 solidworks-05 4k + Intel Arc A770M SPECviewperf 2020 - specvp2020 solidworks-05 4k
47.4 fps (14%)
specvp2020 solidworks-05 4k + Intel Arc A730M
37 fps (11%)
GPU TDP 117 W TDP 120 W 100% 78%
specvp2020 snx-04 4k + Intel Arc A770M SPECviewperf 2020 - specvp2020 snx-04 4k
2.4 fps (0%)
specvp2020 snx-04 4k + Intel Arc A730M 2.3 fps (0%)
GPU TDP 117 W TDP 120 W 100% 93%
specvp2020 medical-03 4k + Intel Arc A770M SPECviewperf 2020 - specvp2020 medical-03 4k
15.6 fps (15%)
specvp2020 medical-03 4k + Intel Arc A730M
11.9 fps (11%)
GPU TDP 117 W TDP 120 W 100% 76%
specvp2020 maya-06 4k + Intel Arc A770M SPECviewperf 2020 - specvp2020 maya-06 4k
149 fps (24%)
specvp2020 maya-06 4k + Intel Arc A730M
125 fps (20%)
GPU TDP 117 W TDP 120 W 100% 84%
specvp2020 energy-03 4k + Intel Arc A770M SPECviewperf 2020 - specvp2020 energy-03 4k
14.1 fps (3%)
specvp2020 energy-03 4k + Intel Arc A730M
17.2 fps (4%)
GPU TDP 117 W TDP 120 W 82% 100%
specvp2020 creo-03 4k + Intel Arc A770M SPECviewperf 2020 - specvp2020 creo-03 4k
45.5 fps (22%)
specvp2020 creo-03 4k + Intel Arc A730M
41.7 fps (20%)
GPU TDP 117 W TDP 120 W 100% 92%
specvp2020 catia-06 4k + Intel Arc A770M SPECviewperf 2020 - specvp2020 catia-06 4k
36 fps (24%)
specvp2020 catia-06 4k + Intel Arc A730M
26.4 fps (17%)
GPU TDP 117 W TDP 120 W 100% 73%
specvp2020 3dsmax-07 4k + Intel Arc A770M SPECviewperf 2020 - specvp2020 3dsmax-07 4k
40.1 fps (17%)
specvp2020 3dsmax-07 4k + Intel Arc A730M
25.8 fps (11%)
GPU TDP 117 W TDP 120 W 100% 64%
specvp2020 solidworks-05 1080p + Intel Arc A350M SPECviewperf 2020 - specvp2020 solidworks-05 1080p
17.2 fps (3%)
specvp2020 solidworks-05 1080p + Intel Arc A730M
min: 29.92 avg: 61.5 median: 61.5 (12%) max: 93.1 fps
GPU TDP ? TDP 35 W TDP 85 W 32% 18% 100%
specvp2020 snx-04 1080p + Intel Arc A350M SPECviewperf 2020 - specvp2020 snx-04 1080p
3.2 fps (1%)
specvp2020 snx-04 1080p + Intel Arc A730M min: 2.54 avg: 2.7 median: 2.7 (0%) max: 2.93 fps
GPU TDP ? TDP 35 W TDP 85 W 92% 100% 80%
specvp2020 medical-03 1080p + Intel Arc A350M SPECviewperf 2020 - specvp2020 medical-03 1080p
9.1 fps (6%)
specvp2020 medical-03 1080p + Intel Arc A730M
min: 23.48 avg: 24 median: 24 (17%) max: 24.6 fps
GPU TDP ? TDP 35 W TDP 85 W 95% 37% 100%
specvp2020 maya-06 1080p + Intel Arc A350M SPECviewperf 2020 - specvp2020 maya-06 1080p
72 fps (10%)
specvp2020 maya-06 1080p + Intel Arc A730M
min: 123.11 avg: 173.1 median: 173.1 (25%) max: 223.03 fps
GPU TDP ? TDP 35 W TDP 85 W 55% 32% 100%
specvp2020 energy-03 1080p + Intel Arc A350M SPECviewperf 2020 - specvp2020 energy-03 1080p
12 fps (10%)
specvp2020 energy-03 1080p + Intel Arc A730M
min: 14.1 avg: 23 median: 23 (19%) max: 31.88 fps
GPU TDP ? TDP 35 W TDP 85 W 100% 38% 44%
specvp2020 creo-03 1080p + Intel Arc A350M SPECviewperf 2020 - specvp2020 creo-03 1080p
30.8 fps (15%)
specvp2020 creo-03 1080p + Intel Arc A730M
min: 51.98 avg: 54.5 median: 54.5 (27%) max: 57 fps
GPU TDP ? TDP 35 W TDP 85 W 91% 54% 100%
specvp2020 catia-06 1080p + Intel Arc A350M SPECviewperf 2020 - specvp2020 catia-06 1080p
17.4 fps (11%)
specvp2020 catia-06 1080p + Intel Arc A730M
min: 19.92 avg: 20.3 median: 20.3 (13%) max: 20.7 fps
GPU TDP ? TDP 35 W TDP 85 W 96% 84% 100%
specvp2020 3dsmax-07 1080p + Intel Arc A350M SPECviewperf 2020 - specvp2020 3dsmax-07 1080p
20.9 fps (9%)
specvp2020 3dsmax-07 1080p + Intel Arc A730M
min: 47.41 avg: 47.5 median: 47.5 (22%) max: 47.5 fps
GPU TDP ? TDP 35 W TDP 85 W 100% 44% 100%
Cinebench R10 Cinebench R10 Shading (32bit) + Intel Arc A770M Cinebench R10 - Cinebench R10 Shading (32bit)
18594 Points (13%)
Cinebench R10 Shading (32bit) + Intel Arc A730M
min: 15298 avg: 16779 median: 16778.5 (12%) max: 18259 Points
GPU TDP ? TDP 117 W TDP 120 W 82% 100% 98%
Cinebench R11.5 Cinebench R11.5 OpenGL 64 Bit + Intel Arc A770M Cinebench R11.5 - Cinebench R11.5 OpenGL 64 Bit
140 fps (48%)
Cinebench R11.5 OpenGL 64 Bit + Intel Arc A730M
min: 127.86 avg: 129 median: 129 (45%) max: 130.14 fps
GPU TDP ? TDP 117 W TDP 120 W 93% 100% 91%
Cinebench R15 + Intel Arc A770M Cinebench R15 - Cinebench R15 OpenGL 64 Bit
216.5 fps (13%)
Cinebench R15 OpenGL 64 Bit + Intel Arc A350M
min: 138.13 avg: 149.3 median: 149.3 (9%) max: 160.4 fps
GPU TDP ? TDP 35 W TDP 117 W 64% 74% 100%
Cinebench R15 OpenGL 64 Bit + Intel Arc A730M
min: 196.3 avg: 197.6 median: 196.4 (11%) max: 200 fps
GPU TDP ? TDP 35 W TDP 85 W TDP 117 W TDP 120 W 78% 74% 91% 100% 91%
Cinebench R15 OpenGL Ref. Match 64 Bit + Intel Arc A770M Cinebench R15 - Cinebench R15 OpenGL Ref. Match 64 Bit
97.8 % (98%)
Cinebench R15 OpenGL Ref. Match 64 Bit + Intel Arc A350M
97.8 % (98%)
GPU TDP ? TDP 35 W TDP 117 W 100% 100% 100%
Cinebench R15 OpenGL Ref. Match 64 Bit + Intel Arc A730M
97.8 % (98%)
GPU TDP ? TDP 35 W TDP 85 W TDP 117 W TDP 120 W 100% 100% 100% 100% 100%
GFXBench - GFXBench 5.0 4K Aztec Ruins High Tier Offscreen
29.6 fps (12%)
84.3 fps (34%)
GPU TDP ? TDP 35 W 100% 35%
GFXBench - GFXBench 5.0 Aztec Ruins High Tier Offscreen
62.8 fps (11%)
187 fps (34%)
GPU TDP ? TDP 35 W 100% 34%
GFXBench - GFXBench 5.0 Aztec Ruins Normal Tier Offscreen
160 fps (12%)
448 fps (33%)
GPU TDP ? TDP 35 W 100% 36%
GFXBench - GFXBench Car Chase Offscreen
125 fps (14%)
GFXBench 3.1 - GFXBench Manhattan ES 3.1 Offscreen
194 fps (4%)
GFXBench 3.0 - GFXBench 3.0 Manhattan Offscreen
309 fps (18%)
GFXBench (DX / GLBenchmark) 2.7 + Intel Arc A350M GFXBench (DX / GLBenchmark) 2.7 - GFXBench T-Rex HD Offscreen C24Z16
640 fps (5%)
Basemark GPU 1.2 - Basemark GPU 1.2 Vulkan Official Medium Offscreen 1080
104.6 fps (1%)
Basemark GPU 1.2 - Basemark GPU 1.2 Vulkan Official High Offscreen 2160
3.6 fps (1%)
Geekbench 6.2 - Geekbench 6.2 GPU OpenCL
min: 74442 avg: 74865 median: 74865 (22%) max: 75288 Points
GPU TDP 85 W TDP 120 W 100% 99%
Geekbench 6.2 - Geekbench 6.2 GPU Vulkan
min: 74820 avg: 75687 median: 75686.5 (25%) max: 76553 Points
GPU TDP 85 W TDP 120 W 100% 98%
LuxMark v2.0 64Bit - LuxMark v2.0 Room GPU
3678 Samples/s (17%)
1062 Samples/s (5%)
GPU TDP 35 W TDP 117 W 29% 100%
2971 Samples/s (13%)
GPU TDP 35 W TDP 117 W TDP 120 W 29% 100% 81%
LuxMark v2.0 64Bit - LuxMark v2.0 Sala GPU
10975 Samples/s (19%)
2796 Samples/s (5%)
GPU TDP 35 W TDP 117 W 25% 100%
9344 Samples/s (16%)
GPU TDP 35 W TDP 117 W TDP 120 W 25% 100% 85%
ComputeMark v2.1 - ComputeMark v2.1 Result
20027 Points (22%)
4447 Points (5%)
GPU TDP 35 W TDP 117 W 22% 100%
min: 12878 avg: 14039 median: 14038.5 (15%) max: 15199 Points
GPU TDP ? TDP 35 W TDP 117 W TDP 120 W 64% 22% 100% 76%
Power Consumption - Furmark Stress Test Power Consumption - external Monitor *
205 Watt (29%)
min: 60.5 avg: 69.4 median: 69.4 (10%) max: 78.3 Watt
GPU TDP ? TDP 35 W TDP 117 W 125% 129% 100%
min: 131.6 avg: 149.8 median: 140 (20%) max: 177.9 Watt
GPU TDP ? TDP 35 W TDP 85 W TDP 117 W TDP 120 W 120% 129% 113% 100% 105%
Power Consumption - The Witcher 3 Power Consumption - external Monitor *
187.2 Watt (26%)
min: 53.2 avg: 65.1 median: 65.1 (9%) max: 77 Watt
GPU TDP ? TDP 35 W TDP 117 W 121% 125% 100%
min: 145.7 avg: 154.4 median: 149 (21%) max: 168.6 Watt
GPU TDP ? TDP 35 W TDP 85 W TDP 117 W TDP 120 W 114% 125% 107% 100% 104%
Power Consumption - Witcher 3 Power Consumption *
min: 56.7 avg: 71.2 median: 71.2 (16%) max: 85.6 Watt
GPU TDP ? TDP 35 W 100% 108%
min: 155.6 avg: 160.8 median: 160.8 (35%) max: 166 Watt
GPU TDP ? TDP 35 W TDP 85 W 116% 138% 100%
Power Consumption - Witcher 3 ultra Power Efficiency
min: 0.2395 avg: 0.3 median: 0.3 (28%) max: 0.3245 fps per Watt
GPU TDP ? TDP 35 W 74% 100%
0.3 fps per Watt (32%)
GPU TDP ? TDP 35 W 86% 100%
Power Consumption - Witcher 3 ultra Power Efficiency - external Monitor
0.3 fps per Watt (22%)
0.3 fps per Watt (29%)
GPU TDP 35 W TDP 117 W 100% 78%
0.3 fps per Watt (28%)
GPU TDP ? TDP 35 W TDP 117 W 98% 100% 78%
Emissions Witcher 3 Fan Noise + Intel Arc A350M Emissions - Witcher 3 Fan Noise
47.5 dB(A) (76%)
Witcher 3 Fan Noise + Intel Arc A730M
min: 40.5 avg: 47.1 median: 50 (80%) max: 50.65 dB(A)
GPU TDP ? TDP 35 W TDP 85 W TDP 120 W 99% 94% 100% 80%
Clock Speed - GPU Clock Witcher 3 ultra
1800 MHz (71%)
Average Benchmarks Intel Arc A770M → 100% n=26 Average Benchmarks Intel Arc A350M → 45% n=26 Average Benchmarks Intel Arc A730M → 83% n=26
- Range of benchmark values for this graphics card
- Average benchmark values for this graphics card
* Smaller numbers mean a higher performance
1 This benchmark is not used for the average calculation
Game Benchmarks The following benchmarks stem from our benchmarks of review laptops. The performance depends on the used graphics memory, clock rate, processor, system settings, drivers, and operating systems. So the results don't have to be representative for all laptops with this GPU. For detailed information on the benchmark results, click on the fps number.
Average Gaming Intel Arc A770M → 100% Average Gaming 30-70 fps → 100%
Average Gaming Intel Arc A350M → 34% Average Gaming 30-70 fps → 37%
Average Gaming Intel Arc A730M → 77% Average Gaming 30-70 fps → 76%
 Deutsch
 English
 Español
 Français
 Italiano
 Nederlands
 Polski
 Português
 Русский
 Türkçe
 Svenska
 Chinese
 Magyar