AMD Radeon R5 (Bristol Ridge) vs Intel HD Graphics P630
AMD Radeon R5 (Bristol Ridge) ► remove from comparison
The AMD Radeon R5 (Bristol Ridge) is an integrated graphics card for a number of mid-range mobile Bristol-Ridge-based APUs , such as those from the A10 series. It features 384 shader cores clocked at 720 MHz (15 Watt APUs) or 800 MHz (35 Watt APUs). Depending on the configurable TDP (set per laptop model) and the used main memory, the performance can also differ.
Architecture and Features
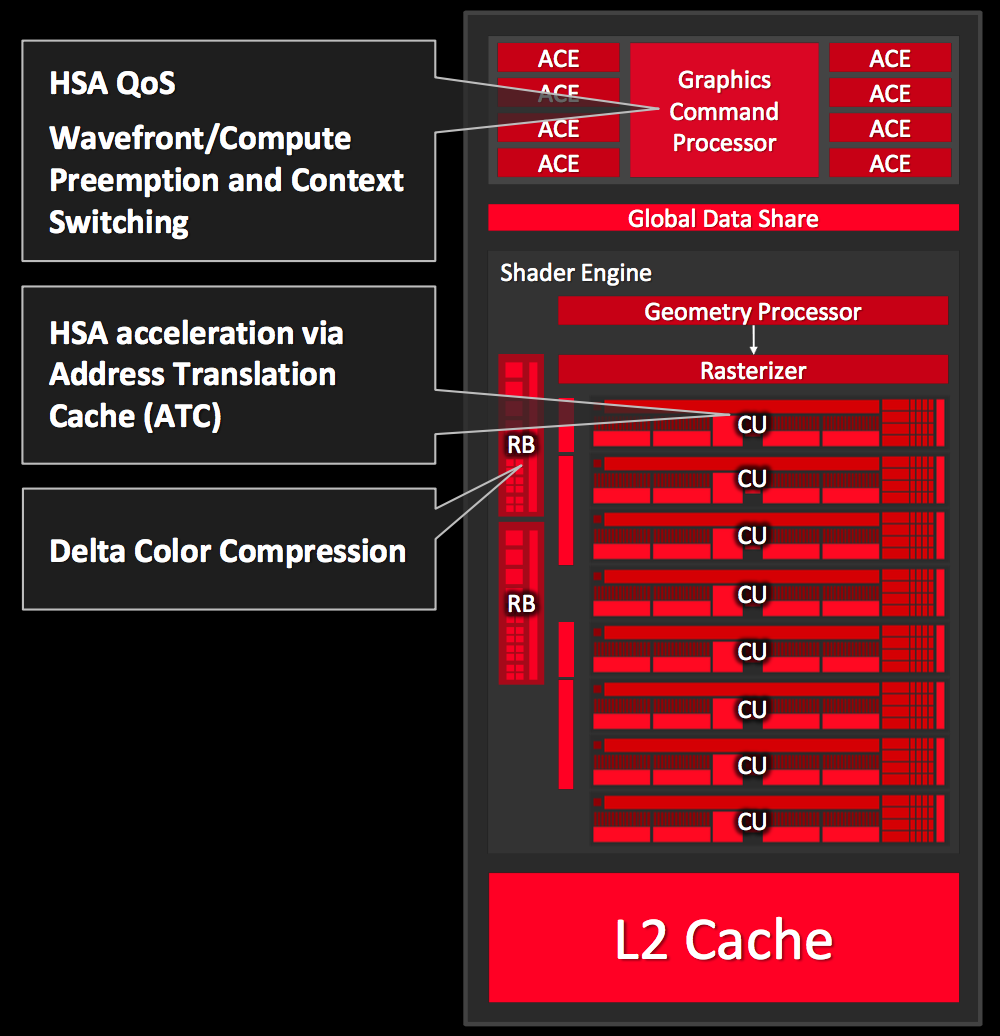
The Radeon R5 utilizes the third generation GCN architecture (sometimes referred to as GCN 1.2) similar to the desktop Tonga chip. As a result, it supports DirectX 12 (FL 12_0) with advanced color compression that leads to a 5-7% improvement in games. Furthermore, its shaders can be used with Mantle, OpenGL and OpenCL. HSA 1.0 is supported for running code on both CPU and GPU cores simultaneously. The improved video decoder UVD 6 (Unified Video Decoder) is now able to decode HVEC / H.265 up to 4K in hardware. Furthermore, the VCE (Video Codec Engine) has been improved for faster transcoding of H.264. More information on architecture and features of the Bristol Ridge architecture can be found in our launch article.
Performance
Gaming performance of the integrated R5 GPU depends on the configured TDP, model and main memory of the system. A typical ULV version with a TDP of 15 Watt paired with fast dual channel main memory is nearly on a level with the dedicated GeForce 920M or Radeon R7 M260 (see gaming benchmarks below). Therefore, demanding games of 2015 and 2016 may only run in the lowest detail settings fluently (and some not at all).
Power Consumption
Depending on the configured TDP, the still in 28 nm produced chip may be used in thin-and-light (12 - 20 Watt range) to standard-sized laptops (35 Watt TDP).
Intel HD Graphics P630 ► remove from comparison
The Intel HD Graphics P630 (GT2) is an integrated graphics unit, which can be found in various Xeon workstation processors of the Kaby Lake generation. The "GT2" version of the Skylake GPU offers 24 Execution Units (EUs) clocked at up to 1050 MHz (depending on the CPU model). Due to its lack of dedicated graphics memory or eDRAM cache, the P630 has to access the main memory (2x 64bit DDR3L-1600 / DDR4-2133). It uses the same silicon as the consumer HD Graphics 630 in Kaby-Lake-H processors but features optimized drivers for workstaion and CAD software. According to Intel it is certified for 15 applications (see list ).
Performance
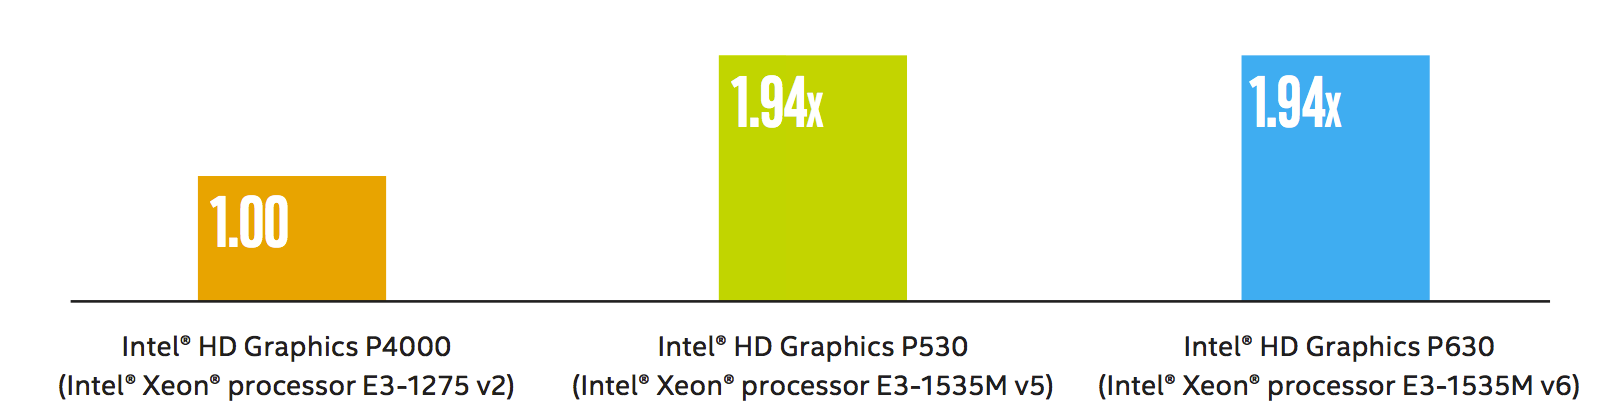
According to Intel, the performance of the P630 is identical to the Intel HD Graphis P530 (Skylake predecessor) processor graphics card and 1.94x faster than the old Intel HD Graphics P4000. Compared to consumer cards, the gaming performance should be on a similar level to the dedicated GeForce 920M and will handle old games (as of 2015) in low or medium settings.
Features
The revised video engine in the Kaby Lake chips now supports H.265/HEVC Main10 profile at 10-bit color depth and also the VP9 codec in hardware. Furthermore, HDCP 2.2 is also supported in all chips, which allows Netflix 4K videos, for instance.
Power Consumption
The HD Graphics P630 can be found in mobile quad-core Xeon processors with 45 W TDP and also desktop processors of the Xeon range with higher TDPs.
Source : http://www.intel.com/content/dam/www/public/us/en/documents/guides/hd-graphics-performance-guide.pdf
AMD Radeon R5 (Bristol Ridge) Intel HD Graphics P630 Gen. 9.5 Series Codename Bristol Ridge Kaby-Lake-H-GT2 Architecture GCN 1.2/2.0 Gen. 9.5 Kaby Lake Pipelines 384 - unified 24 - unified Core Speed 800 (Boost) MHz Memory Bus Width 64/128 Bit 64/128 Bit Shared Memory yes yes API DirectX 12 (FL 12_0), OpenGL 4.4 DirectX 12_1, OpenGL 4.4 Power Consumption 12-45 Watt Transistors 3.1 Billion technology 28 nm 14 nm Features UVD 6, VCE QuickSync Notebook Size medium sized Date of Announcement 01.06.2016 05.08.2015
Benchmarks Performance Rating - 3DMark 11 + Fire Strike + Time Spy - Radeon R5 (Bristol Ridge)
0.6 pt (2%)
...
AMD Radeon R5 (Bristol Ridge)
...
max:
3DMark - 3DMark Time Spy Score
400 Points (1%)
3DMark - 3DMark Ice Storm Unlimited Graphics
min: 54723 avg: 58018 median: 58018 (7%) max: 61313 Points
3DMark - 3DMark Ice Storm Extreme Graphics
min: 36785 avg: 36979 median: 36979 (5%) max: 37173 Points
3DMark - 3DMark Cloud Gate Score
min: 4797 avg: 4981 median: 4980.5 (5%) max: 5164 Points
8280 Points (9%)
3DMark - 3DMark Cloud Gate Graphics
min: 7689 avg: 8256 median: 8255.5 (2%) max: 8822 Points
3DMark - 3DMark Fire Strike Standard Score
min: 994 avg: 1054 median: 1053.5 (2%) max: 1113 Points
1040 Points (2%)
3DMark - 3DMark Fire Strike Standard Graphics
min: 1230 avg: 1284 median: 1283.5 (1%) max: 1337 Points
3DMark - 3DMark Ice Storm Graphics
min: 50152 avg: 51420 median: 51419.5 (6%) max: 52687 Points
3DMark 11 - 3DM11 Performance Score
min: 1672 avg: 1820 median: 1874 (3%) max: 1913 Points
3DMark 11 - 3DM11 Performance GPU
min: 1482 avg: 1708 median: 1720 (1%) max: 1921 Points
3DMark 06 3DMark 06 - Standard 1280x1024 + AMD Radeon R5 (Bristol Ridge)
min: 6431 avg: 6817 median: 6816.5 (9%) max: 7202 Points
Cinebench R10 Cinebench R10 Shading (32bit) + AMD Radeon R5 (Bristol Ridge) Cinebench R10 - Cinebench R10 Shading (32bit)
min: 5016 avg: 5133 median: 5132.5 (4%) max: 5249 Points
Cinebench R11.5 Cinebench R11.5 OpenGL 64 Bit + AMD Radeon R5 (Bristol Ridge) Cinebench R11.5 - Cinebench R11.5 OpenGL 64 Bit
23.6 fps (8%)
Cinebench R15 + AMD Radeon R5 (Bristol Ridge) Cinebench R15 - Cinebench R15 OpenGL 64 Bit
min: 28.25 avg: 30 median: 30 (2%) max: 31.76 fps
Cinebench R15 OpenGL Ref. Match 64 Bit + AMD Radeon R5 (Bristol Ridge) Cinebench R15 - Cinebench R15 OpenGL Ref. Match 64 Bit
98 % (98%)
GFXBench 3.0 - GFXBench 3.0 Manhattan Offscreen
31.6 fps (2%)
GFXBench (DX / GLBenchmark) 2.7 + AMD Radeon R5 (Bristol Ridge) GFXBench (DX / GLBenchmark) 2.7 - GFXBench T-Rex HD Offscreen C24Z16
107 fps (1%)
LuxMark v2.0 64Bit - LuxMark v2.0 Room GPU
174 Samples/s (1%)
LuxMark v2.0 64Bit - LuxMark v2.0 Sala GPU
331 Samples/s (1%)
ComputeMark v2.1 - ComputeMark v2.1 Result
1127 Points (1%)
Average Benchmarks AMD Radeon R5 (Bristol Ridge) → 100% n=2 Average Benchmarks Intel HD Graphics P630 → 132% n=2
- Range of benchmark values for this graphics card
- Average benchmark values for this graphics card
* Smaller numbers mean a higher performance
1 This benchmark is not used for the average calculation
Game Benchmarks The following benchmarks stem from our benchmarks of review laptops. The performance depends on the used graphics memory, clock rate, processor, system settings, drivers, and operating systems. So the results don't have to be representative for all laptops with this GPU. For detailed information on the benchmark results, click on the fps number.
100%
Radeon R5 (Bristol Ridge):
10.1 [X] HP Probook 455 G4 Y8B43EA AMD A10-9600P 2.4GHz
Radeon R5 (Bristol Ridge)
fps
100%
Radeon R5 (Bristol Ridge):
12.4 [X] HP Probook 455 G4 Y8B43EA AMD A10-9600P 2.4GHz
Radeon R5 (Bristol Ridge)
fps
100%
Radeon R5 (Bristol Ridge):
6.6 [X] HP Probook 455 G4 Y8B43EA AMD A10-9600P 2.4GHz
Radeon R5 (Bristol Ridge)
fps
100%
Radeon R5 (Bristol Ridge):
6.5 [X] HP Probook 455 G4 Y8B43EA AMD A10-9600P 2.4GHz
Radeon R5 (Bristol Ridge)
fps
100%
Radeon R5 (Bristol Ridge):
9.6 [X] HP Probook 455 G4 Y8B43EA AMD A10-9600P 2.4GHz
Radeon R5 (Bristol Ridge)
fps
100%
Radeon R5 (Bristol Ridge):
7 [X] HP Probook 455 G4 Y8B43EA AMD A10-9600P 2.4GHz
Radeon R5 (Bristol Ridge)
fps
100%
Radeon R5 (Bristol Ridge):
6 [X] HP Probook 455 G4 Y8B43EA AMD A10-9600P 2.4GHz
Radeon R5 (Bristol Ridge)
fps
100%
Radeon R5 (Bristol Ridge):
31.1 [X] HP Probook 455 G4 Y8B43EA AMD A10-9600P 2.4GHz
Radeon R5 (Bristol Ridge)
fps
100%
Radeon R5 (Bristol Ridge):
10.2 [X] HP Probook 455 G4 Y8B43EA AMD A10-9600P 2.4GHz
Radeon R5 (Bristol Ridge)
fps
100%
Radeon R5 (Bristol Ridge):
10.2 [X] HP Probook 455 G4 Y8B43EA AMD A10-9600P 2.4GHz
Radeon R5 (Bristol Ridge)
fps
100%
Radeon R5 (Bristol Ridge):
17 [X] HP Probook 455 G4 Y8B43EA AMD A10-9600P 2.4GHz
Radeon R5 (Bristol Ridge)
fps
100%
Radeon R5 (Bristol Ridge):
12.8 [X] HP Probook 455 G4 Y8B43EA AMD A10-9600P 2.4GHz
Radeon R5 (Bristol Ridge)
min:
11 fps, max:
14 fps
fps
100%
Radeon R5 (Bristol Ridge):
12.7 [X] HP Probook 455 G4 Y8B43EA AMD A10-9600P 2.4GHz
Radeon R5 (Bristol Ridge)
fps
100%
Radeon R5 (Bristol Ridge):
6 [X] HP Probook 455 G4 Y8B43EA AMD A10-9600P 2.4GHz
Radeon R5 (Bristol Ridge)
fps
100%
Radeon R5 (Bristol Ridge):
29.1 [X] HP Probook 455 G4 Y8B43EA AMD A10-9600P 2.4GHz
Radeon R5 (Bristol Ridge)
fps
100%
Radeon R5 (Bristol Ridge):
3 [X] HP Probook 455 G4 Y8B43EA AMD A10-9600P 2.4GHz
Radeon R5 (Bristol Ridge)
fps
100%
Radeon R5 (Bristol Ridge):
8 [X] HP Probook 455 G4 Y8B43EA AMD A10-9600P 2.4GHz
Radeon R5 (Bristol Ridge)
fps
100%
Radeon R5 (Bristol Ridge):
7.9 [X] HP Probook 455 G4 Y8B43EA AMD A10-9600P 2.4GHz
Radeon R5 (Bristol Ridge)
fps
100%
Radeon R5 (Bristol Ridge):
14.4 [X] HP Probook 455 G4 Y8B43EA AMD A10-9600P 2.4GHz
Radeon R5 (Bristol Ridge)
fps
100%
Radeon R5 (Bristol Ridge):
11.9 [X] HP Probook 455 G4 Y8B43EA AMD A10-9600P 2.4GHz
Radeon R5 (Bristol Ridge)
fps
100%
Radeon R5 (Bristol Ridge):
21 [X] HP Probook 455 G4 Y8B43EA AMD A10-9600P 2.4GHz
Radeon R5 (Bristol Ridge)
fps
100%
Radeon R5 (Bristol Ridge):
9.5 [X] HP Probook 455 G4 Y8B43EA AMD A10-9600P 2.4GHz
Radeon R5 (Bristol Ridge)
fps
100%
Radeon R5 (Bristol Ridge):
30.7 [X] HP Probook 455 G4 Y8B43EA AMD A10-9600P 2.4GHz
Radeon R5 (Bristol Ridge)
fps
100%
Radeon R5 (Bristol Ridge):
10.4 [X] HP Probook 455 G4 Y8B43EA AMD A10-9600P 2.4GHz
Radeon R5 (Bristol Ridge)
fps
100%
Radeon R5 (Bristol Ridge):
9.1 [X] HP Probook 455 G4 Y8B43EA AMD A10-9600P 2.4GHz
Radeon R5 (Bristol Ridge)
fps
100%
Radeon R5 (Bristol Ridge):
8.9 [X] HP Probook 455 G4 Y8B43EA AMD A10-9600P 2.4GHz
Radeon R5 (Bristol Ridge)
fps
100%
Radeon R5 (Bristol Ridge):
9 [X] HP Probook 455 G4 Y8B43EA AMD A10-9600P 2.4GHz
Radeon R5 (Bristol Ridge)
fps
100%
Radeon R5 (Bristol Ridge):
16 [X] HP Probook 455 G4 Y8B43EA AMD A10-9600P 2.4GHz
Radeon R5 (Bristol Ridge)
fps
100%
Radeon R5 (Bristol Ridge):
11 [X] HP Probook 455 G4 Y8B43EA AMD A10-9600P 2.4GHz
Radeon R5 (Bristol Ridge)
fps
100%
Radeon R5 (Bristol Ridge):
11 [X] HP Probook 455 G4 Y8B43EA AMD A10-9600P 2.4GHz
Radeon R5 (Bristol Ridge)
fps
100%
Radeon R5 (Bristol Ridge):
15 [X] HP Probook 455 G4 Y8B43EA AMD A10-9600P 2.4GHz
Radeon R5 (Bristol Ridge)
fps
100%
Radeon R5 (Bristol Ridge):
8.6 [X] HP Probook 455 G4 Y8B43EA AMD A10-9600P 2.4GHz
Radeon R5 (Bristol Ridge)
fps
100%
Radeon R5 (Bristol Ridge):
9.2 [X] HP Probook 455 G4 Y8B43EA AMD A10-9600P 2.4GHz
Radeon R5 (Bristol Ridge)
fps
100%
Radeon R5 (Bristol Ridge):
5 [X] HP Probook 455 G4 Y8B43EA AMD A10-9600P 2.4GHz
Radeon R5 (Bristol Ridge)
fps
100%
Radeon R5 (Bristol Ridge):
88.2 [X] HP Probook 455 G4 Y8B43EA AMD A10-9600P 2.4GHz
Radeon R5 (Bristol Ridge)
fps
100%
Radeon R5 (Bristol Ridge):
12.6 [X] HP Probook 455 G4 Y8B43EA AMD A10-9600P 2.4GHz
Radeon R5 (Bristol Ridge)
fps
100%
Radeon R5 (Bristol Ridge):
12.7 [X] HP mt43 AMD PRO A8-9600B 2.4GHz
Radeon R5 (Bristol Ridge)
fps
100%
Radeon R5 (Bristol Ridge):
8.6 [X] HP mt43 AMD PRO A8-9600B 2.4GHz
Radeon R5 (Bristol Ridge)
fps
100%
Radeon R5 (Bristol Ridge):
9.4 [X] HP mt43 AMD PRO A8-9600B 2.4GHz
Radeon R5 (Bristol Ridge)
fps
100%
Radeon R5 (Bristol Ridge):
4.4 [X] HP mt43 AMD PRO A8-9600B 2.4GHz
Radeon R5 (Bristol Ridge)
fps
100%
Radeon R5 (Bristol Ridge):
8 [X] HP mt43 AMD PRO A8-9600B 2.4GHz
Radeon R5 (Bristol Ridge)
fps
100%
Radeon R5 (Bristol Ridge):
4 [X] HP mt43 AMD PRO A8-9600B 2.4GHz
Radeon R5 (Bristol Ridge)
fps
100%
Radeon R5 (Bristol Ridge):
29.4 [X] HP mt43 AMD PRO A8-9600B 2.4GHz
Radeon R5 (Bristol Ridge)
fps
100%
Radeon R5 (Bristol Ridge):
9 [X] HP mt43 AMD PRO A8-9600B 2.4GHz
Radeon R5 (Bristol Ridge)
fps
100%
Radeon R5 (Bristol Ridge):
9 [X] HP mt43 AMD PRO A8-9600B 2.4GHz
Radeon R5 (Bristol Ridge)
fps
100%
Radeon R5 (Bristol Ridge):
6.3 [X] HP mt43 AMD PRO A8-9600B 2.4GHz
Radeon R5 (Bristol Ridge)
fps
100%
Radeon R5 (Bristol Ridge):
11.2 [X] HP mt43 AMD PRO A8-9600B 2.4GHz
Radeon R5 (Bristol Ridge)
fps
100%
Radeon R5 (Bristol Ridge):
7.9 [X] HP mt43 AMD PRO A8-9600B 2.4GHz
Radeon R5 (Bristol Ridge)
fps
100%
Radeon R5 (Bristol Ridge):
20.7 [X] HP mt43 AMD PRO A8-9600B 2.4GHz
Radeon R5 (Bristol Ridge)
fps
100%
Radeon R5 (Bristol Ridge):
14.2 [X] HP mt43 AMD PRO A8-9600B 2.4GHz
Radeon R5 (Bristol Ridge)
fps
100%
Radeon R5 (Bristol Ridge):
10 [X] HP mt43 AMD PRO A8-9600B 2.4GHz
Radeon R5 (Bristol Ridge)
fps
100%
Radeon R5 (Bristol Ridge):
6 [X] HP mt43 AMD PRO A8-9600B 2.4GHz
Radeon R5 (Bristol Ridge)
fps
100%
Radeon R5 (Bristol Ridge):
15.3 [X] HP mt43 AMD PRO A8-9600B 2.4GHz
Radeon R5 (Bristol Ridge)
fps
100%
Radeon R5 (Bristol Ridge):
10.7 [X] HP mt43 AMD PRO A8-9600B 2.4GHz
Radeon R5 (Bristol Ridge)
fps
100%
Radeon R5 (Bristol Ridge):
5.8 [X] HP mt43 AMD PRO A8-9600B 2.4GHz
Radeon R5 (Bristol Ridge)
fps
100%
Radeon R5 (Bristol Ridge):
16 [X] HP mt43 AMD PRO A8-9600B 2.4GHz
Radeon R5 (Bristol Ridge)
fps
100%
Radeon R5 (Bristol Ridge):
7 [X] HP mt43 AMD PRO A8-9600B 2.4GHz
Radeon R5 (Bristol Ridge)
fps
100%
Radeon R5 (Bristol Ridge):
18 [X] HP mt43 AMD PRO A8-9600B 2.4GHz
Radeon R5 (Bristol Ridge)
fps
100%
Radeon R5 (Bristol Ridge):
14 [X] HP mt43 AMD PRO A8-9600B 2.4GHz
Radeon R5 (Bristol Ridge)
fps
100%
Radeon R5 (Bristol Ridge):
38.5 [X] HP mt43 AMD PRO A8-9600B 2.4GHz
Radeon R5 (Bristol Ridge)
fps
100%
Radeon R5 (Bristol Ridge):
38.3 [X] HP mt43 AMD PRO A8-9600B 2.4GHz
Radeon R5 (Bristol Ridge)
fps
100%
Radeon R5 (Bristol Ridge):
31.1 [X] HP mt43 AMD PRO A8-9600B 2.4GHz
Radeon R5 (Bristol Ridge)
fps
100%
Radeon R5 (Bristol Ridge):
21.9 [X] HP mt43 AMD PRO A8-9600B 2.4GHz
Radeon R5 (Bristol Ridge)
fps
100%
Radeon R5 (Bristol Ridge):
39.2 [X] HP mt43 AMD PRO A8-9600B 2.4GHz
Radeon R5 (Bristol Ridge)
fps
100%
Radeon R5 (Bristol Ridge):
12.1 [X] HP mt43 AMD PRO A8-9600B 2.4GHz
Radeon R5 (Bristol Ridge)
fps
100%
Radeon R5 (Bristol Ridge):
61.3 [X] HP mt43 AMD PRO A8-9600B 2.4GHz
Radeon R5 (Bristol Ridge)
fps
100%
Radeon R5 (Bristol Ridge):
22.8 [X] HP mt43 AMD PRO A8-9600B 2.4GHz
Radeon R5 (Bristol Ridge)
fps
100%
Radeon R5 (Bristol Ridge):
14.3 [X] HP mt43 AMD PRO A8-9600B 2.4GHz
Radeon R5 (Bristol Ridge)
fps
100%
Radeon R5 (Bristol Ridge):
21 [X] HP mt43 AMD PRO A8-9600B 2.4GHz
Radeon R5 (Bristol Ridge)
fps
100%
Radeon R5 (Bristol Ridge):
10.8 [X] HP mt43 AMD PRO A8-9600B 2.4GHz
Radeon R5 (Bristol Ridge)
fps
100%
Radeon R5 (Bristol Ridge):
8.8 [X] HP mt43 AMD PRO A8-9600B 2.4GHz
Radeon R5 (Bristol Ridge)
fps
100%
Radeon R5 (Bristol Ridge):
5.3 [X] HP mt43 AMD PRO A8-9600B 2.4GHz
Radeon R5 (Bristol Ridge)
fps
100%
Radeon R5 (Bristol Ridge):
13 [X] HP mt43 AMD PRO A8-9600B 2.4GHz
Radeon R5 (Bristol Ridge)
fps
100%
Radeon R5 (Bristol Ridge):
6 [X] HP mt43 AMD PRO A8-9600B 2.4GHz
Radeon R5 (Bristol Ridge)
fps
100%
Radeon R5 (Bristol Ridge):
12.7 [X] HP mt43 AMD PRO A8-9600B 2.4GHz
Radeon R5 (Bristol Ridge)
fps
100%
Radeon R5 (Bristol Ridge):
5.6 [X] HP mt43 AMD PRO A8-9600B 2.4GHz
Radeon R5 (Bristol Ridge)
fps
100%
Radeon R5 (Bristol Ridge):
20.8 [X] HP mt43 AMD PRO A8-9600B 2.4GHz
Radeon R5 (Bristol Ridge)
fps
100%
Radeon R5 (Bristol Ridge):
6.8 [X] HP mt43 AMD PRO A8-9600B 2.4GHz
Radeon R5 (Bristol Ridge)
fps
100%
Radeon R5 (Bristol Ridge):
38.8 fps
100%
Radeon R5 (Bristol Ridge):
29.1 fps
100%
Radeon R5 (Bristol Ridge):
27.9 fps
100%
Radeon R5 (Bristol Ridge):
23.4 fps
100%
Radeon R5 (Bristol Ridge):
60.3 fps
100%
Radeon R5 (Bristol Ridge):
38.4 fps
100%
Radeon R5 (Bristol Ridge):
16.5 fps
100%
Radeon R5 (Bristol Ridge):
12.1 fps
100%
Radeon R5 (Bristol Ridge):
30.5 fps
100%
Radeon R5 (Bristol Ridge):
13.9 fps
100%
Radeon R5 (Bristol Ridge):
13.9 fps
100%
Radeon R5 (Bristol Ridge):
10.1 fps
100%
Radeon R5 (Bristol Ridge):
21.1 fps
100%
Radeon R5 (Bristol Ridge):
13.6 fps
100%
Radeon R5 (Bristol Ridge):
32.5 [X] HP mt43 AMD PRO A8-9600B 2.4GHz
Radeon R5 (Bristol Ridge)
fps
100%
Radeon R5 (Bristol Ridge):
29 [X] HP mt43 AMD PRO A8-9600B 2.4GHz
Radeon R5 (Bristol Ridge)
fps
100%
Radeon R5 (Bristol Ridge):
16 [X] HP mt43 AMD PRO A8-9600B 2.4GHz
Radeon R5 (Bristol Ridge)
fps
100%
Radeon R5 (Bristol Ridge):
11.6 [X] HP mt43 AMD PRO A8-9600B 2.4GHz
Radeon R5 (Bristol Ridge)
fps
100%
Radeon R5 (Bristol Ridge):
8 [X] HP mt43 AMD PRO A8-9600B 2.4GHz
Radeon R5 (Bristol Ridge)
fps
100%
Radeon R5 (Bristol Ridge):
5 [X] HP mt43 AMD PRO A8-9600B 2.4GHz
Radeon R5 (Bristol Ridge)
fps
100%
Radeon R5 (Bristol Ridge):
18.6 fps
100%
Radeon R5 (Bristol Ridge):
15 fps
100%
Radeon R5 (Bristol Ridge):
9.4 [X] HP mt43 AMD PRO A8-9600B 2.4GHz
Radeon R5 (Bristol Ridge)
fps
100%
Radeon R5 (Bristol Ridge):
6.1 [X] HP mt43 AMD PRO A8-9600B 2.4GHz
Radeon R5 (Bristol Ridge)
fps
100%
Radeon R5 (Bristol Ridge):
19.6 fps
100%
Radeon R5 (Bristol Ridge):
11.5 fps
100%
Radeon R5 (Bristol Ridge):
13 fps
100%
Radeon R5 (Bristol Ridge):
8 fps
100%
Radeon R5 (Bristol Ridge):
15.9 fps
100%
Radeon R5 (Bristol Ridge):
6.1 fps
100%
Radeon R5 (Bristol Ridge):
20.6 fps
100%
Radeon R5 (Bristol Ridge):
11.2 fps
100%
Radeon R5 (Bristol Ridge):
6.2 fps
100%
Radeon R5 (Bristol Ridge):
36.3 fps
100%
Radeon R5 (Bristol Ridge):
24.3 fps
100%
Radeon R5 (Bristol Ridge):
13.3 fps
100%
Radeon R5 (Bristol Ridge):
12.4 fps
100%
Radeon R5 (Bristol Ridge):
8.3 fps
100%
Radeon R5 (Bristol Ridge):
22.9 fps
100%
Radeon R5 (Bristol Ridge):
12.7 fps
100%
Radeon R5 (Bristol Ridge):
7.8 fps
100%
Radeon R5 (Bristol Ridge):
22.1 fps
100%
Radeon R5 (Bristol Ridge):
15.2 fps
100%
Radeon R5 (Bristol Ridge):
6.5 fps
100%
Radeon R5 (Bristol Ridge):
17.4 fps
100%
Radeon R5 (Bristol Ridge):
11 fps
100%
Radeon R5 (Bristol Ridge):
41.2 fps
100%
Radeon R5 (Bristol Ridge):
29.1 fps
100%
Radeon R5 (Bristol Ridge):
16.9 fps
100%
Radeon R5 (Bristol Ridge):
14 fps
100%
Radeon R5 (Bristol Ridge):
46.1 fps
100%
Radeon R5 (Bristol Ridge):
30 fps
100%
Radeon R5 (Bristol Ridge):
19 fps
100%
Radeon R5 (Bristol Ridge):
9.4 fps
100%
Radeon R5 (Bristol Ridge):
37.9 [X] HP mt43 AMD PRO A8-9600B 2.4GHz
Radeon R5 (Bristol Ridge)
fps
100%
Radeon R5 (Bristol Ridge):
24.1 [X] HP mt43 AMD PRO A8-9600B 2.4GHz
Radeon R5 (Bristol Ridge)
fps
100%
Radeon R5 (Bristol Ridge):
17.7 [X] HP mt43 AMD PRO A8-9600B 2.4GHz
Radeon R5 (Bristol Ridge)
fps
100%
Radeon R5 (Bristol Ridge):
16.7 [X] HP mt43 AMD PRO A8-9600B 2.4GHz
Radeon R5 (Bristol Ridge)
fps
100%
Radeon R5 (Bristol Ridge):
20.2 fps
100%
Radeon R5 (Bristol Ridge):
11 fps
100%
Radeon R5 (Bristol Ridge):
5.9 fps
100%
Radeon R5 (Bristol Ridge):
65.3 fps
100%
Radeon R5 (Bristol Ridge):
20.6 fps
100%
Radeon R5 (Bristol Ridge):
13.1 fps
100%
Radeon R5 (Bristol Ridge):
38 fps
100%
Radeon R5 (Bristol Ridge):
35.2 fps
100%
Radeon R5 (Bristol Ridge):
22.8 fps
100%
Radeon R5 (Bristol Ridge):
12.8 fps
100%
Radeon R5 (Bristol Ridge):
25.7 fps
100%
Radeon R5 (Bristol Ridge):
18.2 fps
100%
Radeon R5 (Bristol Ridge):
54 fps
100%
Radeon R5 (Bristol Ridge):
34 fps
100%
Radeon R5 (Bristol Ridge):
42.9 [X] HP mt43 AMD PRO A8-9600B 2.4GHz
Radeon R5 (Bristol Ridge)
fps
100%
Radeon R5 (Bristol Ridge):
22.9 [X] HP mt43 AMD PRO A8-9600B 2.4GHz
Radeon R5 (Bristol Ridge)
fps
100%
Radeon R5 (Bristol Ridge):
11.7 [X] HP mt43 AMD PRO A8-9600B 2.4GHz
Radeon R5 (Bristol Ridge)
fps
100%
Radeon R5 (Bristol Ridge):
11.5 [X] HP mt43 AMD PRO A8-9600B 2.4GHz
Radeon R5 (Bristol Ridge)
fps
100%
Radeon R5 (Bristol Ridge):
34.6 fps
100%
Radeon R5 (Bristol Ridge):
18.3 fps
100%
Radeon R5 (Bristol Ridge):
99.6 fps
100%
Radeon R5 (Bristol Ridge):
35.4 fps
100%
Radeon R5 (Bristol Ridge):
19.4 fps
100%
Radeon R5 (Bristol Ridge):
15.8 fps
100%
Radeon R5 (Bristol Ridge):
70.1 [X] HP mt43 AMD PRO A8-9600B 2.4GHz
Radeon R5 (Bristol Ridge)
fps
100%
Radeon R5 (Bristol Ridge):
27.3 [X] HP mt43 AMD PRO A8-9600B 2.4GHz
Radeon R5 (Bristol Ridge)
fps
100%
Radeon R5 (Bristol Ridge):
15.5 [X] HP mt43 AMD PRO A8-9600B 2.4GHz
Radeon R5 (Bristol Ridge)
fps
100%
Radeon R5 (Bristol Ridge):
12.5 [X] HP mt43 AMD PRO A8-9600B 2.4GHz
Radeon R5 (Bristol Ridge)
fps
100%
Radeon R5 (Bristol Ridge):
35.8 fps
100%
Radeon R5 (Bristol Ridge):
24.3 fps
100%
Radeon R5 (Bristol Ridge):
18.2 fps
100%
Radeon R5 (Bristol Ridge):
7 fps
100%
Radeon R5 (Bristol Ridge):
26.5 fps
100%
Radeon R5 (Bristol Ridge):
18.2 fps
100%
Radeon R5 (Bristol Ridge):
12.4 fps
100%
Radeon R5 (Bristol Ridge):
6.9 fps
100%
Radeon R5 (Bristol Ridge):
61.1 [X] HP mt43 AMD PRO A8-9600B 2.4GHz
Radeon R5 (Bristol Ridge)
63.9 66.1 ~ 64 fps
100%
Radeon R5 (Bristol Ridge):
32.7 36.3 [X] HP mt43 AMD PRO A8-9600B 2.4GHz
Radeon R5 (Bristol Ridge)
40.5 ~ 37 fps
100%
Radeon R5 (Bristol Ridge):
25.5 31.2 [X] HP mt43 AMD PRO A8-9600B 2.4GHz
Radeon R5 (Bristol Ridge)
32.1 ~ 30 fps
100%
Radeon R5 (Bristol Ridge):
10.2 11 [X] HP mt43 AMD PRO A8-9600B 2.4GHz
Radeon R5 (Bristol Ridge)
~ 11 fps
100%
Radeon R5 (Bristol Ridge):
67.4 [X] HP mt43 AMD PRO A8-9600B 2.4GHz
Radeon R5 (Bristol Ridge)
fps
100%
Radeon R5 (Bristol Ridge):
37.4 [X] HP mt43 AMD PRO A8-9600B 2.4GHz
Radeon R5 (Bristol Ridge)
fps
100%
Radeon R5 (Bristol Ridge):
21.1 [X] HP mt43 AMD PRO A8-9600B 2.4GHz
Radeon R5 (Bristol Ridge)
fps
100%
Radeon R5 (Bristol Ridge):
9.9 [X] HP mt43 AMD PRO A8-9600B 2.4GHz
Radeon R5 (Bristol Ridge)
fps
100%
Radeon R5 (Bristol Ridge):
25.6 fps
100%
Radeon R5 (Bristol Ridge):
20.5 fps
100%
Radeon R5 (Bristol Ridge):
11.5 fps
100%
Radeon R5 (Bristol Ridge):
4.2 fps
100%
Radeon R5 (Bristol Ridge):
50.9 [X] HP mt43 AMD PRO A8-9600B 2.4GHz
Radeon R5 (Bristol Ridge)
fps
100%
Radeon R5 (Bristol Ridge):
29.3 [X] HP mt43 AMD PRO A8-9600B 2.4GHz
Radeon R5 (Bristol Ridge)
fps
100%
Radeon R5 (Bristol Ridge):
24.6 [X] HP mt43 AMD PRO A8-9600B 2.4GHz
Radeon R5 (Bristol Ridge)
fps
100%
Radeon R5 (Bristol Ridge):
16.9 [X] HP mt43 AMD PRO A8-9600B 2.4GHz
Radeon R5 (Bristol Ridge)
fps
100%
Radeon R5 (Bristol Ridge):
50.7 fps
100%
Radeon R5 (Bristol Ridge):
36.6 fps
100%
Radeon R5 (Bristol Ridge):
32.9 fps
100%
Radeon R5 (Bristol Ridge):
23.6 fps
100%
Radeon R5 (Bristol Ridge):
62.9 [X] HP mt43 AMD PRO A8-9600B 2.4GHz
Radeon R5 (Bristol Ridge)
fps
100%
Radeon R5 (Bristol Ridge):
33.5 [X] HP mt43 AMD PRO A8-9600B 2.4GHz
Radeon R5 (Bristol Ridge)
fps
100%
Radeon R5 (Bristol Ridge):
21.5 [X] HP mt43 AMD PRO A8-9600B 2.4GHz
Radeon R5 (Bristol Ridge)
fps
100%
Radeon R5 (Bristol Ridge):
9.4 [X] HP mt43 AMD PRO A8-9600B 2.4GHz
Radeon R5 (Bristol Ridge)
fps
100%
Radeon R5 (Bristol Ridge):
36.2 fps
100%
Radeon R5 (Bristol Ridge):
25.9 fps
100%
Radeon R5 (Bristol Ridge):
18.8 fps
100%
Radeon R5 (Bristol Ridge):
64.1 [X] HP mt43 AMD PRO A8-9600B 2.4GHz
Radeon R5 (Bristol Ridge)
fps
100%
Radeon R5 (Bristol Ridge):
41.4 [X] HP mt43 AMD PRO A8-9600B 2.4GHz
Radeon R5 (Bristol Ridge)
fps
100%
Radeon R5 (Bristol Ridge):
16.2 [X] HP mt43 AMD PRO A8-9600B 2.4GHz
Radeon R5 (Bristol Ridge)
fps
100%
Radeon R5 (Bristol Ridge):
105.8 [X] HP mt43 AMD PRO A8-9600B 2.4GHz
Radeon R5 (Bristol Ridge)
fps
100%
Radeon R5 (Bristol Ridge):
32.1 [X] HP mt43 AMD PRO A8-9600B 2.4GHz
Radeon R5 (Bristol Ridge)
fps
100%
Radeon R5 (Bristol Ridge):
26.2 [X] HP mt43 AMD PRO A8-9600B 2.4GHz
Radeon R5 (Bristol Ridge)
fps
100%
Radeon R5 (Bristol Ridge):
17.2 [X] HP mt43 AMD PRO A8-9600B 2.4GHz
Radeon R5 (Bristol Ridge)
fps
Average Gaming AMD Radeon R5 (Bristol Ridge) → 100% Average Gaming 30-70 fps → 100%
For more games that might be playable and a list of all games and graphics cards visit our Gaming List
v1.26
log 15. 21:23:37
#0 checking url part for id 7340 +0s ... 0s
#1 checking url part for id 7657 +0s ... 0s
#2 not redirecting to Ajax server +0s ... 0s
#3 did not recreate cache, as it is less than 5 days old! Created at Mon, 13 May 2024 05:40:51 +0200 +0.001s ... 0.001s
#4 composed specs +0.075s ... 0.076s
#5 did output specs +0s ... 0.076s
#6 start showIntegratedCPUs +0s ... 0.076s
#7 getting avg benchmarks for device 7340 +0.038s ... 0.114s
#8 got single benchmarks 7340 +0.012s ... 0.126s
#9 getting avg benchmarks for device 7657 +0.002s ... 0.127s
#10 got single benchmarks 7657 +0.005s ... 0.132s
#11 got avg benchmarks for devices +0s ... 0.132s
#12 min, max, avg, median took s +0.11s ... 0.243s
#13 before gaming benchmark output +0s ... 0.243s
#14 Got 213 rows for game benchmarks. +0.01s ... 0.253s
#15 composed SQL query for gamebenchmarks +0s ... 0.253s
#16 got data and put it in $dataArray +0.06s ... 0.313s
#17 benchmarks composed for output. +0.202s ... 0.515s
#18 calculated avg scores. +0s ... 0.515s
#19 return log +0.042s ... 0.557s
Please share our article, every link counts!
Redaktion, 2017-09- 8 (Update: 2023-07- 1)
 Deutsch
 English
 Español
 Français
 Italiano
 Nederlands
 Polski
 Português
 Русский
 Türkçe
 Svenska
 Chinese
 Magyar