Intel Iris Graphics 540 vs NVIDIA GeForce 920MX vs Intel UHD Graphics 610
Intel Iris Graphics 540 ► remove from comparison
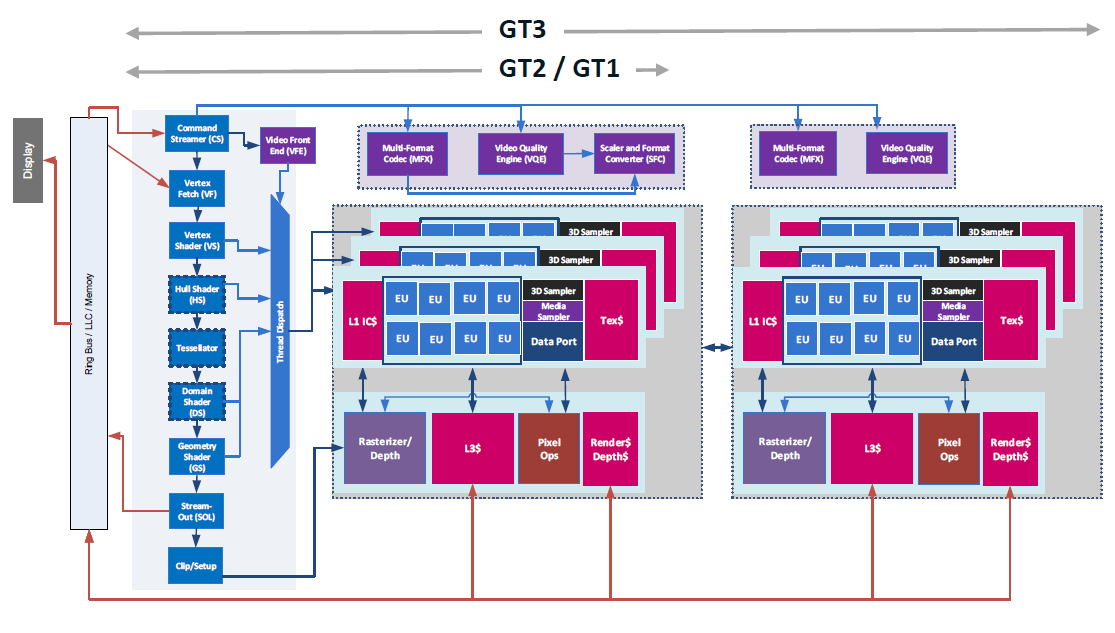
The Intel Iris Graphics 540 (GT3e) is an integrated graphics unit of the Skylake generation. As successors of the HD Graphics 6000 (Broadwell), the Iris Graphics 540 can be found in CPUs of 15-watt series and offers 64 MB of dedicated eDRAM memory. Furthermore, the so-called GT3e-version features 48 Execution Units (EUs) clocked at up to 1050 MHz (depending on the CPU model). Besides the eDRAM cache, the Iris 540 is able to access the main memory (2x 64bit DDR3L-1600 / DDR4-2133).
Compared to the Iris Graphics 550 of the 28-watt series, the Iris Graphics 540 differs only by its slightly lower maximum clock and a nearly halved TDP, which limits the utilization of the Turbo Boost in certain situations.
Performance
The exact performance of the Iris Graphics 540 depends on various factors like memory configuration (DDR3/DDR4) and maximum clock rate of the specific model. The fastest versions (Core i7-6650U ) should be slightly ahead of a dedicated GeForce 920M and will handle modern games (as of 2015) in low or medium settings.
Features
The revised video engine now decodes H.265/HEVC completely in hardware and thereby much more efficiently than before. Displays can be connected via DP 1.2 / eDP 1.3 (max. 3840 x 2160 @ 60 Hz), whereas HDMI is limited to the older version 1.4a (max. 3840 x 2160 @ 30 Hz). However, HDMI 2.0 can be added using a DisplayPort converter. Up to three displays can be controlled simultaneously.
Power Consumption
The Iris Graphics 540 can be found in mobile processors specified at 15 W TDP and is therefore suited for compact laptops and ultrabooks.
NVIDIA GeForce 920MX ► remove from comparison
The Nvidia GeForce 920MX is an entry-level graphics card for laptops that was launched in the first quarter of 2016. In comparison to the older 920M, the 920MX is now be based on the modern Maxwell chip of the 930MX but with a reduced shader count of 265 (GM108). According to our sources the TDP of 5-12 Watt and the support for DDR3 and GDDR5 is also specified.
The performance depends on the used graphics memory. The DDR3 version was slightly slower than an average GeForce 930M in our tests (and definitely faster than the GeForce 920M ). The GDDR5 version could therefore best the 930M slightly. However, both versions are not suited for demanding games of 2017. Less demanding games, like The Sims 4, should be playable in medium to high settings (see below for benchmarks).
Thanks to the low power consumption, the GeForce 920MX is also suited for thin and light laptops.
Intel UHD Graphics 610 ► remove from comparison
The Intel UHD Graphics 610 (GT1) is an integrated graphics unit, which can be found in low-end ULV (Ultra Low Voltage) processors of the Whisky-Lake generation. This "GT1" version of the Skylake GPU offers 12 Execution Units (EUs) clocked at up to 950 MHz (depending on the CPU model). Due to its lack of dedicated graphics memory or eDRAM cache, the HD 610 has to access the main memory (2x 64bit DDR3L-1600 / DDR4-2133).
Performance
Depending on various factors like memory configuration, the UHD Graphics 610 should offer a similar performance as the similar Intel HD Graphics 610 and the old Skylake HD Graphics 510 and therefore can only handle non demanding games. E.g. Farming Simulator 17, World of Warships or Dota 2 Reborn can be played on low settings.
Features
The revised video engine now supports H.265/HEVC Main10 profile in hardware with 10 bit colors. Furthermore, Googles VP9 codec can also be hardware decoded. The Pentium chips should already support HDCP 2.2 and therefore Netflix 4K. HDMI 2.0 however is still only supported with an external converter chip (LSPCon).
Power Consumption
The UHD Graphics 610 can be found in mobile processors specified at 15 W TDP and is therefore suited for compact laptops and ultrabooks.
Intel Iris Graphics 540 NVIDIA GeForce 920MX Intel UHD Graphics 610 Gen. 9 Series Codename Skylake GT3e N16V-GMR Kaby Lake GT1 Architecture Gen. 9 Skylake Maxwell Gen. 9 Kaby Lake Pipelines 48 - unified 256 - unified 12 - unified Core Speed 300 - 1050 (Boost) MHz 965 - 993 (Boost) MHz 300 - 950 (Boost) MHz Memory Bus Width eDRAM + 64/128 Bit 64 Bit 64/128 Bit Memory Type eDRAM DDR3, GDDR5 DDR3/DDR4 Max. Amount of Memory 64 MB Shared Memory yes no yes API DirectX 12_1, OpenGL 4.4 DirectX 12, Shader 5.0, OpenGL 4.5 DirectX 12_1, OpenGL 4.4 technology 14 nm 28 nm 14 nm Features QuickSync Optimus, PhysX, Verde Drivers, CUDA, 3D Vision, 3DTV Play, GameWorks QuickSync Date of Announcement 01.09.2015 25.03.2015 01.01.2019 Memory Speed 1800 MHz Link to Manufacturer Page www.geforce.com
Benchmarks Performance Rating - 3DMark 11 + Fire Strike + Time Spy - Iris Graphics 540
0.7 pt (2%)
...
...
max:
Performance Rating - 3DMark 11 + Fire Strike + Time Spy - GeForce 920MX
0.7 pt (2%)
...
...
max:
Performance Rating - 3DMark 11 + Fire Strike + Time Spy - UHD Graphics 610
0.3 pt (1%)
...
...
max:
3DMark - 3DMark Time Spy Score
472 Points (1%)
222 Points (1%)
3DMark - 3DMark Time Spy Graphics
417 Points (1%)
194 Points (1%)
3DMark - 3DMark Ice Storm Unlimited Graphics
min: 116490 avg: 126223 median: 126078 (14%) max: 136248 Points
min: 98596 avg: 110110 median: 110110 (12%) max: 121624 Points
min: 41521 avg: 42713 median: 42712.5 (5%) max: 43904 Points
3DMark - 3DMark Ice Storm Extreme Graphics
min: 45185 avg: 56792 median: 56791.5 (7%) max: 68398 Points
min: 49876 avg: 57473 median: 57473 (7%) max: 65070 Points
20443 Points (3%)
3DMark - 3DMark Cloud Gate Score
min: 6730 avg: 7255 median: 7235 (8%) max: 7822 Points
min: 5744 avg: 6545 median: 6545 (7%) max: 7346 Points
min: 4244 avg: 4334 median: 4333.5 (5%) max: 4423 Points
3DMark - 3DMark Cloud Gate Graphics
min: 9392 avg: 10896 median: 11327 (3%) max: 11893 Points
min: 7733 avg: 9114 median: 9113.5 (2%) max: 10494 Points
min: 5139 avg: 5277 median: 5276.5 (1%) max: 5414 Points
3DMark - 3DMark Fire Strike Standard Score
min: 1106 avg: 1268 median: 1354 (2%) max: 1395 Points
min: 1154 avg: 1337 median: 1336.5 (2%) max: 1519 Points
min: 597 avg: 616 median: 616 (1%) max: 635 Points
3DMark - 3DMark Fire Strike Standard Graphics
min: 1193 avg: 1358 median: 1448 (2%) max: 1479 Points
min: 1282 avg: 1448 median: 1448 (2%) max: 1614 Points
min: 634 avg: 664 median: 663.5 (1%) max: 693 Points
3DMark - 3DMark Ice Storm Graphics
min: 67714 avg: 81160 median: 82680.5 (10%) max: 91565 Points
min: 73997 avg: 83643 median: 83642.5 (10%) max: 93288 Points
min: 33154 avg: 36325 median: 36325 (4%) max: 39496 Points
3DMark - 3DMark Night Raid
2629 Points (2%)
3DMark - 3DMark Night Raid Graphics Score
2850 Points (1%)
3DMark 11 - 3DM11 Performance Score
min: 2039 avg: 2340 median: 2364 (3%) max: 2624 Points
min: 1800 avg: 1993 median: 1983 (3%) max: 2200 Points
min: 1026 avg: 1046 median: 1045.5 (1%) max: 1065 Points
3DMark 11 - 3DM11 Performance GPU
min: 1898 avg: 2187 median: 2211.5 (2%) max: 2450 Points
min: 1747 avg: 1823 median: 1835 (2%) max: 1887 Points
min: 915 avg: 923 median: 922.5 (1%) max: 930 Points
3DMark Vantage + Intel Iris Graphics 540 3DMark Vantage - 3DM Vant. Perf. total
min: 8647 avg: 8828 median: 8828 (3%) max: 9009 Points
3DM Vant. Perf. total + NVIDIA GeForce 920MX
min: 6584 avg: 7408 median: 7407.5 (2%) max: 8231 Points
3DM Vant. Perf. total + Intel UHD Graphics 610
3996 Points (1%)
3DM Vant. Perf. GPU no PhysX + Intel Iris Graphics 540 3DMark Vantage - 3DM Vant. Perf. GPU no PhysX
min: 8052 avg: 8220 median: 8219.5 (5%) max: 8387 Points
3DM Vant. Perf. GPU no PhysX + NVIDIA GeForce 920MX
min: 5850 avg: 6665 median: 6665 (4%) max: 7480 Points
3DM Vant. Perf. GPU no PhysX + Intel UHD Graphics 610
3375 Points (2%)
3DMark 03 - 3DMark 03 - Standard
30702 Points (16%)
3DMark 05 - 3DMark 05 - Standard
21185 Points (23%)
12054 Points (13%)
3DMark 06 3DMark 06 - Standard 1280x1024 + Intel Iris Graphics 540
min: 13403 avg: 13569 median: 13568.5 (18%) max: 13734 Points
3DMark 06 - Standard 1280x1024 + NVIDIA GeForce 920MX
min: 10781 avg: 12206 median: 12205.5 (16%) max: 13630 Points
3DMark 06 - Standard 1280x1024 + Intel UHD Graphics 610
min: 6026 avg: 6902 median: 6902 (9%) max: 7778 Points
Unigine Valley 1.0 - Unigine Valley 1.0 DX
6.5 fps (2%)
8.7 fps (3%)
min: 3 avg: 3.4 median: 3.4 (1%) max: 3.7 fps
Unigine Heaven 3.0 - Unigine Heaven 3.0 DX 11
21.2 fps (7%)
10.2 fps (3%)
Unigine Heaven 3.0 - Unigine Heaven 3.0 OpenGL
20.3 fps (9%)
Unigine Heaven 2.1 - Heaven 2.1 high
min: 26.4 avg: 27.9 median: 27.9 (5%) max: 29.4 fps
SPECviewperf 12 + Intel Iris Graphics 540 SPECviewperf 12 - specvp12 sw-03
min: 26.2 avg: 26.3 median: 26.3 (7%) max: 26.3 fps
specvp12 snx-02 + Intel Iris Graphics 540 SPECviewperf 12 - specvp12 snx-02
min: 2.6 avg: 2.8 median: 2.8 (0%) max: 2.9 fps
specvp12 showcase-01 + Intel Iris Graphics 540 SPECviewperf 12 - specvp12 showcase-01
min: 8.2 avg: 8.5 median: 8.5 (2%) max: 8.8 fps
specvp12 mediacal-01 + Intel Iris Graphics 540 SPECviewperf 12 - specvp12 mediacal-01
min: 2.7 avg: 3.9 median: 3.9 (1%) max: 5.1 fps
specvp12 maya-04 + Intel Iris Graphics 540 SPECviewperf 12 - specvp12 maya-04
min: 16.5 avg: 16.8 median: 16.8 (5%) max: 17 fps
specvp12 energy-01 + Intel Iris Graphics 540 SPECviewperf 12 - specvp12 energy-01
min: 0.08 avg: 0.2 median: 0.2 (0%) max: 0.33 fps
specvp12 creo-01 + Intel Iris Graphics 540 SPECviewperf 12 - specvp12 creo-01
10.8 fps (4%)
specvp12 catia-04 + Intel Iris Graphics 540 SPECviewperf 12 - specvp12 catia-04
min: 15.2 avg: 15.4 median: 15.4 (3%) max: 15.5 fps
specvp12 3dsmax-05 + Intel Iris Graphics 540 SPECviewperf 12 - specvp12 3dsmax-05
14.6 fps (3%)
Cinebench R10 Cinebench R10 Shading (32bit) + Intel Iris Graphics 540 Cinebench R10 - Cinebench R10 Shading (32bit)
min: 7271 avg: 8395 median: 8277.5 (6%) max: 9755 Points
Cinebench R10 Shading (32bit) + NVIDIA GeForce 920MX
min: 2632 avg: 4406 median: 4366 (3%) max: 6219 Points
Cinebench R10 Shading (32bit) + Intel UHD Graphics 610
min: 4516 avg: 5210 median: 5209.5 (4%) max: 5903 Points
Cinebench R11.5 Cinebench R11.5 OpenGL 64 Bit + Intel Iris Graphics 540 Cinebench R11.5 - Cinebench R11.5 OpenGL 64 Bit
min: 41.07 avg: 46.9 median: 47.9 (17%) max: 50.6 fps
Cinebench R11.5 OpenGL 64 Bit + Intel UHD Graphics 610
17.3 fps (6%)
Cinebench R15 + Intel Iris Graphics 540 Cinebench R15 - Cinebench R15 OpenGL 64 Bit
min: 35.34 avg: 52.5 median: 55.3 (3%) max: 62.1 fps
Cinebench R15 OpenGL 64 Bit + NVIDIA GeForce 920MX
min: 36.81 avg: 47.1 median: 47.7 (3%) max: 56.9 fps
Cinebench R15 OpenGL 64 Bit + Intel UHD Graphics 610
min: 27.5 avg: 28.4 median: 28.4 (2%) max: 29.24 fps
Cinebench R15 OpenGL Ref. Match 64 Bit + Intel Iris Graphics 540 Cinebench R15 - Cinebench R15 OpenGL Ref. Match 64 Bit
min: 97.8 avg: 98.1 median: 97.8 (98%) max: 99.3 %
Cinebench R15 OpenGL Ref. Match 64 Bit + NVIDIA GeForce 920MX
99.6 % (100%)
Cinebench R15 OpenGL Ref. Match 64 Bit + Intel UHD Graphics 610
97.8 % (98%)
GFXBench - GFXBench 5.0 Aztec Ruins High Tier Offscreen
5.4 fps (1%)
GFXBench - GFXBench 5.0 Aztec Ruins Normal Tier Offscreen
15.3 fps (1%)
GFXBench - GFXBench Car Chase Offscreen
42 fps (5%)
min: 29.9 avg: 32.7 median: 32.7 (4%) max: 35.4 fps
16.7 fps (2%)
GFXBench 3.1 - GFXBench Manhattan ES 3.1 Offscreen
60.4 fps (1%)
min: 42.8 avg: 47.4 median: 47.4 (1%) max: 52 fps
23.1 fps (0%)
GFXBench 3.0 - GFXBench 3.0 Manhattan Offscreen
86 fps (5%)
min: 55.7 avg: 62.9 median: 62.9 (4%) max: 70 fps
33.1 fps (2%)
GFXBench (DX / GLBenchmark) 2.7 + Intel Iris Graphics 540 GFXBench (DX / GLBenchmark) 2.7 - GFXBench T-Rex HD Offscreen C24Z16
183 fps (1%)
GFXBench T-Rex HD Offscreen C24Z16 + NVIDIA GeForce 920MX
min: 103.1 avg: 115.2 median: 115.2 (1%) max: 127.3 fps
GFXBench T-Rex HD Offscreen C24Z16 + Intel UHD Graphics 610
71.9 fps (1%)
Basemark GPU 1.2 - Basemark GPU 1.2 Vulkan Official Medium Offscreen 1080
25.5 fps (0%)
LuxMark v2.0 64Bit - LuxMark v2.0 Room GPU
min: 258 avg: 291.8 median: 301.5 (1%) max: 306 Samples/s
min: 210 avg: 230 median: 230 (1%) max: 250 Samples/s
min: 144 avg: 157 median: 157 (1%) max: 170 Samples/s
LuxMark v2.0 64Bit - LuxMark v2.0 Sala GPU
min: 614 avg: 700 median: 712.5 (1%) max: 762 Samples/s
min: 400 avg: 427 median: 427 (1%) max: 454 Samples/s
min: 295 avg: 304.5 median: 304.5 (1%) max: 314 Samples/s
ComputeMark v2.1 - ComputeMark v2.1 Result
min: 1257 avg: 1483 median: 1525.5 (2%) max: 1625 Points
min: 1066 avg: 1139 median: 1139 (1%) max: 1212 Points
min: 480 avg: 481.5 median: 481.5 (1%) max: 483 Points
Power Consumption - Furmark Stress Test Power Consumption - external Monitor *
min: 18 avg: 23.1 median: 23.1 (3%) max: 28.2 Watt
Power Consumption - Witcher 3 Power Consumption *
25.6 Watt (6%)
Clock Speed - GPU Clock Speed Furmark
948 MHz (38%)
Average Benchmarks Intel Iris Graphics 540 → 100% n=23 Average Benchmarks NVIDIA GeForce 920MX → 85% n=23 Average Benchmarks Intel UHD Graphics 610 → 47% n=23
- Range of benchmark values for this graphics card
- Average benchmark values for this graphics card
* Smaller numbers mean a higher performance
1 This benchmark is not used for the average calculation
Game Benchmarks The following benchmarks stem from our benchmarks of review laptops. The performance depends on the used graphics memory, clock rate, processor, system settings, drivers, and operating systems. So the results don't have to be representative for all laptops with this GPU. For detailed information on the benchmark results, click on the fps number.
UHD Graphics 610:
19.7 [X] Nofflink M500-5405U 874931
Intel Pentium Gold 5405U 2.3GHz
UHD Graphics 610
min:
4 fps, P1:
11 fps, max:
23 fps
fps
UHD Graphics 610:
7.9 [X] Nofflink M500-5405U 874931
Intel Pentium Gold 5405U 2.3GHz
UHD Graphics 610
min:
2 fps, P1:
5 fps, max:
9 fps
fps
UHD Graphics 610:
6.3 [X] Nofflink M500-5405U 874931
Intel Pentium Gold 5405U 2.3GHz
UHD Graphics 610
min:
3 fps, P1:
4 fps, max:
7 fps
fps
UHD Graphics 610:
17.6 fps
UHD Graphics 610:
15.5 fps
UHD Graphics 610:
0 (!) fps
UHD Graphics 610:
30.4 fps
UHD Graphics 610:
21.9 fps
UHD Graphics 610:
16.6 fps
100%
Iris Graphics 540:
114 fps
100%
Iris Graphics 540:
94 fps
100%
Iris Graphics 540:
74 fps
100%
Iris Graphics 540:
71 fps
UHD Graphics 610:
16.9 fps
UHD Graphics 610:
10.4 fps
UHD Graphics 610:
7 8 ~ 8 fps
UHD Graphics 610:
18.3 [X] Nofflink M500-5405U 1.47.22.14 D3D12
Intel Pentium Gold 5405U 2.3GHz
UHD Graphics 610
min:
5 fps, P1:
6.15 fps, max:
195.1 fps
fps
UHD Graphics 610:
7.7 [X] Nofflink M500-5405U 1.47.22.14 D3D12
Intel Pentium Gold 5405U 2.3GHz
UHD Graphics 610
min:
5 fps, P1:
5 fps, max:
169.3 fps
fps
UHD Graphics 610:
10 [X] Nofflink M500-5405U 1.47.22.14 D3D12
Intel Pentium Gold 5405U 2.3GHz
UHD Graphics 610
min:
5 fps, P1:
5 fps, max:
151.2 fps
fps
UHD Graphics 610:
13.6 [X] Nofflink M500-5405U 1.47.22.14 D3D12
Intel Pentium Gold 5405U 2.3GHz
UHD Graphics 610
min:
5 fps, P1:
5 fps, max:
158.2 fps
fps
UHD Graphics 610:
7 8 ~ 8 fps
100%
Iris Graphics 540:
174 fps
100%
Iris Graphics 540:
24.4 fps
100%
Iris Graphics 540:
9.5 fps
100%
Iris Graphics 540:
23.6 fps
42%
UHD Graphics 610:
9.6 10.9 ~ 10 fps
100%
Iris Graphics 540:
16.9 fps
53%
UHD Graphics 610:
7.5 10.5 ~ 9 fps
100%
Iris Graphics 540:
13.6 fps
51%
UHD Graphics 610:
6.9 7.3 ~ 7 fps
UHD Graphics 610:
23.8 (!) [X] Lenovo V340-17IWL 81RG001YGE Intel Pentium Gold 5405U 2.3GHz
UHD Graphics 610
min:
7 fps, max:
36 fps
fps
UHD Graphics 610:
20.3 fps
100%
Iris Graphics 540:
17.3 fps
100%
Iris Graphics 540:
30 fps
100%
Iris Graphics 540:
27.3 fps
100%
Iris Graphics 540:
55.3 fps
84%
GeForce 920MX:
46.3 fps
100%
Iris Graphics 540:
38.6 fps
87%
GeForce 920MX:
33.6 fps
100%
Iris Graphics 540:
14.3 fps
97%
GeForce 920MX:
13.8 fps
100%
Iris Graphics 540:
112 fps
121%
GeForce 920MX:
135.7 fps
100%
Iris Graphics 540:
76 fps
115%
GeForce 920MX:
87.3 fps
100%
Iris Graphics 540:
30.6 fps
120%
GeForce 920MX:
36.7 fps
100%
Iris Graphics 540:
19.1 fps
125%
GeForce 920MX:
23.8 fps
100%
Iris Graphics 540:
43.4 fps
113%
GeForce 920MX:
49.2 fps
100%
Iris Graphics 540:
25.3 fps
115%
GeForce 920MX:
29.1 fps
100%
Iris Graphics 540:
12.6 fps
110%
GeForce 920MX:
13.8 fps
100%
Iris Graphics 540:
11.3 fps
100%
Iris Graphics 540:
61 (!) [X] Apple MacBook Pro 13 2016 Intel Core i5-6360U 2GHz
Iris Graphics 540
min:
51 fps, max:
75 fps
fps
100%
Iris Graphics 540:
72 (!) [X] Apple MacBook Pro 13 2016 Intel Core i5-6360U 2GHz
Iris Graphics 540
min:
61 fps, max:
80 fps
fps
Iris Graphics 540:
0 (!) fps
100%
Iris Graphics 540:
16.7 20.5 ~ 19 fps
109%
GeForce 920MX:
20.8 fps
100%
Iris Graphics 540:
35 fps
100%
GeForce 920MX:
34.9 fps
100%
Iris Graphics 540:
20.5 fps
100%
GeForce 920MX:
20.5 fps
100%
Iris Graphics 540:
58.2 68 ~ 63 fps
143%
GeForce 920MX:
90.4 fps
39%
UHD Graphics 610:
24.8 fps
100%
Iris Graphics 540:
40 47.6 ~ 44 fps
137%
GeForce 920MX:
60.3 fps
40%
UHD Graphics 610:
17.7 fps
100%
Iris Graphics 540:
18.9 21.3 ~ 20 fps
137%
GeForce 920MX:
27.3 fps
100%
Iris Graphics 540:
31.5 fps
94%
GeForce 920MX:
29.5 fps
100%
Iris Graphics 540:
13.3 fps
103%
GeForce 920MX:
13.7 fps
100%
Iris Graphics 540:
17.3 fps
162%
GeForce 920MX:
28.1 fps
100%
Iris Graphics 540:
13.5 17.7 ~ 16 fps
148%
GeForce 920MX:
23.7 fps
100%
Iris Graphics 540:
13.8 fps
128%
GeForce 920MX:
17.7 fps
100%
Iris Graphics 540:
7.6 fps
100%
Iris Graphics 540:
21.7 27.9 (!) [X] Intel NUC6i5SYH Intel Core i5-6260U 1.8GHz
Iris Graphics 540
min:
20 fps, max:
35 fps
~ 25 fps
100%
Iris Graphics 540:
12.9 fps
100%
Iris Graphics 540:
22 22 23 ~ 22 fps
109%
GeForce 920MX:
24 fps
100%
Iris Graphics 540:
10 11 12 ~ 11 fps
100%
GeForce 920MX:
11 fps
100%
Iris Graphics 540:
8 fps
100%
Iris Graphics 540:
18 27.6 ~ 23 fps
111%
GeForce 920MX:
25.6 fps
100%
Iris Graphics 540:
6.7 8.9 ~ 8 fps
111%
GeForce 920MX:
8.9 fps
100%
Iris Graphics 540:
21.5 23.7 24.9 (!) [X] Apple MacBook Pro 13 2016 Intel Core i5-6360U 2GHz
Iris Graphics 540
min:
23 fps, max:
27 fps
~ 23 fps
101%
GeForce 920MX:
23.2 fps
134%
GeForce 920MX:
14.7 fps
Iris Graphics 540:
0 (!) fps
100%
Iris Graphics 540:
39.1 44.3 ~ 42 fps
129%
GeForce 920MX:
54.3 fps
58%
UHD Graphics 610:
24.2 fps
100%
Iris Graphics 540:
24.2 27.4 ~ 26 fps
131%
GeForce 920MX:
34.1 fps
58%
UHD Graphics 610:
15.1 fps
100%
Iris Graphics 540:
13.5 16.8 ~ 15 fps
115%
GeForce 920MX:
17.2 fps
100%
Iris Graphics 540:
11 13.6 ~ 12 fps
100%
Iris Graphics 540:
35.9 fps
88%
GeForce 920MX:
31.5 fps
100%
Iris Graphics 540:
28.6 fps
86%
GeForce 920MX:
24.7 fps
100%
Iris Graphics 540:
15.5 fps
100%
Iris Graphics 540:
14.2 fps
100%
Iris Graphics 540:
40.2 fps
106%
GeForce 920MX:
42.6 fps
100%
Iris Graphics 540:
22.9 fps
111%
GeForce 920MX:
25.5 fps
Iris Graphics 540:
0 (!) fps
100%
Iris Graphics 540:
4.9 5.2 ~ 5 fps
376%
GeForce 920MX:
18.8 fps
100%
Iris Graphics 540:
23.2 fps
120%
GeForce 920MX:
27.9 fps
100%
GeForce 920MX:
38.1 fps
91%
GeForce 920MX:
19.1 fps
100%
Iris Graphics 540:
65 (!) [X] Intel NUC6i5SYH Intel Core i5-6260U 1.8GHz
Iris Graphics 540
min:
56 fps, max:
72 fps
fps
79%
GeForce 920MX:
51.2 fps
100%
Iris Graphics 540:
38.8 (!) [X] Intel NUC6i5SYH Intel Core i5-6260U 1.8GHz
Iris Graphics 540
min:
33 fps, max:
43 fps
fps
82%
GeForce 920MX:
31.7 fps
100%
Iris Graphics 540:
78.7 120 ~ 99 fps
98%
GeForce 920MX:
97.5 fps
98%
GeForce 920MX:
65.9 fps
96%
GeForce 920MX:
29.7 fps
100%
Iris Graphics 540:
18.7 25.4 ~ 22 fps
100%
Iris Graphics 540:
48.6 58 ~ 53 fps
113%
GeForce 920MX:
60 fps
100%
Iris Graphics 540:
28.9 43.3 ~ 36 fps
121%
GeForce 920MX:
43.6 fps
100%
Iris Graphics 540:
13.9 16.7 ~ 15 fps
103%
GeForce 920MX:
15.4 fps
100%
Iris Graphics 540:
28.9 34.3 ~ 32 fps
82%
GeForce 920MX:
26.2 fps
100%
Iris Graphics 540:
13.2 16.9 ~ 15 fps
97%
GeForce 920MX:
14.6 fps
119%
GeForce 920MX:
83.3 fps
131%
GeForce 920MX:
68 fps
121%
GeForce 920MX:
36.4 fps
100%
Iris Graphics 540:
19.1 34.6 ~ 27 fps
124%
GeForce 920MX:
33.5 fps
41%
UHD Graphics 610:
9.7 11.6 ~ 11 fps
116%
GeForce 920MX:
22.1 fps
53%
UHD Graphics 610:
9.2 11.3 [X] Nofflink M500-5405U Intel Pentium Gold 5405U 2.3GHz
UHD Graphics 610
min:
1.234 fps, P0.1:
2.27 fps, P1:
5.1 fps, max:
60.3 fps
~ 10 fps
113%
GeForce 920MX:
13.6 fps
64%
UHD Graphics 610:
7.7 [X] Nofflink M500-5405U Intel Pentium Gold 5405U 2.3GHz
UHD Graphics 610
min:
6.08 fps, P0.1:
6.31 fps, P1:
7.15 fps, max:
8.32 fps
fps
Iris Graphics 540:
0 (!) fps
UHD Graphics 610:
4.2 [X] Nofflink M500-5405U Intel Pentium Gold 5405U 2.3GHz
UHD Graphics 610
min:
3.82 fps, P0.1:
3.85 fps, P1:
4.05 fps, max:
4.39 fps
fps
100%
Iris Graphics 540:
119.2 149 177 (!) [X] Intel NUC6i5SYH Intel Core i5-6260U 1.8GHz
Iris Graphics 540
min:
156 fps, max:
206 fps
~ 148 fps
115%
GeForce 920MX:
170.3 fps
127%
GeForce 920MX:
44.4 fps
133%
GeForce 920MX:
22.6 fps
100%
Iris Graphics 540:
12.5 12.5 ~ 13 fps
UHD Graphics 610:
6 [X] Nofflink M500-5405U Intel Pentium Gold 5405U 2.3GHz
UHD Graphics 610
min:
0.798 fps, P1:
4.46 fps, max:
19.1 fps
fps
100%
Iris Graphics 540:
59 fps
110%
GeForce 920MX:
65.1 fps
100%
Iris Graphics 540:
50 fps
89%
GeForce 920MX:
44.6 fps
100%
Iris Graphics 540:
19.5 fps
80%
GeForce 920MX:
15.6 fps
100%
Iris Graphics 540:
10.4 fps
100%
Iris Graphics 540:
52.3 fps
87%
GeForce 920MX:
45.4 fps
100%
Iris Graphics 540:
35.2 fps
83%
GeForce 920MX:
29.2 fps
100%
Iris Graphics 540:
11.6 fps
141%
GeForce 920MX:
16.4 fps
100%
Iris Graphics 540:
32.2 fps
100%
Iris Graphics 540:
23.3 fps
100%
Iris Graphics 540:
15.7 fps
100%
Iris Graphics 540:
13.7 fps
100%
Iris Graphics 540:
29.8 (!) 65 (!) [X] Intel NUC6i5SYH Intel Core i5-6260U 1.8GHz
Iris Graphics 540
min:
59 fps, max:
87 fps
~ 47 fps
116%
GeForce 920MX:
54.5 fps
100%
Iris Graphics 540:
18.4 (!) 45.1 (!) [X] Intel NUC6i5SYH Intel Core i5-6260U 1.8GHz
Iris Graphics 540
min:
39 fps, max:
56 fps
~ 32 fps
118%
GeForce 920MX:
37.8 fps
100%
Iris Graphics 540:
11.4 31.3 (!) [X] Intel NUC6i5SYH Intel Core i5-6260U 1.8GHz
Iris Graphics 540
min:
29 fps, max:
41 fps
~ 21 fps
124%
GeForce 920MX:
26 fps
100%
Iris Graphics 540:
10.4 fps
106%
GeForce 920MX:
11 fps
107%
GeForce 920MX:
42.9 fps
100%
Iris Graphics 540:
23 35.4 38 ~ 32 fps
101%
GeForce 920MX:
32.4 fps
88%
GeForce 920MX:
18.4 fps
100%
Iris Graphics 540:
9.5 11 ~ 10 fps
100%
Iris Graphics 540:
85 137 ~ 111 fps
94%
GeForce 920MX:
104.2 fps
100%
Iris Graphics 540:
49.2 70 ~ 60 fps
88%
GeForce 920MX:
52.6 fps
100%
Iris Graphics 540:
33.3 46.4 ~ 40 fps
77%
GeForce 920MX:
30.6 fps
100%
Iris Graphics 540:
20.6 fps
71%
GeForce 920MX:
14.6 fps
100%
Iris Graphics 540:
37.6 53.7 ~ 46 fps
100%
Iris Graphics 540:
27.6 32.2 ~ 30 fps
74%
GeForce 920MX:
22.2 fps
100%
Iris Graphics 540:
19.6 20 ~ 20 fps
80%
GeForce 920MX:
15.9 fps
100%
Iris Graphics 540:
6.6 fps
UHD Graphics 610:
57.9 fps
UHD Graphics 610:
42.1 fps
UHD Graphics 610:
38.9 fps
UHD Graphics 610:
26.2 fps
100%
Iris Graphics 540:
57 fps
69%
GeForce 920MX:
39.1 fps
100%
Iris Graphics 540:
55 fps
100%
Iris Graphics 540:
24 fps
Average Gaming Intel Iris Graphics 540 → 100% Average Gaming 30-70 fps → 100%
Average Gaming NVIDIA GeForce 920MX → 111% Average Gaming 30-70 fps → 105%
Average Gaming Intel UHD Graphics 610 → 52% Average Gaming 30-70 fps → 84%
For more games that might be playable and a list of all games and graphics cards visit our Gaming List
v1.27
log 15. 22:21:46
#0 checking url part for id 6472 +0s ... 0s
#1 checking url part for id 7026 +0s ... 0s
#2 checking url part for id 10401 +0s ... 0s
#3 not redirecting to Ajax server +0s ... 0s
#4 did not recreate cache, as it is less than 5 days old! Created at Thu, 13 Jun 2024 05:35:10 +0200 +0.001s ... 0.001s
#5 composed specs +0.128s ... 0.129s
#6 did output specs +0s ... 0.13s
#7 start showIntegratedCPUs +0s ... 0.13s
#8 getting avg benchmarks for device 6472 +0.056s ... 0.185s
#9 got single benchmarks 6472 +0.026s ... 0.212s
#10 getting avg benchmarks for device 7026 +0.012s ... 0.224s
#11 got single benchmarks 7026 +0.026s ... 0.25s
#12 getting avg benchmarks for device 10401 +0.016s ... 0.266s
#13 got single benchmarks 10401 +0.012s ... 0.278s
#14 got avg benchmarks for devices +0s ... 0.278s
#15 min, max, avg, median took s +0.447s ... 0.725s
#16 before gaming benchmark output +0s ... 0.725s
#17 Got 502 rows for game benchmarks. +0.031s ... 0.756s
#18 composed SQL query for gamebenchmarks +0s ... 0.756s
#19 got data and put it in $dataArray +0.061s ... 0.817s
#20 benchmarks composed for output. +0.203s ... 1.02s
#21 calculated avg scores. +0s ... 1.02s
#22 return log +0.003s ... 1.024s
Please share our article, every link counts!
Redaktion, 2017-09- 8 (Update: 2023-07- 1)
 Deutsch
 English
 Español
 Français
 Italiano
 Nederlands
 Polski
 Português
 Русский
 Türkçe
 Svenska
 Chinese
 Magyar