Intel HD Graphics 4200 vs NVIDIA GeForce RTX 3050 6GB Laptop GPU
Intel HD Graphics 4200 ► remove from comparison
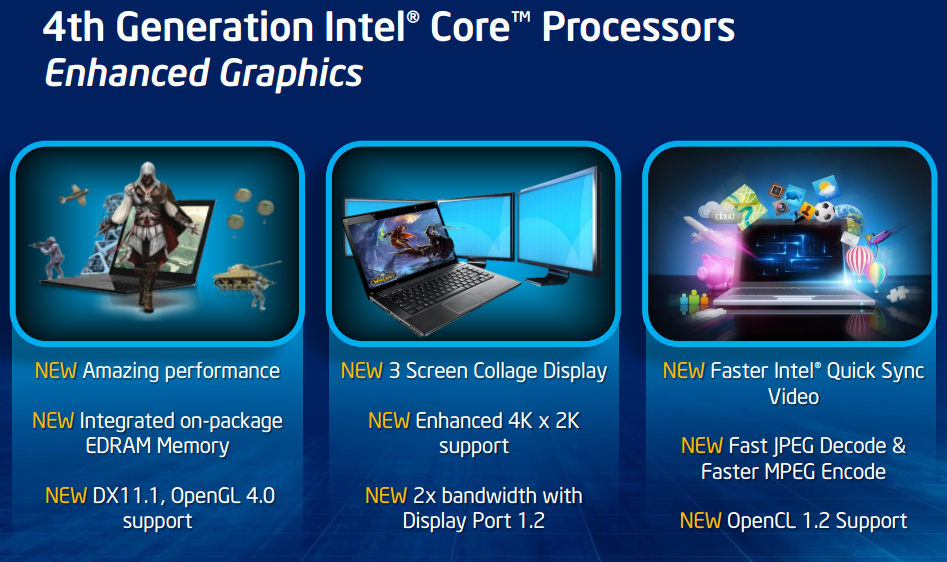
The Intel HD Graphics 4200 (GT2) is a processor graphics card that is included in some of the ULV Haswell processors of 2013 (4th generation core). The relatively low base clock can be automatically overclocked using Turbo Boost technology.
In comparison to the HD 4000, the graphics core has been modified in several details. The GPU supports DirectX 11.1, OpenCL 1.2 und OpenGL 4.0. It also features an improved decoder for 4K videos and the fast Quick Sync encoder.
The performance of the HD Graphics 4200 is clearly below the HD 4600 and HD 4400 , since the GPU is designed for ULV models of the Y-series (11.5 W). Therefore, the clock rates are relatively low. Compared to a similar clocked HD 4000 , the HD 4200 is somewhat faster due to architectural improvements and an increased number of execution units: The GT2 version integrates 20 EUs, compared to 16 EUs for the old HD 4000.
In simple games like Anno 2070 or Counter Strike: Global Offensive, the performance is sufficient to handle low settings and 1024 x 768 pixels. Many current titles like Battlefield 4, however, are not playable even at minimum graphic quality. Detailed benchmarks can be found below.
Due to the 22nm 3D Tri-Gate production process, the power consumption is relatively low and suitable even for tablets. In addition to the TDP of 11.5 watts, the Y-series CPUs are rated at an SDP (average power consumption) of 4.5 or 6 watts (depending on the model).
NVIDIA GeForce RTX 3050 6GB Laptop GPU ► remove from comparison
The Nvidia GeForce RTX 3050 6GB Laptop GPU (mobile, GN20-P0-R, 2023 Refresh) is the refresh of the RTX 3050 4GB Laptop GPU (slowest RTX 3000 mobile card) and also based on the GA107 Ampere chip. The 6GB variant offers more CUDA cores (2,560, +25%) but a cut down memory bus to 96 Bit. The clock speed depends on the TGP variant and can range from 713 - 1530 (base) and 1058 - 1740 (boost) for the TGP variants of 35 to 80 Watt (see table below).
The performance is between the old 4GB RTX 3050 and the RTX 3050 Ti and therefore best suited for full HD gaming (1920 x 1080) in medium to high graphic settings. The performance is not sufficient to enable Raytracing in most games, but the Tensor cores can be used for DLSS in some games (and get performance boost with slight quality reduction). Beware, that the low TGP variants will offer a significantly lower performance.
The GA107 chip offers 3,072 FP32 ALUs of which half can also execute INT32 instructions (i.e. 1,536 INT32 ALUs). The RTX 3050 however maybe won't use all ALUs on the chip. With Turing all shaders could still execute FP32 or INT32 instructions. The raytracing and tensor cores on the chip were also improved according to Nvidia. The Ampere chips also include an improved 5th generation video encoder (NVENC for H.264 and H.265) and a 7th generation decoder (for various formats now including AV1).
The GA107 chip is manufactured by Samsung in 8nm (8N), which is not quite able to keep up with the 7nm node at TSMC (e.g. used by AMD and also for the professional GA100 Ampere chip).
Intel HD Graphics 4200 NVIDIA GeForce RTX 3050 6GB Laptop GPU GeForce RTX 3000 Series Codename Haswell GT2 GN20-P0-R 6GB Architecture Gen. 7.5 Haswell Ampere Pipelines 20 - unified 2560 - unified Core Speed 200 - 850 (Boost) MHz 1237 - 1492 (Boost) MHz Memory Bus Width 64/128 Bit 96 Bit Shared Memory yes no API DirectX 11.1, Shader 5.0, OpenGL 4.0 DirectX 12_2, Shader 6.7, OpenGL 4.6 technology 22 nm 8 nm Features QuickSync NVIDIA DLSS, NVIDIA Reflex, Resizable BAR, NVIDIA Broadcast, NVIDIA Ansel, NVIDIA ShadowPlay, NVIDIA G-SYNC, Advanced Optimus, Nvidia Max-Q, Dynamic Boost Date of Announcement 05.06.2013 06.01.2023 TMUs 80 ROPs 32 Raytracing Cores 16 Tensor / AI Cores 64 Memory Speed 12000 effective = 1500 MHz Memory Type GDDR6 Max. Amount of Memory 6 GB Memory Bandwidth 144 GB/s Power Consumption 60 Watt (35 - 80 Watt TGP) PCIe 4.0 Displays HDMI 2.1, DisplayPort 1.4a Notebook Size large Predecessor GeForce RTX 3050 4GB Laptop GPU
CPU in HD Graphics 4200 GPU Base Speed GPU Boost / Turbo Intel Core i7-4610Y 2 x 1700 MHz, 11.5 W 200 MHz 850 MHz Intel Core i5-4300Y 2 x 1600 MHz, 11.5 W 200 MHz 850 MHz Intel Core i5-4302Y 2 x 1600 MHz, 11.5 W 200 MHz 850 MHz » show 8 more Intel Core i5-4202Y 2 x 1600 MHz, 11.5 W 200 MHz 850 MHz Intel Core i5-4220Y 2 x 1600 MHz, 11.5 W 200 MHz 850 MHz Intel Core i5-4210Y 2 x 1500 MHz, 11.5 W 200 MHz 850 MHz Intel Core i5-4200Y 2 x 1400 MHz, 11.5 W 200 MHz 850 MHz Intel Core i3-4030Y 2 x 1600 MHz, 11.5 W 200 MHz 850 MHz Intel Core i3-4020Y 2 x 1500 MHz, 11.5 W 200 MHz 850 MHz Intel Core i3-4012Y 2 x 1500 MHz, 11.5 W 200 MHz 850 MHz Intel Core i3-4010Y 2 x 1300 MHz, 11.5 W 200 MHz 850 MHz min. - max. 200 MHz 850 MHz
Benchmarks Performance Rating - 3DMark 11 + Fire Strike + Time Spy - HD Graphics 4200
0.2 pt (1%)
...
...
max:
Performance Rating - 3DMark 11 + Fire Strike + Time Spy - GeForce RTX 3050 6GB Laptop GPU
5.5 pt (16%)
...
NVIDIA GeForce RTX 3050 6GB Laptop GPU
...
max:
3DMark - 3DMark Time Spy Score
min: 4933 avg: 5058 median: 5057.5 (15%) max: 5182 Points
GPU TDP 50 W TDP 63 W 95% 100%
3DMark - 3DMark Time Spy Graphics
min: 4501 avg: 4661 median: 4660.5 (12%) max: 4820 Points
GPU TDP 50 W TDP 63 W 93% 100%
3DMark - 3DMark Ice Storm Unlimited Graphics
41579 Points (5%)
500518 Points (57%)
3DMark - 3DMark Ice Storm Extreme Graphics
80214 Points (10%)
3DMark - 3DMark Cloud Gate Score
min: 1716 avg: 2853 median: 3027 (3%) max: 3754 Points
43015 Points (46%)
3DMark - 3DMark Cloud Gate Graphics
min: 2101 avg: 3793 median: 3807 (1%) max: 5239 Points
72486 Points (19%)
3DMark - 3DMark Fire Strike Standard Score
min: 199 avg: 369.6 median: 394.5 (1%) max: 512 Points
min: 10765 avg: 10995 median: 10890 (19%) max: 11330 Points
GPU TDP ? TDP 50 W TDP 60 W TDP 63 W 3% 95% 96% 100%
3DMark - 3DMark Fire Strike Standard Graphics
min: 218 avg: 410.6 median: 431.5 (0%) max: 578 Points
min: 11887 avg: 12155 median: 11960 (14%) max: 12618 Points
GPU TDP ? TDP 50 W TDP 60 W TDP 63 W 3% 94% 95% 100%
3DMark - 3DMark Ice Storm Graphics
min: 17834 avg: 32317 median: 34087 (4%) max: 46175 Points
80553 Points (10%)
GPU TDP ? TDP 60 W 40% 100%
3DMark - 3DMark Wild Life Extreme Unlimited
8916 Points (10%)
3DMark 11 - 3DM11 Performance Score
min: 367 avg: 660 median: 712 (1%) max: 828 Points
min: 15844 avg: 16783 median: 17223 (24%) max: 17282 Points
GPU TDP ? TDP 50 W TDP 60 W TDP 63 W 4% 92% 100% 100%
3DMark 11 - 3DM11 Performance GPU
min: 329 avg: 624 median: 638 (1%) max: 1060 Points
min: 15860 avg: 17113 median: 17421 (15%) max: 18059 Points
GPU TDP ? TDP 50 W TDP 60 W TDP 63 W 3% 88% 96% 100%
3DMark Vantage + Intel HD Graphics 4200 3DMark Vantage - 3DM Vant. Perf. total
min: 2165 avg: 2538 median: 2537.5 (1%) max: 2910 Points
3DM Vant. Perf. GPU no PhysX + Intel HD Graphics 4200 3DMark Vantage - 3DM Vant. Perf. GPU no PhysX
min: 1678 avg: 1985 median: 1807 (1%) max: 2471 Points
3DMark 06 3DMark 06 - Standard 1280x1024 + Intel HD Graphics 4200
min: 2060 avg: 3529 median: 3383 (4%) max: 5020 Points
Blender - Blender 3.3 Classroom CUDA *
min: 107 avg: 110.7 median: 110 (16%) max: 115 Seconds
GPU TDP 50 W TDP 60 W TDP 63 W 100% 101% 101%
Blender - Blender 3.3 Classroom OPTIX *
min: 68 avg: 69.3 median: 68 (25%) max: 72 Seconds
GPU TDP 50 W TDP 60 W TDP 63 W 100% 102% 102%
Cinebench R10 Cinebench R10 Shading (32bit) + Intel HD Graphics 4200 Cinebench R10 - Cinebench R10 Shading (32bit)
min: 1991 avg: 4602 median: 4514 (3%) max: 6367 Points
Cinebench R11.5 Cinebench R11.5 OpenGL 64 Bit + Intel HD Graphics 4200 Cinebench R11.5 - Cinebench R11.5 OpenGL 64 Bit
min: 7.65 avg: 14.1 median: 14.9 (5%) max: 19.67 fps
Cinebench R15 + Intel HD Graphics 4200 Cinebench R15 - Cinebench R15 OpenGL 64 Bit
min: 8.82 avg: 15.6 median: 17 (1%) max: 19.99 fps
Cinebench R15 OpenGL 64 Bit + NVIDIA GeForce RTX 3050 6GB Laptop GPU
min: 117.6 avg: 186.5 median: 221 (13%) max: 221 fps
GPU TDP ? TDP 50 W TDP 60 W TDP 63 W 7% 100% 100% 53%
Cinebench R15 OpenGL Ref. Match 64 Bit + Intel HD Graphics 4200 Cinebench R15 - Cinebench R15 OpenGL Ref. Match 64 Bit
min: 63.3 avg: 87.8 median: 98 (98%) max: 99.6 %
Cinebench R15 OpenGL Ref. Match 64 Bit + NVIDIA GeForce RTX 3050 6GB Laptop GPU
99.6 % (100%)
GPU TDP ? TDP 50 W TDP 60 W TDP 63 W 88% 100% 100% 100%
GFXBench (DX / GLBenchmark) 2.7 + Intel HD Graphics 4200 GFXBench (DX / GLBenchmark) 2.7 - GFXBench T-Rex HD Offscreen C24Z16
min: 21 avg: 35.8 median: 37.5 (0%) max: 47 fps
Basemark GPU 1.2 - Basemark GPU 1.2 Vulkan Official Medium Offscreen 1080
min: 104.6 avg: 166.1 median: 104.6 (1%) max: 289 fps
GPU TDP 50 W TDP 60 W TDP 63 W 100% 36% 36%
Basemark GPU 1.2 - Basemark GPU 1.2 Vulkan Official High Offscreen 2160
3.6 fps (1%)
Geekbench 6.2 - Geekbench 6.2 GPU OpenCL
min: 52427 avg: 53591 median: 53590.5 (16%) max: 54754 Points
GPU TDP 50 W TDP 60 W 96% 100%
Geekbench 6.2 - Geekbench 6.2 GPU Vulkan
min: 18152 avg: 19500 median: 19499.5 (6%) max: 20847 Points
GPU TDP 50 W TDP 60 W 100% 87%
LuxMark v2.0 64Bit - LuxMark v2.0 Room GPU
min: 102 avg: 113.5 median: 113.5 (1%) max: 125 Samples/s
LuxMark v2.0 64Bit - LuxMark v2.0 Sala GPU
min: 162 avg: 176.5 median: 176.5 (0%) max: 191 Samples/s
ComputeMark v2.1 - ComputeMark v2.1 Result
min: 469 avg: 486 median: 486 (1%) max: 503 Points
Power Consumption - Furmark Stress Test Power Consumption - external Monitor *
min: 79.4 avg: 87.6 median: 87.3 (12%) max: 96.1 Watt
GPU TDP 50 W TDP 60 W TDP 63 W 101% 100% 103%
Power Consumption - The Witcher 3 Power Consumption - external Monitor *
min: 83 avg: 87.2 median: 86.1 (12%) max: 92.6 Watt
GPU TDP 50 W TDP 60 W TDP 63 W 102% 100% 101%
Power Consumption - Witcher 3 Power Consumption *
min: 86.8 avg: 90.8 median: 89.5 (20%) max: 96.2 Watt
GPU TDP 50 W TDP 60 W TDP 63 W 103% 100% 102%
Power Consumption - Witcher 3 ultra Power Efficiency
min: 0.503 avg: 0.5 median: 0.5 (47%) max: 0.591 fps per Watt
GPU TDP 50 W TDP 60 W TDP 63 W 85% 88% 100%
Power Consumption - Witcher 3 ultra Power Efficiency - external Monitor
min: 0.527 avg: 0.6 median: 0.5 (45%) max: 0.614 fps per Watt
GPU TDP 50 W TDP 60 W TDP 63 W 86% 88% 100%
Emissions Witcher 3 Fan Noise + NVIDIA GeForce RTX 3050 6GB Laptop GPU Emissions - Witcher 3 Fan Noise
min: 42.1 avg: 44.9 median: 43.8 (70%) max: 48.7 dB(A)
GPU TDP 50 W TDP 60 W TDP 63 W 100% 86% 90%
Average Benchmarks Intel HD Graphics 4200 → 100% n=10 Average Benchmarks NVIDIA GeForce RTX 3050 6GB Laptop GPU → 1685% n=10
- Range of benchmark values for this graphics card
- Average benchmark values for this graphics card
* Smaller numbers mean a higher performance
1 This benchmark is not used for the average calculation
Game Benchmarks The following benchmarks stem from our benchmarks of review laptops. The performance depends on the used graphics memory, clock rate, processor, system settings, drivers, and operating systems. So the results don't have to be representative for all laptops with this GPU. For detailed information on the benchmark results, click on the fps number.
GeForce RTX 3050 6GB Laptop GPU:
39.5 fps
GeForce RTX 3050 6GB Laptop GPU:
36.3 fps
GeForce RTX 3050 6GB Laptop GPU:
31.5 fps
GeForce RTX 3050 6GB Laptop GPU:
23.4 fps
GeForce RTX 3050 6GB Laptop GPU:
15.1 fps
GeForce RTX 3050 6GB Laptop GPU:
70 fps
GeForce RTX 3050 6GB Laptop GPU:
63 fps
GeForce RTX 3050 6GB Laptop GPU:
55 fps
GeForce RTX 3050 6GB Laptop GPU:
41 fps
GeForce RTX 3050 6GB Laptop GPU:
31 fps
GeForce RTX 3050 6GB Laptop GPU:
55.2 67.6 ~ 61 fps
GeForce RTX 3050 6GB Laptop GPU:
43.7 52.1 ~ 48 fps
GeForce RTX 3050 6GB Laptop GPU:
36.6 43.2 ~ 40 fps
GeForce RTX 3050 6GB Laptop GPU:
31.4 36.9 ~ 34 fps
GeForce RTX 3050 6GB Laptop GPU:
21.3 fps
GeForce RTX 3050 6GB Laptop GPU:
113.9 150.1 ~ 132 fps
GeForce RTX 3050 6GB Laptop GPU:
109 141.2 ~ 125 fps
GeForce RTX 3050 6GB Laptop GPU:
86.9 97.5 ~ 92 fps
GeForce RTX 3050 6GB Laptop GPU:
20.5 26 ~ 23 fps
GeForce RTX 3050 6GB Laptop GPU:
10.6 14.3 ~ 12 fps
GeForce RTX 3050 6GB Laptop GPU:
40 fps
GeForce RTX 3050 6GB Laptop GPU:
38 fps
GeForce RTX 3050 6GB Laptop GPU:
34 fps
GeForce RTX 3050 6GB Laptop GPU:
29 fps
GeForce RTX 3050 6GB Laptop GPU:
30.7 33.6 34 ~ 33 fps
GeForce RTX 3050 6GB Laptop GPU:
18.1 20.1 ~ 19 fps
GeForce RTX 3050 6GB Laptop GPU:
113.3 fps
GeForce RTX 3050 6GB Laptop GPU:
89.7 fps
GeForce RTX 3050 6GB Laptop GPU:
59.2 fps
GeForce RTX 3050 6GB Laptop GPU:
46.4 fps
GeForce RTX 3050 6GB Laptop GPU:
80.8 fps
GeForce RTX 3050 6GB Laptop GPU:
64.2 fps
GeForce RTX 3050 6GB Laptop GPU:
46.4 fps
GeForce RTX 3050 6GB Laptop GPU:
38.5 fps
GeForce RTX 3050 6GB Laptop GPU:
218 fps
GeForce RTX 3050 6GB Laptop GPU:
127.4 fps
GeForce RTX 3050 6GB Laptop GPU:
104.8 fps
GeForce RTX 3050 6GB Laptop GPU:
61.9 fps
GeForce RTX 3050 6GB Laptop GPU:
40 fps
GeForce RTX 3050 6GB Laptop GPU:
210 256 ~ 233 fps
GeForce RTX 3050 6GB Laptop GPU:
96.5 112.8 ~ 105 fps
GeForce RTX 3050 6GB Laptop GPU:
80.9 91.9 ~ 86 fps
GeForce RTX 3050 6GB Laptop GPU:
70.7 80.5 ~ 76 fps
GeForce RTX 3050 6GB Laptop GPU:
57.1 fps
GeForce RTX 3050 6GB Laptop GPU:
132 fps
GeForce RTX 3050 6GB Laptop GPU:
76 89 ~ 83 fps
GeForce RTX 3050 6GB Laptop GPU:
70 82 ~ 76 fps
GeForce RTX 3050 6GB Laptop GPU:
65 76 ~ 71 fps
GeForce RTX 3050 6GB Laptop GPU:
52 fps
GeForce RTX 3050 6GB Laptop GPU:
76 116.2 117 ~ 103 fps
GeForce RTX 3050 6GB Laptop GPU:
44.2 51.2 52 ~ 49 fps
GeForce RTX 3050 6GB Laptop GPU:
32 37.4 ~ 35 fps
100%
HD Graphics 4200:
9.8 fps
100%
HD Graphics 4200:
11.2 fps
100%
HD Graphics 4200:
6.4 fps
100%
HD Graphics 4200:
17.2 fps
100%
HD Graphics 4200:
10.7 fps
100%
HD Graphics 4200:
12 fps
100%
HD Graphics 4200:
11.3 fps
100%
HD Graphics 4200:
19.2 fps
100%
HD Graphics 4200:
11.5 fps
100%
HD Graphics 4200:
14.9 fps
100%
HD Graphics 4200:
9.3 fps
100%
HD Graphics 4200:
18 fps
100%
HD Graphics 4200:
7.7 fps
100%
HD Graphics 4200:
37.7 fps
100%
HD Graphics 4200:
24.8 fps
100%
HD Graphics 4200:
30.7 fps
100%
HD Graphics 4200:
20.5 fps
GeForce RTX 3050 6GB Laptop GPU:
98 99.5 116.9 ~ 105 fps
100%
HD Graphics 4200:
8.8 fps
2523%
GeForce RTX 3050 6GB Laptop GPU:
187 236 244 ~ 222 fps
100%
HD Graphics 4200:
5.1 fps
2725%
GeForce RTX 3050 6GB Laptop GPU:
118 159.1 ~ 139 fps
GeForce RTX 3050 6GB Laptop GPU:
71 91.4 96.5 ~ 86 fps
GeForce RTX 3050 6GB Laptop GPU:
37 fps
100%
HD Graphics 4200:
67.9 fps
100%
HD Graphics 4200:
15.6 fps
GeForce RTX 3050 6GB Laptop GPU:
172 172.6 ~ 172 fps
GeForce RTX 3050 6GB Laptop GPU:
53 62.7 63.8 ~ 60 fps
GeForce RTX 3050 6GB Laptop GPU:
36.5 42.7 ~ 40 fps
100%
HD Graphics 4200:
7.8 fps
100%
HD Graphics 4200:
8.5 18.5 ~ 14 fps
100%
HD Graphics 4200:
5.7 11.8 ~ 9 fps
100%
HD Graphics 4200:
6.1 fps
100%
HD Graphics 4200:
3.3 fps
100%
HD Graphics 4200:
7.3 fps
100%
HD Graphics 4200:
4.2 fps
100%
HD Graphics 4200:
16 fps
100%
HD Graphics 4200:
12 fps
100%
HD Graphics 4200:
12 fps
100%
HD Graphics 4200:
6.6 fps
100%
HD Graphics 4200:
6.2 fps
100%
HD Graphics 4200:
4.2 fps
100%
HD Graphics 4200:
12.9 fps
100%
HD Graphics 4200:
9 fps
100%
HD Graphics 4200:
5.1 fps
100%
HD Graphics 4200:
9.7 15.1 ~ 12 fps
100%
HD Graphics 4200:
8.4 fps
100%
HD Graphics 4200:
3.4 4 ~ 4 fps
100%
HD Graphics 4200:
15.3 fps
100%
HD Graphics 4200:
10.9 fps
100%
HD Graphics 4200:
89.1 fps
100%
HD Graphics 4200:
24.4 fps
100%
HD Graphics 4200:
19.9 fps
100%
HD Graphics 4200:
11.7 fps
100%
HD Graphics 4200:
57.5 fps
100%
HD Graphics 4200:
18.9 fps
100%
HD Graphics 4200:
9.7 fps
100%
HD Graphics 4200:
6.5 fps
100%
HD Graphics 4200:
27.2 fps
100%
HD Graphics 4200:
21.9 fps
100%
HD Graphics 4200:
43.1 fps
100%
HD Graphics 4200:
23.4 fps
100%
HD Graphics 4200:
15 fps
100%
HD Graphics 4200:
11 14 ~ 13 fps
100%
HD Graphics 4200:
5.3 7.1 ~ 6 fps
100%
HD Graphics 4200:
5.8 fps
100%
HD Graphics 4200:
13 fps
100%
HD Graphics 4200:
9.8 fps
100%
HD Graphics 4200:
26.2 fps
100%
HD Graphics 4200:
13.9 fps
100%
HD Graphics 4200:
14.1 fps
100%
HD Graphics 4200:
18.4 fps
100%
HD Graphics 4200:
12.7 fps
100%
HD Graphics 4200:
4.2 fps
100%
HD Graphics 4200:
15.9 fps
100%
HD Graphics 4200:
10.1 fps
100%
HD Graphics 4200:
6.6 fps
100%
HD Graphics 4200:
2.5 fps
100%
HD Graphics 4200:
24 fps
100%
HD Graphics 4200:
14 fps
100%
HD Graphics 4200:
7 fps
100%
HD Graphics 4200:
31 fps
100%
HD Graphics 4200:
21 fps
100%
HD Graphics 4200:
16 fps
100%
HD Graphics 4200:
12 fps
100%
HD Graphics 4200:
90.8 fps
100%
HD Graphics 4200:
59.7 fps
100%
HD Graphics 4200:
33.3 fps
100%
HD Graphics 4200:
22.3 fps
100%
HD Graphics 4200:
27.7 fps
100%
HD Graphics 4200:
18.4 fps
100%
HD Graphics 4200:
13.3 fps
100%
HD Graphics 4200:
4.7 fps
100%
HD Graphics 4200:
11.3 fps
100%
HD Graphics 4200:
8.8 fps
100%
HD Graphics 4200:
5.2 fps
100%
HD Graphics 4200:
3.5 fps
100%
HD Graphics 4200:
11.9 fps
100%
HD Graphics 4200:
8.2 fps
100%
HD Graphics 4200:
6.6 fps
100%
HD Graphics 4200:
17.8 fps
100%
HD Graphics 4200:
10.4 fps
100%
HD Graphics 4200:
5.8 fps
100%
HD Graphics 4200:
9.8 11.5 ~ 11 fps
100%
HD Graphics 4200:
8.3 fps
100%
HD Graphics 4200:
7 fps
100%
HD Graphics 4200:
4.3 fps
100%
HD Graphics 4200:
51.1 fps
100%
HD Graphics 4200:
25.7 fps
100%
HD Graphics 4200:
17.9 fps
100%
HD Graphics 4200:
12.7 fps
100%
HD Graphics 4200:
9.1 fps
100%
HD Graphics 4200:
5.3 fps
100%
HD Graphics 4200:
3 fps
100%
HD Graphics 4200:
10.6 11.2 ~ 11 fps
100%
HD Graphics 4200:
2.8 fps
100%
HD Graphics 4200:
95 109.2 ~ 102 fps
100%
HD Graphics 4200:
31 38.8 ~ 35 fps
100%
HD Graphics 4200:
20 22.7 ~ 21 fps
100%
HD Graphics 4200:
7 fps
100%
HD Graphics 4200:
18.8 fps
100%
HD Graphics 4200:
10.1 fps
100%
HD Graphics 4200:
6.8 fps
100%
HD Graphics 4200:
4.3 fps
100%
HD Graphics 4200:
11.4 fps
100%
HD Graphics 4200:
7.2 fps
100%
HD Graphics 4200:
4.9 fps
100%
HD Graphics 4200:
47.6 fps
100%
HD Graphics 4200:
20.9 fps
100%
HD Graphics 4200:
14.2 fps
100%
HD Graphics 4200:
7.2 fps
100%
HD Graphics 4200:
26.2 fps
100%
HD Graphics 4200:
16.5 fps
100%
HD Graphics 4200:
16.7 fps
100%
HD Graphics 4200:
11.4 fps
100%
HD Graphics 4200:
3.8 fps
100%
HD Graphics 4200:
27.2 fps
100%
HD Graphics 4200:
19.1 fps
100%
HD Graphics 4200:
8.9 fps
100%
HD Graphics 4200:
22.9 fps
100%
HD Graphics 4200:
15.1 fps
100%
HD Graphics 4200:
17.8 fps
100%
HD Graphics 4200:
14.5 fps
100%
HD Graphics 4200:
13.9 fps
100%
HD Graphics 4200:
8.5 fps
100%
HD Graphics 4200:
104.8 fps
100%
HD Graphics 4200:
55.6 fps
100%
HD Graphics 4200:
49.2 fps
100%
HD Graphics 4200:
31.7 fps
100%
HD Graphics 4200:
20 fps
100%
HD Graphics 4200:
15.5 fps
100%
HD Graphics 4200:
9.3 fps
100%
HD Graphics 4200:
41 fps
100%
HD Graphics 4200:
10 fps
100%
HD Graphics 4200:
4 fps
100%
HD Graphics 4200:
70.7 fps
100%
HD Graphics 4200:
35.5 fps
100%
HD Graphics 4200:
18.9 fps
100%
HD Graphics 4200:
12.5 fps
100%
HD Graphics 4200:
22.7 fps
100%
HD Graphics 4200:
16.5 fps
100%
HD Graphics 4200:
8.2 fps
100%
HD Graphics 4200:
5.5 fps
100%
HD Graphics 4200:
34.5 fps
100%
HD Graphics 4200:
18.9 fps
100%
HD Graphics 4200:
12.6 fps
100%
HD Graphics 4200:
4.9 fps
100%
HD Graphics 4200:
32.5 38.7 ~ 36 fps
100%
HD Graphics 4200:
21.8 23.3 ~ 23 fps
100%
HD Graphics 4200:
16.9 19 ~ 18 fps
100%
HD Graphics 4200:
9.8 fps
100%
HD Graphics 4200:
28.2 fps
100%
HD Graphics 4200:
19.5 fps
100%
HD Graphics 4200:
11.1 fps
100%
HD Graphics 4200:
8.4 fps
100%
HD Graphics 4200:
6.1 fps
100%
HD Graphics 4200:
10.3 12.3 ~ 11 fps
100%
HD Graphics 4200:
5.4 fps
100%
HD Graphics 4200:
24.4 fps
100%
HD Graphics 4200:
10.2 fps
100%
HD Graphics 4200:
5.7 fps
100%
HD Graphics 4200:
2.9 fps
100%
HD Graphics 4200:
13.9 fps
100%
HD Graphics 4200:
9.9 fps
100%
HD Graphics 4200:
5.4 fps
100%
HD Graphics 4200:
27.5 42.6 ~ 35 fps
100%
HD Graphics 4200:
15.4 19 ~ 17 fps
100%
HD Graphics 4200:
8.9 fps
100%
HD Graphics 4200:
24.4 67.8 ~ 46 fps
100%
HD Graphics 4200:
12 34.1 ~ 23 fps
100%
HD Graphics 4200:
20.4 fps
100%
HD Graphics 4200:
54.8 fps
100%
HD Graphics 4200:
32.2 fps
100%
HD Graphics 4200:
24.5 fps
100%
HD Graphics 4200:
15.6 fps
100%
HD Graphics 4200:
37.5 fps
100%
HD Graphics 4200:
19.5 fps
100%
HD Graphics 4200:
14 fps
100%
HD Graphics 4200:
56.5 fps
100%
HD Graphics 4200:
22.8 fps
100%
HD Graphics 4200:
121 [X] Panasonic ToughPad FZ-M1 Intel Core i5-4302Y 1.6GHz
HD Graphics 4200
130 ~ 126 fps
100%
HD Graphics 4200:
43.9 46.9 [X] Panasonic ToughPad FZ-M1 Intel Core i5-4302Y 1.6GHz
HD Graphics 4200
~ 45 fps
100%
HD Graphics 4200:
64.6 fps
100%
HD Graphics 4200:
53.4 fps
Average Gaming Intel HD Graphics 4200 → 100% Average Gaming 30-70 fps → 100%
Average Gaming NVIDIA GeForce RTX 3050 6GB Laptop GPU → 2624% NVIDIA GeForce RTX 3050 6GB Laptop GPU low med. high ultra QHD 4K Avatar Frontiers of Pandora 39.5 36.3 31.5 23.4 15.1 Assassin's Creed Mirage 70 63 55 41 31 Cyberpunk 2077 2.1 Phantom Liberty 61 48 40 34 21.3 F1 23 132 125 92 23 12 Returnal 40 38 34 29 F1 22 142 134 102 33 19 Tiny Tina's Wonderlands 113.3 89.7 59.2 46.4 Cyberpunk 2077 1.6 80.8 64.2 46.4 38.5 F1 2021 218 127.4 104.8 61.9 40 Strange Brigade 233 105 86 76 57.1 Far Cry 5 132 83 76 71 52 X-Plane 11.11 124 103 85 Final Fantasy XV Benchmark 123 67 49 35 Dota 2 Reborn 142 127 114 105 The Witcher 3 222 139 86 49 37 GTA V 173 172 113 60 40 < 30 fps < 60 fps < 120 fps ≥ 120 fps 2 4 10 3 7 6 7 9 3 6 5 4 7
For more games that might be playable and a list of all games and graphics cards visit our Gaming List
v1.27
log 16. 23:56:57
#0 checking url part for id 4576 +0s ... 0s
#1 checking url part for id 11576 +0s ... 0s
#2 not redirecting to Ajax server +0s ... 0s
#3 did not recreate cache, as it is less than 5 days old! Created at Sun, 16 Jun 2024 05:38:48 +0200 +0.001s ... 0.001s
#4 composed specs +0.09s ... 0.091s
#5 did output specs +0s ... 0.091s
#6 start showIntegratedCPUs +0s ... 0.091s
#7 getting avg benchmarks for device 4576 +0.044s ... 0.135s
#8 got single benchmarks 4576 +0.038s ... 0.172s
#9 getting avg benchmarks for device 11576 +0.018s ... 0.19s
#10 got single benchmarks 11576 +0.027s ... 0.217s
#11 got avg benchmarks for devices +0s ... 0.217s
#12 min, max, avg, median took s +0.212s ... 0.429s
#13 before gaming benchmark output +0s ... 0.429s
#14 Got 397 rows for game benchmarks. +0.055s ... 0.484s
#15 composed SQL query for gamebenchmarks +0s ... 0.484s
#16 got data and put it in $dataArray +0.057s ... 0.54s
#17 benchmarks composed for output. +0.179s ... 0.719s
#18 calculated avg scores. +0s ... 0.719s
#19 return log +0.041s ... 0.761s
Please share our article, every link counts!
Redaktion, 2017-09- 8 (Update: 2023-07- 1)
 Deutsch
 English
 Español
 Français
 Italiano
 Nederlands
 Polski
 Português
 Русский
 Türkçe
 Svenska
 Chinese
 Magyar