Notebookcheck Logo

AMD Radeon R7 (Bristol Ridge) vs Intel HD Graphics 6000 vs Intel HD Graphics P530

AMD Radeon R7 (Bristol Ridge)

► remove from comparison AMD Radeon R7 (Bristol Ridge)

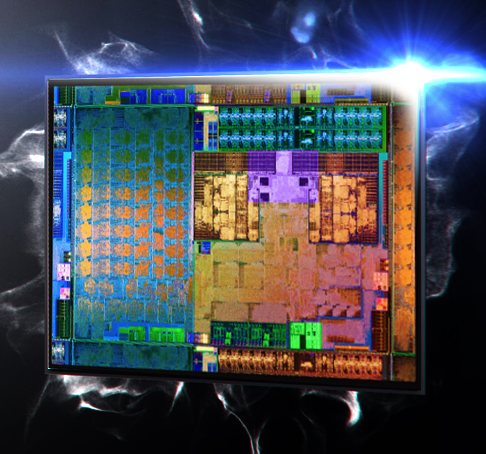
The AMD Radeon R7 (Bristol Ridge) is an integrated graphics card for the fastest mobile AMD Carrizo APUs. At its launch, the R7 is available on the top model FX9830P with 512 GCN shader units and a core clock of 900 MHz. The technical specifications do not differ from the AMD Radeon R7 in Carrizo, but the clock is up to 100 MHz higher. Depending on the cooling and the configurable TDP (12-45 Watts), the performance can differ quite a lot. The performance also depends on the memory (best performance with dual-channel DDR4).

Architecture and Features

According to AMD, the Radeon R7 consists of eight cores based on the third GCN generation (often called GCN 1.2 or 2.0 in the press). It is therefore very similar to the Tonga desktop chip and supports DirectX 12 (FL 12_0). Furthermore, its shaders can be used with Mantle, OpenGL and OpenCL. HSA 1.0 is supported for running code on both CPU and GPU cores simultaneously.

Compared to the Kaveri generation (Kaveri R7 with GCN 1.1), the new color compression in particular results in better memory utilization and improves the gaming performance by 5-7 %. 

The improved video decoder of Carrizo/Bristol Ridge now includes UVD 6 (Unified Video Decoder), which can decode HVEC / H.265 up to 4K in hardware. Furthermore, the VCE (Video Codec Engine) has been improved for faster transcoding of H.264. More information on architecture and features of the Bristol Ridge architecture can be found in our launch article.

Performance

Depending on the configurable TDP of the Bristol Ridge chips between 12 up to 45 Watts, there can be significant differences in games. Overall, the results are slightly better compared to the Carrizo Radeon R7 due to the higher clocks for comparable model. You can still use the Kaveri R7 benchmarks to check the gaming performance.

Power Consumption

Depending on the configurable TDP (cTDP), the 28 nm chip is specified at 12-45 Watts. It can therefore be used for thin and light notebooks as well as medium-sized devices or All-in-Ones (AiO).

Intel HD Graphics 6000

► remove from comparison Intel HD Graphics 6000

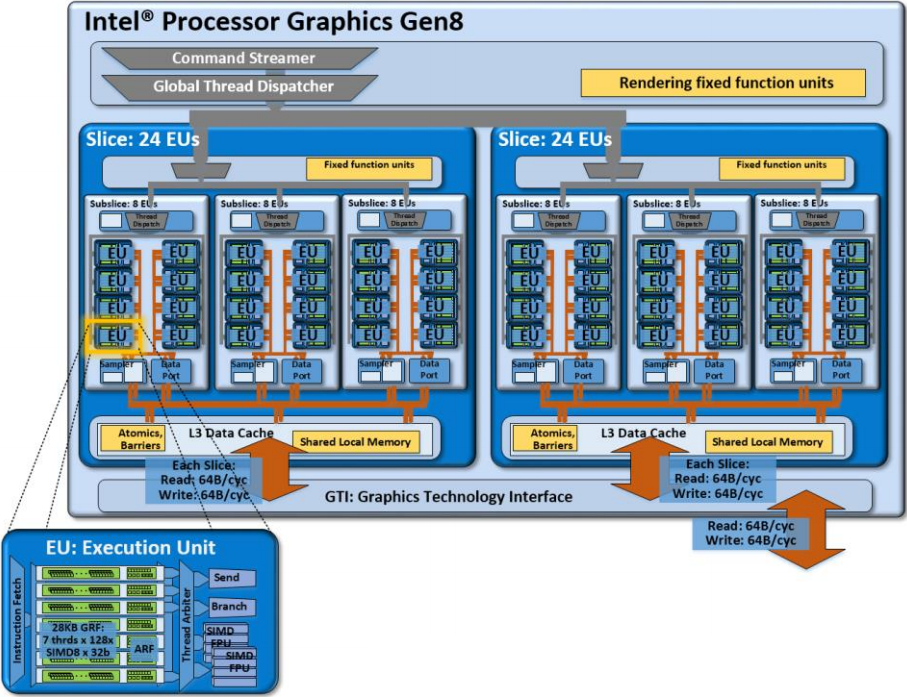
The Intel HD Graphics 6000 (GT3) is an integrated Broadwell graphics card revealed in Q1 2015. It can be found in several ULV SoCs (15 W TDP) such as the Core i5-5250U or i7-5650U. The so-called GT3 GPU offers 48 EUs (Execution Units) and therefore somewhat more shader power than the previous HD 5000 (40 EUs). Depending on the specific CPU, the maximum GPU frequency varies between 950 and 1000 MHz.

Architecture and Features

Broadwell features a GPU based on the Intel Gen8 architecture, which has been optimized in various aspects compared to the previous Gen7.5 (Haswell). Inter alia, the shader arrays called "subslice" have been reorganized and now offer 8 Execution Units (EUs) each. Three subslices form a "slice" for a total of 24 EUs. Combined with other improvements such as larger L1 caches and an optimized frontend, the integrated GPU has become faster and more efficient than its predecessor.

The HD Graphics 6000 represents the top-end version of the Broadwell GPU family and consists of two slices with 48 EUs. Beyond that, there is also a low-end (GT1, 12 EUs), a mid-range (GT2, 24 EUs) and a high-end variant (GT3e, 48 EUs + eDRAM).

All Broadwell GPUs support OpenCL 2.0 and DirectX 12 (FL 11_1). The video engine can now decode H.265 using both fixed function hardware as well as available GPU shaders. Up to three displays can be connected via DP 1.2/eDP 1.3 (max. 3840 x 2160 @ 60 Hz) or HDMI 1.4a (max. 3840 x 2160 @ 24 Hz). HDMI 2.0, however, is not supported.

Performance

Depending on the specific CPU, the maximum GPU frequency varies between 950 and 1000 MHz. Due to the low TDP, however, the average clock in 3D applications will be significantly lower. Overall, the HD Graphics 6000 outperforms the previous HD 5000 by 20 - 25 percent and offers a performance slightly below a dedicated GeForce 820M.

Games as of 2014/2015 will usually run fluently only at (very) low settings.

Power Consumption

Utilizing a new 14 nm process, the Broadwell ULV chips are specified at just 15 W TDP and therefore suited for thin ultrabooks. The TDP is flexible and can be further reduced (9.5 W), which has a significant impact on performance.

Intel HD Graphics P530

► remove from comparison Intel HD Graphics P530

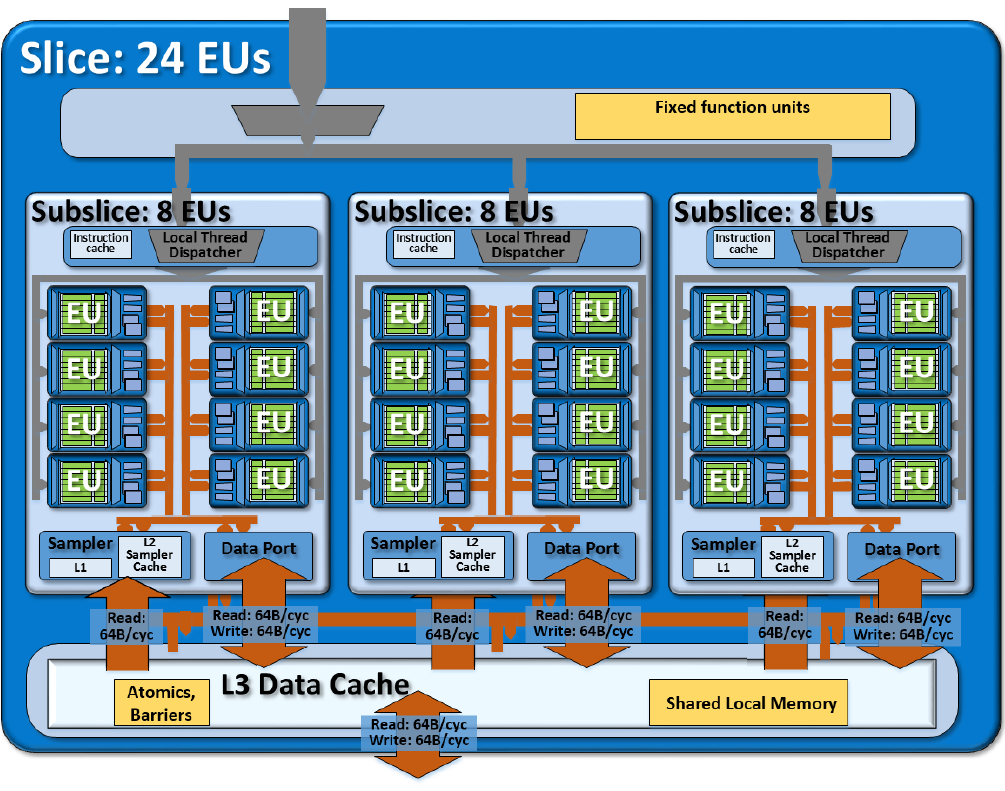
The Intel HD Graphics P530 (GT2) is an integrated graphics unit, which can be found in various Xeon workstation processors of the Skylake generation. The "GT2" version of the Skylake GPU offers 24 Execution Units (EUs) clocked at up to 1050 MHz (depending on the CPU model). Due to its lack of dedicated graphics memory or eDRAM cache, the P530 has to access the main memory (2x 64bit DDR3L-1600 / DDR4-2133).

Performance

Depending on the memory configuration, the HD Graphics P530 is just slightly behind a dedicated GeForce 920M and will handle modern games (as of 2015) in low or medium settings.

Features

The revised video engine now decodes H.265/HEVC completely in hardware and thereby much more efficiently than before. Displays can be connected via DP 1.2 / eDP 1.3 (max. 3840 x 2160 @ 60 Hz), whereas HDMI is limited to the older version 1.4a (max. 3840 x 2160 @ 30 Hz). However, HDMI 2.0 can be added using a DisplayPort converter. Up to three displays can be controlled simultaneously.

Power Consumption

The HD Graphics P530 can be found in mobile quad-core Xeon processors with 45 W TDP.

AMD Radeon R7 (Bristol Ridge)Intel HD Graphics 6000Intel HD Graphics P530
HD Graphics Series
Radeon R7 (Bristol Ridge) 512 @ 0.9 GHz64/128 Bit
Radeon R5 (Bristol Ridge) 384 @ 0.8 GHz64/128 Bit
Radeon R5 (Stoney Ridge) 192 @ 0.8 GHz64 Bit
Radeon R4 (Stoney Ridge) 192 @ 0.6 GHz64 Bit
Radeon R2 (Stoney Ridge) 128 @ 0.6 GHz64 Bit
HD Graphics P530 24 @ 0.35 - 1.05 GHz64/128 Bit
HD Graphics 5600 24 @ 0.3 - 1.05 GHz
HD Graphics 6000 48 @ 0.3 - 1 GHz64/128 Bit
HD Graphics 4600 20 @ 0.2 - 1.35 GHz64/128 Bit
HD Graphics 5500 24 @ 0.3 - 0.95 GHz64/128 Bit
HD Graphics 5000 40 @ 0.2 - 1.1 GHz64/128 Bit
HD Graphics 4400 20 @ 0.2 - 1.1 GHz64/128 Bit
HD Graphics 5300 24 @ 0.1 - 0.9 GHz64/128 Bit
HD Graphics 4000 16 @ 0.35 - 1.35 GHz64/128 Bit
HD Graphics (Broadwell) 12 @ 0.1 - 0.85 GHz64/128 Bit
HD Graphics 4200 20 @ 0.2 - 0.85 GHz64/128 Bit
HD Graphics (Skylake) 12 @ 0.3 - 0.8 GHz64/128 Bit
HD Graphics 405 (Braswell) 16 @ 0.32 - 0.7 GHz64/128 Bit
HD Graphics (Braswell) 16 @ 0.32 - 0.7 GHz64/128 Bit
HD Graphics 400 (Braswell) 12 @ 0.32 - 0.64 GHz64/128 Bit
HD Graphics (Haswell) 10 @ 0.2 - 1 GHz64/128 Bit
HD Graphics (Cherry Trail) 16 @ 0.2 - 0.6 GHz64/128 Bit
HD Graphics 3000 12 @ 0.35 - 1.35 GHz64/128 Bit
HD Graphics 2500 6 @ 0.65 - 1.15 GHz64/128 Bit
HD Graphics (Ivy Bridge) 6 @ 0.35 - 1.1 GHz64/128 Bit
HD Graphics 2000 6 @ 0.85 - 1.35 GHz64/128 Bit
HD Graphics (Sandy Bridge) 6 @ 0.35 - 1.1 GHz64/128 Bit
HD Graphics (Bay Trail) 4 @ 0.31 - 0.9 GHz32/64/128 Bit
CodenameBristol RidgeBroadwell GT3Skylake GT2
ArchitectureGCN 1.2Gen. 8 BroadwellGen. 9 Skylake
Pipelines512 - unified48 - unified24 - unified
Core Speed900 (Boost) MHz300 - 1000 (Boost) MHz350 - 1050 (Boost) MHz
Memory Bus Width64/128 Bit64/128 Bit64/128 Bit
Shared Memoryyesyesyes
APIDirectX 12 (FL 12_0), OpenGL 4.4DirectX 12 (FL 11_1), OpenGL 4.3DirectX 12_1, OpenGL 4.4
Power Consumption12-45 Watt
Transistors2.4 Billion1.9 Billion
technology28 nm14 nm14 nm
FeaturesUVD 6, VCEQuickSyncQuickSync
Notebook Sizemedium sized
Date of Announcement01.06.2016 05.01.2015 01.09.2015
Memory TypeDDR3/DDR4
CPU in Radeon R7 (Bristol Ridge)GPU Base SpeedGPU Boost / Turbo
AMD FX-9830P4 x 3000 MHz, 45 W? MHz900 MHz
AMD PRO A12-9830B4 x 3000 MHz, 45 W? MHz900 MHz
AMD FX-9800P4 x 2700 MHz, 15 W? MHz758 MHz
min. - max.? MHz758 - 900 MHz
CPU in HD Graphics 6000GPU Base SpeedGPU Boost / Turbo
Intel Core i7-5650U2 x 2200 MHz, 15 W300 MHz1000 MHz
Intel Core i7-5550U2 x 2000 MHz, 15 W300 MHz1000 MHz
Intel Core i5-5350U2 x 1800 MHz, 15 W300 MHz1000 MHz
Intel Core i5-5250U2 x 1600 MHz, 15 W300 MHz1000 MHz
min. - max.300 MHz1000 MHz
CPU in HD Graphics P530GPU Base SpeedGPU Boost / Turbo
Intel Xeon E3-1535M v54 x 2900 MHz, 45 W350 MHz1050 MHz
Intel Xeon E3-1505M v54 x 2800 MHz, 45 W350 MHz1050 MHz
min. - max.350 MHz1050 MHz

Benchmarks

Performance Rating - 3DMark 11 + Fire Strike + Time Spy - Radeon R7 (Bristol Ridge)
0.4 pt (1%)
Restrict / Search: Model: Max. age: years
Performance Rating - 3DMark 11 + Fire Strike + Time Spy - HD Graphics 6000
0.4 pt (1%)
Restrict / Search: Model: Max. age: years
3DMark - 3DMark Fire Strike Standard Score
min: 667     avg: 938     median: 866 (1%)     max: 1230 Points
min: 844     avg: 906     median: 903 (1%)     max: 971 Points
3DMark - 3DMark Fire Strike Standard Graphics
min: 750     avg: 1081     median: 1013 (1%)     max: 1466 Points
min: 858     avg: 947     median: 951 (1%)     max: 1033 Points
3DMark - 3DMark Ice Storm Graphics
min: 44545     avg: 48082     median: 46007 (5%)     max: 53693 Points
min: 61674     avg: 62508     median: 61979 (7%)     max: 63871 Points
3DMark - 3DMark Time Spy Score
min: 338     avg: 364.7     median: 358 (1%)     max: 398 Points
374 Points (1%)
3DMark - 3DMark Time Spy Graphics
min: 325     avg: 343.7     median: 347 (1%)     max: 359 Points
334 Points (1%)
3DMark - 3DMark Ice Storm Unlimited Graphics
min: 34845     avg: 49654     median: 52245.5 (5%)     max: 59281 Points
3DMark - 3DMark Ice Storm Extreme Graphics
min: 32062     avg: 34971     median: 32389 (4%)     max: 40461 Points
3DMark - 3DMark Cloud Gate Score
min: 3162     avg: 4026     median: 3942 (4%)     max: 5173 Points
min: 5425     avg: 5737     median: 5872 (6%)     max: 6061 Points
3DMark - 3DMark Cloud Gate Graphics
min: 3477     avg: 5531     median: 5311 (1%)     max: 8107 Points
min: 7378     avg: 7700     median: 7660 (2%)     max: 8102 Points
3DMark 11 - 3DM11 Performance Score
min: 1737     avg: 1859     median: 1794 (2%)     max: 2130 Points
min: 1328     avg: 1487     median: 1513.5 (2%)     max: 1591 Points
3DMark 11 - 3DM11 Performance GPU
min: 1820     avg: 1913     median: 1852 (1%)     max: 2210 Points
min: 1210     avg: 1372     median: 1395.5 (1%)     max: 1487 Points
3DMark Vantage
3DM Vant. Perf. total + AMD Radeon R7 (Bristol Ridge)
3DMark Vantage - 3DM Vant. Perf. total
5568 Points (2%)
3DM Vant. Perf. total + Intel HD Graphics 6000
min: 5797     avg: 6106     median: 6188 (2%)     max: 6333 Points
3DM Vant. Perf. GPU no PhysX + AMD Radeon R7 (Bristol Ridge)
3DMark Vantage - 3DM Vant. Perf. GPU no PhysX
5111 Points (3%)
3DM Vant. Perf. GPU no PhysX + Intel HD Graphics 6000
min: 5129     avg: 5410     median: 5432 (3%)     max: 5670 Points
3DMark 06 3DMark 06 - Standard 1280x1024 + AMD Radeon R7 (Bristol Ridge)
3DMark 06
min: 5635     avg: 6645     median: 6644.5 (9%)     max: 7654 Points
3DMark 06 - Standard 1280x1024 + Intel HD Graphics 6000
min: 7844     avg: 8448     median: 8091 (11%)     max: 9408 Points
Unigine Valley 1.0 - Unigine Valley 1.0 DX
3.5 fps (1%)
3.7 fps (1%)
Unigine Heaven 3.0 - Unigine Heaven 3.0 DX 11
13.9 fps (5%)
Unigine Heaven 2.1 - Heaven 2.1 high
19.5 fps (4%)
min: 18.6     avg: 19     median: 18.7 (4%)     max: 19.8 fps
SPECviewperf 12
specvp12 sw-03 + Intel HD Graphics 6000
SPECviewperf 12 - specvp12 sw-03
16.6 fps (4%)
specvp12 snx-02 + Intel HD Graphics 6000
SPECviewperf 12 - specvp12 snx-02
2.5 fps (0%)
specvp12 showcase-01 + Intel HD Graphics 6000
SPECviewperf 12 - specvp12 showcase-01
5.6 fps (1%)
specvp12 mediacal-01 + Intel HD Graphics 6000
SPECviewperf 12 - specvp12 mediacal-01
1.6 fps (0%)
specvp12 maya-04 + Intel HD Graphics 6000
SPECviewperf 12 - specvp12 maya-04
3.3 fps (1%)
specvp12 energy-01 + Intel HD Graphics 6000
SPECviewperf 12 - specvp12 energy-01
0.1 fps (0%)
specvp12 creo-01 + Intel HD Graphics 6000
SPECviewperf 12 - specvp12 creo-01
9.9 fps (4%)
specvp12 catia-04 + Intel HD Graphics 6000
SPECviewperf 12 - specvp12 catia-04
11.3 fps (2%)
Windows 7 Experience Index - Win7 Gaming graphics
6.9 Points (87%)
Windows 7 Experience Index - Win7 Graphics
5.9 Points (75%)
Cinebench R10 Cinebench R10 Shading (32bit) + AMD Radeon R7 (Bristol Ridge)
Cinebench R10 - Cinebench R10 Shading (32bit)
min: 4680     avg: 4943     median: 4845 (3%)     max: 5403 Points
Cinebench R10 Shading (32bit) + Intel HD Graphics 6000
min: 6148     avg: 6928     median: 6527 (5%)     max: 8110 Points
Cinebench R11.5 Cinebench R11.5 OpenGL 64 Bit + AMD Radeon R7 (Bristol Ridge)
Cinebench R11.5 - Cinebench R11.5 OpenGL 64 Bit
min: 18.06     avg: 20.1     median: 18.3 (6%)     max: 25.65 fps
Cinebench R11.5 OpenGL 64 Bit + Intel HD Graphics 6000
min: 21.27     avg: 23.7     median: 23.9 (8%)     max: 25.67 fps
Cinebench R15
Cinebench R15 OpenGL 64 Bit + AMD Radeon R7 (Bristol Ridge)
Cinebench R15 - Cinebench R15 OpenGL 64 Bit
min: 22.88     avg: 25.1     median: 23.2 (1%)     max: 31.43 fps
Cinebench R15 OpenGL 64 Bit + Intel HD Graphics 6000
min: 25.89     avg: 30.1     median: 30.7 (2%)     max: 34.45 fps
Cinebench R15 OpenGL Ref. Match 64 Bit + AMD Radeon R7 (Bristol Ridge)
Cinebench R15 OpenGL Ref. Match 64 Bit + Intel HD Graphics 6000
min: 98     avg: 98.5     median: 98 (98%)     max: 99.3 %
GFXBench - GFXBench Car Chase Offscreen
23.8 fps (2%)
GFXBench 3.1 - GFXBench Manhattan ES 3.1 Offscreen
24.3 fps (1%)
GFXBench 3.0 - GFXBench 3.0 Manhattan Offscreen
25.9 fps (1%)
min: 34.22     avg: 39.5     median: 39.5 (2%)     max: 44.7 fps
GFXBench (DX / GLBenchmark) 2.7
GFXBench T-Rex HD Offscreen C24Z16 + AMD Radeon R7 (Bristol Ridge)
GFXBench (DX / GLBenchmark) 2.7 - GFXBench T-Rex HD Offscreen C24Z16
90 fps (1%)
LuxMark v2.0 64Bit - LuxMark v2.0 Room GPU
min: 175     avg: 178.5     median: 178.5 (1%)     max: 182 Samples/s
min: 127     avg: 136     median: 135 (0%)     max: 146 Samples/s
LuxMark v2.0 64Bit - LuxMark v2.0 Sala GPU
min: 358     avg: 362.5     median: 362.5 (1%)     max: 367 Samples/s
min: 342     avg: 357     median: 350 (1%)     max: 379 Samples/s
ComputeMark v2.1 - ComputeMark v2.1 Result
min: 1093     avg: 1346     median: 1450 (1%)     max: 1495 Points
min: 941     avg: 1032     median: 1021 (1%)     max: 1134 Points
Power Consumption - Furmark Stress Test Power Consumption - external Monitor *
32.9 Watt (4%)
Power Consumption - The Witcher 3 Power Consumption - external Monitor *
29.1 Watt (4%)
32.1 Watt (4%)
Clock Speed - GPU Clock Witcher 3 ultra
472 MHz (19%)
850 MHz (33%)
Clock Speed - GPU Clock Speed Furmark
649 MHz (26%)

Average Benchmarks AMD Radeon R7 (Bristol Ridge) → 0% n=0

Average Benchmarks Intel HD Graphics 6000 → 0% n=0

- Range of benchmark values for this graphics card
red legend - Average benchmark values for this graphics card
* Smaller numbers mean a higher performance
1 This benchmark is not used for the average calculation

Game Benchmarks

The following benchmarks stem from our benchmarks of review laptops. The performance depends on the used graphics memory, clock rate, processor, system settings, drivers, and operating systems. So the results don't have to be representative for all laptops with this GPU. For detailed information on the benchmark results, click on the fps number.

low 1280x720
HD Graphics 6000:
18.4  fps
low 1280x720
HD Graphics 6000:
18.2  fps
med. 1920x1080
HD Graphics 6000:
12.9  fps
high 1920x1080
HD Graphics 6000:
11.6  fps
low 1280x720
100%
Radeon R7 (Bristol Ridge):
13.1  fps
low 1280x720
100%
Radeon R7 (Bristol Ridge):
13.8  fps
low 1280x720
100%
Radeon R7 (Bristol Ridge):
46.2  fps
139%
HD Graphics 6000:
64.2  fps
high 1920x1080
100%
Radeon R7 (Bristol Ridge):
34  fps
110%
HD Graphics 6000:
37.4 (!)  fps
Dirt 4

Dirt 4

2017
low 1280x720
100%
Radeon R7 (Bristol Ridge):
40.9  fps
101%
HD Graphics 6000:
41.3  fps
low 1280x720
100%
Radeon R7 (Bristol Ridge):
57  fps
50%
HD Graphics 6000:
28.4  fps
med. 1920x1080
100%
Radeon R7 (Bristol Ridge):
33.2  fps
high 1920x1080
100%
Radeon R7 (Bristol Ridge):
18.1  fps
low 1280x720
100%
Radeon R7 (Bristol Ridge):
11.9  fps
med. 1920x1080
100%
Radeon R7 (Bristol Ridge):
5.3  fps
For Honor

For Honor

2017
low 1280x720
100%
Radeon R7 (Bristol Ridge):
20.6  fps
med. 1920x1080
100%
Radeon R7 (Bristol Ridge):
7.1  fps
low 1280x720
100%
Radeon R7 (Bristol Ridge):
31.9 36.7 ~ 34 fps
med. 1920x1080
100%
Radeon R7 (Bristol Ridge):
12.2  fps
low 1280x720
100%
Radeon R7 (Bristol Ridge):
11  fps
med. 1366x768
100%
Radeon R7 (Bristol Ridge):
8.8  fps
low 1280x720
100%
Radeon R7 (Bristol Ridge):
34  fps
med. 1366x768
100%
Radeon R7 (Bristol Ridge):
30.3  fps
high 1920x1080
100%
Radeon R7 (Bristol Ridge):
10.5  fps
low 1280x720
100%
Radeon R7 (Bristol Ridge):
63.2  fps
92%
HD Graphics 6000:
55.3 61 ~ 58 fps
med. 1366x768
100%
Radeon R7 (Bristol Ridge):
47.5  fps
69%
HD Graphics 6000:
32.7  fps
high 1920x1080
100%
Radeon R7 (Bristol Ridge):
22  fps
86%
HD Graphics 6000:
18.9  fps
low 1280x720
100%
Radeon R7 (Bristol Ridge):
23.3  fps
med. 1366x768
100%
Radeon R7 (Bristol Ridge):
16.7  fps
high 1920x1080
100%
Radeon R7 (Bristol Ridge):
8.3  fps
low 1024x768
100%
Radeon R7 (Bristol Ridge):
30.5  fps
med. 1366x768
100%
Radeon R7 (Bristol Ridge):
14.6  fps
high 1920x1080
100%
Radeon R7 (Bristol Ridge):
7.6  fps
low 1280x720
100%
Radeon R7 (Bristol Ridge):
10 15.5 ~ 13 fps
med. 1366x768
100%
Radeon R7 (Bristol Ridge):
7 11.6 ~ 9 fps
high 1920x1080
100%
Radeon R7 (Bristol Ridge):
6.4  fps
low 1280x720
100%
Radeon R7 (Bristol Ridge):
16.9  fps
123%
HD Graphics 6000:
20.8  fps
med. 1366x768
100%
Radeon R7 (Bristol Ridge):
11.7  fps
Overwatch

Overwatch

2016
low 1280x720
HD Graphics 6000:
25  fps
low 1280x768
100%
Radeon R7 (Bristol Ridge):
8  fps
low 1280x720
100%
Radeon R7 (Bristol Ridge):
17.4  fps
med. 1366x768
100%
Radeon R7 (Bristol Ridge):
10.6  fps
low 1280x720
100%
Radeon R7 (Bristol Ridge):
15  fps
med. 1920x1080
100%
Radeon R7 (Bristol Ridge):
9  fps
high 1920x1080
100%
Radeon R7 (Bristol Ridge):
8  fps
XCOM 2

XCOM 2

2016
low 1280x720
100%
Radeon R7 (Bristol Ridge):
18.4  fps
med. 1920x1080
100%
Radeon R7 (Bristol Ridge):
6.9  fps
high 1920x1080
100%
Radeon R7 (Bristol Ridge):
4.9  fps
low 1024x768
100%
Radeon R7 (Bristol Ridge):
18 20.6 21.6 22.5 ~ 21 fps
med. 1366x768
100%
Radeon R7 (Bristol Ridge):
11 12.4 13.2 14.2 ~ 13 fps
high 1920x1080
100%
Radeon R7 (Bristol Ridge):
6.2 7 7.1 ~ 7 fps
low 1024x768
100%
Radeon R7 (Bristol Ridge):
47.1  fps
61%
HD Graphics 6000:
28.9  fps
med. 1366x768
100%
Radeon R7 (Bristol Ridge):
20.8  fps
88%
HD Graphics 6000:
18.2  fps
high 1920x1080
100%
Radeon R7 (Bristol Ridge):
14.7  fps
74%
HD Graphics 6000:
10.9  fps
ultra 1920x1080
HD Graphics 6000:
9.1  fps
low 1024x768
100%
Radeon R7 (Bristol Ridge):
16  fps
116%
HD Graphics 6000:
18.6  fps
med. 1366x768
100%
Radeon R7 (Bristol Ridge):
13.2  fps
106%
HD Graphics 6000:
14  fps
low 1024x768
100%
Radeon R7 (Bristol Ridge):
22.9  fps
med. 1366x768
100%
Radeon R7 (Bristol Ridge):
21.2  fps
high 1920x1080
100%
Radeon R7 (Bristol Ridge):
10.5  fps
low 1024x768
HD Graphics 6000:
24.6  fps
med. 1366x768
HD Graphics 6000:
16.6  fps
Anno 2205

Anno 2205

2015
low 1024x768
100%
Radeon R7 (Bristol Ridge):
26.1  fps
med. 1366x768
100%
Radeon R7 (Bristol Ridge):
14.4  fps
high 1920x1080
100%
Radeon R7 (Bristol Ridge):
6.7  fps
FIFA 16

FIFA 16

2015
low 1280x720
HD Graphics 6000:
53 (!)  fps
high 1366x768
HD Graphics 6000:
39 (!)  fps
ultra 1920x1080
HD Graphics 6000:
21.3  fps
low 1366x768
100%
Radeon R7 (Bristol Ridge):
47.1  fps
111%
HD Graphics 6000:
52.3  fps
med. 1366x768
100%
Radeon R7 (Bristol Ridge):
35.4  fps
high 1920x1080
100%
Radeon R7 (Bristol Ridge):
20.9  fps
ultra 1920x1080
HD Graphics 6000:
16  fps
low 1024x768
100%
Radeon R7 (Bristol Ridge):
45.5  fps
77%
HD Graphics 6000:
35  fps
med. 1366x768
100%
Radeon R7 (Bristol Ridge):
36.4  fps
68%
HD Graphics 6000:
24.8  fps
high 1920x1080
100%
Radeon R7 (Bristol Ridge):
14.3  fps
66%
HD Graphics 6000:
9.5  fps
Mad Max

Mad Max

2015
med. 1366x768
HD Graphics 6000:
19.3  fps
low 1280x720
100%
Radeon R7 (Bristol Ridge):
47.9  fps
114%
HD Graphics 6000:
54.7  fps
med. 1366x768
HD Graphics 6000:
33.9  fps
high 1920x1080
100%
Radeon R7 (Bristol Ridge):
16  fps
104%
HD Graphics 6000:
16.7  fps
ultra 1920x1080
100%
Radeon R7 (Bristol Ridge):
13.9  fps
111%
HD Graphics 6000:
15.4  fps
low 1280x720
100%
Radeon R7 (Bristol Ridge):
9 12 ~ 11 fps
100%
HD Graphics 6000:
11  fps
med. 1366x768
100%
Radeon R7 (Bristol Ridge):
3 11 ~ 7 fps
143%
HD Graphics 6000:
10  fps
low 1024x768
100%
Radeon R7 (Bristol Ridge):
11.9 14 ~ 13 fps
108%
HD Graphics 6000:
13.4 13.8 ~ 14 fps
med. 1366x768
100%
Radeon R7 (Bristol Ridge):
7.6 9.2 ~ 8 fps
low 1024x768
100%
Radeon R7 (Bristol Ridge):
79  fps
118%
HD Graphics 6000:
93  fps
med. 1366x768
100%
Radeon R7 (Bristol Ridge):
27.3  fps
84%
HD Graphics 6000:
22.8  fps
high 1920x1080
100%
Radeon R7 (Bristol Ridge):
15.2  fps
85%
HD Graphics 6000:
12.9  fps
GTA V

GTA V

2015
low 1024x768
100%
Radeon R7 (Bristol Ridge):
41.5  fps
med. 1366x768
100%
Radeon R7 (Bristol Ridge):
38.1  fps
high 1920x1080
100%
Radeon R7 (Bristol Ridge):
10  fps
low 1024x768
100%
Radeon R7 (Bristol Ridge):
37.7  fps
94%
HD Graphics 6000:
35.3  fps
med. 1366x768
100%
Radeon R7 (Bristol Ridge):
32.1  fps
84%
HD Graphics 6000:
26.9  fps
high 1920x1080
100%
Radeon R7 (Bristol Ridge):
12.9  fps
71%
HD Graphics 6000:
9.1  fps
Evolve

Evolve

2015
low 1024x768
HD Graphics 6000:
18.7  fps
med. 1366x768
HD Graphics 6000:
13.5  fps
low 1024x768
100%
Radeon R7 (Bristol Ridge):
29.9  fps
70%
HD Graphics 6000:
20.9  fps
med. 1366x768
100%
Radeon R7 (Bristol Ridge):
27.3  fps
62%
HD Graphics 6000:
16.8  fps
high 1920x1080
100%
Radeon R7 (Bristol Ridge):
16.7  fps
37%
HD Graphics 6000:
6.1  fps
low 1024x768
HD Graphics 6000:
0 (!)  fps
low 1024x768
100%
Radeon R7 (Bristol Ridge):
16  fps
206%
HD Graphics 6000:
33  fps
med. 1366x768
HD Graphics 6000:
17.6  fps
low 1024x768
HD Graphics 6000:
40.9  fps
med. 1366x768
HD Graphics 6000:
20.8  fps
high 1920x1080
HD Graphics 6000:
13.3  fps
ultra 1920x1080
HD Graphics 6000:
10.7  fps
F1 2014

F1 2014

2014
low 1024x768
100%
Radeon R7 (Bristol Ridge):
62  fps
89%
HD Graphics 6000:
55  fps
med. 1366x768
100%
Radeon R7 (Bristol Ridge):
41  fps
90%
HD Graphics 6000:
37  fps
high 1920x1080
100%
Radeon R7 (Bristol Ridge):
31  fps
68%
HD Graphics 6000:
21  fps
ultra 1920x1080
HD Graphics 6000:
13  fps
low 1024x768
HD Graphics 6000:
19  fps
med. 1366x768
HD Graphics 6000:
12  fps
low 1024x768
100%
Radeon R7 (Bristol Ridge):
32  fps
106%
HD Graphics 6000:
34  fps
med. 1366x768
100%
Radeon R7 (Bristol Ridge):
20  fps
132%
HD Graphics 6000:
26.4  fps
low 1280x720
100%
Radeon R7 (Bristol Ridge):
21.7  fps
med. 1344x756
100%
Radeon R7 (Bristol Ridge):
14.7  fps
Fifa 15

Fifa 15

2014
low 1280x720
HD Graphics 6000:
50  fps
high 1366x768
HD Graphics 6000:
35.7  fps
ultra 1920x1080
HD Graphics 6000:
23.3  fps
Sims 4

Sims 4

2014
low 1024x768
100%
Radeon R7 (Bristol Ridge):
122.3  fps
118%
HD Graphics 6000:
144  fps
med. 1366x768
100%
Radeon R7 (Bristol Ridge):
44.8  fps
101%
HD Graphics 6000:
45.4  fps
high 1920x1080
100%
Radeon R7 (Bristol Ridge):
23.2  fps
94%
HD Graphics 6000:
21.8  fps
ultra 1920x1080
HD Graphics 6000:
14.1  fps
low 1024x768
100%
Radeon R7 (Bristol Ridge):
91.3  fps
103%
HD Graphics 6000:
94  fps
med. 1366x768
100%
Radeon R7 (Bristol Ridge):
40.6  fps
79%
HD Graphics 6000:
32  fps
high 1920x1080
100%
Radeon R7 (Bristol Ridge):
21.6  fps
102%
HD Graphics 6000:
22  fps
ultra 1920x1080
HD Graphics 6000:
13  fps
Thief

Thief

2014
low 1024x768
100%
Radeon R7 (Bristol Ridge):
13 15.3 ~ 14 fps
129%
HD Graphics 6000:
18  fps
med. 1366x768
100%
Radeon R7 (Bristol Ridge):
10 12.6 ~ 11 fps
109%
HD Graphics 6000:
12  fps
high 1366x768
100%
Radeon R7 (Bristol Ridge):
8 12.3 ~ 10 fps
low 1024x768
HD Graphics 6000:
40  fps
med. 1366x768
HD Graphics 6000:
13  fps
high 1366x768
HD Graphics 6000:
6.9  fps
low 1024x768
100%
Radeon R7 (Bristol Ridge):
28.7 29 32.5 44.1 ~ 34 fps
94%
HD Graphics 6000:
32  fps
med. 1366x768
100%
Radeon R7 (Bristol Ridge):
20.1 20.7 22.8 29.6 ~ 23 fps
97%
HD Graphics 6000:
22.2  fps
high 1366x768
100%
Radeon R7 (Bristol Ridge):
12.6 13.7 15.2 20.4 ~ 15 fps
104%
HD Graphics 6000:
15.6  fps
ultra 1920x1080
100%
Radeon R7 (Bristol Ridge):
5.1 5.6 7.7 ~ 6 fps
93%
HD Graphics 6000:
5.6  fps
low 1024x768
100%
Radeon R7 (Bristol Ridge):
48  fps
med. 1366x768
100%
Radeon R7 (Bristol Ridge):
29  fps
high 1366x768
100%
Radeon R7 (Bristol Ridge):
15  fps
low 1024x768
HD Graphics 6000:
48  fps
med. 1366x768
HD Graphics 6000:
36  fps
high 1366x768
HD Graphics 6000:
28  fps
low 1024x768
100%
Radeon R7 (Bristol Ridge):
11  fps
209%
HD Graphics 6000:
23  fps
med. 1366x768
100%
Radeon R7 (Bristol Ridge):
11  fps
high 1366x768
100%
Radeon R7 (Bristol Ridge):
6  fps
low 1024x768
100%
Radeon R7 (Bristol Ridge):
16  fps
119%
HD Graphics 6000:
19  fps
med. 1366x768
100%
Radeon R7 (Bristol Ridge):
12  fps
131%
HD Graphics 6000:
15.7  fps
high 1366x768
HD Graphics 6000:
12  fps
ultra 1920x1080
HD Graphics 6000:
6  fps
low 1280x720
100%
Radeon R7 (Bristol Ridge):
43 45.4 46.2 46.8 60.9 62 ~ 51 fps
84%
HD Graphics 6000:
42.9 43.9 ~ 43 fps
med. 1366x768
100%
Radeon R7 (Bristol Ridge):
26 26.9 27.9 27.9 35.8 37.8 ~ 30 fps
90%
HD Graphics 6000:
26.4 26.6 ~ 27 fps
high 1366x768
100%
Radeon R7 (Bristol Ridge):
22.5 22.7 23 30.3 32.6 ~ 26 fps
85%
HD Graphics 6000:
22.1  fps
ultra 1920x1080
100%
Radeon R7 (Bristol Ridge):
7.8 7.8 10.7 10.9 ~ 9 fps
low 1024x768
100%
Radeon R7 (Bristol Ridge):
54.9 74.1 ~ 65 fps
95%
HD Graphics 6000:
60 64.7 ~ 62 fps
med. 1366x768
100%
Radeon R7 (Bristol Ridge):
29.8 36.9 ~ 33 fps
103%
HD Graphics 6000:
33 34.5 ~ 34 fps
high 1366x768
100%
Radeon R7 (Bristol Ridge):
20.9 28.1 ~ 25 fps
88%
HD Graphics 6000:
22 22.9 ~ 22 fps
ultra 1920x1080
100%
Radeon R7 (Bristol Ridge):
10.7 12.7 ~ 12 fps
Crysis 3

Crysis 3

2013
low 1024x768
HD Graphics 6000:
20.9  fps
med. 1366x768
HD Graphics 6000:
13.9  fps
low 1024x768
HD Graphics 6000:
57  fps
med. 1366x768
HD Graphics 6000:
36  fps
high 1366x768
HD Graphics 6000:
23  fps
ultra 1920x1080
HD Graphics 6000:
10  fps
low 1024x768
100%
Radeon R7 (Bristol Ridge):
70  fps
97%
HD Graphics 6000:
68  fps
med. 1366x768
100%
Radeon R7 (Bristol Ridge):
54.6  fps
71%
HD Graphics 6000:
39  fps
high 1366x768
100%
Radeon R7 (Bristol Ridge):
45.5  fps
68%
HD Graphics 6000:
31  fps
ultra 1920x1080
100%
Radeon R7 (Bristol Ridge):
41.3  fps
58%
HD Graphics 6000:
24  fps
low 1280x720
100%
Radeon R7 (Bristol Ridge):
28  fps
med. 1366x768
100%
Radeon R7 (Bristol Ridge):
19  fps
high 1366x768
100%
Radeon R7 (Bristol Ridge):
13  fps
low 1024x768
100%
Radeon R7 (Bristol Ridge):
36  fps
med. 1366x768
100%
Radeon R7 (Bristol Ridge):
29  fps
high 1366x768
100%
Radeon R7 (Bristol Ridge):
15  fps
low 1024x768
HD Graphics 6000:
118  fps
med. 1360x768
HD Graphics 6000:
43  fps
high 1360x768
HD Graphics 6000:
21  fps
ultra 1920x1080
HD Graphics 6000:
14  fps
World of Warcraft

World of Warcraft

2005
low 800x600
HD Graphics 6000:
123  fps
med. 1024x768
HD Graphics 6000:
47  fps
high 1280x1024
HD Graphics 6000:
18  fps
ultra 1920x1080
HD Graphics 6000:
10  fps

Average Gaming AMD Radeon R7 (Bristol Ridge) → 100%

Average Gaming 30-70 fps → 100%

Average Gaming Intel HD Graphics 6000 → 97%

Average Gaming 30-70 fps → 100%

AMD Radeon R7 (Bristol Ridge)Intel HD Graphics 6000Intel HD Graphics P530
lowmed.highultraQHD4Klowmed.highultraQHD4Klowmed.highultraQHD4K
Total War: Three Kingdoms18.4
X-Plane 11.1118.212.911.6
Team Fortress 246.23464.237.4
Dirt 440.941.3
Rocket League5733.218.128.4
Farming Simulator 1763.247.5225832.718.9
Mirror's Edge Catalyst16.911.720.8
Overwatch25
Rainbow Six Siege47.120.814.728.918.210.99.1
Just Cause 31613.218.614
Call of Duty: Black Ops 324.616.6
FIFA 16533921.3
World of Warships47.135.420.952.316
Metal Gear Solid V45.536.414.33524.89.5
Mad Max19.3
Dota 2 Reborn47.91613.954.733.916.715.4
Batman: Arkham Knight1171110
The Witcher 313814
Dirt Rally7927.315.29322.812.9
Battlefield Hardline37.732.112.935.326.99.1
Evolve18.713.5
Dragon Age: Inquisition29.927.316.720.916.86.1
Assassin's Creed Unity0
Call of Duty: Advanced Warfare163317.6
Civilization: Beyond Earth40.920.813.310.7
F1 201462413155372113
Ryse: Son of Rome1912
Alien: Isolation32203426.41
Fifa 155035.723.3
Sims 4122.344.823.214445.421.814.1
GRID: Autosport91.340.621.694322213
Thief1411101812
X-Plane 10.2540136.9
Battlefield 434231563222.215.65.6
Total War: Rome II483628
Company of Heroes 21111623
Metro: Last Light16121915.7126
BioShock Infinite5130269432722.08
Tomb Raider65332512623422
Crysis 320.913.9
Dirt Showdown57362310
Diablo III7054.645.541.368393124
StarCraft 2118432114
World of Warcraft123471810
AMD Radeon R7 (Bristol Ridge)Intel HD Graphics 6000Intel HD Graphics P530
lowmed.highultraQHD4Klowmed.highultraQHD4Klowmed.highultraQHD4K
< 30 fps
< 60 fps
< 120 fps
≥ 120 fps
9
11
6
1
12
11

16
3

4
1


< 30 fps
< 60 fps
< 120 fps
≥ 120 fps
17
17
6
2
21
11

21
4

15


< 30 fps
< 60 fps
< 120 fps
≥ 120 fps


For more games that might be playable and a list of all games and graphics cards visit our Gaming List

v1.35
log 17. 07:33:50

#0 ran 0s before starting gpusingle class +0s ... 0s

#1 checking url part for id 7442 +0s ... 0s

#2 checking url part for id 5943 +0s ... 0s

#3 checking url part for id 6452 +0s ... 0s

#4 redirected to Ajax server, took 1765953230s time from redirect:0 +0s ... 0s

#5 did not recreate cache, as it is less than 5 days old! Created at Tue, 16 Dec 2025 05:18:56 +0100 +0s ... 0s

#6 composed specs +0.015s ... 0.015s

#7 did output specs +0s ... 0.015s

#8 start showIntegratedCPUs +0s ... 0.015s

#9 getting avg benchmarks for device 7442 +0.027s ... 0.042s

#10 got single benchmarks 7442 +0.008s ... 0.05s

#11 getting avg benchmarks for device 5943 +0.003s ... 0.053s

#12 got single benchmarks 5943 +0.005s ... 0.058s

#13 getting avg benchmarks for device 6452 +0s ... 0.059s

#14 got single benchmarks 6452 +0s ... 0.059s

#15 got avg benchmarks for devices +0s ... 0.059s

#16 min, max, avg, median took s +0.028s ... 0.087s

#17 before gaming benchmark output +0s ... 0.087s

#18 Got 300 rows for game benchmarks. +0.007s ... 0.094s

#19 composed SQL query for gamebenchmarks +0s ... 0.094s

#20 got data and put it in $dataArray +0.003s ... 0.096s

#21 benchmarks composed for output. +0.02s ... 0.116s

#22 calculated avg scores. +0s ... 0.116s

#23 return log +0.001s ... 0.117s

Please share our article, every link counts!
Mail Logo
Google Add as a preferred
source on Google
> Expert Reviews and News on Laptops, Smartphones and Tech Innovations > Benchmarks / Tech > Graphics Card Comparison - Head 2 Head
Redaktion, 2017-09- 8 (Update: 2023-07- 1)