NVIDIA GeForce RTX 2080 Super Mobile vs NVIDIA Quadro RTX 6000 (Laptop) vs NVIDIA T1200 Laptop GPU
NVIDIA GeForce RTX 2080 Super Mobile ► remove from comparison
The NVIDIA GeForce RTX 2080 Super Mobile is the fastest mobile graphics card for laptops in early 2020. It is based on the desktop RTX 2080 Super , but most likely with reduced core speeds. According to early information it will be only slightly faster than a RTX 2080 with the same TGP setting (max. 200 Watt).
According to our information there will be various versions of the 2080 Super, six versions ranging from 150 - 200 Watt TGP and different clock speeds and three Max-Q variants from 80 - 90 Watt.
Model TGP Base Boost RTX 2080 Super 200W 1560 1740 RTX 2080 Super 190W 1530 1710 RTX 2080 Super 180W 1485 1680 RTX 2080 Super 170W 1455 1635 RTX 2080 Super 160W 1410 1605 RTX 2080 Super 150W 1365 1560 RTX 2080 Super Max-Q 90W 975 1230 RTX 2080 Super Max-Q 85W 885 1155 RTX 2080 Super Max-Q 80W 735 1080
NVIDIA manufacturers the TU104 chip on a 12 nm FinFET process and includes features like Deep Learning Super Sampling (DLSS) and Real-Time Ray Tracing (RTRT), which should combine to create more realistic lighting effects than older GPUs based on the company's Pascal architecture (if the games supports it). The RTX 2080 Super is also DisplayPort 1.4 ready, while there is also support for HDMI 2.0b, HDR, Simultaneous Multi-Projection (SMP) and H.265 video en/decoding (PlayReady 3.0).
The mobile RTX 2080 Super Mobile should perform only slightly better than the old mobile RTX 2080 . Therefore, it should be able to run all demanding games in 4k with maximum details. Raytracing features however may reduce framerates a lot.
The power consumption of the card can be set with 150 or 200 Watt TGP according to early information. Therefore, the normal Max-P variant is only suited for thick and heavy gaming laptops. A Max-Q variant for thin and light laptops is also planned (most likely at 80 - 90 Watt as the RTX 2080 Max-Q with similar performance).
NVIDIA Quadro RTX 6000 (Laptop) ► remove from comparison
The Nvidia Quadro RTX 6000 for laptops is a professional high-end graphics card for big and powerful laptops and mobile workstations. It is based on the same TU102 chip as the consumer GeForce RTX 2080 Ti . Compared to the desktop RTX 6000, the mobile variant offers lower clock speeds.
The Quadro GPUs offer certified drivers , which are optimized for stability and performance in professional applications (CAD, DCC, medical, prospection, and visualizing applications). The performance in these areas is therefore much better compared to corresponding consumer GPUs.
NVIDIA manufacturers the TU102 chip on a 12 nm FinFET process and includes features like Deep Learning Super Sampling (DLSS) and Real-Time Ray Tracing (RTRT), which should combine to create more realistic lighting effects than older GPUs based on the company's Pascal architecture (if the games support it). The Quadro RTX 6000 is also DisplayPort 1.4 ready, while there is also support for HDMI 2.0b, HDR, Simultaneous Multi-Projection (SMP) and H.265 video en/decoding (PlayReady 3.0).
Performance
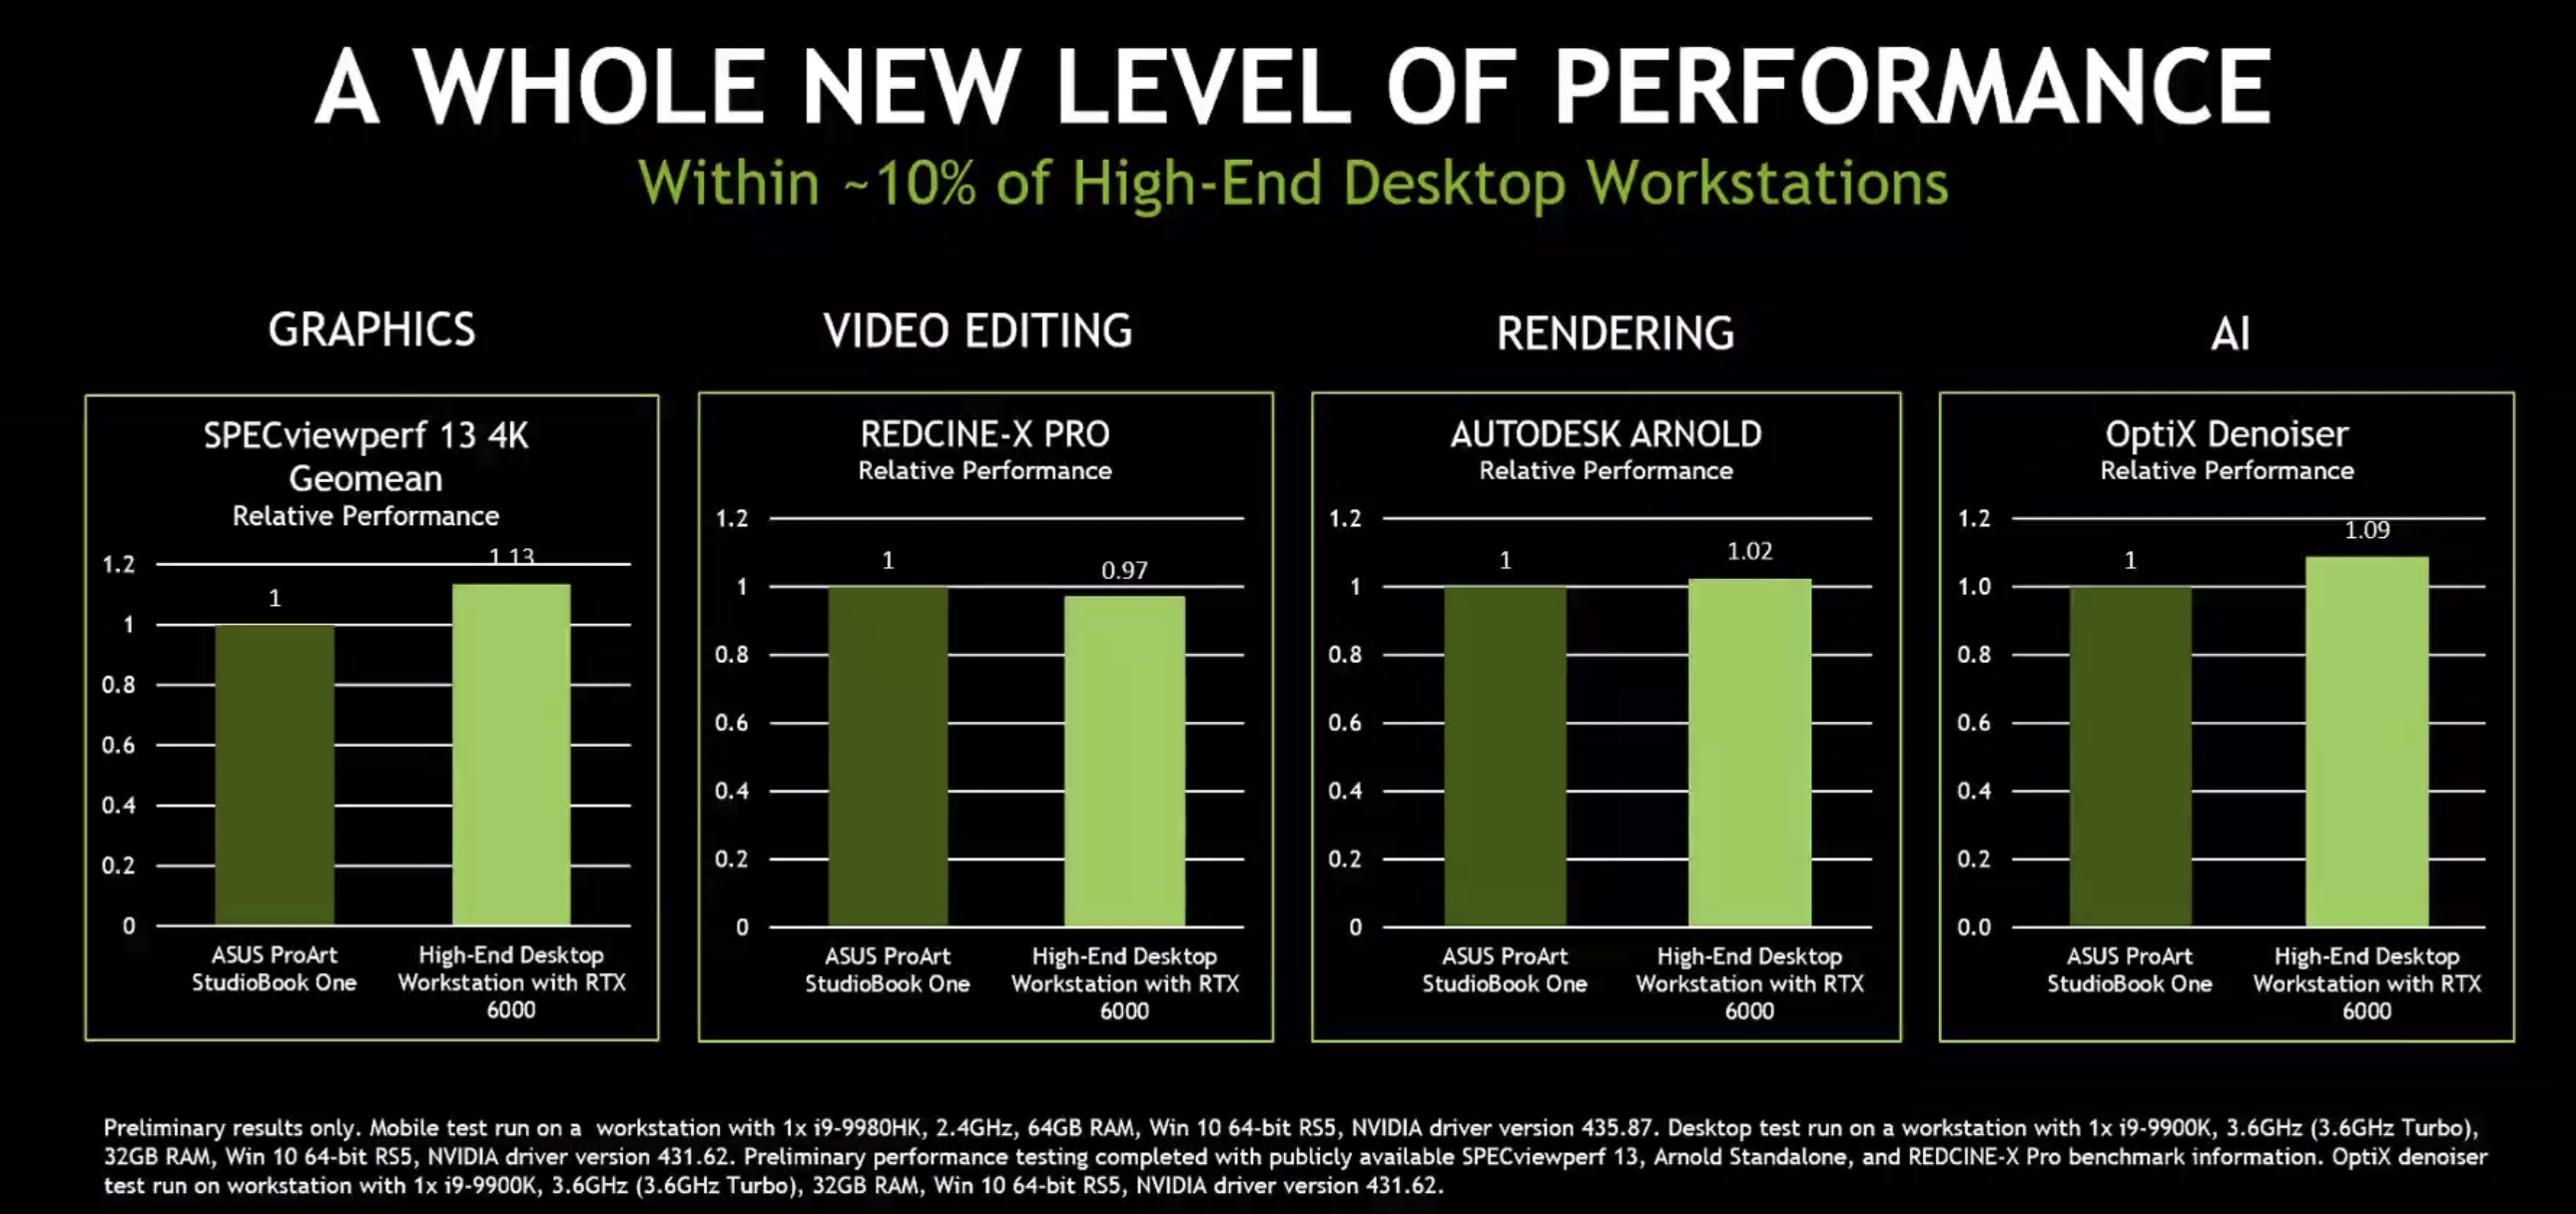
Due to the lower clock speeds, the mobile RTX 6000 lags slightly behind the desktop version with the same name. Nvidia states for example that a desktop system using the RTX 6000 is on average 13% faster in the SPECviewperf13 4k benchmark.
Due to the extremely high power consumption of 200 Watt (TDP), the mobile Quadro RTX 6000 needs an excellent cooling solution and will be used only in big laptops.
NVIDIA T1200 Laptop GPU ► remove from comparison
The Nvidia T1200 Laptop GPU (or Quadro T1200 for laptops) is a professional mobile graphics card that is based on the Turing architecture (TU117 chip). Compared to the consumer GTX 1650 Ti , the T1200 features more CUDA cores / shaders (1024 versus 896). The Quadro T2000 uses the same TU117 chip, but features all 1024 cores (2x to the T1000) and is therefore significantly faster. The chip is manufactured in 12nm FinFET at TSMC. The T1200 was introduced as a refresh to the Quadro T1000 together with the new Ampere RTX A workstation cards like the faster Nvidia RTX A2000 .
It is available in different variants from 35 - 95 Watt (TGP) with different clock speeds (and performance). The GPU supports DisplayPort 1.4 and HDMI 2.1 for external connections.
There is no more Max-Q variant (formerly used for the low power variants) but every OEM can choose to implement Max-Q 3.0 technologies (Dynamic Boost, WhisperMode).
The Turing generation did not only introduce raytracing for the RTX cards, but also optimized the architecture of the cores and caches. According to Nvidia the CUDA cores offer now a concurrent execution of floating point and integer operations for increased performance in compute-heavy workloads of modern games.
Furthermore, the caches were reworked (new unified memory architecture with twice the cache compared to Pascal). This leads to up to 50% more instructions per clock and a 40% more power efficient usage compared to Pascal. In contrary to the faster Quadro RTX cards, the T1000 and T2000 do not feature raytracing and Tensor cores.
When configured as a slow 35W variant, the T1200 is also suited for thin and light laptops.
NVIDIA GeForce RTX 2080 Super Mobile NVIDIA Quadro RTX 6000 (Laptop) NVIDIA T1200 Laptop GPU Quadro Turing Series Codename N18E-G3 TU104 TU102 Architecture Turing Turing Turing Pipelines 3072 - unified 4608 - unified 1024 - unified Core Speed 1365 - 1560 (Boost) MHz 1275 - 1455 (Boost) MHz 855 - 1425 (Boost) MHz Memory Speed 14000 MHz 14000 MHz 10000 MHz Memory Bus Width 256 Bit 384 Bit 128 Bit Memory Type GDDR6 GDDR6 GDDR6 Max. Amount of Memory 8 GB 24 GB 4 GB Shared Memory no no no API DirectX 12_1, OpenGL 4.6 DirectX 12_1, OpenGL 4.6 DirectX 12_1, OpenGL 4.6 Power Consumption 150 Watt 200 Watt 95 Watt (35 - 95 Watt TGP) Transistors 13.6 Billion 18.6 Billion technology 12 nm 12 nm 12 nm Features NVLink, DLSS, Raytraycing, VR Ready, G-SYNC, Vulkan, Multi Monitor, 650 Watt system power recommended NVLink, DLSS, Raytraycing, VR Ready, G-SYNC, Vulkan, Multi Monitor 3.7 TFLOPS SP max. performance, DisplayPort 1.4, HDMI 2.1, PCIe 4.0 x8, 192 GB/s memory bandwidth, Max-Q Technologies 3.0 optional Notebook Size large large medium sized Date of Announcement 02.04.2020 04.09.2019 12.04.2021 TMUs 64 ROPs 32 Tensor / AI Cores 64 Memory Bandwidth 192 GB/s PCIe 4.0 Displays HDMI 2.1, DisplayPort 1.4 Link to Manufacturer Page www.nvidia.com
Benchmarks 3DMark - 3DMark Time Spy Score
min: 9629 avg: 10443 median: 10465.5 (30%) max: 11211 Points
11084 Points (32%)
GPU TDP ? TDP 200 W 94% 100%
min: 3497 avg: 3775 median: 3891 (11%) max: 3937 Points
GPU TDP ? TDP 40 W TDP 60 W TDP 200 W 82% 32% 36% 100%
3DMark - 3DMark Time Spy Graphics
min: 9638 avg: 10301 median: 10313 (27%) max: 10938 Points
min: 3229 avg: 3492 median: 3595 (10%) max: 3651 Points
GPU TDP ? TDP 40 W TDP 60 W 100% 36% 40%
3DMark - 3DMark Cloud Gate Score
min: 49644 avg: 53643 median: 54828 (59%) max: 56456 Points
min: 27580 avg: 29050 median: 29050 (31%) max: 30520 Points
GPU TDP ? TDP 40 W 100% 65%
3DMark - 3DMark Cloud Gate Graphics
min: 120212 avg: 140608 median: 141486 (37%) max: 160125 Points
min: 46125 avg: 50827 median: 50827 (13%) max: 55529 Points
GPU TDP ? TDP 40 W 100% 47%
3DMark - 3DMark Fire Strike Standard Score
min: 20902 avg: 21566 median: 21377.5 (38%) max: 22606 Points
min: 8351 avg: 8972 median: 9255 (16%) max: 9310 Points
GPU TDP ? TDP 40 W TDP 60 W 100% 44% 49%
3DMark - 3DMark Fire Strike Standard Graphics
min: 24211 avg: 24932 median: 24960 (28%) max: 25597 Points
min: 9030 avg: 9810 median: 10134 (11%) max: 10266 Points
GPU TDP ? TDP 40 W TDP 60 W 100% 41% 46%
3DMark 11 - 3DM11 Performance Score
min: 27065 avg: 28873 median: 28467 (39%) max: 31493 Points
min: 11917 avg: 13347 median: 13779 (19%) max: 14344 Points
GPU TDP ? TDP 40 W TDP 60 W 100% 46% 55%
3DMark 11 - 3DM11 Performance GPU
min: 34021 avg: 35153 median: 34875.5 (30%) max: 36838 Points
min: 12142 avg: 13714 median: 14387 (12%) max: 14614 Points
GPU TDP ? TDP 40 W TDP 60 W 100% 39% 46%
3DMark Vantage + NVIDIA GeForce RTX 2080 Super Mobile 3DMark Vantage - 3DM Vant. Perf. total
69838 Points (20%)
3DM Vant. Perf. total + NVIDIA T1200 Laptop GPU
44135 Points (13%)
3DM Vant. Perf. GPU no PhysX + NVIDIA GeForce RTX 2080 Super Mobile 3DMark Vantage - 3DM Vant. Perf. GPU no PhysX
77180 Points (44%)
3DM Vant. Perf. GPU no PhysX + NVIDIA T1200 Laptop GPU
43587 Points (25%)
3DMark 06 3DMark 06 - Standard 1280x1024 + NVIDIA GeForce RTX 2080 Super Mobile
41873 Points (55%)
3DMark 06 - Standard 1280x1024 + NVIDIA T1200 Laptop GPU
38139 Points (50%)
GPU TDP ? TDP 40 W 100% 91%
SPECviewperf 13 specvp13 sw-04 + NVIDIA GeForce RTX 2080 Super Mobile SPECviewperf 13 - specvp13 sw-04
87.9 fps (24%)
specvp13 sw-04 + NVIDIA Quadro RTX 6000 (Laptop)
217 fps (58%)
GPU TDP ? TDP 200 W 41% 100%
specvp13 sw-04 + NVIDIA T1200 Laptop GPU
min: 120 avg: 126.4 median: 128.5 (34%) max: 130.7 fps
GPU TDP ? TDP 40 W TDP 60 W TDP 200 W 50% 55% 59% 100%
specvp13 showcase-02 + NVIDIA GeForce RTX 2080 Super Mobile SPECviewperf 13 - specvp13 showcase-02
110.4 fps (24%)
specvp13 showcase-02 + NVIDIA T1200 Laptop GPU
min: 45.1 avg: 47.9 median: 46.8 (10%) max: 51.8 fps
GPU TDP ? TDP 40 W TDP 60 W 100% 56% 58%
specvp13 medical-02 + NVIDIA GeForce RTX 2080 Super Mobile SPECviewperf 13 - specvp13 medical-02
60.6 fps (13%)
specvp13 medical-02 + NVIDIA T1200 Laptop GPU
min: 49.9 avg: 52.8 median: 53.6 (11%) max: 55 fps
GPU TDP ? TDP 40 W TDP 60 W 100% 86% 93%
specvp13 maya-05 + NVIDIA GeForce RTX 2080 Super Mobile SPECviewperf 13 - specvp13 maya-05
201.7 fps (23%)
specvp13 maya-05 + NVIDIA T1200 Laptop GPU
min: 120 avg: 127.2 median: 127.8 (15%) max: 133.8 fps
GPU TDP ? TDP 40 W TDP 60 W 100% 72% 76%
specvp13 energy-02 + NVIDIA GeForce RTX 2080 Super Mobile SPECviewperf 13 - specvp13 energy-02
22.3 fps (7%)
specvp13 energy-02 + NVIDIA T1200 Laptop GPU
min: 18 avg: 18.9 median: 19.3 (6%) max: 19.41 fps
GPU TDP ? TDP 40 W TDP 60 W 100% 86% 92%
specvp13 creo-02 + NVIDIA GeForce RTX 2080 Super Mobile SPECviewperf 13 - specvp13 creo-02
173.4 fps (25%)
specvp13 creo-02 + NVIDIA T1200 Laptop GPU
min: 124 avg: 131.6 median: 132.9 (19%) max: 138 fps
GPU TDP ? TDP 40 W TDP 60 W 100% 80% 85%
specvp13 catia-05 + NVIDIA GeForce RTX 2080 Super Mobile SPECviewperf 13 - specvp13 catia-05
144.9 fps (16%)
specvp13 catia-05 + NVIDIA T1200 Laptop GPU
min: 149 avg: 163.3 median: 169.4 (19%) max: 171.6 fps
GPU TDP ? TDP 40 W TDP 60 W 93% 88% 100%
specvp13 3dsmax-06 + NVIDIA GeForce RTX 2080 Super Mobile SPECviewperf 13 - specvp13 3dsmax-06
184.8 fps (32%)
specvp13 3dsmax-06 + NVIDIA Quadro RTX 6000 (Laptop)
217 fps (38%)
GPU TDP ? TDP 200 W 85% 100%
specvp13 3dsmax-06 + NVIDIA T1200 Laptop GPU
min: 94 avg: 102.3 median: 105.4 (18%) max: 107.5 fps
GPU TDP ? TDP 40 W TDP 60 W TDP 200 W 67% 43% 49% 100%
specvp13 snx-03 + NVIDIA T1200 Laptop GPU SPECviewperf 13 - specvp13 snx-03
min: 150 avg: 160.8 median: 161.3 (18%) max: 171.1 fps
GPU TDP ? TDP 40 W TDP 60 W 100% 88% 94%
SPECviewperf 2020 specvp2020 solidworks-05 1080p + NVIDIA T1200 Laptop GPU SPECviewperf 2020 - specvp2020 solidworks-05 1080p
min: 82.8 avg: 88.8 median: 91.2 (18%) max: 92.3 fps
GPU TDP ? TDP 40 W TDP 60 W 100% 90% 99%
specvp2020 snx-04 1080p + NVIDIA T1200 Laptop GPU SPECviewperf 2020 - specvp2020 snx-04 1080p
min: 151 avg: 161.4 median: 164.1 (27%) max: 169.1 fps
GPU TDP ? TDP 40 W TDP 60 W 100% 89% 97%
specvp2020 medical-03 1080p + NVIDIA T1200 Laptop GPU SPECviewperf 2020 - specvp2020 medical-03 1080p
min: 22.7 avg: 24.2 median: 24.9 (18%) max: 24.99 fps
GPU TDP ? TDP 40 W TDP 60 W 100% 91% 99%
specvp2020 maya-06 1080p + NVIDIA T1200 Laptop GPU SPECviewperf 2020 - specvp2020 maya-06 1080p
min: 133 avg: 143.1 median: 144.9 (21%) max: 151.4 fps
GPU TDP ? TDP 40 W TDP 60 W 100% 88% 96%
specvp2020 energy-03 1080p + NVIDIA T1200 Laptop GPU SPECviewperf 2020 - specvp2020 energy-03 1080p
min: 18 avg: 18.9 median: 19.3 (16%) max: 19.45 fps
GPU TDP ? TDP 40 W TDP 60 W 100% 93% 99%
specvp2020 creo-03 1080p + NVIDIA T1200 Laptop GPU SPECviewperf 2020 - specvp2020 creo-03 1080p
min: 73.4 avg: 77.4 median: 78.7 (39%) max: 80.1 fps
GPU TDP ? TDP 40 W TDP 60 W 100% 92% 98%
specvp2020 catia-06 1080p + NVIDIA T1200 Laptop GPU SPECviewperf 2020 - specvp2020 catia-06 1080p
min: 38.2 avg: 40.4 median: 41.4 (27%) max: 41.6 fps
GPU TDP ? TDP 40 W TDP 60 W 100% 92% 100%
specvp2020 3dsmax-07 1080p + NVIDIA T1200 Laptop GPU SPECviewperf 2020 - specvp2020 3dsmax-07 1080p
min: 43 avg: 47.8 median: 50.1 (23%) max: 50.2 fps
GPU TDP ? TDP 40 W TDP 60 W 100% 86% 100%
Cinebench R15 + NVIDIA GeForce RTX 2080 Super Mobile Cinebench R15 - Cinebench R15 OpenGL 64 Bit
min: 154 avg: 178 median: 166 (10%) max: 226 fps
Cinebench R15 OpenGL 64 Bit + NVIDIA T1200 Laptop GPU
min: 206 avg: 235.3 median: 216.8 (13%) max: 283 fps
GPU TDP ? TDP 40 W TDP 60 W 65% 77% 100%
Cinebench R15 OpenGL Ref. Match 64 Bit + NVIDIA GeForce RTX 2080 Super Mobile Cinebench R15 - Cinebench R15 OpenGL Ref. Match 64 Bit
99.6 % (100%)
Cinebench R15 OpenGL Ref. Match 64 Bit + NVIDIA T1200 Laptop GPU
99.6 % (100%)
GPU TDP ? TDP 60 W 100% 100%
GFXBench - GFXBench Car Chase Offscreen
412.6 fps (46%)
LuxMark v2.0 64Bit - LuxMark v2.0 Room GPU
3764 Samples/s (17%)
1199 Samples/s (5%)
LuxMark v2.0 64Bit - LuxMark v2.0 Sala GPU
8244 Samples/s (14%)
2370 Samples/s (4%)
ComputeMark v2.1 - ComputeMark v2.1 Result
17233 Points (19%)
7416 Points (8%)
Power Consumption - Furmark Stress Test Power Consumption - external Monitor *
min: 66.3 avg: 84.6 median: 92.8 (13%) max: 94.7 Watt
GPU TDP ? TDP 40 W TDP 60 W 100% 105% 100%
Power Consumption - The Witcher 3 Power Consumption - external Monitor *
min: 73.2 avg: 85.9 median: 91.9 (13%) max: 92.5 Watt
GPU TDP ? TDP 40 W TDP 60 W 100% 103% 100%
Power Consumption - Witcher 3 Power Consumption *
min: 227 avg: 274.9 median: 277.3 (61%) max: 318 Watt
min: 98.9 avg: 100.2 median: 99.6 (22%) max: 102 Watt
GPU TDP ? TDP 40 W TDP 60 W 100% 164% 166%
Power Consumption - Witcher 3 ultra Power Efficiency
min: 0.3428 avg: 0.4 median: 0.4 (35%) max: 0.4115 fps per Watt
min: 0.3255 avg: 0.4 median: 0.4 (33%) max: 0.3815 fps per Watt
GPU TDP ? TDP 40 W TDP 60 W 100% 86% 98%
Power Consumption - Witcher 3 ultra Power Efficiency - external Monitor
min: 0.3968 avg: 0.4 median: 0.4 (34%) max: 0.4536 fps per Watt
GPU TDP ? TDP 40 W TDP 60 W 91% 100% 87%
Emissions Witcher 3 Fan Noise + NVIDIA GeForce RTX 2080 Super Mobile Emissions - Witcher 3 Fan Noise
min: 50 avg: 54.4 median: 53.4 (85%) max: 60.7 dB(A)
Witcher 3 Fan Noise + NVIDIA T1200 Laptop GPU
min: 36.6 avg: 43.4 median: 46.8 (75%) max: 46.8 dB(A)
GPU TDP ? TDP 40 W TDP 60 W 100% 69% 89%
Clock Speed - GPU Clock Witcher 3 ultra
min: 1635 avg: 1725 median: 1725 (68%) max: 1815 MHz
Average Benchmarks NVIDIA GeForce RTX 2080 Super Mobile → 100% n=3 Average Benchmarks NVIDIA Quadro RTX 6000 (Laptop) → 157% n=3 Average Benchmarks NVIDIA T1200 Laptop GPU → 80% n=3
- Range of benchmark values for this graphics card
- Average benchmark values for this graphics card
* Smaller numbers mean a higher performance
1 This benchmark is not used for the average calculation
Game Benchmarks The following benchmarks stem from our benchmarks of review laptops. The performance depends on the used graphics memory, clock rate, processor, system settings, drivers, and operating systems. So the results don't have to be representative for all laptops with this GPU. For detailed information on the benchmark results, click on the fps number.
T1200 Laptop GPU:
121.8 fps
T1200 Laptop GPU:
72.9 fps
T1200 Laptop GPU:
69.9 fps
T1200 Laptop GPU:
69.5 fps
T1200 Laptop GPU:
50.7 fps
T1200 Laptop GPU:
47.3 fps
T1200 Laptop GPU:
44.6 fps
T1200 Laptop GPU:
41.2 fps
T1200 Laptop GPU:
43.1 fps
T1200 Laptop GPU:
39.3 fps
T1200 Laptop GPU:
34.2 fps
T1200 Laptop GPU:
29.6 fps
T1200 Laptop GPU:
61.7 fps
T1200 Laptop GPU:
45.7 fps
T1200 Laptop GPU:
52.9 fps
T1200 Laptop GPU:
39.5 fps
T1200 Laptop GPU:
36.8 fps
T1200 Laptop GPU:
36.1 fps
T1200 Laptop GPU:
25.7 fps
T1200 Laptop GPU:
21.2 fps
T1200 Laptop GPU:
171.9 fps
T1200 Laptop GPU:
96.6 fps
T1200 Laptop GPU:
70.1 fps
T1200 Laptop GPU:
61.2 fps
T1200 Laptop GPU:
89.5 fps
T1200 Laptop GPU:
53.6 fps
T1200 Laptop GPU:
114.3 fps
T1200 Laptop GPU:
64.3 fps
T1200 Laptop GPU:
57.9 fps
T1200 Laptop GPU:
49.8 fps
100%
GeForce RTX 2080 Super Mobile:
278 fps
100%
GeForce RTX 2080 Super Mobile:
278 fps
100%
GeForce RTX 2080 Super Mobile:
274 fps
100%
GeForce RTX 2080 Super Mobile:
238 fps
100%
GeForce RTX 2080 Super Mobile:
263 fps
100%
GeForce RTX 2080 Super Mobile:
243 fps
100%
GeForce RTX 2080 Super Mobile:
175 fps
100%
GeForce RTX 2080 Super Mobile:
105 fps
T1200 Laptop GPU:
43.4 fps
100%
GeForce RTX 2080 Super Mobile:
122 fps
32%
T1200 Laptop GPU:
39.2 fps
100%
GeForce RTX 2080 Super Mobile:
83.4 fps
100%
GeForce RTX 2080 Super Mobile:
45.2 fps
100%
GeForce RTX 2080 Super Mobile:
113 fps
100%
GeForce RTX 2080 Super Mobile:
95 fps
100%
GeForce RTX 2080 Super Mobile:
84.2 fps
100%
GeForce RTX 2080 Super Mobile:
54.4 fps
100%
GeForce RTX 2080 Super Mobile:
64.6 fps
100%
GeForce RTX 2080 Super Mobile:
47.1 fps
100%
GeForce RTX 2080 Super Mobile:
37.8 fps
100%
GeForce RTX 2080 Super Mobile:
23.8 fps
100%
GeForce RTX 2080 Super Mobile:
127 fps
39%
T1200 Laptop GPU:
50 fps
100%
GeForce RTX 2080 Super Mobile:
104 fps
41%
T1200 Laptop GPU:
43 fps
100%
GeForce RTX 2080 Super Mobile:
80 fps
40%
T1200 Laptop GPU:
32 fps
100%
GeForce RTX 2080 Super Mobile:
45 fps
100%
GeForce RTX 2080 Super Mobile:
149 fps
41%
T1200 Laptop GPU:
61 fps
100%
GeForce RTX 2080 Super Mobile:
147 fps
40%
T1200 Laptop GPU:
59 fps
100%
GeForce RTX 2080 Super Mobile:
108 fps
37%
T1200 Laptop GPU:
40 fps
100%
GeForce RTX 2080 Super Mobile:
60 fps
100%
GeForce RTX 2080 Super Mobile:
235 fps
46%
T1200 Laptop GPU:
109 fps
100%
GeForce RTX 2080 Super Mobile:
175 234 ~ 205 fps
44%
T1200 Laptop GPU:
90 fps
100%
GeForce RTX 2080 Super Mobile:
146 161 ~ 154 fps
41%
T1200 Laptop GPU:
63 fps
100%
GeForce RTX 2080 Super Mobile:
119 122 ~ 121 fps
37%
T1200 Laptop GPU:
45 fps
100%
GeForce RTX 2080 Super Mobile:
72 72.5 ~ 72 fps
100%
GeForce RTX 2080 Super Mobile:
226 fps
45%
T1200 Laptop GPU:
101 fps
100%
GeForce RTX 2080 Super Mobile:
144 154 ~ 149 fps
44%
T1200 Laptop GPU:
66 fps
100%
GeForce RTX 2080 Super Mobile:
106 125 ~ 116 fps
40%
T1200 Laptop GPU:
46 fps
100%
GeForce RTX 2080 Super Mobile:
70.3 82.1 ~ 76 fps
42%
T1200 Laptop GPU:
32 fps
100%
GeForce RTX 2080 Super Mobile:
38.4 43.2 ~ 41 fps
100%
GeForce RTX 2080 Super Mobile:
216 fps
100%
GeForce RTX 2080 Super Mobile:
193 222 ~ 208 fps
100%
GeForce RTX 2080 Super Mobile:
191 219 ~ 205 fps
100%
GeForce RTX 2080 Super Mobile:
147 176 ~ 162 fps
100%
GeForce RTX 2080 Super Mobile:
80.8 96.5 ~ 89 fps
100%
GeForce RTX 2080 Super Mobile:
151 fps
100%
GeForce RTX 2080 Super Mobile:
120 133 ~ 127 fps
100%
GeForce RTX 2080 Super Mobile:
83.1 92.4 ~ 88 fps
100%
GeForce RTX 2080 Super Mobile:
38.4 85.6 ~ 62 fps
100%
GeForce RTX 2080 Super Mobile:
121 fps
100%
GeForce RTX 2080 Super Mobile:
121 fps
100%
GeForce RTX 2080 Super Mobile:
121 fps
100%
GeForce RTX 2080 Super Mobile:
102 fps
100%
GeForce RTX 2080 Super Mobile:
49.5 fps
100%
GeForce RTX 2080 Super Mobile:
117 fps
100%
GeForce RTX 2080 Super Mobile:
79.8 fps
100%
GeForce RTX 2080 Super Mobile:
52.9 fps
100%
GeForce RTX 2080 Super Mobile:
42.5 fps
100%
GeForce RTX 2080 Super Mobile:
27.6 fps
100%
GeForce RTX 2080 Super Mobile:
121 fps
100%
GeForce RTX 2080 Super Mobile:
117 fps
100%
GeForce RTX 2080 Super Mobile:
107 fps
100%
GeForce RTX 2080 Super Mobile:
86.4 fps
100%
GeForce RTX 2080 Super Mobile:
49 fps
100%
GeForce RTX 2080 Super Mobile:
104 fps
100%
GeForce RTX 2080 Super Mobile:
91 fps
100%
GeForce RTX 2080 Super Mobile:
79.4 fps
100%
GeForce RTX 2080 Super Mobile:
75.3 fps
100%
GeForce RTX 2080 Super Mobile:
51.3 fps
100%
GeForce RTX 2080 Super Mobile:
145 fps
100%
GeForce RTX 2080 Super Mobile:
136 fps
100%
GeForce RTX 2080 Super Mobile:
115 fps
100%
GeForce RTX 2080 Super Mobile:
83.6 fps
100%
GeForce RTX 2080 Super Mobile:
48.3 fps
100%
GeForce RTX 2080 Super Mobile:
164 fps
100%
GeForce RTX 2080 Super Mobile:
120 fps
100%
GeForce RTX 2080 Super Mobile:
88.7 fps
100%
GeForce RTX 2080 Super Mobile:
72.5 fps
100%
GeForce RTX 2080 Super Mobile:
48.8 fps
100%
GeForce RTX 2080 Super Mobile:
109 fps
100%
GeForce RTX 2080 Super Mobile:
99 fps
100%
GeForce RTX 2080 Super Mobile:
74 fps
100%
GeForce RTX 2080 Super Mobile:
57 fps
100%
GeForce RTX 2080 Super Mobile:
34 fps
100%
GeForce RTX 2080 Super Mobile:
281 fps
100%
GeForce RTX 2080 Super Mobile:
267 fps
100%
GeForce RTX 2080 Super Mobile:
262 fps
100%
GeForce RTX 2080 Super Mobile:
258 fps
100%
GeForce RTX 2080 Super Mobile:
227 fps
100%
GeForce RTX 2080 Super Mobile:
131 fps
47%
T1200 Laptop GPU:
62 fps
100%
GeForce RTX 2080 Super Mobile:
98 107 ~ 103 fps
42%
T1200 Laptop GPU:
43 fps
100%
GeForce RTX 2080 Super Mobile:
88 89.8 ~ 89 fps
37%
T1200 Laptop GPU:
33 fps
100%
GeForce RTX 2080 Super Mobile:
64.6 65.4 ~ 65 fps
35%
T1200 Laptop GPU:
23 fps
100%
GeForce RTX 2080 Super Mobile:
35.2 37.1 ~ 36 fps
100%
GeForce RTX 2080 Super Mobile:
113 fps
100%
GeForce RTX 2080 Super Mobile:
87.6 fps
100%
GeForce RTX 2080 Super Mobile:
58.9 fps
100%
GeForce RTX 2080 Super Mobile:
29.8 fps
100%
GeForce RTX 2080 Super Mobile:
224 fps
100%
GeForce RTX 2080 Super Mobile:
174 fps
100%
GeForce RTX 2080 Super Mobile:
167 fps
100%
GeForce RTX 2080 Super Mobile:
130 fps
100%
GeForce RTX 2080 Super Mobile:
80 fps
100%
GeForce RTX 2080 Super Mobile:
148 fps
100%
GeForce RTX 2080 Super Mobile:
127 fps
100%
GeForce RTX 2080 Super Mobile:
127 fps
100%
GeForce RTX 2080 Super Mobile:
81.9 fps
100%
GeForce RTX 2080 Super Mobile:
40.3 fps
100%
GeForce RTX 2080 Super Mobile:
122 fps
100%
GeForce RTX 2080 Super Mobile:
91.7 fps
100%
GeForce RTX 2080 Super Mobile:
50.6 fps
100%
GeForce RTX 2080 Super Mobile:
45.3 fps
100%
GeForce RTX 2080 Super Mobile:
27.1 fps
100%
GeForce RTX 2080 Super Mobile:
147 fps
100%
GeForce RTX 2080 Super Mobile:
131 fps
100%
GeForce RTX 2080 Super Mobile:
102 fps
100%
GeForce RTX 2080 Super Mobile:
69 fps
100%
GeForce RTX 2080 Super Mobile:
36 fps
100%
GeForce RTX 2080 Super Mobile:
178 fps
100%
GeForce RTX 2080 Super Mobile:
158 fps
100%
GeForce RTX 2080 Super Mobile:
91.6 fps
100%
GeForce RTX 2080 Super Mobile:
74.1 fps
100%
GeForce RTX 2080 Super Mobile:
116 fps
100%
GeForce RTX 2080 Super Mobile:
113 fps
100%
GeForce RTX 2080 Super Mobile:
100 fps
100%
GeForce RTX 2080 Super Mobile:
90 fps
100%
GeForce RTX 2080 Super Mobile:
55 fps
100%
GeForce RTX 2080 Super Mobile:
116 fps
100%
GeForce RTX 2080 Super Mobile:
90.2 fps
100%
GeForce RTX 2080 Super Mobile:
71 fps
100%
GeForce RTX 2080 Super Mobile:
55.4 fps
100%
GeForce RTX 2080 Super Mobile:
34.9 fps
100%
GeForce RTX 2080 Super Mobile:
144 fps
100%
GeForce RTX 2080 Super Mobile:
144 fps
100%
GeForce RTX 2080 Super Mobile:
144 fps
100%
GeForce RTX 2080 Super Mobile:
131 fps
100%
GeForce RTX 2080 Super Mobile:
75.4 fps
100%
GeForce RTX 2080 Super Mobile:
157 fps
100%
GeForce RTX 2080 Super Mobile:
120 fps
100%
GeForce RTX 2080 Super Mobile:
113 fps
100%
GeForce RTX 2080 Super Mobile:
81.2 fps
100%
GeForce RTX 2080 Super Mobile:
46 fps
100%
GeForce RTX 2080 Super Mobile:
168 fps
100%
GeForce RTX 2080 Super Mobile:
143 fps
100%
GeForce RTX 2080 Super Mobile:
132 fps
100%
GeForce RTX 2080 Super Mobile:
97.2 fps
100%
GeForce RTX 2080 Super Mobile:
50.5 fps
100%
GeForce RTX 2080 Super Mobile:
169 fps
100%
GeForce RTX 2080 Super Mobile:
153 168 ~ 161 fps
100%
GeForce RTX 2080 Super Mobile:
142 152 ~ 147 fps
100%
GeForce RTX 2080 Super Mobile:
115 126 ~ 121 fps
100%
GeForce RTX 2080 Super Mobile:
68.7 76.2 ~ 72 fps
100%
GeForce RTX 2080 Super Mobile:
104 fps
100%
GeForce RTX 2080 Super Mobile:
87.8 fps
100%
GeForce RTX 2080 Super Mobile:
80 fps
100%
GeForce RTX 2080 Super Mobile:
77.7 fps
100%
GeForce RTX 2080 Super Mobile:
48.4 fps
100%
GeForce RTX 2080 Super Mobile:
98 fps
100%
GeForce RTX 2080 Super Mobile:
85 fps
100%
GeForce RTX 2080 Super Mobile:
62 fps
100%
GeForce RTX 2080 Super Mobile:
57 fps
100%
GeForce RTX 2080 Super Mobile:
38 fps
100%
GeForce RTX 2080 Super Mobile:
136 fps
43%
T1200 Laptop GPU:
59 fps
100%
GeForce RTX 2080 Super Mobile:
127 142 ~ 135 fps
36%
T1200 Laptop GPU:
48 fps
100%
GeForce RTX 2080 Super Mobile:
121 126 ~ 124 fps
31%
T1200 Laptop GPU:
39 fps
100%
GeForce RTX 2080 Super Mobile:
84 87.5 ~ 86 fps
100%
GeForce RTX 2080 Super Mobile:
45 47.1 ~ 46 fps
100%
GeForce RTX 2080 Super Mobile:
515 [X] MSI GT76 Titan DT 10SGS 1.47.22.14 D3D12
Intel Core i9-10900K 3.7GHz
GeForce RTX 2080 Super Mobile
min:
117 fps, P1:
398 fps, max:
752 fps
fps
41%
T1200 Laptop GPU:
208 218 ~ 213 fps
100%
GeForce RTX 2080 Super Mobile:
265 [X] MSI GT76 Titan DT 10SGS 1.47.22.14 D3D12
Intel Core i9-10900K 3.7GHz
GeForce RTX 2080 Super Mobile
min:
129 fps, P1:
234 fps, max:
347 fps
fps
34%
T1200 Laptop GPU:
84 94 ~ 89 fps
100%
GeForce RTX 2080 Super Mobile:
217 [X] MSI GT76 Titan DT 10SGS 1.47.22.14 D3D12
Intel Core i9-10900K 3.7GHz
GeForce RTX 2080 Super Mobile
min:
162 fps, P1:
166 fps, max:
301 fps
fps
34%
T1200 Laptop GPU:
68.5 77 ~ 73 fps
100%
GeForce RTX 2080 Super Mobile:
183 [X] MSI GT76 Titan DT 10SGS 1.47.22.14 D3D12
Intel Core i9-10900K 3.7GHz
GeForce RTX 2080 Super Mobile
min:
139 fps, P1:
143 fps, max:
244 fps
fps
34%
T1200 Laptop GPU:
59.3 67 ~ 63 fps
100%
GeForce RTX 2080 Super Mobile:
137 [X] MSI GT76 Titan DT 10SGS 1.47.22.14 D3D12
Intel Core i9-10900K 3.7GHz
GeForce RTX 2080 Super Mobile
min:
72 fps, P1:
114 fps, max:
276 fps
fps
34%
T1200 Laptop GPU:
47 fps
100%
GeForce RTX 2080 Super Mobile:
78.4 [X] MSI GT76 Titan DT 10SGS 1.47.22.14 D3D12
Intel Core i9-10900K 3.7GHz
GeForce RTX 2080 Super Mobile
min:
67.6 fps, P1:
69.9 fps, max:
120 fps
fps
100%
GeForce RTX 2080 Super Mobile:
131 fps
100%
GeForce RTX 2080 Super Mobile:
119 fps
100%
GeForce RTX 2080 Super Mobile:
102 fps
100%
GeForce RTX 2080 Super Mobile:
69.1 fps
100%
GeForce RTX 2080 Super Mobile:
36 fps
T1200 Laptop GPU:
107 110 ~ 109 fps
T1200 Laptop GPU:
60 69 ~ 65 fps
T1200 Laptop GPU:
53 64 ~ 59 fps
T1200 Laptop GPU:
51 60 ~ 56 fps
100%
GeForce RTX 2080 Super Mobile:
123 128 138 145 ~ 134 fps
100%
GeForce RTX 2080 Super Mobile:
105 114 122 127 ~ 117 fps
100%
GeForce RTX 2080 Super Mobile:
84.2 88.2 ~ 86 fps
61%
T1200 Laptop GPU:
52.4 fps
100%
GeForce RTX 2080 Super Mobile:
144 fps
100%
GeForce RTX 2080 Super Mobile:
107 fps
100%
GeForce RTX 2080 Super Mobile:
75.3 fps
100%
GeForce RTX 2080 Super Mobile:
56.1 fps
100%
GeForce RTX 2080 Super Mobile:
33.1 fps
100%
GeForce RTX 2080 Super Mobile:
193 196 ~ 195 fps
50%
T1200 Laptop GPU:
88 102 103 ~ 98 fps
100%
GeForce RTX 2080 Super Mobile:
124 134 140 ~ 133 fps
100%
GeForce RTX 2080 Super Mobile:
95.7 103 107 ~ 102 fps
36%
T1200 Laptop GPU:
35 37 39 ~ 37 fps
100%
GeForce RTX 2080 Super Mobile:
80.2 fps
32%
T1200 Laptop GPU:
26 26.6 ~ 26 fps
100%
GeForce RTX 2080 Super Mobile:
42 47 ~ 45 fps
100%
GeForce RTX 2080 Super Mobile:
178 fps
100%
GeForce RTX 2080 Super Mobile:
171 fps
100%
GeForce RTX 2080 Super Mobile:
136 fps
100%
GeForce RTX 2080 Super Mobile:
104 fps
100%
GeForce RTX 2080 Super Mobile:
52 fps
100%
GeForce RTX 2080 Super Mobile:
150 168 179 190 ~ 172 fps
100%
GeForce RTX 2080 Super Mobile:
140 154 163 172 ~ 157 fps
100%
GeForce RTX 2080 Super Mobile:
134 148 158 167 ~ 152 fps
100%
GeForce RTX 2080 Super Mobile:
127 134 148 156 ~ 141 fps
100%
GeForce RTX 2080 Super Mobile:
136 145 ~ 141 fps
77%
T1200 Laptop GPU:
109 fps
100%
GeForce RTX 2080 Super Mobile:
389.7 471.7 ~ 431 fps
46%
T1200 Laptop GPU:
195 198 ~ 197 fps
100%
GeForce RTX 2080 Super Mobile:
274.2 280 332 ~ 295 fps
43%
T1200 Laptop GPU:
125 127 ~ 126 fps
34%
T1200 Laptop GPU:
59 71 72 ~ 67 fps
100%
GeForce RTX 2080 Super Mobile:
185 185 187 ~ 186 fps
90%
T1200 Laptop GPU:
166 169.9 ~ 168 fps
100%
GeForce RTX 2080 Super Mobile:
178 182 183 ~ 181 fps
86%
T1200 Laptop GPU:
152 158.5 ~ 155 fps
100%
GeForce RTX 2080 Super Mobile:
164 176 179 ~ 173 fps
100%
GeForce RTX 2080 Super Mobile:
92.8 101 ~ 97 fps
100%
GeForce RTX 2080 Super Mobile:
90.2 fps
41%
T1200 Laptop GPU:
37.4 fps
100%
GeForce RTX 2080 Super Mobile:
96 98.9 ~ 97 fps
T1200 Laptop GPU:
352.2 fps
T1200 Laptop GPU:
235.8 fps
T1200 Laptop GPU:
207.9 fps
T1200 Laptop GPU:
88.1 fps
Average Gaming NVIDIA GeForce RTX 2080 Super Mobile → 100% Average Gaming 30-70 fps → 100%
Average Gaming NVIDIA T1200 Laptop GPU → 49% Average Gaming 30-70 fps → 41%
 Deutsch
 English
 Español
 Français
 Italiano
 Nederlands
 Polski
 Português
 Русский
 Türkçe
 Svenska
 Chinese
 Magyar