Notebookcheck Logo

NVIDIA RTX A4000 Laptop GPU vs NVIDIA GeForce RTX 2070 Super Max-Q vs NVIDIA RTX A3000 Laptop GPU

NVIDIA RTX A4000 Laptop GPU

► remove from comparison NVIDIA RTX A4000 Laptop GPU

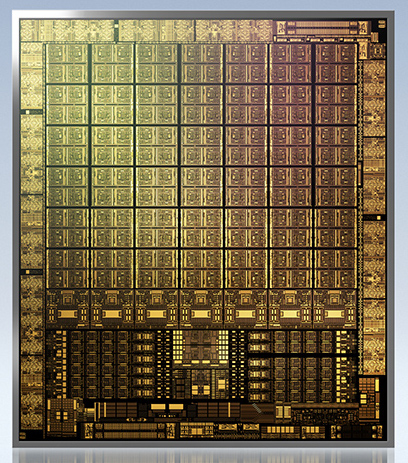
The NVIDIA RTX A4000 Laptop GPU or A4000 Mobile is a professional graphics card for mobile workstations. It is based on the GA104 Ampere chip and similar to the consumer GeForce RTX 3080 Laptop GPU. It offers the same 5.120 graphics cores, 40 RT cores, 160 Tensor cores and 8 GB GDDR6 graphics memory with a 256 Bit memory bus. It supports PCIe 4.0 and will be available in different variants from 80 - 140 Watt (TGP) with different clock speeds (and performance). The GPU supports eDP 1.4b to connect the internal monitor and DisplayPort 1.4 and HDMI 2.1 for external connections.

There is no more Max-Q variant (formerly used for the low power variants) but every OEM can choose to implement Max-Q technologies (Dynamic Boost, WhisperMode).

The raw performance should be similar to the GeForce RTX 3070 for laptops at the same TGP level. Both GPUs depend heavily on good cooling and a high TGP for good performance. At a similar power consumption level the RTX A4000 should be clearly faster than the old Quadro RTX 4000 and 4000 Max-Q. The desktop variant of the A4000 however, is a lot faster.

The GA104 chip offers 6,144 FP32 ALUs of which half can also execute INT32 instructions (i.e. 3,072 INT32 ALUs). With Turing all shaders could still execute FP32 or INT32 instructions. The raytracing and tensor cores on the chip were also improved according to Nvidia. The A4000 only uses 5,120 of the 6,144 CUDA cores. The Ampere chips also include an improved 5th generation video encoder (NVENC for H.264 and H.265) and a 7th generation decoder (for various formats now including AV1).

The GA104 chip is manufactured by Samsung in 8nm (8N), which is not quite able to keep up with the 7nm node at TSMC (e.g. used by AMD and also for the professional GA100 Ampere chip).

NVIDIA GeForce RTX 2070 Super Max-Q

► remove from comparison NVIDIA GeForce RTX 2070 Super Max-Q

The NVIDIA GeForce RTX 2070 Super with Max-Q design is the power saving variant of the mobile GeForce RTX 2070 Super with reduced clock speeds, performance and of course power consumption. It is intended for thin gaming laptops. It is based on the same TU104-725-A1 chip with 2,560 shaders, 8 GB GDDR6 memory and a 256 Bit memory bus. Currently we know of three variants with a TGP of 80, 85 and 90 Watt, base clock speeds of 930, 1005, and 1080 MHz, and turbo clock speeds of 1155, 1230 and 1290 MHz. The mobile variant for comparison is rated at 115 W and 1140 - 1380 MHz.

With the refresh, Nvidia also reworked the Max-Q technologies for more efficiency. Low Voltage GDDR6 (lower clocked but more headroom for the GPU) and improved regulator efficiency should improve the performance per Watt. Two new optional features can also be implemented by the OEM. Max-Q Dynamic Boost is able to shift power from the CPU to the GPU on a per frame basis to increase overall performance. Furthermore, the laptop manufacturer can also implement Advanced Optimus with a dynamic display switch (hardware) to enable Optimus, G-SYNC and high refresh rate displays (up to 4K 120 Hz).

Features

NVIDIA manufacturers the TU104 chip on a 12 nm FinFET process and includes features like Deep Learning Super Sampling (DLSS) and Real-Time Ray Tracing (RTRT), which should combine to create more realistic lighting effects than older GPUs based on the company's Pascal architecture (if the games supports it). The RTX 2070 Super Max-Q is also DisplayPort 1.4 ready, while there is also support for HDMI 2.0b, HDR, Simultaneous Multi-Projection (SMP) and H.265 video en/decoding (PlayReady 3.0).

Performance

Due to the lower clock rates, the Max-Q variant is clearly slower than the mobile RTX 2070 Super. The difference depends on the used variant, where the 90 W version is only slightly slower. Therefore, the performance should be sufficient for maximum detail settings at a QHD resolution. With raytracing enabled, you may have to reduce settings or resolution. Less demanding games can be easily played in 4k.

The power consumption of the card is between 80 - 90 Watt TGP and therefore clearly lower than the RTX 2070 Super Mobile (115 Watt).

NVIDIA RTX A3000 Laptop GPU

► remove from comparison NVIDIA RTX A3000 Laptop GPU

The NVIDIA RTX A3000 Laptop GPU or A3000 Mobile is a professional graphics card for mobile workstations. It is based on the GA104 Ampere chip and offers a similar performance to the consumer GeForce RTX 3060 Laptop GPU. However, it offers 256 more CUDA cores (4,096 versus 3,840) and is based on the bigger GA104 chip. The A3000 also supports PCIe 4.0 and integrates 32 RT-cores and 128 Tensor cores of the Ampere generation. It is available in different variants from 60 - 130 Watt (TGP) with different clock speeds (and performance). The GPU supports eDP 1.4b to connect the internal monitor and DisplayPort 1.4 and HDMI 2.1 for external connections.

In 2022 Nvidia released a slightly improved version of the RTX A3000 with more and faster graphics memory. The original 6 GB with 11 Gbits has been doubled to 12 GB GDDR6 clocked at 14 Gbits.

There is no more Max-Q variant (formerly used for the low power variants) but every OEM can choose to implement Max-Q technologies (Dynamic Boost, WhisperMode).

The raw performance should be similar to the GeForce RTX 3060 for laptops at the same TGP level. Both GPUs depend heavily on good cooling and a high TGP for good performance. At a similar power consumption level the RTX A3000 should be clearly faster than the old Quadro RTX 3000 and 3000 Max-Q

The GA104 chip offers 6,144 FP32 ALUs of which half can also execute INT32 instructions (i.e. 3,072 INT32 ALUs). With Turing all shaders could still execute FP32 or INT32 instructions. The raytracing and tensor cores on the chip were also improved according to Nvidia. The A3000 only uses 4,096 of the 6,144 CUDA cores. The Ampere chips also include an improved 5th generation video encoder (NVENC for H.264 and H.265) and a 7th generation decoder (for various formats now including AV1).

The GA104 chip is manufactured by Samsung in 8nm (8N), which is not quite able to keep up with the 7nm node at TSMC (e.g. used by AMD and also for the professional GA100 Ampere chip).

NVIDIA RTX A4000 Laptop GPUNVIDIA GeForce RTX 2070 Super Max-QNVIDIA RTX A3000 Laptop GPU
RTX A Series
RTX A5500 Laptop GPU 7424 256 Bit @ 16000 MHz
RTX A4500 Laptop GPU 5888 @ 0.93 - 1.5 GHz256 Bit @ 16000 MHz
RTX A5000 Laptop GPU 6144 @ 1.22 - 1.77 GHz256 Bit @ 14000 MHz
RTX A4000 Laptop GPU 5120 @ 0.78 - 1.68 GHz256 Bit @ 12000 MHz
RTX A3000 Laptop GPU 4096 @ 1.08 - 1.56 GHz192 Bit @ 14000 MHz
RTX A2000 3328 @ 0.56 - 1.2 GHz192 Bit @ 12000 MHz
RTX A2000 Laptop GPU 2560 @ 0.89 - 1.69 GHz128 Bit @ 14000 MHz
RTX A1000 Laptop GPU 2048 128 Bit @ 14000 MHz
RTX A500 Laptop GPU 2048 64 Bit @ 14000 MHz
NVIDIA Titan RTX 4608 @ 1.35 - 1.77 GHz384 Bit @ 14000 MHz
GeForce RTX 2080 Ti (Desktop) 4352 @ 1.35 - 1.55 GHz352 Bit @ 14000 MHz
GeForce RTX 2080 Super (Desktop) 3072 @ 1.65 - 1.82 GHz256 Bit @ 15500 MHz
GeForce RTX 2080 (Desktop) 2944 @ 1.52 - 1.71 GHz256 Bit @ 14000 MHz
GeForce RTX 2080 Super Mobile 3072 @ 1.37 - 1.56 GHz256 Bit @ 14000 MHz
GeForce RTX 2080 Mobile 2944 @ 1.38 - 1.59 GHz256 Bit @ 14000 MHz
GeForce RTX 2070 Super (Desktop) 2560 @ 1.61 - 1.77 GHz256 Bit @ 14000 MHz
GeForce RTX 2070 (Desktop) 2304 @ 1.41 - 1.62 GHz256 Bit @ 14000 MHz
GeForce RTX 2070 Super Mobile 2560 @ 1.14 - 1.38 GHz256 Bit @ 14002 MHz
GeForce RTX 2080 Super Max-Q 3072 @ 0.98 - 1.23 GHz256 Bit @ 11000 MHz
GeForce RTX 2060 Super (Desktop) 2176 @ 1.47 - 1.65 GHz256 Bit @ 14000 MHz
GeForce RTX 2070 Mobile 2304 @ 1.22 - 1.44 GHz256 Bit @ 14000 MHz
GeForce RTX 2080 Max-Q 2944 @ 0.74 - 1.1 GHz256 Bit @ 12000 MHz
GeForce RTX 2060 (Desktop) 1920 @ 1.32 - 1.62 GHz192 Bit @ 14000 MHz
GeForce RTX 2070 Super Max-Q 2560 @ 0.93 - 1.16 GHz256 Bit @ 11000 MHz
GeForce RTX 2070 Max-Q 2304 @ 0.89 - 1.19 GHz256 Bit @ 12000 MHz
GeForce RTX 2060 Mobile 1920 @ 0.96 - 1.2 GHz192 Bit @ 14000 MHz
GeForce RTX 2060 Max-Q 1920 @ 0.98 - 1.19 GHz192 Bit @ 11000 MHz
GeForce RTX 2050 Mobile 2048 @ 1.48 GHz64 Bit @ 14000 MHz
RTX A5500 Laptop GPU 7424 256 Bit @ 16000 MHz
RTX A4500 Laptop GPU 5888 @ 0.93 - 1.5 GHz256 Bit @ 16000 MHz
RTX A5000 Laptop GPU 6144 @ 1.22 - 1.77 GHz256 Bit @ 14000 MHz
RTX A4000 Laptop GPU 5120 @ 0.78 - 1.68 GHz256 Bit @ 12000 MHz
RTX A3000 Laptop GPU 4096 @ 1.08 - 1.56 GHz192 Bit @ 14000 MHz
RTX A2000 3328 @ 0.56 - 1.2 GHz192 Bit @ 12000 MHz
RTX A2000 Laptop GPU 2560 @ 0.89 - 1.69 GHz128 Bit @ 14000 MHz
RTX A1000 Laptop GPU 2048 128 Bit @ 14000 MHz
RTX A500 Laptop GPU 2048 64 Bit @ 14000 MHz
CodenameGA104N18E-G2RGA104
ArchitectureAmpereTuringAmpere
Pipelines5120 - unified2560 - unified4096 - unified
TMUs160128
ROPs8064
Raytracing Cores4032
Tensor / AI Cores160128
Core Speed780 - 1680 (Boost) MHz930 - 1155 (Boost) MHz1080 - 1560 (Boost) MHz
Theoretical Performance17.8 TFLOPS FP32
CacheL2: 4 MB
Memory Speed12000 effective = 1500 MHz11000 MHz14000 effective = 1750 MHz
Memory Bus Width256 Bit256 Bit192 Bit
Memory TypeGDDR6GDDR6GDDR6
Max. Amount of Memory8 GB8 GB12 GB
Shared Memorynonono
Memory Bandwidth384 GB/s264 GB/s
APIDirectX 12_2, Shader 6.7, OpenGL 4.6DirectX 12_1, OpenGL 4.6DirectX 12_2, Shader 6.7, OpenGL 4.6
Power Consumption140 Watt (80 - 125 Watt TGP)80 Watt130 Watt (60 - 115 Watt TGP)
technology8 nm12 nm8 nm
PCIe4.04.0
DisplaysHDMI 2.1, DisplayPort 1.4HDMI 2.1, DisplayPort 1.4
FeaturesDisplayPort 1.4, HDMI 2.1, PCIe 4.0 x16, 17.8 SP-FP TFLOPS Peak, 143 Tensor Performance Peak, up to 384 GB/s Memory Bandwidth, Resizable BAR, Support for Modern StandbyDLSS, Raytraycing, VR Ready, G-SYNC, Vulkan, Multi Monitor, 550 Watt system power recommendedDisplayPort 1.4, HDMI 2.1, PCIe 4.0 x16, 12.8 SP-FP TFLOPS Peak, 102 Tensor Performance Peak, up to 264 GB/s Memory Bandwidth, Resizable BAR, Support for Modern Standby
Notebook Sizelargelargelarge
Date of Announcement12.04.2021 02.04.2020 12.04.2021
Link to Manufacturer Pagewww.nvidia.comwww.nvidia.com
Transistors17.4 Billion
Die Size 392 mm²

Benchmarks

Performance Rating - 3DMark 11 + Fire Strike + Time Spy - GeForce RTX 2070 Super Max-Q
7.8 pt (23%)
Restrict / Search: Model: Max. age: years
3DMark - 3DMark Time Spy Score
min: 7199     avg: 7605     median: 7611.5 (20%)     max: 8066 Points
min: 6490     avg: 7324     median: 7703 (20%)     max: 7779 Points
3DMark - 3DMark Time Spy Graphics
min: 7084     avg: 7445     median: 7373.5 (15%)     max: 7891 Points
min: 6530     avg: 7129     median: 7320 (15%)     max: 7536 Points
3DMark - 3DMark Ice Storm Unlimited Graphics
min: 461097     avg: 461649     median: 461648 (47%)     max: 462200 Points
3DMark - 3DMark Cloud Gate Score
min: 38593     avg: 45672     median: 47119 (45%)     max: 49917 Points
24449 Points (23%)
3DMark - 3DMark Cloud Gate Graphics
min: 65295     avg: 117307     median: 126747 (31%)     max: 134954 Points
29996 Points (7%)
3DMark - 3DMark Fire Strike Standard Score
min: 16736     avg: 18097     median: 18395 (28%)     max: 18947 Points
min: 15711     avg: 17366     median: 18097 (27%)     max: 18291 Points
3DMark - 3DMark Fire Strike Standard Graphics
min: 18559     avg: 20277     median: 20872.5 (19%)     max: 21446 Points
min: 17034     avg: 19054     median: 19710 (18%)     max: 20417 Points
3DMark - 3DMark Ice Storm Graphics
66977 Points (7%)
3DMark - 3DMark Wild Life Unlimited
48041 Points (24%)
3DMark - 3DMark Wild Life Extreme Unlimited
14526 Points (17%)
3DMark 11 - 3DM11 Performance Score
min: 20666     avg: 23000     median: 23755.5 (29%)     max: 24383 Points
min: 20760     avg: 23171     median: 23888 (29%)     max: 24865 Points
3DMark 11 - 3DM11 Performance GPU
min: 24244     avg: 27104     median: 27724 (21%)     max: 28900 Points
min: 23699     avg: 25737     median: 25990 (20%)     max: 27523 Points
3DMark Vantage
3DM Vant. Perf. total + NVIDIA GeForce RTX 2070 Super Max-Q
3DMark Vantage - 3DM Vant. Perf. total
65101 Points (19%)
3DM Vant. Perf. total + NVIDIA RTX A3000 Laptop GPU
71308 Points (21%)
3DM Vant. Perf. GPU no PhysX + NVIDIA GeForce RTX 2070 Super Max-Q
3DMark Vantage - 3DM Vant. Perf. GPU no PhysX
69136 Points (38%)
3DM Vant. Perf. GPU no PhysX + NVIDIA RTX A3000 Laptop GPU
76250 Points (42%)
3DMark 06 3DMark 06 - Standard 1280x1024 + NVIDIA GeForce RTX 2070 Super Max-Q
3DMark 06
43406 Points (57%)
Blender - Blender 3.3 Classroom CUDA *
60 Seconds (9%)
Blender - Blender 3.3 Classroom OPTIX *
34 Seconds (13%)
SPECviewperf 13 specvp13 sw-04 + NVIDIA GeForce RTX 2070 Super Max-Q
SPECviewperf 13 - specvp13 sw-04
min: 80.2     avg: 85.8     median: 85.8 (23%)     max: 91.3 fps
specvp13 sw-04 + NVIDIA RTX A3000 Laptop GPU
min: 149.8     avg: 152.7     median: 151.6 (41%)     max: 156.7 fps
specvp13 snx-03 + NVIDIA GeForce RTX 2070 Super Max-Q
SPECviewperf 13 - specvp13 snx-03
min: 19.65     avg: 19.9     median: 19.9 (2%)     max: 20.06 fps
specvp13 snx-03 + NVIDIA RTX A3000 Laptop GPU
min: 232.9     avg: 254.1     median: 250.2 (28%)     max: 279.21 fps
specvp13 showcase-02 + NVIDIA GeForce RTX 2070 Super Max-Q
SPECviewperf 13 - specvp13 showcase-02
min: 94.1     avg: 95.6     median: 95.6 (16%)     max: 97 fps
specvp13 showcase-02 + NVIDIA RTX A3000 Laptop GPU
min: 84.1     avg: 91.3     median: 89.9 (15%)     max: 99.91 fps
specvp13 medical-02 + NVIDIA GeForce RTX 2070 Super Max-Q
SPECviewperf 13 - specvp13 medical-02
min: 48.6     avg: 50.6     median: 50.6 (9%)     max: 52.6 fps
specvp13 medical-02 + NVIDIA RTX A3000 Laptop GPU
min: 89.2     avg: 95.6     median: 94.8 (16%)     max: 102.82 fps
specvp13 maya-05 + NVIDIA GeForce RTX 2070 Super Max-Q
SPECviewperf 13 - specvp13 maya-05
min: 199.7     avg: 210.6     median: 210.6 (24%)     max: 221.5 fps
specvp13 maya-05 + NVIDIA RTX A3000 Laptop GPU
min: 194.8     avg: 211.5     median: 211.4 (24%)     max: 228.37 fps
specvp13 energy-02 + NVIDIA GeForce RTX 2070 Super Max-Q
SPECviewperf 13 - specvp13 energy-02
min: 18.47     avg: 18.7     median: 18.7 (6%)     max: 18.95 fps
specvp13 energy-02 + NVIDIA RTX A3000 Laptop GPU
min: 41.21     avg: 43.5     median: 44.1 (14%)     max: 45.12 fps
specvp13 creo-02 + NVIDIA GeForce RTX 2070 Super Max-Q
SPECviewperf 13 - specvp13 creo-02
min: 160.4     avg: 166.2     median: 166.2 (24%)     max: 172 fps
specvp13 creo-02 + NVIDIA RTX A3000 Laptop GPU
min: 186.9     avg: 210.7     median: 209.6 (31%)     max: 235.49 fps
specvp13 catia-05 + NVIDIA GeForce RTX 2070 Super Max-Q
SPECviewperf 13 - specvp13 catia-05
min: 124.3     avg: 126.6     median: 126.6 (14%)     max: 128.9 fps
specvp13 catia-05 + NVIDIA RTX A3000 Laptop GPU
min: 231.4     avg: 246.7     median: 252.3 (28%)     max: 256.5 fps
specvp13 3dsmax-06 + NVIDIA GeForce RTX 2070 Super Max-Q
SPECviewperf 13 - specvp13 3dsmax-06
min: 171.5     avg: 176.4     median: 176.4 (28%)     max: 181.2 fps
specvp13 3dsmax-06 + NVIDIA RTX A3000 Laptop GPU
min: 145.9     avg: 168.6     median: 179 (28%)     max: 181.04 fps
SPECviewperf 2020 specvp2020 solidworks-05 1080p + NVIDIA GeForce RTX 2070 Super Max-Q
SPECviewperf 2020 - specvp2020 solidworks-05 1080p
152.8 fps (30%)
specvp2020 solidworks-05 1080p + NVIDIA RTX A3000 Laptop GPU
min: 147.4     avg: 155.1     median: 147.9 (29%)     max: 170.08 fps
specvp2020 snx-04 1080p + NVIDIA GeForce RTX 2070 Super Max-Q
SPECviewperf 2020 - specvp2020 snx-04 1080p
19.5 fps (2%)
specvp2020 snx-04 1080p + NVIDIA RTX A3000 Laptop GPU
min: 232.4     avg: 255.6     median: 249.8 (31%)     max: 284.49 fps
specvp2020 medical-03 1080p + NVIDIA GeForce RTX 2070 Super Max-Q
SPECviewperf 2020 - specvp2020 medical-03 1080p
24 fps (7%)
specvp2020 medical-03 1080p + NVIDIA RTX A3000 Laptop GPU
min: 42.66     avg: 44.6     median: 44.4 (12%)     max: 46.59 fps
specvp2020 maya-06 1080p + NVIDIA GeForce RTX 2070 Super Max-Q
SPECviewperf 2020 - specvp2020 maya-06 1080p
221.6 fps (24%)
specvp2020 maya-06 1080p + NVIDIA RTX A3000 Laptop GPU
min: 207     avg: 243.4     median: 236.8 (25%)     max: 286.54 fps
specvp2020 energy-03 1080p + NVIDIA GeForce RTX 2070 Super Max-Q
SPECviewperf 2020 - specvp2020 energy-03 1080p
19.2 fps (3%)
specvp2020 energy-03 1080p + NVIDIA RTX A3000 Laptop GPU
min: 43.06     avg: 44.3     median: 44.7 (7%)     max: 45.04 fps
specvp2020 creo-03 1080p + NVIDIA GeForce RTX 2070 Super Max-Q
SPECviewperf 2020 - specvp2020 creo-03 1080p
76.8 fps (26%)
specvp2020 creo-03 1080p + NVIDIA RTX A3000 Laptop GPU
min: 101.07     avg: 115.1     median: 119.7 (41%)     max: 124.5 fps
specvp2020 catia-06 1080p + NVIDIA GeForce RTX 2070 Super Max-Q
SPECviewperf 2020 - specvp2020 catia-06 1080p
49 fps (24%)
specvp2020 catia-06 1080p + NVIDIA RTX A3000 Laptop GPU
min: 73.7     avg: 78.2     median: 80.3 (39%)     max: 80.5 fps
specvp2020 3dsmax-07 1080p + NVIDIA GeForce RTX 2070 Super Max-Q
SPECviewperf 2020 - specvp2020 3dsmax-07 1080p
86.4 fps (23%)
specvp2020 3dsmax-07 1080p + NVIDIA RTX A3000 Laptop GPU
min: 69.7     avg: 83.6     median: 78.2 (21%)     max: 103.02 fps
specvp2020 solidworks-05 4k + NVIDIA RTX A3000 Laptop GPU
SPECviewperf 2020 - specvp2020 solidworks-05 4k
61.2 fps (15%)
specvp2020 snx-04 4k + NVIDIA RTX A3000 Laptop GPU
SPECviewperf 2020 - specvp2020 snx-04 4k
130.3 fps (13%)
specvp2020 medical-03 4k + NVIDIA RTX A3000 Laptop GPU
SPECviewperf 2020 - specvp2020 medical-03 4k
14.7 fps (9%)
specvp2020 maya-06 4k + NVIDIA RTX A3000 Laptop GPU
SPECviewperf 2020 - specvp2020 maya-06 4k
103.6 fps (15%)
specvp2020 energy-03 4k + NVIDIA RTX A3000 Laptop GPU
SPECviewperf 2020 - specvp2020 energy-03 4k
112 fps (16%)
specvp2020 creo-03 4k + NVIDIA RTX A3000 Laptop GPU
SPECviewperf 2020 - specvp2020 creo-03 4k
73.3 fps (33%)
specvp2020 catia-06 4k + NVIDIA RTX A3000 Laptop GPU
SPECviewperf 2020 - specvp2020 catia-06 4k
43.2 fps (28%)
specvp2020 3dsmax-07 4k + NVIDIA RTX A3000 Laptop GPU
SPECviewperf 2020 - specvp2020 3dsmax-07 4k
49.7 fps (17%)
Cinebench R10 Cinebench R10 Shading (32bit) + NVIDIA GeForce RTX 2070 Super Max-Q
Cinebench R10 - Cinebench R10 Shading (32bit)
6835 Points (5%)
Cinebench R11.5 Cinebench R11.5 OpenGL 64 Bit + NVIDIA GeForce RTX 2070 Super Max-Q
Cinebench R11.5 - Cinebench R11.5 OpenGL 64 Bit
88.5 fps (29%)
Cinebench R15
Cinebench R15 OpenGL 64 Bit + NVIDIA GeForce RTX 2070 Super Max-Q
Cinebench R15 - Cinebench R15 OpenGL 64 Bit
min: 129     avg: 139.5     median: 138 (8%)     max: 157 fps
Cinebench R15 OpenGL 64 Bit + NVIDIA RTX A3000 Laptop GPU
min: 135.8     avg: 240.9     median: 290 (17%)     max: 297 fps
Cinebench R15 OpenGL Ref. Match 64 Bit + NVIDIA GeForce RTX 2070 Super Max-Q
Cinebench R15 - Cinebench R15 OpenGL Ref. Match 64 Bit
99.6 % (100%)
Cinebench R15 OpenGL Ref. Match 64 Bit + NVIDIA RTX A3000 Laptop GPU
min: 97.8     avg: 99     median: 99.6 (100%)     max: 99.6 %
GFXBench - GFXBench 5.0 Aztec Ruins High Tier Offscreen
161.4 fps (29%)
GFXBench - GFXBench 5.0 Aztec Ruins Normal Tier Offscreen
360.7 fps (27%)
GFXBench - GFXBench Car Chase Offscreen
349 fps (33%)
371 fps (35%)
GFXBench 3.1 - GFXBench Manhattan ES 3.1 Offscreen
500 fps (11%)
GFXBench 3.0 - GFXBench 3.0 Manhattan Offscreen
680 fps (28%)
GFXBench (DX / GLBenchmark) 2.7
GFXBench T-Rex HD Offscreen C24Z16 + NVIDIA RTX A3000 Laptop GPU
GFXBench (DX / GLBenchmark) 2.7 - GFXBench T-Rex HD Offscreen C24Z16
1777 fps (14%)
LuxMark v2.0 64Bit - LuxMark v2.0 Room GPU
2619 Samples/s (9%)
LuxMark v2.0 64Bit - LuxMark v2.0 Sala GPU
6178 Samples/s (11%)
ComputeMark v2.1 - ComputeMark v2.1 Result
14015 Points (12%)
18652 Points (15%)
Power Consumption - Furmark Stress Test Power Consumption - external Monitor *
min: 119     avg: 135.3     median: 134 (18%)     max: 153 Watt
Power Consumption - The Witcher 3 Power Consumption - external Monitor *
153 Watt (21%)
min: 137     avg: 141.8     median: 144 (20%)     max: 144.5 Watt
Power Consumption - Witcher 3 Power Consumption *
min: 144     avg: 156     median: 155 (34%)     max: 176 Watt
min: 150     avg: 152     median: 152.1 (33%)     max: 154 Watt
Power Consumption - Power Efficiency - Witcher 3 ultra
min: 0.4324     avg: 0.5     median: 0.5 (43%)     max: 0.531 fps per Watt
min: 0.4073     avg: 0.4     median: 0.4 (39%)     max: 0.4532 fps per Watt
Power Consumption - Power Efficiency - Witcher 3 ultra external Monitor
0.5 fps per Watt (43%)
min: 0.446     avg: 0.5     median: 0.5 (39%)     max: 0.4847 fps per Watt
Emissions Witcher 3 Fan Noise + NVIDIA GeForce RTX 2070 Super Max-Q
Emissions - Witcher 3 Fan Noise
min: 46     avg: 48.9     median: 48 (77%)     max: 53 dB(A)
Witcher 3 Fan Noise + NVIDIA RTX A3000 Laptop GPU
min: 44     avg: 44.5     median: 44.5 (71%)     max: 44.9 dB(A)
Clock Speed - GPU Clock Witcher 3 ultra
min: 1320     avg: 1363     median: 1350 (53%)     max: 1440 MHz

Average Benchmarks NVIDIA GeForce RTX 2070 Super Max-Q → 0% n=0

Average Benchmarks NVIDIA RTX A3000 Laptop GPU → 0% n=0

- Range of benchmark values for this graphics card
red legend - Average benchmark values for this graphics card
* Smaller numbers mean a higher performance
1 This benchmark is not used for the average calculation

Game Benchmarks

The following benchmarks stem from our benchmarks of review laptops. The performance depends on the used graphics memory, clock rate, processor, system settings, drivers, and operating systems. So the results don't have to be representative for all laptops with this GPU. For detailed information on the benchmark results, click on the fps number.

F1 22

F1 22

2022
low 1920x1080
RTX A3000 Laptop GPU:
181  fps
med. 1920x1080
RTX A3000 Laptop GPU:
167.5  fps
high 1920x1080
RTX A3000 Laptop GPU:
120.9  fps
ultra 1920x1080
RTX A3000 Laptop GPU:
39  fps
QHD 2560x1440
RTX A3000 Laptop GPU:
26.2  fps
low 1920x1080
RTX A3000 Laptop GPU:
77  fps
med. 1920x1080
RTX A3000 Laptop GPU:
66  fps
high 1920x1080
RTX A3000 Laptop GPU:
53  fps
ultra 1920x1080
RTX A3000 Laptop GPU:
43  fps
QHD 2560x1440
RTX A3000 Laptop GPU:
27  fps
F1 2021

F1 2021

2021
low 1280x720
RTX A3000 Laptop GPU:
202 266 334 ~ 267 fps
med. 1920x1080
RTX A3000 Laptop GPU:
131 172 187 ~ 163 fps
high 1920x1080
RTX A3000 Laptop GPU:
114 151.1 154 ~ 140 fps
ultra 1920x1080
RTX A3000 Laptop GPU:
75 77.5 82.9 ~ 78 fps
QHD 2560x1440
RTX A3000 Laptop GPU:
56.3 56.7 ~ 57 fps
4K 3840x2160
RTX A3000 Laptop GPU:
26.9  fps
Hitman 3

Hitman 3

2021
low 1280x720
RTX A3000 Laptop GPU:
227  fps
med. 1920x1080
RTX A3000 Laptop GPU:
146  fps
high 1920x1080
RTX A3000 Laptop GPU:
129  fps
ultra 1920x1080
RTX A3000 Laptop GPU:
118  fps
low 1280x720
GeForce RTX 2070 Super Max-Q:
117.8  fps
RTX A3000 Laptop GPU:
78 110 ~ 94 fps
med. 1920x1080
GeForce RTX 2070 Super Max-Q:
67.7  fps
RTX A3000 Laptop GPU:
64 71 ~ 68 fps
high 1920x1080
GeForce RTX 2070 Super Max-Q:
56.7  fps
RTX A3000 Laptop GPU:
52 60 ~ 56 fps
ultra 1920x1080
GeForce RTX 2070 Super Max-Q:
48.5  fps
RTX A3000 Laptop GPU:
45 51 ~ 48 fps
QHD 2560x1440
RTX A3000 Laptop GPU:
28  fps
4K 3840x2160
RTX A3000 Laptop GPU:
14  fps
low 1280x720
RTX A3000 Laptop GPU:
133  fps
med. 1920x1080
RTX A3000 Laptop GPU:
90  fps
high 1920x1080
RTX A3000 Laptop GPU:
82  fps
ultra 1920x1080
RTX A3000 Laptop GPU:
77  fps
low 1280x720
GeForce RTX 2070 Super Max-Q:
135.7  fps
med. 1920x1080
GeForce RTX 2070 Super Max-Q:
102.6  fps
high 1920x1080
GeForce RTX 2070 Super Max-Q:
101.6  fps
ultra 1920x1080
GeForce RTX 2070 Super Max-Q:
86.1  fps
low 1280x720
GeForce RTX 2070 Super Max-Q:
163.7  fps
med. 1920x1080
GeForce RTX 2070 Super Max-Q:
93.6  fps
high 1920x1080
GeForce RTX 2070 Super Max-Q:
86.2  fps
ultra 1920x1080
GeForce RTX 2070 Super Max-Q:
77.4  fps
low 1280x720
GeForce RTX 2070 Super Max-Q:
118  fps
RTX A3000 Laptop GPU:
110  fps
med. 1920x1080
GeForce RTX 2070 Super Max-Q:
81  fps
RTX A3000 Laptop GPU:
79  fps
high 1920x1080
GeForce RTX 2070 Super Max-Q:
70  fps
RTX A3000 Laptop GPU:
68  fps
ultra 1920x1080
GeForce RTX 2070 Super Max-Q:
60  fps
RTX A3000 Laptop GPU:
51  fps
Dirt 5

Dirt 5

2020
low 1280x720
GeForce RTX 2070 Super Max-Q:
160  fps
RTX A3000 Laptop GPU:
183  fps
med. 1920x1080
GeForce RTX 2070 Super Max-Q:
95.6  fps
RTX A3000 Laptop GPU:
111  fps
high 1920x1080
GeForce RTX 2070 Super Max-Q:
78.2  fps
RTX A3000 Laptop GPU:
89  fps
ultra 1920x1080
GeForce RTX 2070 Super Max-Q:
65.1  fps
RTX A3000 Laptop GPU:
72  fps
low 1280x720
GeForce RTX 2070 Super Max-Q:
100  fps
RTX A3000 Laptop GPU:
98  fps
med. 1920x1080
GeForce RTX 2070 Super Max-Q:
96  fps
RTX A3000 Laptop GPU:
93  fps
high 1920x1080
GeForce RTX 2070 Super Max-Q:
84  fps
RTX A3000 Laptop GPU:
86  fps
ultra 1920x1080
GeForce RTX 2070 Super Max-Q:
59  fps
RTX A3000 Laptop GPU:
39  fps
low 1280x720
GeForce RTX 2070 Super Max-Q:
127  fps
med. 1920x1080
GeForce RTX 2070 Super Max-Q:
87.7  fps
high 1920x1080
GeForce RTX 2070 Super Max-Q:
81.9  fps
ultra 1920x1080
GeForce RTX 2070 Super Max-Q:
67.7  fps
low 1280x720
GeForce RTX 2070 Super Max-Q:
145  fps
RTX A3000 Laptop GPU:
139  fps
med. 1920x1080
GeForce RTX 2070 Super Max-Q:
120  fps
RTX A3000 Laptop GPU:
104  fps
high 1920x1080
GeForce RTX 2070 Super Max-Q:
107  fps
RTX A3000 Laptop GPU:
94  fps
ultra 1920x1080
GeForce RTX 2070 Super Max-Q:
93  fps
RTX A3000 Laptop GPU:
83  fps
low 1280x720
GeForce RTX 2070 Super Max-Q:
164.3  fps
RTX A3000 Laptop GPU:
159  fps
med. 1920x1080
GeForce RTX 2070 Super Max-Q:
114.5  fps
RTX A3000 Laptop GPU:
133  fps
high 1920x1080
GeForce RTX 2070 Super Max-Q:
104.3  fps
RTX A3000 Laptop GPU:
124  fps
ultra 1920x1080
GeForce RTX 2070 Super Max-Q:
101.8  fps
RTX A3000 Laptop GPU:
120  fps
F1 2020

F1 2020

2020
low 1280x720
GeForce RTX 2070 Super Max-Q:
258  fps
RTX A3000 Laptop GPU:
264  fps
med. 1920x1080
GeForce RTX 2070 Super Max-Q:
163  fps
RTX A3000 Laptop GPU:
164  fps
high 1920x1080
GeForce RTX 2070 Super Max-Q:
145  fps
RTX A3000 Laptop GPU:
151  fps
ultra 1920x1080
GeForce RTX 2070 Super Max-Q:
104  fps
RTX A3000 Laptop GPU:
114  fps
low 1280x720
GeForce RTX 2070 Super Max-Q:
272.4  fps
RTX A3000 Laptop GPU:
306  fps
med. 1920x1080
GeForce RTX 2070 Super Max-Q:
165.8  fps
RTX A3000 Laptop GPU:
173  fps
high 1920x1080
GeForce RTX 2070 Super Max-Q:
109 109.2 116 ~ 111 fps
RTX A3000 Laptop GPU:
123  fps
ultra 1920x1080
GeForce RTX 2070 Super Max-Q:
79 82.2 90.6 ~ 84 fps
RTX A3000 Laptop GPU:
87  fps
low 1280x720
GeForce RTX 2070 Super Max-Q:
229.6 232.3 ~ 231 fps
med. 1920x1080
GeForce RTX 2070 Super Max-Q:
152 157 164.1 ~ 158 fps
high 1920x1080
GeForce RTX 2070 Super Max-Q:
135.1 139 141 149.4 ~ 141 fps
ultra 1920x1080
GeForce RTX 2070 Super Max-Q:
130.2 135 137 146.4 ~ 137 fps
QHD 2560x1440
GeForce RTX 2070 Super Max-Q:
99.6  fps
4K 3840x2160
GeForce RTX 2070 Super Max-Q:
51.2  fps
med. 1920x1080
GeForce RTX 2070 Super Max-Q:
109  fps
high 1920x1080
GeForce RTX 2070 Super Max-Q:
91.6 96.8 ~ 94 fps
QHD 2560x1440
GeForce RTX 2070 Super Max-Q:
56.8  fps
4K 3840x2160
GeForce RTX 2070 Super Max-Q:
27.4  fps
med. 1920x1080
GeForce RTX 2070 Super Max-Q:
121  fps
high 1920x1080
GeForce RTX 2070 Super Max-Q:
116 121 ~ 119 fps
ultra 1920x1080
GeForce RTX 2070 Super Max-Q:
107 119 ~ 113 fps
QHD 2560x1440
GeForce RTX 2070 Super Max-Q:
79.8  fps
4K 3840x2160
GeForce RTX 2070 Super Max-Q:
36.8  fps
low 1280x720
GeForce RTX 2070 Super Max-Q:
132.8  fps
med. 1920x1080
GeForce RTX 2070 Super Max-Q:
86.6 91.3 ~ 89 fps
high 1920x1080
GeForce RTX 2070 Super Max-Q:
60.2 61.8 65.7 ~ 63 fps
ultra 1920x1080
GeForce RTX 2070 Super Max-Q:
39.4 40.2 42.4 ~ 41 fps
QHD 2560x1440
GeForce RTX 2070 Super Max-Q:
32 34.3 ~ 33 fps
4K 3840x2160
GeForce RTX 2070 Super Max-Q:
20.5 22 ~ 21 fps
med. 1920x1080
GeForce RTX 2070 Super Max-Q:
108 109 ~ 109 fps
high 1920x1080
GeForce RTX 2070 Super Max-Q:
95 98.2 104 ~ 99 fps
ultra 1920x1080
GeForce RTX 2070 Super Max-Q:
88.8 92.1 94.1 ~ 92 fps
QHD 2560x1440
GeForce RTX 2070 Super Max-Q:
71.3  fps
4K 3840x2160
GeForce RTX 2070 Super Max-Q:
35.9  fps
med. 1920x1080
GeForce RTX 2070 Super Max-Q:
103  fps
high 1920x1080
GeForce RTX 2070 Super Max-Q:
88.2 94 ~ 91 fps
ultra 1920x1080
GeForce RTX 2070 Super Max-Q:
80.7 82.6 ~ 82 fps
QHD 2560x1440
GeForce RTX 2070 Super Max-Q:
60.5  fps
4K 3840x2160
GeForce RTX 2070 Super Max-Q:
33.4  fps
low 1280x720
GeForce RTX 2070 Super Max-Q:
160.9  fps
med. 1920x1080
GeForce RTX 2070 Super Max-Q:
116.2 134 ~ 125 fps
high 1920x1080
GeForce RTX 2070 Super Max-Q:
97.8 117 126 ~ 114 fps
ultra 1920x1080
GeForce RTX 2070 Super Max-Q:
84.2 99.6 104 ~ 96 fps
QHD 2560x1440
GeForce RTX 2070 Super Max-Q:
72.3  fps
4K 3840x2160
GeForce RTX 2070 Super Max-Q:
41  fps
GRID 2019

GRID 2019

2019
med. 1920x1080
GeForce RTX 2070 Super Max-Q:
131  fps
high 1920x1080
GeForce RTX 2070 Super Max-Q:
103 104 ~ 104 fps
ultra 1920x1080
GeForce RTX 2070 Super Max-Q:
69.7 71.1 ~ 70 fps
QHD 2560x1440
GeForce RTX 2070 Super Max-Q:
60.6  fps
4K 3840x2160
GeForce RTX 2070 Super Max-Q:
39.7  fps
med. 1920x1080
GeForce RTX 2070 Super Max-Q:
101  fps
high 1920x1080
GeForce RTX 2070 Super Max-Q:
89 92 ~ 91 fps
ultra 1920x1080
GeForce RTX 2070 Super Max-Q:
66 69 ~ 68 fps
QHD 2560x1440
GeForce RTX 2070 Super Max-Q:
49 50 ~ 50 fps
4K 3840x2160
GeForce RTX 2070 Super Max-Q:
28 29 ~ 29 fps
FIFA 20

FIFA 20

2019
med. 1920x1080
GeForce RTX 2070 Super Max-Q:
271  fps
high 1920x1080
GeForce RTX 2070 Super Max-Q:
196 259 ~ 228 fps
ultra 1920x1080
GeForce RTX 2070 Super Max-Q:
190 257 ~ 224 fps
QHD 2560x1440
GeForce RTX 2070 Super Max-Q:
253  fps
4K 3840x2160
GeForce RTX 2070 Super Max-Q:
186  fps
low 1280x720
RTX A3000 Laptop GPU:
129  fps
med. 1920x1080
GeForce RTX 2070 Super Max-Q:
112  fps
RTX A3000 Laptop GPU:
115  fps
high 1920x1080
GeForce RTX 2070 Super Max-Q:
76.3 77.2 78 84.4 ~ 79 fps
RTX A3000 Laptop GPU:
87  fps
ultra 1920x1080
GeForce RTX 2070 Super Max-Q:
58.9 58.9 59.6 64.8 ~ 61 fps
RTX A3000 Laptop GPU:
69  fps
QHD 2560x1440
GeForce RTX 2070 Super Max-Q:
41.7 45.6 ~ 44 fps
4K 3840x2160
GeForce RTX 2070 Super Max-Q:
22.2 24.5 ~ 23 fps
Control

Control

2019
med. 1920x1080
GeForce RTX 2070 Super Max-Q:
92.6  fps
high 1920x1080
GeForce RTX 2070 Super Max-Q:
60.2 68.4 ~ 64 fps
QHD 2560x1440
GeForce RTX 2070 Super Max-Q:
40.6 43.9 ~ 42 fps
4K 3840x2160
GeForce RTX 2070 Super Max-Q:
21.1 23.8 ~ 22 fps
F1 2019

F1 2019

2019
med. 1920x1080
GeForce RTX 2070 Super Max-Q:
191  fps
high 1920x1080
GeForce RTX 2070 Super Max-Q:
152 159 ~ 156 fps
ultra 1920x1080
GeForce RTX 2070 Super Max-Q:
141 143 ~ 142 fps
QHD 2560x1440
GeForce RTX 2070 Super Max-Q:
107  fps
4K 3840x2160
GeForce RTX 2070 Super Max-Q:
61  fps
low 1280x720
GeForce RTX 2070 Super Max-Q:
255.2 260.9 ~ 258 fps
med. 1920x1080
GeForce RTX 2070 Super Max-Q:
122.8 141.2 ~ 132 fps
high 1920x1080
GeForce RTX 2070 Super Max-Q:
77.6 97.5 ~ 88 fps
ultra 1920x1080
GeForce RTX 2070 Super Max-Q:
54.8 68.7 ~ 62 fps
Rage 2

Rage 2

2019
med. 1920x1080
GeForce RTX 2070 Super Max-Q:
119  fps
high 1920x1080
GeForce RTX 2070 Super Max-Q:
97.5 99.5 ~ 99 fps
ultra 1920x1080
GeForce RTX 2070 Super Max-Q:
94.9 97.1 ~ 96 fps
QHD 2560x1440
GeForce RTX 2070 Super Max-Q:
62.8  fps
4K 3840x2160
GeForce RTX 2070 Super Max-Q:
30.1  fps
Anno 1800

Anno 1800

2019
med. 1920x1080
GeForce RTX 2070 Super Max-Q:
112  fps
high 1920x1080
GeForce RTX 2070 Super Max-Q:
84.2 85.5 ~ 85 fps
ultra 1920x1080
GeForce RTX 2070 Super Max-Q:
46.8 47.4 ~ 47 fps
QHD 2560x1440
GeForce RTX 2070 Super Max-Q:
36.6 37 ~ 37 fps
4K 3840x2160
GeForce RTX 2070 Super Max-Q:
21.1 21.5 ~ 21 fps
med. 1920x1080
GeForce RTX 2070 Super Max-Q:
123  fps
high 1920x1080
GeForce RTX 2070 Super Max-Q:
105 113 ~ 109 fps
ultra 1920x1080
GeForce RTX 2070 Super Max-Q:
77 81 ~ 79 fps
QHD 2560x1440
GeForce RTX 2070 Super Max-Q:
54 60 ~ 57 fps
4K 3840x2160
GeForce RTX 2070 Super Max-Q:
29 29 ~ 29 fps
med. 1920x1080
GeForce RTX 2070 Super Max-Q:
183  fps
high 1920x1080
GeForce RTX 2070 Super Max-Q:
151 155 ~ 153 fps
ultra 1920x1080
GeForce RTX 2070 Super Max-Q:
85.8 86.9 ~ 86 fps
QHD 2560x1440
GeForce RTX 2070 Super Max-Q:
66  fps
low 1280x720
RTX A3000 Laptop GPU:
127  fps
med. 1920x1080
GeForce RTX 2070 Super Max-Q:
98  fps
RTX A3000 Laptop GPU:
103  fps
high 1920x1080
GeForce RTX 2070 Super Max-Q:
92 110 ~ 101 fps
RTX A3000 Laptop GPU:
98  fps
ultra 1920x1080
GeForce RTX 2070 Super Max-Q:
83 98 ~ 91 fps
RTX A3000 Laptop GPU:
87  fps
QHD 2560x1440
GeForce RTX 2070 Super Max-Q:
70 80 ~ 75 fps
4K 3840x2160
GeForce RTX 2070 Super Max-Q:
43 45 ~ 44 fps
med. 1920x1080
GeForce RTX 2070 Super Max-Q:
92  fps
high 1920x1080
GeForce RTX 2070 Super Max-Q:
72 75.4 ~ 74 fps
ultra 1920x1080
GeForce RTX 2070 Super Max-Q:
57.7 60.4 ~ 59 fps
QHD 2560x1440
GeForce RTX 2070 Super Max-Q:
46.7 49.1 ~ 48 fps
4K 3840x2160
GeForce RTX 2070 Super Max-Q:
26.5 29.1 ~ 28 fps
med. 1920x1080
GeForce RTX 2070 Super Max-Q:
144  fps
high 1920x1080
GeForce RTX 2070 Super Max-Q:
140 144 ~ 142 fps
ultra 1920x1080
GeForce RTX 2070 Super Max-Q:
139 143 ~ 141 fps
QHD 2560x1440
GeForce RTX 2070 Super Max-Q:
109  fps
4K 3840x2160
GeForce RTX 2070 Super Max-Q:
61.1  fps
med. 1920x1080
GeForce RTX 2070 Super Max-Q:
137  fps
high 1920x1080
GeForce RTX 2070 Super Max-Q:
101  fps
ultra 1920x1080
GeForce RTX 2070 Super Max-Q:
93.4  fps
QHD 2560x1440
GeForce RTX 2070 Super Max-Q:
63.6  fps
4K 3840x2160
GeForce RTX 2070 Super Max-Q:
34.5  fps
med. 1920x1080
GeForce RTX 2070 Super Max-Q:
135  fps
high 1920x1080
GeForce RTX 2070 Super Max-Q:
118  fps
ultra 1920x1080
GeForce RTX 2070 Super Max-Q:
107  fps
QHD 2560x1440
GeForce RTX 2070 Super Max-Q:
71.6  fps
4K 3840x2160
GeForce RTX 2070 Super Max-Q:
36.4  fps
med. 1920x1080
GeForce RTX 2070 Super Max-Q:
144  fps
high 1920x1080
GeForce RTX 2070 Super Max-Q:
121 135 136 139 ~ 133 fps
ultra 1920x1080
GeForce RTX 2070 Super Max-Q:
113 125 126 130 ~ 124 fps
QHD 2560x1440
GeForce RTX 2070 Super Max-Q:
99.4 100 ~ 100 fps
4K 3840x2160
GeForce RTX 2070 Super Max-Q:
56.8 58.2 ~ 58 fps
Hitman 2

Hitman 2

2018
med. 1920x1080
GeForce RTX 2070 Super Max-Q:
89.2  fps
high 1920x1080
GeForce RTX 2070 Super Max-Q:
83.2  fps
ultra 1920x1080
GeForce RTX 2070 Super Max-Q:
79.7  fps
QHD 2560x1440
GeForce RTX 2070 Super Max-Q:
76.1  fps
4K 3840x2160
GeForce RTX 2070 Super Max-Q:
41.5  fps
med. 1920x1080
GeForce RTX 2070 Super Max-Q:
99  fps
high 1920x1080
GeForce RTX 2070 Super Max-Q:
81  fps
ultra 1920x1080
GeForce RTX 2070 Super Max-Q:
62  fps
QHD 2560x1440
GeForce RTX 2070 Super Max-Q:
47  fps
4K 3840x2160
GeForce RTX 2070 Super Max-Q:
32  fps
low 1280x720
GeForce RTX 2070 Super Max-Q:
133  fps
med. 1920x1080
GeForce RTX 2070 Super Max-Q:
112 118 ~ 115 fps
high 1920x1080
GeForce RTX 2070 Super Max-Q:
102 106 110 110 110 ~ 108 fps
ultra 1920x1080
GeForce RTX 2070 Super Max-Q:
91 96 99 99 100 ~ 97 fps
QHD 2560x1440
GeForce RTX 2070 Super Max-Q:
68 68 ~ 68 fps
4K 3840x2160
GeForce RTX 2070 Super Max-Q:
35 36 ~ 36 fps
Strange Brigade

Strange Brigade

2018
low 1280x720
RTX A3000 Laptop GPU:
324 344 365 ~ 344 fps
med. 1920x1080
RTX A3000 Laptop GPU:
152 164 183 ~ 166 fps
high 1920x1080
RTX A3000 Laptop GPU:
121 134 151 ~ 135 fps
ultra 1920x1080
RTX A3000 Laptop GPU:
108 114 118 ~ 113 fps
QHD 2560x1440
RTX A3000 Laptop GPU:
85 87 ~ 86 fps
4K 3840x2160
RTX A3000 Laptop GPU:
51  fps
med. 1920x1080
GeForce RTX 2070 Super Max-Q:
113  fps
high 1920x1080
GeForce RTX 2070 Super Max-Q:
102  fps
ultra 1920x1080
GeForce RTX 2070 Super Max-Q:
84.2  fps
QHD 2560x1440
GeForce RTX 2070 Super Max-Q:
55.7  fps
4K 3840x2160
GeForce RTX 2070 Super Max-Q:
27.5  fps
Far Cry 5

Far Cry 5

2018
low 1280x720
GeForce RTX 2070 Super Max-Q:
149  fps
RTX A3000 Laptop GPU:
113 115 170 ~ 133 fps
med. 1920x1080
GeForce RTX 2070 Super Max-Q:
118  fps
RTX A3000 Laptop GPU:
84 111 128 ~ 108 fps
high 1920x1080
GeForce RTX 2070 Super Max-Q:
111  fps
RTX A3000 Laptop GPU:
81 103 117 ~ 100 fps
ultra 1920x1080
GeForce RTX 2070 Super Max-Q:
104  fps
RTX A3000 Laptop GPU:
77 108 ~ 93 fps
QHD 2560x1440
RTX A3000 Laptop GPU:
62 76 ~ 69 fps
4K 3840x2160
RTX A3000 Laptop GPU:
36  fps
low 1280x720
GeForce RTX 2070 Super Max-Q:
113 119 119 121 121 122 ~ 119 fps
RTX A3000 Laptop GPU:
103 124 142.1 ~ 123 fps
med. 1920x1080
GeForce RTX 2070 Super Max-Q:
97.4 104 104 106 107 109 ~ 105 fps
RTX A3000 Laptop GPU:
82.1 105 120.7 ~ 103 fps
high 1920x1080
GeForce RTX 2070 Super Max-Q:
82.3 87.6 87.6 88.1 89.3 90 ~ 87 fps
RTX A3000 Laptop GPU:
66.7 85.1 97.5 ~ 83 fps
4K 3840x2160
GeForce RTX 2070 Super Max-Q:
67.8 75.4 ~ 72 fps
RTX A3000 Laptop GPU:
40.5  fps
med. 1920x1080
GeForce RTX 2070 Super Max-Q:
127  fps
high 1920x1080
GeForce RTX 2070 Super Max-Q:
108  fps
ultra 1920x1080
GeForce RTX 2070 Super Max-Q:
75.9  fps
QHD 2560x1440
GeForce RTX 2070 Super Max-Q:
54.4  fps
4K 3840x2160
GeForce RTX 2070 Super Max-Q:
27.9  fps
low 1280x720
GeForce RTX 2070 Super Max-Q:
162  fps
RTX A3000 Laptop GPU:
130 160 176 ~ 155 fps
med. 1920x1080
GeForce RTX 2070 Super Max-Q:
104 110 ~ 107 fps
RTX A3000 Laptop GPU:
83.8 86.7 101 ~ 91 fps
high 1920x1080
GeForce RTX 2070 Super Max-Q:
80 83.7 ~ 82 fps
RTX A3000 Laptop GPU:
64.3 67 75.1 ~ 69 fps
QHD 2560x1440
RTX A3000 Laptop GPU:
45.6 50.7 ~ 48 fps
4K 3840x2160
GeForce RTX 2070 Super Max-Q:
33  fps
RTX A3000 Laptop GPU:
28.8  fps
Fortnite

Fortnite

2018
med. 1920x1080
GeForce RTX 2070 Super Max-Q:
133  fps
high 1920x1080
GeForce RTX 2070 Super Max-Q:
132  fps
ultra 1920x1080
GeForce RTX 2070 Super Max-Q:
108  fps
QHD 2560x1440
GeForce RTX 2070 Super Max-Q:
86.2  fps
4K 3840x2160
GeForce RTX 2070 Super Max-Q:
43  fps
low 1280x720
GeForce RTX 2070 Super Max-Q:
144 148 153 157.8 163 163.9 ~ 155 fps
RTX A3000 Laptop GPU:
156 164 182 ~ 167 fps
med. 1366x768
GeForce RTX 2070 Super Max-Q:
132 137 138 146.6 147 148.3 ~ 141 fps
RTX A3000 Laptop GPU:
131 148 166.8 ~ 149 fps
high 1920x1080
GeForce RTX 2070 Super Max-Q:
127 128 132 138 139.5 140.9 ~ 134 fps
RTX A3000 Laptop GPU:
119 142 155.8 ~ 139 fps
ultra 1920x1080
GeForce RTX 2070 Super Max-Q:
120 120 125 129 131.4 132.3 ~ 126 fps
RTX A3000 Laptop GPU:
108 132 147.1 ~ 129 fps
4K 3840x2160
GeForce RTX 2070 Super Max-Q:
103  fps
RTX A3000 Laptop GPU:
77.1  fps
low 1024x768
GeForce RTX 2070 Super Max-Q:
312 323.7 326.3 348.3 ~ 328 fps
RTX A3000 Laptop GPU:
263 335 381 ~ 326 fps
med. 1366x768
GeForce RTX 2070 Super Max-Q:
232 235 235.4 240 254.1 ~ 239 fps
RTX A3000 Laptop GPU:
176 222 262 ~ 220 fps
high 1920x1080
GeForce RTX 2070 Super Max-Q:
131 136.2 141 141.4 142 142 152 163.1 ~ 144 fps
RTX A3000 Laptop GPU:
112 151 152 ~ 138 fps
ultra 1920x1080
GeForce RTX 2070 Super Max-Q:
62.7 70.5 71.9 73.6 74 75.3 75.5 76.2 79.1 92.5 ~ 75 fps
RTX A3000 Laptop GPU:
59.6 61.1 69.8 ~ 64 fps
4K 3840x2160
GeForce RTX 2070 Super Max-Q:
49.7 50.5 52.9 ~ 51 fps
RTX A3000 Laptop GPU:
45  fps
GTA V

GTA V

2015
low 1024x768
GeForce RTX 2070 Super Max-Q:
182 182 182 182 ~ 182 fps
RTX A3000 Laptop GPU:
163 180 185.8 ~ 176 fps
med. 1366x768
GeForce RTX 2070 Super Max-Q:
174 175 176 177 ~ 176 fps
RTX A3000 Laptop GPU:
150 174 182.5 ~ 169 fps
high 1920x1080
GeForce RTX 2070 Super Max-Q:
153 159 160 161 ~ 158 fps
RTX A3000 Laptop GPU:
101 158 168.5 ~ 143 fps
ultra 1920x1080
GeForce RTX 2070 Super Max-Q:
83.4 89.9 91.1 91.3 ~ 89 fps
RTX A3000 Laptop GPU:
64.3 90.1 95.3 ~ 83 fps
QHD 2560x1440
RTX A3000 Laptop GPU:
53.5 71.3 ~ 62 fps
4K 3840x2160
GeForce RTX 2070 Super Max-Q:
73.1  fps
RTX A3000 Laptop GPU:
49.2  fps
low 1280x720
GeForce RTX 2070 Super Max-Q:
420.2  fps
med. 1366x768
GeForce RTX 2070 Super Max-Q:
359.5  fps
high 1366x768
GeForce RTX 2070 Super Max-Q:
329.8  fps
ultra 1920x1080
GeForce RTX 2070 Super Max-Q:
166.5  fps
NVIDIA RTX A4000 Laptop GPUNVIDIA GeForce RTX 2070 Super Max-QNVIDIA RTX A3000 Laptop GPU
lowmed.highultraQHD4Klowmed.highultraQHD4Klowmed.highultraQHD4K
F1 22181167.5120.93926.2
Cyberpunk 2077 1.67766534327
F1 2021267163140785726.9
Hitman 3227146129118
Cyberpunk 2077 1.0117.867.756.748.5946856482814
Immortals Fenyx Rising133908277
Assassin´s Creed Valhalla118817060110796851
Dirt 516095.678.265.11831118972
Watch Dogs Legion10096845998938639
Horizon Zero Dawn145120107931391049483
Death Stranding164.3114.5104.3101.8159133124120
F1 2020258163145104264164151114
Gears Tactics272.4165.81118430617312387
Borderlands 3112796144231291158769
Far Cry New Dawn981019175441271039887
Strange Brigade3441661351138651
Far Cry 5149118111104133108100936936
X-Plane 11.1111910587721231038340.5
Final Fantasy XV Benchmark162107823315591694828.8
Dota 2 Reborn15514113412610316714913912977.1
The Witcher 332823914475513262201386445
GTA V1821761588973.1176169143836249.2
NVIDIA RTX A4000 Laptop GPUNVIDIA GeForce RTX 2070 Super Max-QNVIDIA RTX A3000 Laptop GPU
lowmed.highultraQHD4Klowmed.highultraQHD4Klowmed.highultraQHD4K
< 30 fps
< 60 fps
< 120 fps
≥ 120 fps


< 30 fps
< 60 fps
< 120 fps
≥ 120 fps


4
10


10
6

1
11
4

2
11
1

1
1
1
3
3
< 30 fps
< 60 fps
< 120 fps
≥ 120 fps


4
18


12
10

2
10
10

5
13
2
3
2
3
3
5
1

For more games that might be playable and a list of all games and graphics cards visit our Gaming List

v1.33
log 28. 07:00:13

#0 ran 0s before starting gpusingle class +0s ... 0s

#1 checking url part for id 10677 +0s ... 0s

#2 checking url part for id 10307 +0s ... 0s

#3 checking url part for id 10679 +0s ... 0s

#4 redirected to Ajax server, took 1751086812s time from redirect:0 +0s ... 0s

#5 did not recreate cache, as it is less than 5 days old! Created at Sat, 28 Jun 2025 05:20:36 +0200 +0s ... 0s

#6 composed specs +0.018s ... 0.019s

#7 did output specs +0s ... 0.019s

#8 start showIntegratedCPUs +0s ... 0.019s

#9 getting avg benchmarks for device 10677 +0.013s ... 0.032s

#10 got single benchmarks 10677 +0.003s ... 0.035s

#11 getting avg benchmarks for device 10307 +0.004s ... 0.039s

#12 got single benchmarks 10307 +0.013s ... 0.052s

#13 getting avg benchmarks for device 10679 +0s ... 0.053s

#14 got single benchmarks 10679 +0.007s ... 0.059s

#15 got avg benchmarks for devices +0s ... 0.059s

#16 min, max, avg, median took s +0.04s ... 0.099s

#17 before gaming benchmark output +0s ... 0.099s

#18 Got 572 rows for game benchmarks. +0.029s ... 0.128s

#19 composed SQL query for gamebenchmarks +0s ... 0.128s

#20 got data and put it in $dataArray +0.004s ... 0.132s

#21 benchmarks composed for output. +0.017s ... 0.149s

#22 calculated avg scores. +0s ... 0.149s

#23 return log +0.001s ... 0.149s

Please share our article, every link counts!
Mail Logo
> Expert Reviews and News on Laptops, Smartphones and Tech Innovations > Benchmarks / Tech > Graphics Card Comparison - Head 2 Head
Redaktion, 2017-09- 8 (Update: 2023-07- 1)