NVIDIA Quadro T1000 (Laptop) vs NVIDIA Quadro P2000 Max-Q vs NVIDIA T550 Laptop GPU
NVIDIA Quadro T1000 (Laptop) ► remove from comparison
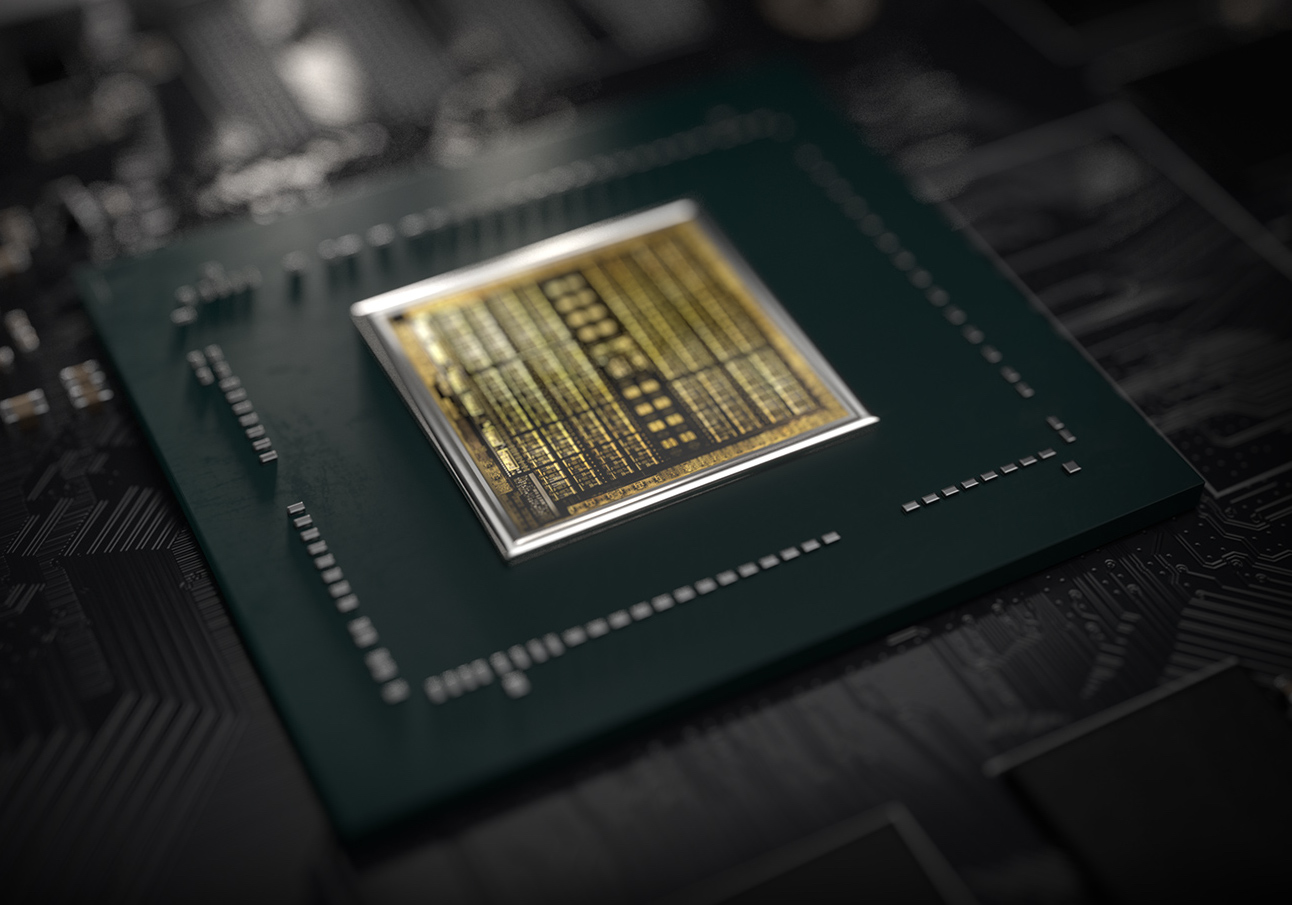
The Nvidia Quadro T1000 for laptops is a professional mobile graphics card that is based on the Turing architecture (TU117 chip). Compared to the consumer GTX 1650 , the Quadro T1000 features less CUDA cores / shaders (768 versus 896). The Quadro T2000 uses the same TU117 chip, but features all 1024 cores (2x to the T1000) and is therefore significantly faster. The chip is manufactured in 12nm FinFET at TSMC.
The Turing generation did not only introduce raytracing for the RTX cards, but also optimized the architecture of the cores and caches. According to Nvidia the CUDA cores offer now a concurrent execution of floating point and integer operations for increased performance in compute-heavy workloads of modern games. Furthermore, the caches were reworked (new unified memory architecture with twice the cache compared to Pascal). This leads to up to 50% more instructions per clock and a 40% more power efficient usage compared to Pascal. In contrary to the faster Quadro RTX cards, the T1000 and T2000 don not feature raytracing and Tensor cores.
NVIDIA Quadro P2000 Max-Q ► remove from comparison
The Nvidia Quadro P2000 is a mobile mid-range workstation graphics card for notebooks. Similar to the consumer GeForce GTX 1050 Ti (Laptop) , it is based on the GP107 chip with 768 shaders. Compared to the normal P2000, the Max-Q variant offers a lower clock speed at a reduced power consumption. The graphics card is designed for the Kaby Lake / Coffee Lake generation.
The Quadro GPUs offer certified drivers , which are optimized for stability and performance in professional applications (CAD, DCC, medical, prospection, and visualizing applications). The performance in these areas is therefore much better compared to corresponding consumer GPUs.
Performance
The theoretical performance should be similar with the GeForce GTX 1050 Ti Max-Q .
NVIDIA T550 Laptop GPU ► remove from comparison
The Nvidia T550 Laptop GPU (formerly known as Quadro T550 Mobile) for laptops is a professional mobile graphics card that is based on the Turing architecture (TU117 chip). It is based on the consumer GeForce MX550 and features the same 1024 cores and a 64 Bit memory bus. The card offers 4 GB GDDR6 with a maximum bandwidth of 112 GB/s and no dedicated display outputs (iGPU display outputs used via Optimus). The chip is manufactured in 12nm FinFET at TSMC.
The professional GPUs offer certified drivers , which are optimized for stability and performance in professional applications (CAD, DCC, medical, prospection, and visualizing applications). The performance in these areas is therefore much better compared to corresponding consumer GPUs.
The Turing generation did not only introduce raytracing for the RTX cards, but also optimized the architecture of the cores and caches. According to Nvidia the CUDA cores offer now a concurrent execution of floating point and integer operations for increased performance in compute-heavy workloads of modern games. Furthermore, the caches were reworked (new unified memory architecture with twice the cache compared to Pascal). This leads to up to 50% more instructions per clock and a 40% more power efficient usage compared to Pascal. In contrary to the faster Quadro RTX cards, the T550 does not feature raytracing and Tensor cores.
NVIDIA Quadro T1000 (Laptop) NVIDIA Quadro P2000 Max-Q NVIDIA T550 Laptop GPU Quadro Turing Series Codename N19P-Q1 GP107GL TU117 Architecture Turing Pascal Turing Pipelines 768 - unified 768 - unified 1024 - unified Core Speed 1395 - 1455 (Boost) MHz 1215 - 1468 (Boost) MHz 1065 - 1665 (Boost) MHz Memory Speed 8000 MHz 6008 MHz 12000 effective = 1500 MHz Memory Bus Width 128 Bit 128 Bit 64 Bit Memory Type GDDR5 GDDR5 GDDR5, GDDR6 Max. Amount of Memory 4 GB 4 GB 4 GB Shared Memory no no no API DirectX 12_1, OpenGL 4.6 DirectX 12_1, Shader 5.0, OpenGL 4.5 DirectX 12_1, Shader 6.7, OpenGL 4.6 Power Consumption 50 Watt 25 Watt (20 - 60 Watt TGP) technology 12 nm 14 nm 12 nm Notebook Size medium sized medium sized medium sized Date of Announcement 27.05.2019 05.07.2017 27.05.2022 Features Optimus,
PhysX, 3D Vision Pro, nView, Optimus Theoretical Performance 7.2 TFLOPS FP16, 3.7 TFLOPS FP32 Memory Bandwidth 112 GB/s Information Optimus only Link to Manufacturer Page nvdam.widen.net
Benchmarks Performance Rating - 3DMark 11 + Fire Strike + Time Spy - Quadro T1000 (Laptop)
4 pt (12%)
...
NVIDIA Quadro T1000 (Laptop)
...
max:
Performance Rating - 3DMark 11 + Fire Strike + Time Spy - Quadro P2000 Max-Q
3.1 pt (9%)
...
NVIDIA Quadro P2000 Max-Q
...
max:
3DMark - 3DMark Time Spy Score
min: 3006 avg: 3348 median: 3474 (10%) max: 3565 Points
GPU TDP ? TDP 50 W 91% 100%
2206 Points (6%)
GPU TDP ? TDP 50 W 81% 100%
min: 2031 avg: 2187 median: 2066 (6%) max: 2465 Points
GPU TDP ? TDP 20 W TDP 30 W TDP 50 W 81% 57% 69% 100%
3DMark - 3DMark Time Spy Graphics
min: 2834 avg: 3123 median: 3261 (9%) max: 3273 Points
GPU TDP ? TDP 50 W 93% 100%
2049 Points (5%)
GPU TDP ? TDP 50 W 83% 100%
min: 1882 avg: 2021 median: 1928 (5%) max: 2252 Points
GPU TDP ? TDP 20 W TDP 30 W TDP 50 W 83% 58% 69% 100%
3DMark - 3DMark Ice Storm Unlimited Graphics
375510 Points (43%)
326075 Points (37%)
3DMark - 3DMark Ice Storm Extreme Graphics
122046 Points (16%)
36339 Points (5%)
3DMark - 3DMark Cloud Gate Score
min: 23601 avg: 25273 median: 25273 (27%) max: 26945 Points
14996 Points (16%)
min: 17399 avg: 17614 median: 17614 (19%) max: 17829 Points
GPU TDP ? TDP 20 W 100% 81%
3DMark - 3DMark Cloud Gate Graphics
min: 48965 avg: 53629 median: 53628.5 (14%) max: 58292 Points
28679 Points (8%)
min: 32743 avg: 33219 median: 33218.5 (9%) max: 33694 Points
GPU TDP ? TDP 20 W 100% 73%
3DMark - 3DMark Fire Strike Standard Score
min: 6812 avg: 7589 median: 7783 (14%) max: 8173 Points
GPU TDP ? TDP 50 W 89% 100%
5958 Points (11%)
GPU TDP ? TDP 50 W 84% 100%
min: 4559 avg: 4786 median: 4581 (8%) max: 5218 Points
GPU TDP ? TDP 20 W TDP 30 W TDP 50 W 84% 56% 64% 100%
3DMark - 3DMark Fire Strike Standard Graphics
min: 7558 avg: 8347 median: 8727 (10%) max: 8757 Points
GPU TDP ? TDP 50 W 93% 100%
6742 Points (8%)
GPU TDP ? TDP 50 W 88% 100%
min: 4816 avg: 5100 median: 4890 (6%) max: 5593 Points
GPU TDP ? TDP 20 W TDP 30 W TDP 50 W 88% 55% 64% 100%
3DMark - 3DMark Ice Storm Graphics
min: 86096 avg: 111211 median: 111211 (13%) max: 136326 Points
22356 Points (3%)
3DMark - 3DMark Wild Life Extreme Unlimited
min: 3530 avg: 3590 median: 3589.5 (4%) max: 3649 Points
3DMark 11 - 3DM11 Performance Score
min: 10211 avg: 11241 median: 11592 (16%) max: 11919 Points
GPU TDP ? TDP 50 W 95% 100%
8363 Points (12%)
GPU TDP ? TDP 50 W 88% 100%
min: 7405 avg: 8160 median: 8160 (11%) max: 8915 Points
GPU TDP ? TDP 20 W TDP 30 W TDP 50 W 88% 64% 77% 100%
3DMark 11 - 3DM11 Performance GPU
min: 10407 avg: 11305 median: 11377 (10%) max: 12132 Points
GPU TDP ? TDP 50 W 99% 100%
8148 Points (7%)
GPU TDP ? TDP 50 W 90% 100%
min: 7432 avg: 8067 median: 8066.5 (7%) max: 8701 Points
GPU TDP ? TDP 20 W TDP 30 W TDP 50 W 90% 65% 76% 100%
3DMark Vantage + NVIDIA Quadro T1000 (Laptop) 3DMark Vantage - 3DM Vant. Perf. total
31509 Points (9%)
3DM Vant. Perf. total + NVIDIA Quadro P2000 Max-Q
32724 Points (9%)
3DM Vant. Perf. total + NVIDIA T550 Laptop GPU
25155 Points (7%)
GPU TDP ? TDP 20 W 100% 78%
3DM Vant. Perf. GPU no PhysX + NVIDIA Quadro T1000 (Laptop) 3DMark Vantage - 3DM Vant. Perf. GPU no PhysX
33740 Points (19%)
3DM Vant. Perf. GPU no PhysX + NVIDIA Quadro P2000 Max-Q
30786 Points (17%)
3DM Vant. Perf. GPU no PhysX + NVIDIA T550 Laptop GPU
24697 Points (14%)
GPU TDP ? TDP 20 W 100% 77%
3DMark 06 3DMark 06 - Standard 1280x1024 + NVIDIA Quadro T1000 (Laptop)
min: 33809 avg: 35034 median: 35033.5 (46%) max: 36258 Points
3DMark 06 - Standard 1280x1024 + NVIDIA Quadro P2000 Max-Q
31482 Points (41%)
3DMark 06 - Standard 1280x1024 + NVIDIA T550 Laptop GPU
31003 Points (41%)
GPU TDP ? TDP 20 W 100% 92%
Unigine Valley 1.0 - Unigine Valley 1.0 DX
min: 36.7 avg: 39.3 median: 39.3 (13%) max: 41.9 fps
Unigine Heaven 3.0 - Unigine Heaven 3.0 DX 11
110.3 fps (37%)
Unigine Heaven 3.0 - Unigine Heaven 3.0 OpenGL
101.1 fps (45%)
Unigine Heaven 2.1 - Heaven 2.1 high
min: 136.9 avg: 149.7 median: 149.7 (28%) max: 162.4 fps
Blender - Blender 3.3 Classroom CUDA *
min: 278 avg: 282 median: 283 (42%) max: 285 Seconds
GPU TDP 20 W TDP 30 W 100% 102%
Blender - Blender 3.3 Classroom OPTIX *
min: 256 avg: 263.3 median: 265 (99%) max: 269 Seconds
GPU TDP 20 W TDP 30 W 100% 650%
SPECviewperf 12 + NVIDIA Quadro T1000 (Laptop) SPECviewperf 12 - specvp12 sw-03
113.8 fps (28%)
specvp12 sw-03 + NVIDIA Quadro P2000 Max-Q
71.3 fps (18%)
specvp12 snx-02 + NVIDIA Quadro T1000 (Laptop) SPECviewperf 12 - specvp12 snx-02
82.7 fps (12%)
specvp12 snx-02 + NVIDIA Quadro P2000 Max-Q
57 fps (8%)
specvp12 showcase-01 + NVIDIA Quadro T1000 (Laptop) SPECviewperf 12 - specvp12 showcase-01
40.3 fps (9%)
specvp12 showcase-01 + NVIDIA Quadro P2000 Max-Q
30 fps (7%)
specvp12 mediacal-01 + NVIDIA Quadro T1000 (Laptop) SPECviewperf 12 - specvp12 mediacal-01
min: 24.99 avg: 29.9 median: 29.9 (8%) max: 34.8 fps
specvp12 mediacal-01 + NVIDIA Quadro P2000 Max-Q
26.6 fps (7%)
specvp12 maya-04 + NVIDIA Quadro T1000 (Laptop) SPECviewperf 12 - specvp12 maya-04
min: 47.5 avg: 56.3 median: 56.3 (15%) max: 65.1 fps
specvp12 maya-04 + NVIDIA Quadro P2000 Max-Q
47.2 fps (13%)
specvp12 energy-01 + NVIDIA Quadro T1000 (Laptop) SPECviewperf 12 - specvp12 energy-01
min: 5.79 avg: 6.8 median: 6.8 (6%) max: 7.9 fps
specvp12 energy-01 + NVIDIA Quadro P2000 Max-Q
6.4 fps (6%)
specvp12 creo-01 + NVIDIA Quadro T1000 (Laptop) SPECviewperf 12 - specvp12 creo-01
min: 75 avg: 79.5 median: 79.5 (32%) max: 83.9 fps
specvp12 creo-01 + NVIDIA Quadro P2000 Max-Q
55.7 fps (22%)
specvp12 catia-04 + NVIDIA Quadro T1000 (Laptop) SPECviewperf 12 - specvp12 catia-04
min: 82.4 avg: 87.7 median: 87.7 (14%) max: 93 fps
specvp12 catia-04 + NVIDIA Quadro P2000 Max-Q
64.5 fps (11%)
specvp12 3dsmax-05 + NVIDIA Quadro T1000 (Laptop) SPECviewperf 12 - specvp12 3dsmax-05
min: 85.5 avg: 93.8 median: 93.8 (16%) max: 102.1 fps
SPECviewperf 13 specvp13 sw-04 + NVIDIA Quadro T1000 (Laptop) SPECviewperf 13 - specvp13 sw-04
min: 89.2 avg: 99.7 median: 104.4 (28%) max: 105.6 fps
GPU TDP ? TDP 50 W 92% 100%
specvp13 sw-04 + NVIDIA Quadro P2000 Max-Q
72.8 fps (20%)
GPU TDP ? TDP 50 W 84% 100%
specvp13 sw-04 + NVIDIA T550 Laptop GPU
min: 95 avg: 98.8 median: 95.8 (26%) max: 105.68 fps
GPU TDP ? TDP 20 W TDP 30 W TDP 50 W 84% 90% 100% 100%
specvp13 snx-03 + NVIDIA Quadro T1000 (Laptop) SPECviewperf 13 - specvp13 snx-03
min: 127.8 avg: 136.4 median: 133.1 (15%) max: 148.4 fps
GPU TDP ? TDP 50 W 100% 96%
specvp13 snx-03 + NVIDIA Quadro P2000 Max-Q
102.9 fps (11%)
GPU TDP ? TDP 50 W 95% 100%
specvp13 snx-03 + NVIDIA T550 Laptop GPU
min: 95.8 avg: 101.7 median: 99.7 (11%) max: 109.67 fps
GPU TDP ? TDP 20 W TDP 30 W TDP 50 W 95% 73% 82% 100%
specvp13 showcase-02 + NVIDIA Quadro T1000 (Laptop) SPECviewperf 13 - specvp13 showcase-02
min: 35.27 avg: 40.4 median: 40.2 (9%) max: 45.71 fps
GPU TDP ? TDP 50 W 83% 100%
specvp13 showcase-02 + NVIDIA Quadro P2000 Max-Q
29.9 fps (7%)
GPU TDP ? TDP 50 W 77% 100%
specvp13 showcase-02 + NVIDIA T550 Laptop GPU
min: 24.8 avg: 26.1 median: 25.3 (6%) max: 28.06 fps
GPU TDP ? TDP 20 W TDP 30 W TDP 50 W 77% 55% 61% 100%
specvp13 medical-02 + NVIDIA Quadro T1000 (Laptop) SPECviewperf 13 - specvp13 medical-02
min: 33.45 avg: 41.7 median: 41.6 (9%) max: 50.1 fps
GPU TDP ? TDP 50 W 100% 100%
specvp13 medical-02 + NVIDIA Quadro P2000 Max-Q
16.2 fps (3%)
GPU TDP ? TDP 50 W 80% 100%
specvp13 medical-02 + NVIDIA T550 Laptop GPU
min: 34.5 avg: 37.2 median: 36.2 (8%) max: 40.74 fps
GPU TDP ? TDP 20 W TDP 30 W TDP 50 W 80% 85% 98% 100%
specvp13 maya-05 + NVIDIA Quadro T1000 (Laptop) SPECviewperf 13 - specvp13 maya-05
min: 101 avg: 109.6 median: 113.3 (13%) max: 114.6 fps
GPU TDP ? TDP 50 W 95% 100%
specvp13 maya-05 + NVIDIA Quadro P2000 Max-Q
81.4 fps (9%)
GPU TDP ? TDP 50 W 87% 100%
specvp13 maya-05 + NVIDIA T550 Laptop GPU
min: 77.5 avg: 82 median: 80.9 (9%) max: 87.57 fps
GPU TDP ? TDP 20 W TDP 30 W TDP 50 W 87% 70% 77% 100%
specvp13 energy-02 + NVIDIA Quadro T1000 (Laptop) SPECviewperf 13 - specvp13 energy-02
min: 12 avg: 15.1 median: 15.6 (5%) max: 17.8 fps
GPU TDP ? TDP 50 W 95% 100%
specvp13 energy-02 + NVIDIA Quadro P2000 Max-Q
5 fps (2%)
GPU TDP ? TDP 50 W 74% 100%
specvp13 energy-02 + NVIDIA T550 Laptop GPU
min: 11.7 avg: 12.4 median: 12 (4%) max: 13.37 fps
GPU TDP ? TDP 20 W TDP 30 W TDP 50 W 74% 76% 86% 100%
specvp13 creo-02 + NVIDIA Quadro T1000 (Laptop) SPECviewperf 13 - specvp13 creo-02
min: 99.9 avg: 108.6 median: 109.5 (16%) max: 116.3 fps
GPU TDP ? TDP 50 W 99% 100%
specvp13 creo-02 + NVIDIA Quadro P2000 Max-Q
74.1 fps (11%)
GPU TDP ? TDP 50 W 88% 100%
specvp13 creo-02 + NVIDIA T550 Laptop GPU
min: 82.4 avg: 86.2 median: 85.5 (13%) max: 90.66 fps
GPU TDP ? TDP 20 W TDP 30 W TDP 50 W 88% 77% 83% 100%
specvp13 catia-05 + NVIDIA Quadro T1000 (Laptop) SPECviewperf 13 - specvp13 catia-05
min: 121.3 avg: 130 median: 130.5 (15%) max: 138.3 fps
GPU TDP ? TDP 50 W 99% 100%
specvp13 catia-05 + NVIDIA Quadro P2000 Max-Q
96.4 fps (11%)
GPU TDP ? TDP 50 W 91% 100%
specvp13 catia-05 + NVIDIA T550 Laptop GPU
min: 104 avg: 110.4 median: 109 (12%) max: 118.22 fps
GPU TDP ? TDP 20 W TDP 30 W TDP 50 W 91% 82% 91% 100%
specvp13 3dsmax-06 + NVIDIA Quadro T1000 (Laptop) SPECviewperf 13 - specvp13 3dsmax-06
min: 83.9 avg: 94.8 median: 98.5 (17%) max: 101.9 fps
GPU TDP ? TDP 50 W 94% 100%
specvp13 3dsmax-06 + NVIDIA Quadro P2000 Max-Q
63.8 fps (11%)
GPU TDP ? TDP 50 W 84% 100%
specvp13 3dsmax-06 + NVIDIA T550 Laptop GPU
min: 61.6 avg: 63.7 median: 63 (11%) max: 66.38 fps
GPU TDP ? TDP 20 W TDP 30 W TDP 50 W 84% 63% 67% 100%
SPECviewperf 2020 specvp2020 solidworks-05 1080p + NVIDIA Quadro T1000 (Laptop) SPECviewperf 2020 - specvp2020 solidworks-05 1080p
78.8 fps (15%)
specvp2020 solidworks-05 1080p + NVIDIA T550 Laptop GPU
min: 46.3 avg: 54 median: 54.3 (11%) max: 61.38 fps
GPU TDP 20 W TDP 30 W TDP 50 W 64% 78% 100%
specvp2020 snx-04 1080p + NVIDIA Quadro T1000 (Laptop) SPECviewperf 2020 - specvp2020 snx-04 1080p
132.7 fps (22%)
specvp2020 snx-04 1080p + NVIDIA T550 Laptop GPU
min: 84 avg: 99.4 median: 99.3 (16%) max: 114.82 fps
GPU TDP 20 W TDP 30 W TDP 50 W 69% 87% 100%
specvp2020 medical-03 1080p + NVIDIA Quadro T1000 (Laptop) SPECviewperf 2020 - specvp2020 medical-03 1080p
19.2 fps (14%)
specvp2020 medical-03 1080p + NVIDIA T550 Laptop GPU
min: 13.5 avg: 15.6 median: 15.4 (11%) max: 17.87 fps
GPU TDP 20 W TDP 30 W TDP 50 W 75% 93% 100%
specvp2020 maya-06 1080p + NVIDIA Quadro T1000 (Laptop) SPECviewperf 2020 - specvp2020 maya-06 1080p
134.3 fps (20%)
specvp2020 maya-06 1080p + NVIDIA T550 Laptop GPU
min: 86.9 avg: 98.2 median: 98.1 (14%) max: 109.68 fps
GPU TDP 20 W TDP 30 W TDP 50 W 69% 82% 100%
specvp2020 energy-03 1080p + NVIDIA Quadro T1000 (Laptop) SPECviewperf 2020 - specvp2020 energy-03 1080p
15.6 fps (13%)
specvp2020 energy-03 1080p + NVIDIA T550 Laptop GPU
min: 10.6 avg: 12.1 median: 12 (10%) max: 13.56 fps
GPU TDP 20 W TDP 30 W TDP 50 W 72% 87% 100%
specvp2020 creo-03 1080p + NVIDIA Quadro T1000 (Laptop) SPECviewperf 2020 - specvp2020 creo-03 1080p
67.5 fps (33%)
specvp2020 creo-03 1080p + NVIDIA T550 Laptop GPU
min: 44.5 avg: 46.2 median: 45.7 (23%) max: 48.5 fps
GPU TDP 20 W TDP 30 W TDP 50 W 69% 68% 100%
specvp2020 catia-06 1080p + NVIDIA Quadro T1000 (Laptop) SPECviewperf 2020 - specvp2020 catia-06 1080p
33.6 fps (22%)
specvp2020 catia-06 1080p + NVIDIA T550 Laptop GPU
min: 22.4 avg: 25.6 median: 24.9 (16%) max: 29.58 fps
GPU TDP 20 W TDP 30 W TDP 50 W 70% 88% 100%
specvp2020 3dsmax-07 1080p + NVIDIA Quadro T1000 (Laptop) SPECviewperf 2020 - specvp2020 3dsmax-07 1080p
45.3 fps (21%)
specvp2020 3dsmax-07 1080p + NVIDIA T550 Laptop GPU
min: 28.3 avg: 30 median: 29.6 (13%) max: 32.03 fps
GPU TDP 20 W TDP 30 W TDP 50 W 64% 71% 100%
Cinebench R10 Cinebench R10 Shading (32bit) + NVIDIA Quadro T1000 (Laptop) Cinebench R10 - Cinebench R10 Shading (32bit)
6818 Points (5%)
Cinebench R10 Shading (32bit) + NVIDIA Quadro P2000 Max-Q
6820 Points (5%)
Cinebench R11.5 Cinebench R11.5 OpenGL 64 Bit + NVIDIA Quadro T1000 (Laptop) Cinebench R11.5 - Cinebench R11.5 OpenGL 64 Bit
124 fps (43%)
Cinebench R11.5 OpenGL 64 Bit + NVIDIA Quadro P2000 Max-Q
99.7 fps (35%)
Cinebench R15 + NVIDIA Quadro T1000 (Laptop) Cinebench R15 - Cinebench R15 OpenGL 64 Bit
min: 166 avg: 182.6 median: 185.7 (11%) max: 196 fps
GPU TDP ? TDP 50 W 90% 100%
Cinebench R15 OpenGL 64 Bit + NVIDIA Quadro P2000 Max-Q
137.9 fps (8%)
GPU TDP ? TDP 50 W 83% 100%
Cinebench R15 OpenGL 64 Bit + NVIDIA T550 Laptop GPU
min: 184.9 avg: 193 median: 189.2 (11%) max: 205 fps
GPU TDP ? TDP 20 W TDP 30 W TDP 50 W 80% 91% 100% 96%
Cinebench R15 OpenGL Ref. Match 64 Bit + NVIDIA Quadro T1000 (Laptop) Cinebench R15 - Cinebench R15 OpenGL Ref. Match 64 Bit
min: 99.6 avg: 99.7 median: 99.6 (100%) max: 100 %
GPU TDP ? TDP 50 W 100% 100%
Cinebench R15 OpenGL Ref. Match 64 Bit + NVIDIA Quadro P2000 Max-Q
99.6 % (100%)
GPU TDP ? TDP 50 W 100% 100%
Cinebench R15 OpenGL Ref. Match 64 Bit + NVIDIA T550 Laptop GPU
99.6 % (100%)
GPU TDP ? TDP 20 W TDP 30 W TDP 50 W 100% 100% 100% 100%
GFXBench - GFXBench 5.0 Aztec Ruins High Tier Offscreen
89.3 fps (16%)
19 fps (3%)
GPU TDP ? TDP 20 W 100% 21%
GFXBench - GFXBench 5.0 Aztec Ruins Normal Tier Offscreen
225.8 fps (17%)
43.5 fps (3%)
GPU TDP ? TDP 20 W 100% 19%
GFXBench - GFXBench Car Chase Offscreen
min: 145.6 avg: 154.9 median: 154.9 (17%) max: 164.2 fps
118.3 fps (13%)
GPU TDP ? TDP 20 W 100% 76%
GFXBench 3.1 - GFXBench Manhattan ES 3.1 Offscreen
min: 220.2 avg: 243.6 median: 243.6 (5%) max: 267 fps
172.6 fps (4%)
GPU TDP ? TDP 20 W 100% 71%
GFXBench 3.0 - GFXBench 3.0 Manhattan Offscreen
min: 269 avg: 315.3 median: 315.3 (18%) max: 361.6 fps
229.9 fps (13%)
GPU TDP ? TDP 20 W 100% 73%
GFXBench (DX / GLBenchmark) 2.7 + NVIDIA Quadro T1000 (Laptop) GFXBench (DX / GLBenchmark) 2.7 - GFXBench T-Rex HD Offscreen C24Z16
min: 575 avg: 660 median: 659.5 (5%) max: 744 fps
GFXBench T-Rex HD Offscreen C24Z16 + NVIDIA T550 Laptop GPU
449.9 fps (4%)
GPU TDP ? TDP 20 W 100% 68%
LuxMark v2.0 64Bit - LuxMark v2.0 Room GPU
min: 1375 avg: 1410 median: 1409.5 (6%) max: 1444 Samples/s
1277 Samples/s (6%)
LuxMark v2.0 64Bit - LuxMark v2.0 Sala GPU
min: 2567 avg: 2768 median: 2768 (5%) max: 2969 Samples/s
2617 Samples/s (5%)
ComputeMark v2.1 - ComputeMark v2.1 Result
min: 5376 avg: 5966 median: 5965.5 (6%) max: 6555 Points
5190 Points (6%)
GPU TDP ? TDP 20 W 100% 87%
Power Consumption - Furmark Stress Test Power Consumption - external Monitor *
88.8 Watt (13%)
72.1 Watt (10%)
min: 34.2 avg: 34.7 median: 34.7 (5%) max: 35.1 Watt
GPU TDP ? TDP 20 W 100% 107%
Power Consumption - The Witcher 3 Power Consumption - external Monitor *
93.8 Watt (13%)
min: 41.2 avg: 41.3 median: 41.3 (6%) max: 41.4 Watt
GPU TDP ? TDP 20 W 100% 108%
Power Consumption - Witcher 3 Power Consumption *
min: 83 avg: 89 median: 89 (20%) max: 95 Watt
GPU TDP ? TDP 50 W 103% 100%
77.9 Watt (17%)
GPU TDP ? TDP 50 W 104% 100%
min: 42.9 avg: 44.1 median: 44.1 (10%) max: 45.3 Watt
GPU TDP ? TDP 20 W TDP 50 W 104% 114% 100%
Power Consumption - Witcher 3 ultra Power Efficiency
min: 0.3684 avg: 0.4 median: 0.4 (41%) max: 0.4566 fps per Watt
GPU TDP ? TDP 50 W 100% 81%
0.3 fps per Watt (32%)
GPU TDP ? TDP 50 W 100% 95%
min: 0.4393 avg: 0.4 median: 0.4 (44%) max: 0.4569 fps per Watt
GPU TDP ? TDP 20 W TDP 50 W 87% 100% 82%
Power Consumption - Witcher 3 ultra Power Efficiency - external Monitor
0.4 fps per Watt (33%)
min: 0.4734 avg: 0.5 median: 0.5 (40%) max: 0.483 fps per Watt
GPU TDP ? TDP 20 W 85% 100%
Emissions Witcher 3 Fan Noise + NVIDIA Quadro T1000 (Laptop) Emissions - Witcher 3 Fan Noise
min: 36.9 avg: 37.3 median: 37.3 (60%) max: 37.7 dB(A)
GPU TDP ? TDP 50 W 98% 100%
Witcher 3 Fan Noise + NVIDIA Quadro P2000 Max-Q
39.1 dB(A) (63%)
GPU TDP ? TDP 50 W 100% 99%
Witcher 3 Fan Noise + NVIDIA T550 Laptop GPU
min: 38.2 avg: 40.4 median: 40.5 (65%) max: 42.5 dB(A)
GPU TDP ? TDP 20 W TDP 30 W TDP 50 W 89% 93% 100% 89%
Clock Speed - GPU Clock Witcher 3 ultra
1237 MHz (49%)
Clock Speed - GPU Clock Speed Furmark
1543 MHz (61%)
Average Benchmarks NVIDIA Quadro T1000 (Laptop) → 100% n=22 Average Benchmarks NVIDIA Quadro P2000 Max-Q → 71% n=22 Average Benchmarks NVIDIA T550 Laptop GPU → 75% n=22
- Range of benchmark values for this graphics card
- Average benchmark values for this graphics card
* Smaller numbers mean a higher performance
1 This benchmark is not used for the average calculation
Game Benchmarks The following benchmarks stem from our benchmarks of review laptops. The performance depends on the used graphics memory, clock rate, processor, system settings, drivers, and operating systems. So the results don't have to be representative for all laptops with this GPU. For detailed information on the benchmark results, click on the fps number.
100%
Quadro T1000 (Laptop):
190.9 fps
100%
Quadro T1000 (Laptop):
91.8 fps
100%
Quadro T1000 (Laptop):
58.4 fps
100%
Quadro T1000 (Laptop):
43.5 fps
100%
Quadro T1000 (Laptop):
150 fps
100%
Quadro T1000 (Laptop):
78 fps
100%
Quadro T1000 (Laptop):
64.3 fps
100%
Quadro T1000 (Laptop):
134.1 fps
100%
Quadro T1000 (Laptop):
51 fps
100%
Quadro T1000 (Laptop):
44.4 fps
100%
Quadro T1000 (Laptop):
121.4 fps
100%
Quadro T1000 (Laptop):
87.9 fps
100%
Quadro T1000 (Laptop):
67.8 fps
100%
Quadro T1000 (Laptop):
56 fps
100%
Quadro T1000 (Laptop):
87.9 fps
100%
Quadro T1000 (Laptop):
46.7 fps
100%
Quadro T1000 (Laptop):
29.9 fps
100%
Quadro T1000 (Laptop):
19.4 fps
100%
Quadro T1000 (Laptop):
67.3 fps
100%
Quadro T1000 (Laptop):
57.6 fps
100%
Quadro T1000 (Laptop):
50.4 fps
100%
Quadro T1000 (Laptop):
86 fps
100%
Quadro T1000 (Laptop):
60.5 fps
100%
Quadro T1000 (Laptop):
51.9 fps
100%
Quadro T1000 (Laptop):
46.9 fps
100%
Quadro T1000 (Laptop):
96.7 fps
100%
Quadro T1000 (Laptop):
61.2 fps
100%
Quadro T1000 (Laptop):
50.8 fps
100%
Quadro T1000 (Laptop):
44 fps
100%
Quadro T1000 (Laptop):
125.4 fps
100%
Quadro T1000 (Laptop):
76.8 fps
100%
Quadro T1000 (Laptop):
65.2 fps
100%
Quadro T1000 (Laptop):
42.8 fps
100%
Quadro T1000 (Laptop):
93 fps
100%
Quadro T1000 (Laptop):
53 fps
100%
Quadro T1000 (Laptop):
47 fps
100%
Quadro T1000 (Laptop):
32 fps
100%
Quadro T1000 (Laptop):
208 fps
100%
Quadro T1000 (Laptop):
171.3 fps
100%
Quadro T1000 (Laptop):
160.3 fps
100%
Quadro T1000 (Laptop):
148.9 fps
100%
Quadro T1000 (Laptop):
117.9 fps
100%
Quadro T1000 (Laptop):
58.7 fps
100%
Quadro T1000 (Laptop):
38 fps
100%
Quadro T1000 (Laptop):
28.5 fps
100%
Quadro T1000 (Laptop):
136.8 fps
100%
Quadro T1000 (Laptop):
42.4 fps
100%
Quadro T1000 (Laptop):
31.2 fps
100%
Quadro T1000 (Laptop):
118 178 ~ 148 fps
100%
Quadro T1000 (Laptop):
73 105 ~ 89 fps
100%
Quadro T1000 (Laptop):
61 92 ~ 77 fps
100%
Quadro T1000 (Laptop):
49 79 ~ 64 fps
100%
Quadro T1000 (Laptop):
182.3 189 ~ 186 fps
100%
Quadro T1000 (Laptop):
60.4 62.5 ~ 61 fps
100%
Quadro T1000 (Laptop):
37.5 39.1 ~ 38 fps
100%
Quadro T1000 (Laptop):
24.7 25.6 ~ 25 fps
100%
Quadro T1000 (Laptop):
123.7 fps
100%
Quadro T1000 (Laptop):
55.2 fps
100%
Quadro T1000 (Laptop):
45.7 fps
100%
Quadro T1000 (Laptop):
45.1 fps
100%
Quadro T1000 (Laptop):
69.6 94.5 ~ 82 fps
100%
Quadro T1000 (Laptop):
52.8 73.4 ~ 63 fps
100%
Quadro T1000 (Laptop):
37.2 45.2 ~ 41 fps
100%
Quadro T1000 (Laptop):
20 23.1 ~ 22 fps
100%
Quadro T1000 (Laptop):
111 fps
100%
Quadro T1000 (Laptop):
39 61 ~ 50 fps
100%
Quadro T1000 (Laptop):
36 48 ~ 42 fps
100%
Quadro T1000 (Laptop):
29 35 ~ 32 fps
100%
Quadro T1000 (Laptop):
80.7 100.5 ~ 91 fps
100%
Quadro T1000 (Laptop):
63.7 79.4 ~ 72 fps
100%
Quadro T1000 (Laptop):
36.3 42.5 ~ 39 fps
100%
Quadro T1000 (Laptop):
77 fps
100%
Quadro T1000 (Laptop):
48 fps
100%
Quadro T1000 (Laptop):
46 fps
100%
Quadro T1000 (Laptop):
43 fps
100%
Quadro T1000 (Laptop):
93.3 fps
100%
Quadro T1000 (Laptop):
43.4 fps
100%
Quadro T1000 (Laptop):
31.9 fps
100%
Quadro T1000 (Laptop):
25.5 fps
100%
Quadro T1000 (Laptop):
143.7 144 ~ 144 fps
100%
Quadro T1000 (Laptop):
73.8 92.7 ~ 83 fps
100%
Quadro T1000 (Laptop):
57.8 69 ~ 63 fps
100%
Quadro T1000 (Laptop):
55.9 68.7 ~ 62 fps
100%
Quadro T1000 (Laptop):
61.5 138.1 ~ 100 fps
100%
Quadro T1000 (Laptop):
43.2 76.5 ~ 60 fps
100%
Quadro T1000 (Laptop):
37.8 66.6 ~ 52 fps
100%
Quadro T1000 (Laptop):
35 59.4 ~ 47 fps
100%
Quadro T1000 (Laptop):
182.4 fps
100%
Quadro T1000 (Laptop):
106.7 fps
100%
Quadro T1000 (Laptop):
86.3 fps
100%
Quadro T1000 (Laptop):
66.5 fps
100%
Quadro T1000 (Laptop):
57 82 ~ 70 fps
100%
Quadro T1000 (Laptop):
40 55 ~ 48 fps
100%
Quadro T1000 (Laptop):
35 50 ~ 43 fps
100%
Quadro T1000 (Laptop):
29 29 ~ 29 fps
100%
Quadro T1000 (Laptop):
148 fps
100%
Quadro T1000 (Laptop):
119.2 fps
100%
Quadro T1000 (Laptop):
113.5 fps
100%
Quadro T1000 (Laptop):
110.8 fps
100%
Quadro T1000 (Laptop):
88 101 111 ~ 100 fps
79%
Quadro P2000 Max-Q:
79 fps
100%
Quadro T1000 (Laptop):
46 56.7 58 ~ 54 fps
61%
Quadro P2000 Max-Q:
33 fps
100%
Quadro T1000 (Laptop):
40 50 54.1 ~ 48 fps
63%
Quadro P2000 Max-Q:
30 fps
100%
Quadro T1000 (Laptop):
35 45 46 ~ 42 fps
55%
Quadro P2000 Max-Q:
23 fps
Quadro P2000 Max-Q:
118 fps
Quadro P2000 Max-Q:
72 fps
Quadro P2000 Max-Q:
72 fps
Quadro P2000 Max-Q:
40 fps
Quadro P2000 Max-Q:
24 fps
100%
Quadro T1000 (Laptop):
107 fps
70%
T550 Laptop GPU:
75 fps
100%
Quadro T1000 (Laptop):
62 fps
66%
T550 Laptop GPU:
41 fps
100%
Quadro T1000 (Laptop):
57 fps
67%
T550 Laptop GPU:
38 fps
100%
Quadro T1000 (Laptop):
53 fps
66%
T550 Laptop GPU:
35 fps
100%
Quadro T1000 (Laptop):
491.9 fps
100%
Quadro T1000 (Laptop):
199.3 fps
100%
Quadro T1000 (Laptop):
77.1 fps
100%
Quadro T1000 (Laptop):
79.7 91 108 ~ 93 fps
100%
Quadro T1000 (Laptop):
66.2 78 96 ~ 80 fps
100%
Quadro T1000 (Laptop):
93.7 fps
100%
Quadro T1000 (Laptop):
49.3 fps
100%
Quadro T1000 (Laptop):
40.5 fps
100%
Quadro T1000 (Laptop):
30.7 fps
100%
Quadro T1000 (Laptop):
56.1 77.4 ~ 67 fps
100%
Quadro T1000 (Laptop):
41.9 49.2 ~ 46 fps
100%
Quadro T1000 (Laptop):
31.1 34 ~ 33 fps
Quadro P2000 Max-Q:
67 fps
Quadro P2000 Max-Q:
49 fps
Quadro P2000 Max-Q:
38 fps
Quadro P2000 Max-Q:
29 fps
Quadro P2000 Max-Q:
13 fps
100%
Quadro T1000 (Laptop):
246.4 fps
100%
Quadro T1000 (Laptop):
150.7 fps
100%
Quadro T1000 (Laptop):
117 fps
Quadro P2000 Max-Q:
140 fps
Quadro P2000 Max-Q:
111 fps
Quadro P2000 Max-Q:
109 fps
Quadro P2000 Max-Q:
109 fps
Quadro P2000 Max-Q:
36 fps
100%
Quadro T1000 (Laptop):
94 fps
100%
Quadro T1000 (Laptop):
47.2 fps
100%
Quadro T1000 (Laptop):
43.9 fps
100%
Quadro T1000 (Laptop):
24.2 fps
100%
Quadro T1000 (Laptop):
66.7 77.5 ~ 72 fps
100%
Quadro T1000 (Laptop):
63.9 74.3 ~ 69 fps
100%
Quadro T1000 (Laptop):
48.8 56.7 ~ 53 fps
Quadro P2000 Max-Q:
70 fps
Quadro P2000 Max-Q:
53 fps
Quadro P2000 Max-Q:
31 fps
Quadro P2000 Max-Q:
16 fps
Quadro P2000 Max-Q:
10 fps
Quadro P2000 Max-Q:
103 fps
Quadro P2000 Max-Q:
104 fps
Quadro P2000 Max-Q:
63 fps
Quadro P2000 Max-Q:
61 fps
Quadro P2000 Max-Q:
20 fps
Quadro P2000 Max-Q:
54.5 fps
Quadro P2000 Max-Q:
39.6 fps
Quadro P2000 Max-Q:
34.9 fps
Quadro P2000 Max-Q:
13 fps
100%
Quadro T1000 (Laptop):
136.2 fps
32%
Quadro P2000 Max-Q:
44 fps
100%
Quadro T1000 (Laptop):
86 fps
47%
Quadro P2000 Max-Q:
40 fps
100%
Quadro T1000 (Laptop):
53.4 fps
67%
Quadro P2000 Max-Q:
36 fps
100%
Quadro T1000 (Laptop):
43.8 fps
73%
Quadro P2000 Max-Q:
32 fps
Quadro P2000 Max-Q:
15 fps
100%
Quadro T1000 (Laptop):
97.9 117.9 ~ 108 fps
Quadro P2000 Max-Q:
60 fps
Quadro P2000 Max-Q:
60 fps
Quadro P2000 Max-Q:
60 fps
Quadro P2000 Max-Q:
60 fps
Quadro P2000 Max-Q:
28 fps
100%
Quadro T1000 (Laptop):
47.9 fps
Quadro P2000 Max-Q:
100 fps
Quadro P2000 Max-Q:
92 fps
Quadro P2000 Max-Q:
59 fps
Quadro P2000 Max-Q:
58 fps
Quadro P2000 Max-Q:
17 fps
59%
Quadro P2000 Max-Q:
106 fps
68%
Quadro P2000 Max-Q:
73 fps
69%
T550 Laptop GPU:
73 75 78 ~ 75 fps
54%
Quadro P2000 Max-Q:
32 fps
69%
T550 Laptop GPU:
39 40 43 ~ 41 fps
71%
Quadro P2000 Max-Q:
25 fps
Quadro P2000 Max-Q:
12 fps
Quadro P2000 Max-Q:
234 fps
Quadro P2000 Max-Q:
131 fps
Quadro P2000 Max-Q:
88 fps
Quadro P2000 Max-Q:
73 fps
Quadro P2000 Max-Q:
49 fps
100%
Quadro T1000 (Laptop):
170.1 fps
100%
Quadro T1000 (Laptop):
153.9 fps
100%
Quadro T1000 (Laptop):
93.8 fps
100%
Quadro T1000 (Laptop):
41.7 fps
Quadro P2000 Max-Q:
57 fps
Quadro P2000 Max-Q:
54 fps
Quadro P2000 Max-Q:
51 fps
Quadro P2000 Max-Q:
44 fps
Quadro P2000 Max-Q:
241 fps
Quadro P2000 Max-Q:
177 fps
Quadro P2000 Max-Q:
142 fps
Quadro P2000 Max-Q:
21 fps
Quadro P2000 Max-Q:
72 fps
Quadro P2000 Max-Q:
65 fps
Quadro P2000 Max-Q:
54 fps
Quadro P2000 Max-Q:
27 fps
Quadro P2000 Max-Q:
194 fps
Quadro P2000 Max-Q:
132 fps
Quadro P2000 Max-Q:
117 fps
Quadro P2000 Max-Q:
85 fps
Quadro P2000 Max-Q:
122 fps
Quadro P2000 Max-Q:
111 fps
Quadro P2000 Max-Q:
84 fps
Quadro P2000 Max-Q:
46 fps
89%
Quadro P2000 Max-Q:
264 fps
100%
Quadro T1000 (Laptop):
210 241 ~ 226 fps
85%
Quadro P2000 Max-Q:
192 fps
84%
Quadro P2000 Max-Q:
168 fps
100%
Quadro T1000 (Laptop):
72.9 86.6 ~ 80 fps
81%
Quadro P2000 Max-Q:
65 fps
Quadro P2000 Max-Q:
197 fps
Quadro P2000 Max-Q:
135 fps
Quadro P2000 Max-Q:
133 fps
Quadro P2000 Max-Q:
46 fps
Average Gaming NVIDIA Quadro T1000 (Laptop) → 100% Average Gaming 30-70 fps → 100%
Average Gaming NVIDIA Quadro P2000 Max-Q → 67% Average Gaming 30-70 fps → 59%
Average Gaming NVIDIA T550 Laptop GPU → 73% Average Gaming 30-70 fps → 73%
NVIDIA T550 Laptop GPU low med. high ultra QHD 4K F1 22 69 62 43 31 F1 2021 153 74 59 37 Strange Brigade 131 52 42 36 Far Cry 5 75 41 38 35 X-Plane 11.11 70 63 57 Final Fantasy XV Benchmark 62 31 22 Dota 2 Reborn 117 105 95 88 The Witcher 3 128 75 41 21 GTA V 116 114 62 29 < 30 fps < 60 fps < 120 fps ≥ 120 fps 6 3 3 6 1 6 2 2 4 1
NVIDIA Quadro P2000 Max-Q low med. high ultra QHD 4K Shadow of the Tomb Raider 79 33 30 23 3 F1 2018 118 72 72 40 24 Middle-earth: Shadow of War 67 49 38 29 13 Prey 140 111 109 109 36 Deus Ex Mankind Divided 70 53 31 16 10 Doom 103 104 63 61 20 Ashes of the Singularity 54.5 39.6 34.9 13 Rise of the Tomb Raider 44 40 36 32 15 Metal Gear Solid V 60 60 60 60 28 Batman: Arkham Knight 100 92 59 58 17 The Witcher 3 106 73 32 25 12 Dirt Rally 234 131 88 73 49 Thief 57 54 51 44 Total War: Rome II 241 177 142 21 Company of Heroes 2 72 65 54 27 GRID 2 194 132 117 85 Metro: Last Light 122 111 84 46 BioShock Infinite 264 192 168 65 Sleeping Dogs 197 135 133 46 < 30 fps < 60 fps < 120 fps ≥ 120 fps 3 9 7 6 8 5 9 7 3 6 6 6 10 2
For more games that might be playable and a list of all games and graphics cards visit our Gaming List
v1.26
log 04. 13:31:44
#0 checking url part for id 9860 +0s ... 0s
#1 checking url part for id 9044 +0s ... 0s
#2 checking url part for id 11429 +0s ... 0s
#3 not redirecting to Ajax server +0s ... 0s
#4 did not recreate cache, as it is less than 5 days old! Created at Sat, 04 May 2024 05:42:18 +0200 +0.001s ... 0.001s
#5 composed specs +0.182s ... 0.183s
#6 did output specs +0s ... 0.183s
#7 start showIntegratedCPUs +0s ... 0.183s
#8 getting avg benchmarks for device 9860 +0.053s ... 0.236s
#9 got single benchmarks 9860 +0.024s ... 0.26s
#10 getting avg benchmarks for device 9044 +0.017s ... 0.277s
#11 got single benchmarks 9044 +0.009s ... 0.285s
#12 getting avg benchmarks for device 11429 +0.002s ... 0.287s
#13 got single benchmarks 11429 +0.018s ... 0.305s
#14 got avg benchmarks for devices +0s ... 0.305s
#15 min, max, avg, median took s +0.503s ... 0.808s
#16 before gaming benchmark output +0s ... 0.808s
#17 Got 414 rows for game benchmarks. +0.052s ... 0.86s
#18 composed SQL query for gamebenchmarks +0s ... 0.86s
#19 got data and put it in $dataArray +0.045s ... 0.905s
#20 benchmarks composed for output. +0.143s ... 1.048s
#21 calculated avg scores. +0s ... 1.048s
#22 return log +0.003s ... 1.051s
Please share our article, every link counts!
Redaktion, 2017-09- 8 (Update: 2023-07- 1)
 Deutsch
 English
 Español
 Français
 Italiano
 Nederlands
 Polski
 Português
 Русский
 Türkçe
 Svenska
 Chinese
 Magyar