Notebookcheck Logo

NVIDIA Quadro RTX 6000 (Laptop) vs NVIDIA RTX 500 Ada Generation Laptop vs NVIDIA Quadro T1000 (Laptop)

NVIDIA Quadro RTX 6000 (Laptop)

► remove from comparison NVIDIA Quadro RTX 6000 (Laptop)

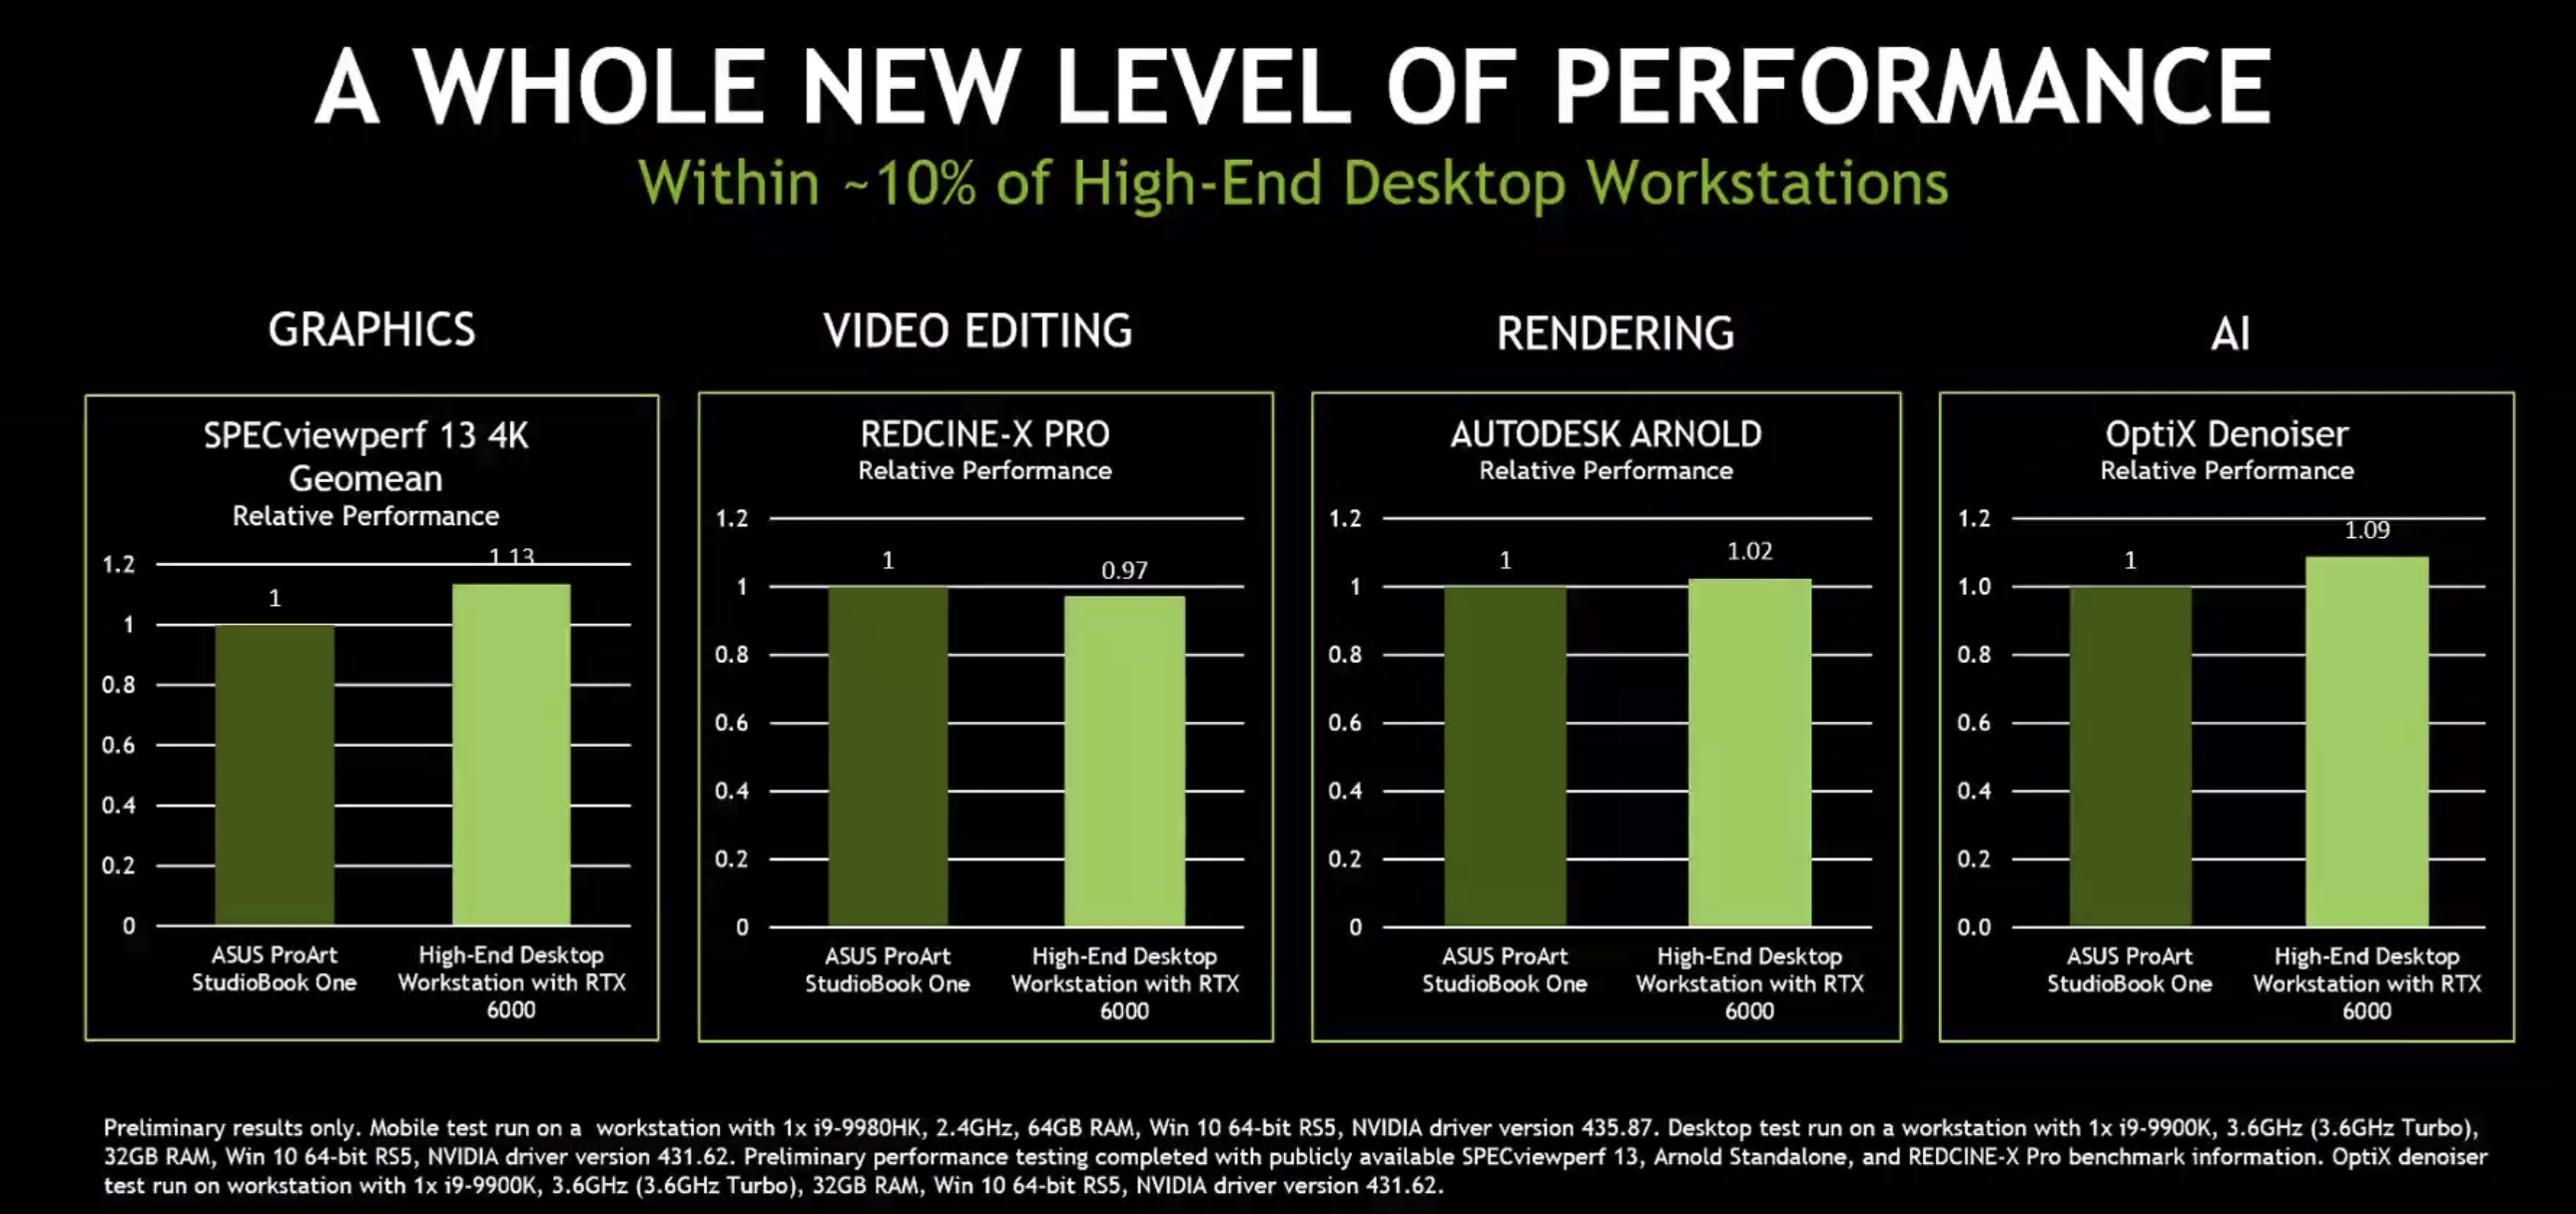
The Nvidia Quadro RTX 6000 for laptops is a professional high-end graphics card for big and powerful laptops and mobile workstations. It is based on the same TU102 chip as the consumer GeForce RTX 2080 Ti. Compared to the desktop RTX 6000, the mobile variant offers lower clock speeds.

The Quadro GPUs offer certified drivers, which are optimized for stability and performance in professional applications (CAD, DCC, medical, prospection, and visualizing applications). The performance in these areas is therefore much better compared to corresponding consumer GPUs.

Features

NVIDIA manufacturers the TU102 chip on a 12 nm FinFET process and includes features like Deep Learning Super Sampling (DLSS) and Real-Time Ray Tracing (RTRT), which should combine to create more realistic lighting effects than older GPUs based on the company's Pascal architecture (if the games support it). The Quadro RTX 6000 is also DisplayPort 1.4 ready, while there is also support for HDMI 2.0b, HDR, Simultaneous Multi-Projection (SMP) and H.265 video en/decoding (PlayReady 3.0).

Performance

Due to the lower clock speeds, the mobile RTX 6000 lags slightly behind the desktop version with the same name. Nvidia states for example that a desktop system using the RTX 6000 is on average 13% faster in the SPECviewperf13 4k benchmark.

Due to the extremely high power consumption of 200 Watt (TDP), the mobile Quadro RTX 6000 needs an excellent cooling solution and will be used only in big laptops.

NVIDIA RTX 500 Ada Generation Laptop

► remove from comparison NVIDIA RTX 500 Ada Generation Laptop

The Nvidia RTX 500 Ada Generation, not to be confused with the A500, P500 and the T500, is a lower-end professional graphics card for use in laptops that sports 2,048 CUDA cores and a paltry 4 GB of GDDR6 VRAM. We believe this graphics card to be a heavily cut-down GeForce RTX 4050 Laptop; therefore, both should employ the Ada Lovelace AD107 chip built with TSMC's 5 nm process. The RTX 500 was launched in February 2024. The Nvidia-recommended TGP range for this graphics card is moderately wide at 35 W to 60 W [the second figure includes the Dynamic Boost, it seems] leading to noticeable performance differences between different systems powered by what is supposed to be the same graphics card.

Quadro series graphics cards ship with much different BIOS and drivers than GeForce cards and are targeted at professional users rather than gamers. Commercial product design, large-scale calculations, simulation, data mining, 24 x 7 operation, certified drivers - if any of this sounds familiar, then a Quadro card will make you happy.

Architecture and Features

Ada Lovelace brings a range of improvements over older graphics cards utilizing the outgoing Ampere architecture. It's not just a better manufacturing process and a higher number of CUDA cores that we have here; under-the-hood refinements are plentiful, including an immensely larger L2 cache, an optimized ray tracing routine (a different way to determine what is transparent and what isn't is used), and other changes. Naturally, these graphics cards can both encode and decode some of the most widely used video codecs, AVC, HEVC and AV1 included; they also support a host of proprietary Nvidia technologies, including Optimus and DLSS 3, and they can certainly be used for various AI applications.

The RTX 500 Ada features 16 RT cores of the 3rd generation, 64 Tensor cores of the 4th generation and 2,048 CUDA cores. Increase those numbers by 25%, and you get the RTX 1000 Ada - as long as we pay no attention to clock speed differences, of course. Unlike costlier Ada Generation professional laptop graphics cards, the RTX 500 comes with just 4 GB of non-ECC VRAM; the lack of error correction makes this card less suitable for super-important tasks and round-the-clock operation. The VRAM is just 64-bit wide, delivering an anemic bandwidth of ~128 GB/s.

The RTX 500 Ada Generation makes use of the PCI-Express 4 protocol, just like Ampere-based cards did. 8K SUHD monitors are supported, however, DP 1.4a video outputs may prove to be a bottleneck down the line.

Performance

At 50 W (35 W + 15 W Dynamic Boost), the graphics card can handle most 2023 and 2024 games like Baldur's Gate 3 at 1080p on high graphics settings. With a Geekbench 6.2 OpenCL GPU score of 61,500 points and a Blender v3.3 Classroom CUDA score of 71 seconds, it's clear the Ada is so much faster than any integrated GPUs on the market including the 890M.

Power consumption

With the latest Nvidia graphics cards, laptop makers are free to set the TGP according to their needs within a fairly wide range. With the RTX 500 Ada, we have the lowest value recommended sitting at just at 35 W while the highest value is 60 W [this most likely includes Dynamic Boost]. Real-world performance of the slowest RTX 500 Ada will probably be around 40% lower than that of the fastest one.

Last but not the least, the improved 5 nm process (TSMC 4N) the AD107 chip is built with makes for decent energy efficiency, as of early 2024.

NVIDIA Quadro T1000 (Laptop)

► remove from comparison NVIDIA Quadro T1000 (Laptop)

The Nvidia Quadro T1000 for laptops is a professional mobile graphics card that is based on the Turing architecture (TU117 chip). Compared to the consumer GTX 1650, the Quadro T1000 features less CUDA cores / shaders (768 versus 896). The Quadro T2000 uses the same TU117 chip, but features all 1024 cores (2x to the T1000) and is therefore significantly faster. The chip is manufactured in 12nm FinFET at TSMC. 

The Turing generation did not only introduce raytracing for the RTX cards, but also optimized the architecture of the cores and caches. According to Nvidia the CUDA cores offer now a concurrent execution of floating point and integer operations for increased performance in compute-heavy workloads of modern games. Furthermore, the caches were reworked (new unified memory architecture with twice the cache compared to Pascal). This leads to up to 50% more instructions per clock and a 40% more power efficient usage compared to Pascal. In contrary to the faster Quadro RTX cards, the T1000 and T2000 don not feature raytracing and Tensor cores.

NVIDIA Quadro RTX 6000 (Laptop)NVIDIA RTX 500 Ada Generation LaptopNVIDIA Quadro T1000 (Laptop)
Quadro Turing Series
Quadro RTX 6000 (Laptop) 4608 @ 1.28 - 1.46 GHz384 Bit @ 14000 MHz
Quadro RTX 5000 (Laptop) 3072 @ 1.04 - 1.55 GHz256 Bit @ 14000 MHz
Quadro RTX 5000 Max-Q 3072 @ 0.6 - 1.35 GHz256 Bit @ 14000 MHz
Quadro RTX 4000 (Laptop) 2560 @ 1.11 - 1.56 GHz256 Bit @ 14000 MHz
Quadro RTX 4000 Max-Q 2560 @ 0.78 - 1.38 GHz256 Bit @ 14000 MHz
Quadro RTX 3000 (Laptop) 1920 @ 0.95 - 1.38 GHz192 Bit @ 14000 MHz
Quadro RTX 3000 Max-Q 1920 @ 0.6 - 1.22 GHz192 Bit @ 14000 MHz
Quadro T2000 (Laptop) 1024 @ 1.58 - 1.79 GHz128 Bit @ 8000 MHz
Quadro T2000 Max-Q 1024 @ 0.93 - 1.5 GHz128 Bit @ 8000 MHz
Quadro T1000 (Laptop) 768 @ 1.4 - 1.46 GHz128 Bit @ 8000 MHz
T1000 896 @ 1.07 - 1.4 GHz128 Bit @ 10000 MHz
T1200 Laptop GPU 1024 @ 0.86 - 1.43 GHz128 Bit @ 10000 MHz
Quadro T1000 Max-Q 768 @ 0.8 - 1.46 GHz128 Bit @ 8000 MHz
T600 Laptop GPU 896 @ 1.4 GHz128 Bit @ 10000 MHz
T550 Laptop GPU 1024 @ 1.07 - 1.67 GHz64 Bit @ 12000 MHz
T500 Laptop GPU 896 @ 1.37 - 1.7 GHz64 Bit @ 10000 MHz
T600 640 @ 0.74 - 1.34 GHz128 Bit @ 10000 MHz
RTX 5000 Ada Generation Laptop 9728 @ 0.93 - 1.68 GHz256 Bit @ 20000 MHz
RTX 4000 Ada Generation Laptop 7424 192 Bit @ 16000 MHz
RTX 3500 Ada Generation Laptop 5120 192 Bit @ 16000 MHz
RTX 3000 Ada Generation Laptop 4608 128 Bit @ 16000 MHz
RTX 2000 Ada Generation Laptop 3072 128 Bit @ 16000 MHz
RTX 1000 Ada Generation Laptop 2560 96 Bit @ 16000 MHz
RTX 500 Ada Generation Laptop 2048 @ 1.49 - 2.03 GHz64 Bit @ 12000 MHz
Quadro RTX 6000 (Laptop) 4608 @ 1.28 - 1.46 GHz384 Bit @ 14000 MHz
Quadro RTX 5000 (Laptop) 3072 @ 1.04 - 1.55 GHz256 Bit @ 14000 MHz
Quadro RTX 5000 Max-Q 3072 @ 0.6 - 1.35 GHz256 Bit @ 14000 MHz
Quadro RTX 4000 (Laptop) 2560 @ 1.11 - 1.56 GHz256 Bit @ 14000 MHz
Quadro RTX 4000 Max-Q 2560 @ 0.78 - 1.38 GHz256 Bit @ 14000 MHz
Quadro RTX 3000 (Laptop) 1920 @ 0.95 - 1.38 GHz192 Bit @ 14000 MHz
Quadro RTX 3000 Max-Q 1920 @ 0.6 - 1.22 GHz192 Bit @ 14000 MHz
Quadro T2000 (Laptop) 1024 @ 1.58 - 1.79 GHz128 Bit @ 8000 MHz
Quadro T2000 Max-Q 1024 @ 0.93 - 1.5 GHz128 Bit @ 8000 MHz
Quadro T1000 (Laptop) 768 @ 1.4 - 1.46 GHz128 Bit @ 8000 MHz
T1000 896 @ 1.07 - 1.4 GHz128 Bit @ 10000 MHz
T1200 Laptop GPU 1024 @ 0.86 - 1.43 GHz128 Bit @ 10000 MHz
Quadro T1000 Max-Q 768 @ 0.8 - 1.46 GHz128 Bit @ 8000 MHz
T600 Laptop GPU 896 @ 1.4 GHz128 Bit @ 10000 MHz
T550 Laptop GPU 1024 @ 1.07 - 1.67 GHz64 Bit @ 12000 MHz
T500 Laptop GPU 896 @ 1.37 - 1.7 GHz64 Bit @ 10000 MHz
T600 640 @ 0.74 - 1.34 GHz128 Bit @ 10000 MHz
CodenameTU102N19P-Q1
ArchitectureTuringAda LovelaceTuring
Pipelines4608 - unified2048 - unified768 - unified
Core Speed1275 - 1455 (Boost) MHz1485 - 2025 (Boost) MHz1395 - 1455 (Boost) MHz
Memory Speed14000 MHz12000 effective = 1500 MHz8000 MHz
Memory Bus Width384 Bit64 Bit128 Bit
Memory TypeGDDR6GDDR6GDDR5
Max. Amount of Memory24 GB4 GB4 GB
Shared Memorynonono
APIDirectX 12_1, OpenGL 4.6DirectX 12 Ultimate, Shader 6.7, OpenGL 4.6, OpenCL 3.0, Vulkan 1.3DirectX 12_1, OpenGL 4.6
Power Consumption200 Watt60 Watt (35 - 60 Watt TGP)50 Watt
Transistors18.6 Billion
technology12 nm5 nm12 nm
FeaturesNVLink, DLSS, Raytraycing, VR Ready, G-SYNC, Vulkan, Multi Monitor
Notebook Sizelargemedium sizedmedium sized
Date of Announcement04.09.2019 27.02.2024 27.05.2019
TMUs64
ROPs32
Raytracing Cores16
Tensor / AI Cores64
AI GPU154 TOPS INT8
CacheL1: 2 MB, L2: 12 MB
Memory Bandwidth128 GB/s
PCIe4.0 x16
Displays4 Displays (max.), HDMI 2.1, DisplayPort 1.4a
Link to Manufacturer Pageimages.nvidia.com

Benchmarks

Performance Rating - 3DMark 11 + Fire Strike + Time Spy - Quadro T1000 (Laptop)
3.3 pt (10%)
Restrict / Search: Model: Max. age: years
3DMark - 3DMark Steel Nomad
981 Points (7%)
3DMark - 3DMark Steel Nomad Light
5441 Points (12%)
3DMark - 3DMark Wild Life Extreme Unlimited
10353 Points (12%)
3DMark - 3DMark Fire Strike Standard Score
min: 12761     avg: 13178     median: 13177.5 (20%)     max: 13594 Points
min: 6812     avg: 7589     median: 7783 (12%)     max: 8173 Points
3DMark - 3DMark Fire Strike Standard Graphics
min: 14136     avg: 14610     median: 14610 (13%)     max: 15084 Points
min: 7558     avg: 8347     median: 8727 (8%)     max: 8757 Points
3DMark - 3DMark Ice Storm Graphics
min: 86096     avg: 111211     median: 111211 (12%)     max: 136326 Points
3DMark - 3DMark Time Spy Score
11084 Points (29%)
min: 5745     avg: 5902     median: 5902 (16%)     max: 6059 Points
min: 3006     avg: 3348     median: 3474 (9%)     max: 3565 Points
3DMark - 3DMark Time Spy Graphics
min: 5278     avg: 5449     median: 5448.5 (11%)     max: 5619 Points
min: 2834     avg: 3123     median: 3261 (7%)     max: 3273 Points
3DMark - 3DMark Ice Storm Unlimited Graphics
375510 Points (38%)
3DMark - 3DMark Ice Storm Extreme Graphics
122046 Points (14%)
3DMark - 3DMark Cloud Gate Score
47157 Points (45%)
min: 23601     avg: 25273     median: 25273 (24%)     max: 26945 Points
3DMark - 3DMark Cloud Gate Graphics
92300 Points (23%)
min: 48965     avg: 53629     median: 53628.5 (13%)     max: 58292 Points
3DMark 11 - 3DM11 Performance Score
min: 20365     avg: 20396     median: 20395.5 (25%)     max: 20426 Points
min: 10211     avg: 11241     median: 11592 (14%)     max: 11919 Points
3DMark 11 - 3DM11 Performance GPU
min: 20239     avg: 20464     median: 20463.5 (16%)     max: 20688 Points
min: 10407     avg: 11305     median: 11377 (9%)     max: 12132 Points
3DMark Vantage
3DM Vant. Perf. total + NVIDIA RTX 500 Ada Generation Laptop
3DMark Vantage - 3DM Vant. Perf. total
66297 Points (19%)
3DM Vant. Perf. total + NVIDIA Quadro T1000 (Laptop)
31509 Points (9%)
3DM Vant. Perf. GPU no PhysX + NVIDIA RTX 500 Ada Generation Laptop
3DMark Vantage - 3DM Vant. Perf. GPU no PhysX
64680 Points (35%)
3DM Vant. Perf. GPU no PhysX + NVIDIA Quadro T1000 (Laptop)
33740 Points (18%)
3DMark 06 3DMark 06 - Standard 1280x1024 + NVIDIA RTX 500 Ada Generation Laptop
3DMark 06
50935 Points (67%)
3DMark 06 - Standard 1280x1024 + NVIDIA Quadro T1000 (Laptop)
min: 33809     avg: 35034     median: 35033.5 (46%)     max: 36258 Points
Unigine Valley 1.0 - Unigine Valley 1.0 DX
59.2 fps (18%)
min: 36.7     avg: 39.3     median: 39.3 (12%)     max: 41.9 fps
Unigine Heaven 3.0 - Unigine Heaven 3.0 DX 11
110.3 fps (37%)
Unigine Heaven 3.0 - Unigine Heaven 3.0 OpenGL
101.1 fps (45%)
Unigine Heaven 2.1 - Heaven 2.1 high
min: 136.9     avg: 149.7     median: 149.7 (28%)     max: 162.4 fps
Blender - Blender 3.3 Classroom CUDA *
min: 71     avg: 71.5     median: 71.5 (11%)     max: 72 Seconds
Blender - Blender 3.3 Classroom OPTIX *
min: 39     avg: 41     median: 41 (15%)     max: 43 Seconds
SPECviewperf 12
specvp12 sw-03 + NVIDIA RTX 500 Ada Generation Laptop
SPECviewperf 12 - specvp12 sw-03
92 fps (23%)
specvp12 sw-03 + NVIDIA Quadro T1000 (Laptop)
113.8 fps (28%)
specvp12 snx-02 + NVIDIA RTX 500 Ada Generation Laptop
SPECviewperf 12 - specvp12 snx-02
144 fps (21%)
specvp12 snx-02 + NVIDIA Quadro T1000 (Laptop)
82.7 fps (12%)
specvp12 showcase-01 + NVIDIA RTX 500 Ada Generation Laptop
SPECviewperf 12 - specvp12 showcase-01
57.6 fps (10%)
specvp12 showcase-01 + NVIDIA Quadro T1000 (Laptop)
40.3 fps (7%)
specvp12 mediacal-01 + NVIDIA RTX 500 Ada Generation Laptop
SPECviewperf 12 - specvp12 mediacal-01
51.8 fps (13%)
specvp12 mediacal-01 + NVIDIA Quadro T1000 (Laptop)
min: 24.99     avg: 29.9     median: 29.9 (8%)     max: 34.8 fps
specvp12 maya-04 + NVIDIA RTX 500 Ada Generation Laptop
SPECviewperf 12 - specvp12 maya-04
131.7 fps (36%)
specvp12 maya-04 + NVIDIA Quadro T1000 (Laptop)
min: 47.5     avg: 56.3     median: 56.3 (15%)     max: 65.1 fps
specvp12 energy-01 + NVIDIA RTX 500 Ada Generation Laptop
SPECviewperf 12 - specvp12 energy-01
1.8 fps (2%)
specvp12 energy-01 + NVIDIA Quadro T1000 (Laptop)
min: 5.79     avg: 6.8     median: 6.8 (6%)     max: 7.9 fps
specvp12 creo-01 + NVIDIA RTX 500 Ada Generation Laptop
SPECviewperf 12 - specvp12 creo-01
121.6 fps (49%)
specvp12 creo-01 + NVIDIA Quadro T1000 (Laptop)
min: 75     avg: 79.5     median: 79.5 (32%)     max: 83.9 fps
specvp12 catia-04 + NVIDIA RTX 500 Ada Generation Laptop
SPECviewperf 12 - specvp12 catia-04
147 fps (24%)
specvp12 catia-04 + NVIDIA Quadro T1000 (Laptop)
min: 82.4     avg: 87.7     median: 87.7 (14%)     max: 93 fps
specvp12 3dsmax-05 + NVIDIA RTX 500 Ada Generation Laptop
SPECviewperf 12 - specvp12 3dsmax-05
157.6 fps (24%)
specvp12 3dsmax-05 + NVIDIA Quadro T1000 (Laptop)
min: 85.5     avg: 93.8     median: 93.8 (14%)     max: 102.1 fps
SPECviewperf 13 specvp13 sw-04 + NVIDIA Quadro RTX 6000 (Laptop)
SPECviewperf 13 - specvp13 sw-04
217 fps (58%)
specvp13 sw-04 + NVIDIA RTX 500 Ada Generation Laptop
161.8 fps (43%)
specvp13 sw-04 + NVIDIA Quadro T1000 (Laptop)
min: 89.2     avg: 99.7     median: 104.4 (28%)     max: 105.6 fps
specvp13 3dsmax-06 + NVIDIA Quadro RTX 6000 (Laptop)
SPECviewperf 13 - specvp13 3dsmax-06
217 fps (34%)
specvp13 3dsmax-06 + NVIDIA RTX 500 Ada Generation Laptop
148.5 fps (23%)
specvp13 3dsmax-06 + NVIDIA Quadro T1000 (Laptop)
min: 83.9     avg: 94.8     median: 98.5 (15%)     max: 101.9 fps
specvp13 snx-03 + NVIDIA RTX 500 Ada Generation Laptop
SPECviewperf 13 - specvp13 snx-03
267.4 fps (30%)
specvp13 snx-03 + NVIDIA Quadro T1000 (Laptop)
min: 127.8     avg: 136.4     median: 133.1 (15%)     max: 148.4 fps
specvp13 showcase-02 + NVIDIA RTX 500 Ada Generation Laptop
SPECviewperf 13 - specvp13 showcase-02
55.9 fps (10%)
specvp13 showcase-02 + NVIDIA Quadro T1000 (Laptop)
min: 35.27     avg: 40.4     median: 40.2 (7%)     max: 45.71 fps
specvp13 medical-02 + NVIDIA RTX 500 Ada Generation Laptop
SPECviewperf 13 - specvp13 medical-02
141.9 fps (24%)
specvp13 medical-02 + NVIDIA Quadro T1000 (Laptop)
min: 33.45     avg: 41.7     median: 41.6 (7%)     max: 50.1 fps
specvp13 maya-05 + NVIDIA RTX 500 Ada Generation Laptop
SPECviewperf 13 - specvp13 maya-05
203.2 fps (23%)
specvp13 maya-05 + NVIDIA Quadro T1000 (Laptop)
min: 101     avg: 109.6     median: 113.3 (13%)     max: 114.6 fps
specvp13 energy-02 + NVIDIA RTX 500 Ada Generation Laptop
SPECviewperf 13 - specvp13 energy-02
2.8 fps (1%)
specvp13 energy-02 + NVIDIA Quadro T1000 (Laptop)
min: 12     avg: 15.1     median: 15.6 (5%)     max: 17.8 fps
specvp13 creo-02 + NVIDIA RTX 500 Ada Generation Laptop
SPECviewperf 13 - specvp13 creo-02
193.2 fps (28%)
specvp13 creo-02 + NVIDIA Quadro T1000 (Laptop)
min: 99.9     avg: 108.6     median: 109.5 (16%)     max: 116.3 fps
specvp13 catia-05 + NVIDIA RTX 500 Ada Generation Laptop
SPECviewperf 13 - specvp13 catia-05
244.4 fps (27%)
specvp13 catia-05 + NVIDIA Quadro T1000 (Laptop)
min: 121.3     avg: 130     median: 130.5 (15%)     max: 138.3 fps
SPECviewperf 2020 specvp2020 solidworks-07 1080p + NVIDIA RTX 500 Ada Generation Laptop
SPECviewperf 2020 - specvp2020 solidworks-07 1080p
min: 138.26     avg: 138.7     median: 138.7 (29%)     max: 139.14 fps
specvp2020 solidworks-05 1080p + NVIDIA RTX 500 Ada Generation Laptop
SPECviewperf 2020 - specvp2020 solidworks-05 1080p
136 fps (25%)
specvp2020 solidworks-05 1080p + NVIDIA Quadro T1000 (Laptop)
78.8 fps (15%)
specvp2020 snx-04 1080p + NVIDIA RTX 500 Ada Generation Laptop
SPECviewperf 2020 - specvp2020 snx-04 1080p
min: 258.44     avg: 260.2     median: 260.2 (32%)     max: 261.92 fps
specvp2020 snx-04 1080p + NVIDIA Quadro T1000 (Laptop)
132.7 fps (16%)
specvp2020 medical-03 1080p + NVIDIA RTX 500 Ada Generation Laptop
SPECviewperf 2020 - specvp2020 medical-03 1080p
min: 59.75     avg: 62.5     median: 62.5 (17%)     max: 65.25 fps
specvp2020 medical-03 1080p + NVIDIA Quadro T1000 (Laptop)
19.2 fps (5%)
specvp2020 maya-06 1080p + NVIDIA RTX 500 Ada Generation Laptop
SPECviewperf 2020 - specvp2020 maya-06 1080p
241.1 fps (26%)
specvp2020 maya-06 1080p + NVIDIA Quadro T1000 (Laptop)
134.3 fps (14%)
specvp2020 energy-03 1080p + NVIDIA RTX 500 Ada Generation Laptop
SPECviewperf 2020 - specvp2020 energy-03 1080p
min: 2.78     avg: 19.5     median: 19.5 (3%)     max: 36.12 fps
specvp2020 energy-03 1080p + NVIDIA Quadro T1000 (Laptop)
15.6 fps (3%)
specvp2020 creo-03 1080p + NVIDIA RTX 500 Ada Generation Laptop
SPECviewperf 2020 - specvp2020 creo-03 1080p
min: 107.4     avg: 110.5     median: 110.5 (38%)     max: 113.62 fps
specvp2020 creo-03 1080p + NVIDIA Quadro T1000 (Laptop)
67.5 fps (23%)
specvp2020 catia-06 1080p + NVIDIA RTX 500 Ada Generation Laptop
SPECviewperf 2020 - specvp2020 catia-06 1080p
min: 56.25     avg: 57.5     median: 57.5 (28%)     max: 58.71 fps
specvp2020 catia-06 1080p + NVIDIA Quadro T1000 (Laptop)
33.6 fps (16%)
specvp2020 3dsmax-07 1080p + NVIDIA RTX 500 Ada Generation Laptop
SPECviewperf 2020 - specvp2020 3dsmax-07 1080p
min: 59.56     avg: 59.7     median: 59.7 (16%)     max: 59.92 fps
specvp2020 3dsmax-07 1080p + NVIDIA Quadro T1000 (Laptop)
45.3 fps (12%)
Cinebench R10 Cinebench R10 Shading (32bit) + NVIDIA Quadro T1000 (Laptop)
Cinebench R10 - Cinebench R10 Shading (32bit)
6818 Points (5%)
Cinebench R11.5 Cinebench R11.5 OpenGL 64 Bit + NVIDIA Quadro T1000 (Laptop)
Cinebench R11.5 - Cinebench R11.5 OpenGL 64 Bit
124 fps (41%)
Cinebench R15
Cinebench R15 OpenGL 64 Bit + NVIDIA RTX 500 Ada Generation Laptop
Cinebench R15 - Cinebench R15 OpenGL 64 Bit
min: 252     avg: 273.5     median: 273.5 (16%)     max: 295 fps
Cinebench R15 OpenGL 64 Bit + NVIDIA Quadro T1000 (Laptop)
min: 166     avg: 182.6     median: 185.7 (11%)     max: 196 fps
Cinebench R15 OpenGL Ref. Match 64 Bit + NVIDIA RTX 500 Ada Generation Laptop
Cinebench R15 - Cinebench R15 OpenGL Ref. Match 64 Bit
99.6 % (100%)
Cinebench R15 OpenGL Ref. Match 64 Bit + NVIDIA Quadro T1000 (Laptop)
min: 99.6     avg: 99.7     median: 99.6 (100%)     max: 100 %
GFXBench - GFXBench 5.0 4K Aztec Ruins High Tier Offscreen
52.7 fps (20%)
GFXBench - GFXBench 5.0 Aztec Ruins High Tier Offscreen
126.4 fps (23%)
89.3 fps (16%)
GFXBench - GFXBench 5.0 Aztec Ruins Normal Tier Offscreen
353.2 fps (26%)
225.8 fps (17%)
GFXBench - GFXBench Car Chase Offscreen
min: 145.6     avg: 154.9     median: 154.9 (15%)     max: 164.2 fps
GFXBench 3.1 - GFXBench Manhattan ES 3.1 Offscreen
min: 220.2     avg: 243.6     median: 243.6 (5%)     max: 267 fps
GFXBench 3.0 - GFXBench 3.0 Manhattan Offscreen
min: 269     avg: 315.3     median: 315.3 (13%)     max: 361.6 fps
GFXBench (DX / GLBenchmark) 2.7
GFXBench T-Rex HD Offscreen C24Z16 + NVIDIA Quadro T1000 (Laptop)
GFXBench (DX / GLBenchmark) 2.7 - GFXBench T-Rex HD Offscreen C24Z16
min: 575     avg: 660     median: 659.5 (5%)     max: 744 fps
Basemark GPU 1.2 - Basemark GPU 1.2 Vulkan Official Medium Offscreen 1080
min: 104.6     avg: 209.8     median: 209.8 (5%)     max: 315 fps
Geekbench 6.5 - Geekbench 6.5 GPU OpenCL
min: 61467     avg: 62502     median: 62502 (16%)     max: 63537 Points
Geekbench 6.5 - Geekbench 6.5 GPU Vulkan
min: 34889     avg: 49556     median: 49555.5 (12%)     max: 64222 Points
LuxMark v2.0 64Bit - LuxMark v2.0 Room GPU
1760 Samples/s (6%)
min: 1375     avg: 1410     median: 1409.5 (5%)     max: 1444 Samples/s
LuxMark v2.0 64Bit - LuxMark v2.0 Sala GPU
5177 Samples/s (9%)
min: 2567     avg: 2768     median: 2768 (5%)     max: 2969 Samples/s
ComputeMark v2.1 - ComputeMark v2.1 Result
13116 Points (11%)
min: 5376     avg: 5966     median: 5965.5 (5%)     max: 6555 Points
Power Consumption - Furmark Stress Test Power Consumption - external Monitor *
min: 73     avg: 75.9     median: 75.9 (10%)     max: 78.7 Watt
88.8 Watt (12%)
Power Consumption - The Witcher 3 Power Consumption - external Monitor *
81.5 Watt (11%)
93.8 Watt (13%)
Power Consumption - Witcher 3 Power Consumption *
min: 83     avg: 89     median: 89 (20%)     max: 95 Watt
Power Consumption - Power Efficiency - Witcher 3 ultra
min: 0.3684     avg: 0.4     median: 0.4 (37%)     max: 0.4566 fps per Watt
Power Consumption - Power Efficiency - Witcher 3 ultra external Monitor
0.6 fps per Watt (52%)
0.4 fps per Watt (33%)
Power Consumption - Cyberpunk 2077 Power Consumption 150cd *
min: 84     avg: 85.4     median: 85.4 (24%)     max: 86.7 Watt
Power Consumption - Cyberpunk 2077 Power Consumption - external Monitor *
min: 80.6     avg: 82.6     median: 82.6 (10%)     max: 84.6 Watt
Power Consumption - Power Efficiency - Cyberpunk 2077 ultra
0.4 fps per Watt (2%)
Emissions Witcher 3 Fan Noise + NVIDIA Quadro T1000 (Laptop)
Emissions - Witcher 3 Fan Noise
min: 36.9     avg: 37.3     median: 37.3 (53%)     max: 37.7 dB(A)
Clock Speed - GPU Clock Witcher 3 ultra
1237 MHz (49%)
Clock Speed - GPU Clock Speed Furmark
1543 MHz (61%)

Average Benchmarks NVIDIA Quadro RTX 6000 (Laptop) → 100% n=3

Average Benchmarks NVIDIA RTX 500 Ada Generation Laptop → 65% n=3

Average Benchmarks NVIDIA Quadro T1000 (Laptop) → 42% n=3

- Range of benchmark values for this graphics card
red legend - Average benchmark values for this graphics card
* Smaller numbers mean a higher performance
1 This benchmark is not used for the average calculation

Game Benchmarks

The following benchmarks stem from our benchmarks of review laptops. The performance depends on the used graphics memory, clock rate, processor, system settings, drivers, and operating systems. So the results don't have to be representative for all laptops with this GPU. For detailed information on the benchmark results, click on the fps number.

F1 25

F1 25

2025
low 1920x1080
RTX 500 Ada Generation Laptop:
130  fps
med. 1920x1080
RTX 500 Ada Generation Laptop:
96.9  fps
high 1920x1080
RTX 500 Ada Generation Laptop:
73.6 74.6 ~ 74 fps
ultra 1920x1080
RTX 500 Ada Generation Laptop:
7.4  fps
F1 24

F1 24

2024
low 1920x1080
RTX 500 Ada Generation Laptop:
112.9  fps
med. 1920x1080
RTX 500 Ada Generation Laptop:
80.8  fps
high 1920x1080
RTX 500 Ada Generation Laptop:
26.5  fps
ultra 1920x1080
RTX 500 Ada Generation Laptop:
16  fps
QHD 2560x1440
RTX 500 Ada Generation Laptop:
22  fps
low 1920x1080
RTX 500 Ada Generation Laptop:
56.4  fps
med. 1920x1080
RTX 500 Ada Generation Laptop:
47.1  fps
high 1920x1080
RTX 500 Ada Generation Laptop:
40.2  fps
ultra 1920x1080
RTX 500 Ada Generation Laptop:
30.9  fps
QHD 2560x1440
RTX 500 Ada Generation Laptop:
22  fps
low 1920x1080
RTX 500 Ada Generation Laptop:
42  fps
med. 1920x1080
RTX 500 Ada Generation Laptop:
38  fps
high 1920x1080
RTX 500 Ada Generation Laptop:
32  fps
ultra 1920x1080
RTX 500 Ada Generation Laptop:
20  fps
low 1920x1080
RTX 500 Ada Generation Laptop:
88  fps
med. 1920x1080
RTX 500 Ada Generation Laptop:
78  fps
high 1920x1080
RTX 500 Ada Generation Laptop:
58  fps
ultra 1920x1080
RTX 500 Ada Generation Laptop:
49  fps
QHD 2560x1440
RTX 500 Ada Generation Laptop:
33  fps
low 1920x1080
RTX 500 Ada Generation Laptop:
199  fps
med. 1920x1080
RTX 500 Ada Generation Laptop:
129  fps
high 1920x1080
RTX 500 Ada Generation Laptop:
73  fps
ultra 1920x1080
RTX 500 Ada Generation Laptop:
56  fps
QHD 2560x1440
RTX 500 Ada Generation Laptop:
39  fps
low 1920x1080
RTX 500 Ada Generation Laptop:
78  fps
med. 1920x1080
RTX 500 Ada Generation Laptop:
69  fps
high 1920x1080
RTX 500 Ada Generation Laptop:
55  fps
ultra 1920x1080
RTX 500 Ada Generation Laptop:
40  fps
QHD 2560x1440
RTX 500 Ada Generation Laptop:
32  fps
low 1920x1080
RTX 500 Ada Generation Laptop:
52.9 72.8 ~ 63 fps
med. 1920x1080
RTX 500 Ada Generation Laptop:
37.7 55.5 ~ 47 fps
high 1920x1080
RTX 500 Ada Generation Laptop:
25.4 45.6 ~ 36 fps
ultra 1920x1080
RTX 500 Ada Generation Laptop:
25 39.6 ~ 32 fps
QHD 2560x1440
RTX 500 Ada Generation Laptop:
19.8  fps
low 1920x1080
RTX 500 Ada Generation Laptop:
69.4 79.6 ~ 75 fps
med. 1920x1080
RTX 500 Ada Generation Laptop:
53.6 61.9 ~ 58 fps
high 1920x1080
RTX 500 Ada Generation Laptop:
39 54.9 ~ 47 fps
ultra 1920x1080
RTX 500 Ada Generation Laptop:
38.9 53.1 ~ 46 fps
QHD 2560x1440
RTX 500 Ada Generation Laptop:
26.8  fps
F1 23

F1 23

2023
low 1920x1080
RTX 500 Ada Generation Laptop:
136.5  fps
med. 1920x1080
RTX 500 Ada Generation Laptop:
119.8  fps
high 1920x1080
RTX 500 Ada Generation Laptop:
84.1  fps
ultra 1920x1080
RTX 500 Ada Generation Laptop:
25  fps
QHD 2560x1440
RTX 500 Ada Generation Laptop:
16  fps
F1 22

F1 22

2022
low 1920x1080
RTX 500 Ada Generation Laptop:
150.4  fps
med. 1920x1080
RTX 500 Ada Generation Laptop:
134.4  fps
high 1920x1080
RTX 500 Ada Generation Laptop:
99.6  fps
ultra 1920x1080
RTX 500 Ada Generation Laptop:
32.9  fps
Far Cry 6

Far Cry 6

2021
low 1280x720
RTX 500 Ada Generation Laptop:
126  fps
med. 1920x1080
RTX 500 Ada Generation Laptop:
80  fps
high 1920x1080
RTX 500 Ada Generation Laptop:
68  fps
low 1280x720
Quadro T1000 (Laptop):
190.9  fps
med. 1920x1080
Quadro T1000 (Laptop):
91.8  fps
high 1920x1080
Quadro T1000 (Laptop):
58.4  fps
ultra 1920x1080
Quadro T1000 (Laptop):
43.5  fps
low 1280x720
Quadro T1000 (Laptop):
150  fps
med. 1920x1080
Quadro T1000 (Laptop):
78  fps
high 1920x1080
Quadro T1000 (Laptop):
64.3  fps
low 1280x720
Quadro T1000 (Laptop):
134.1  fps
med. 1920x1080
Quadro T1000 (Laptop):
51  fps
high 1920x1080
Quadro T1000 (Laptop):
44.4  fps
low 1280x720
Quadro T1000 (Laptop):
121.4  fps
med. 1920x1080
Quadro T1000 (Laptop):
87.9  fps
high 1920x1080
Quadro T1000 (Laptop):
67.8  fps
ultra 1920x1080
Quadro T1000 (Laptop):
56  fps
low 1280x720
Quadro T1000 (Laptop):
87.9  fps
med. 1920x1080
Quadro T1000 (Laptop):
46.7  fps
high 1920x1080
Quadro T1000 (Laptop):
29.9  fps
ultra 1920x1080
Quadro T1000 (Laptop):
19.4  fps
med. 1920x1080
Quadro T1000 (Laptop):
67.3  fps
high 1920x1080
Quadro T1000 (Laptop):
57.6  fps
ultra 1920x1080
Quadro T1000 (Laptop):
50.4  fps
low 1280x720
Quadro T1000 (Laptop):
86  fps
med. 1920x1080
Quadro T1000 (Laptop):
60.5  fps
high 1920x1080
Quadro T1000 (Laptop):
51.9  fps
ultra 1920x1080
Quadro T1000 (Laptop):
46.9  fps
low 1280x720
Quadro T1000 (Laptop):
96.7  fps
med. 1920x1080
Quadro T1000 (Laptop):
61.2  fps
high 1920x1080
Quadro T1000 (Laptop):
50.8  fps
ultra 1920x1080
Quadro T1000 (Laptop):
44  fps
GRID 2019

GRID 2019

2019
low 1280x720
Quadro T1000 (Laptop):
125.4  fps
med. 1920x1080
Quadro T1000 (Laptop):
76.8  fps
high 1920x1080
Quadro T1000 (Laptop):
65.2  fps
ultra 1920x1080
Quadro T1000 (Laptop):
42.8  fps
low 1280x720
Quadro T1000 (Laptop):
93  fps
med. 1920x1080
Quadro T1000 (Laptop):
53  fps
high 1920x1080
Quadro T1000 (Laptop):
47  fps
ultra 1920x1080
Quadro T1000 (Laptop):
32  fps
FIFA 20

FIFA 20

2019
low 1280x720
Quadro T1000 (Laptop):
208  fps
med. 1920x1080
Quadro T1000 (Laptop):
171.3  fps
high 1920x1080
Quadro T1000 (Laptop):
160.3  fps
ultra 1920x1080
Quadro T1000 (Laptop):
148.9  fps
low 1280x720
Quadro T1000 (Laptop):
117.9  fps
med. 1920x1080
Quadro T1000 (Laptop):
58.7  fps
high 1920x1080
Quadro T1000 (Laptop):
38  fps
ultra 1920x1080
Quadro T1000 (Laptop):
28.5  fps
Control

Control

2019
low 1280x720
Quadro T1000 (Laptop):
136.8  fps
med. 1920x1080
Quadro T1000 (Laptop):
42.4  fps
high 1920x1080
Quadro T1000 (Laptop):
31.2  fps
F1 2019

F1 2019

2019
low 1280x720
Quadro T1000 (Laptop):
118 178 ~ 148 fps
med. 1920x1080
Quadro T1000 (Laptop):
73 105 ~ 89 fps
high 1920x1080
Quadro T1000 (Laptop):
61 92 ~ 77 fps
ultra 1920x1080
Quadro T1000 (Laptop):
49 79 ~ 64 fps
low 1280x720
Quadro T1000 (Laptop):
182.3 189 ~ 186 fps
med. 1920x1080
Quadro T1000 (Laptop):
60.4 62.5 ~ 61 fps
high 1920x1080
Quadro T1000 (Laptop):
37.5 39.1 ~ 38 fps
ultra 1920x1080
Quadro T1000 (Laptop):
24.7 25.6 ~ 25 fps
Rage 2

Rage 2

2019
low 1280x720
Quadro T1000 (Laptop):
123.7  fps
med. 1920x1080
Quadro T1000 (Laptop):
55.2  fps
high 1920x1080
Quadro T1000 (Laptop):
45.7  fps
ultra 1920x1080
Quadro T1000 (Laptop):
45.1  fps
Anno 1800

Anno 1800

2019
low 1280x720
Quadro T1000 (Laptop):
69.6 94.5 ~ 82 fps
med. 1920x1080
Quadro T1000 (Laptop):
52.8 73.4 ~ 63 fps
high 1920x1080
Quadro T1000 (Laptop):
37.2 45.2 ~ 41 fps
ultra 1920x1080
Quadro T1000 (Laptop):
20 23.1 ~ 22 fps
low 1280x720
Quadro T1000 (Laptop):
111  fps
med. 1920x1080
Quadro T1000 (Laptop):
39 61 ~ 50 fps
high 1920x1080
Quadro T1000 (Laptop):
36 48 ~ 42 fps
ultra 1920x1080
Quadro T1000 (Laptop):
29 35 ~ 32 fps
low 1280x720
Quadro T1000 (Laptop):
185.2 232.8 ~ 209 fps
med. 1920x1080
Quadro T1000 (Laptop):
80.7 100.5 ~ 91 fps
high 1920x1080
Quadro T1000 (Laptop):
63.7 79.4 ~ 72 fps
ultra 1920x1080
Quadro T1000 (Laptop):
36.3 42.5 ~ 39 fps
low 1280x720
Quadro T1000 (Laptop):
77  fps
med. 1920x1080
Quadro T1000 (Laptop):
48  fps
high 1920x1080
Quadro T1000 (Laptop):
46  fps
ultra 1920x1080
Quadro T1000 (Laptop):
43  fps
low 1280x720
Quadro T1000 (Laptop):
93.3  fps
med. 1920x1080
Quadro T1000 (Laptop):
43.4  fps
high 1920x1080
Quadro T1000 (Laptop):
31.9  fps
ultra 1920x1080
Quadro T1000 (Laptop):
25.5  fps
low 1280x720
Quadro T1000 (Laptop):
143.7 144 ~ 144 fps
med. 1920x1080
Quadro T1000 (Laptop):
73.8 92.7 ~ 83 fps
high 1920x1080
Quadro T1000 (Laptop):
57.8 69 ~ 63 fps
ultra 1920x1080
Quadro T1000 (Laptop):
55.9 68.7 ~ 62 fps
low 1280x720
Quadro T1000 (Laptop):
61.5 138.1 ~ 100 fps
med. 1920x1080
Quadro T1000 (Laptop):
43.2 76.5 ~ 60 fps
high 1920x1080
Quadro T1000 (Laptop):
37.8 66.6 ~ 52 fps
ultra 1920x1080
Quadro T1000 (Laptop):
35 59.4 ~ 47 fps
low 1280x720
Quadro T1000 (Laptop):
182.4  fps
med. 1920x1080
Quadro T1000 (Laptop):
106.7  fps
high 1920x1080
Quadro T1000 (Laptop):
86.3  fps
ultra 1920x1080
Quadro T1000 (Laptop):
66.5  fps
low 1280x720
Quadro T1000 (Laptop):
57 82 ~ 70 fps
med. 1920x1080
Quadro T1000 (Laptop):
40 55 ~ 48 fps
high 1920x1080
Quadro T1000 (Laptop):
35 50 ~ 43 fps
ultra 1920x1080
Quadro T1000 (Laptop):
29 29 ~ 29 fps
FIFA 19

FIFA 19

2018
low 1280x720
Quadro T1000 (Laptop):
148  fps
med. 1920x1080
Quadro T1000 (Laptop):
119.2  fps
high 1920x1080
Quadro T1000 (Laptop):
113.5  fps
ultra 1920x1080
Quadro T1000 (Laptop):
110.8  fps
low 1280x720
Quadro T1000 (Laptop):
88 101 111 ~ 100 fps
med. 1920x1080
Quadro T1000 (Laptop):
46 56.7 58 ~ 54 fps
high 1920x1080
Quadro T1000 (Laptop):
40 50 54.1 ~ 48 fps
ultra 1920x1080
Quadro T1000 (Laptop):
35 45 46 ~ 42 fps
Strange Brigade

Strange Brigade

2018
low 1280x720
RTX 500 Ada Generation Laptop:
316 333 ~ 325 fps
med. 1920x1080
RTX 500 Ada Generation Laptop:
126 129.6 ~ 128 fps
high 1920x1080
RTX 500 Ada Generation Laptop:
104 106.7 ~ 105 fps
ultra 1920x1080
RTX 500 Ada Generation Laptop:
91 93.2 ~ 92 fps
QHD 2560x1440
RTX 500 Ada Generation Laptop:
63  fps
Far Cry 5

Far Cry 5

2018
low 1280x720
RTX 500 Ada Generation Laptop:
135  fps
Quadro T1000 (Laptop):
107  fps
med. 1920x1080
RTX 500 Ada Generation Laptop:
86  fps
Quadro T1000 (Laptop):
62  fps
high 1920x1080
RTX 500 Ada Generation Laptop:
78  fps
Quadro T1000 (Laptop):
57  fps
ultra 1920x1080
RTX 500 Ada Generation Laptop:
74  fps
Quadro T1000 (Laptop):
53  fps
QHD 2560x1440
RTX 500 Ada Generation Laptop:
50  fps
World of Tanks enCore

World of Tanks enCore

2018
low 1366x768
Quadro T1000 (Laptop):
491.9  fps
med. 1920x1080
Quadro T1000 (Laptop):
199.3  fps
ultra 1920x1080
Quadro T1000 (Laptop):
77.1  fps
low 1280x720
RTX 500 Ada Generation Laptop:
98 128.3 ~ 113 fps
Quadro T1000 (Laptop):
79.7 91 108 ~ 93 fps
med. 1920x1080
RTX 500 Ada Generation Laptop:
79.4 103.5 ~ 91 fps
Quadro T1000 (Laptop):
66.2 78 96 ~ 80 fps
high 1920x1080
RTX 500 Ada Generation Laptop:
67 81.5 ~ 74 fps
Quadro T1000 (Laptop):
57.1 69 80.1 ~ 69 fps
low 1280x720
Quadro T1000 (Laptop):
93.7  fps
med. 1920x1080
Quadro T1000 (Laptop):
49.3  fps
high 1920x1080
Quadro T1000 (Laptop):
40.5  fps
ultra 1920x1080
Quadro T1000 (Laptop):
30.7  fps
low 1280x720
RTX 500 Ada Generation Laptop:
130.5 148.5 ~ 140 fps
Quadro T1000 (Laptop):
56.1 77.4 ~ 67 fps
med. 1920x1080
RTX 500 Ada Generation Laptop:
71 77.8 ~ 74 fps
Quadro T1000 (Laptop):
41.9 49.2 ~ 46 fps
high 1920x1080
RTX 500 Ada Generation Laptop:
50 57.1 ~ 54 fps
Quadro T1000 (Laptop):
31.1 34 ~ 33 fps
QHD 2560x1440
RTX 500 Ada Generation Laptop:
36.1  fps
low 1280x720
Quadro T1000 (Laptop):
246.4  fps
med. 1920x1080
Quadro T1000 (Laptop):
150.7  fps
high 1920x1080
Quadro T1000 (Laptop):
117  fps
low 1280x720
Quadro T1000 (Laptop):
94  fps
med. 1920x1080
Quadro T1000 (Laptop):
47.2  fps
high 1920x1080
Quadro T1000 (Laptop):
43.9  fps
ultra 1920x1080
Quadro T1000 (Laptop):
24.2  fps
For Honor

For Honor

2017
low 1280x720
Quadro T1000 (Laptop):
163.4 199.8 ~ 182 fps
med. 1920x1080
Quadro T1000 (Laptop):
66.7 77.5 ~ 72 fps
high 1920x1080
Quadro T1000 (Laptop):
63.9 74.3 ~ 69 fps
ultra 1920x1080
Quadro T1000 (Laptop):
48.8 56.7 ~ 53 fps
low 1024x768
Quadro T1000 (Laptop):
136.2  fps
med. 1366x768
Quadro T1000 (Laptop):
86  fps
high 1920x1080
Quadro T1000 (Laptop):
53.4  fps
ultra 1920x1080
Quadro T1000 (Laptop):
43.8  fps
low 1024x768
Quadro T1000 (Laptop):
190.3 244.3 ~ 217 fps
med. 1366x768
Quadro T1000 (Laptop):
159.6 197.9 ~ 179 fps
high 1920x1080
Quadro T1000 (Laptop):
111.6 139.3 ~ 125 fps
ultra 1920x1080
Quadro T1000 (Laptop):
97.9 117.9 ~ 108 fps
low 1280x720
RTX 500 Ada Generation Laptop:
176.2 178 ~ 177 fps
Quadro T1000 (Laptop):
134 141.4 151 ~ 142 fps
med. 1366x768
RTX 500 Ada Generation Laptop:
156.1 163.3 ~ 160 fps
Quadro T1000 (Laptop):
115 124.8 136 ~ 125 fps
high 1920x1080
RTX 500 Ada Generation Laptop:
145.6 148.1 ~ 147 fps
Quadro T1000 (Laptop):
113 113.6 123 ~ 117 fps
ultra 1920x1080
RTX 500 Ada Generation Laptop:
136 137.4 ~ 137 fps
Quadro T1000 (Laptop):
106 106.7 115 ~ 109 fps
4K 3840x2160
Quadro T1000 (Laptop):
47.9  fps
low 1024x768
RTX 500 Ada Generation Laptop:
278  fps
Quadro T1000 (Laptop):
156.2 189 190.7 ~ 179 fps
med. 1366x768
RTX 500 Ada Generation Laptop:
175  fps
Quadro T1000 (Laptop):
94.1 114 115.9 ~ 108 fps
high 1920x1080
RTX 500 Ada Generation Laptop:
91  fps
Quadro T1000 (Laptop):
52.7 62.8 62.9 ~ 59 fps
ultra 1920x1080
RTX 500 Ada Generation Laptop:
51  fps
Quadro T1000 (Laptop):
30.9 35 37.9 ~ 35 fps
QHD 2560x1440
RTX 500 Ada Generation Laptop:
36  fps
GTA V

GTA V

2015
low 1024x768
RTX 500 Ada Generation Laptop:
182.7 183.8 ~ 183 fps
Quadro T1000 (Laptop):
170.1  fps
med. 1366x768
RTX 500 Ada Generation Laptop:
177.4 178.9 ~ 178 fps
Quadro T1000 (Laptop):
153.9  fps
high 1920x1080
RTX 500 Ada Generation Laptop:
138.2 139.1 ~ 139 fps
Quadro T1000 (Laptop):
93.8  fps
ultra 1920x1080
RTX 500 Ada Generation Laptop:
64.6 69.7 ~ 67 fps
Quadro T1000 (Laptop):
41.7  fps
QHD 2560x1440
RTX 500 Ada Generation Laptop:
45.1  fps
low 1280x720
Quadro T1000 (Laptop):
280.4 316.4 ~ 298 fps
med. 1366x768
Quadro T1000 (Laptop):
210 241 ~ 226 fps
high 1366x768
Quadro T1000 (Laptop):
184.7 216.3 ~ 201 fps
ultra 1920x1080
Quadro T1000 (Laptop):
72.9 86.6 ~ 80 fps
NVIDIA Quadro RTX 6000 (Laptop)NVIDIA RTX 500 Ada Generation LaptopNVIDIA Quadro T1000 (Laptop)
lowmed.highultraQHD4Klowmed.highultraQHD4Klowmed.highultraQHD4K
F1 2513096.9747.44
F1 24112.980.826.51622
Ghost of Tsushima56.447.140.230.922
Avatar Frontiers of Pandora42383220
Call of Duty Modern Warfare 3 20238878584933
Total War Pharaoh199129735639
Assassin's Creed Mirage7869554032
Cyberpunk 2077 2.2 Phantom Liberty6347363219.8
Baldur's Gate 37558474626.8
F1 23136.5119.884.12516
F1 22150.4134.499.632.9
Far Cry 61268068
Strange Brigade3251281059263
Far Cry 513586787450107625753
X-Plane 11.111139174938069
Final Fantasy XV Benchmark140745436.1674633
Dota 2 Reborn17716014713714212511710947.9
The Witcher 32781759151361791085935
GTA V1831781396745.1170.1153.993.841.7
NVIDIA Quadro RTX 6000 (Laptop)NVIDIA RTX 500 Ada Generation LaptopNVIDIA Quadro T1000 (Laptop)
lowmed.highultraQHD4Klowmed.highultraQHD4Klowmed.highultraQHD4K
< 30 fps
< 60 fps
< 120 fps
≥ 120 fps


< 30 fps
< 60 fps
< 120 fps
≥ 120 fps

2
6
11

4
9
6
1
7
9
2
4
8
3
1
5
7
1


< 30 fps
< 60 fps
< 120 fps
≥ 120 fps


3
3

1
3
2

3
3

3
1


1

For more games that might be playable and a list of all games and graphics cards visit our Gaming List

v1.34
log 31. 11:07:44

#0 ran 0s before starting gpusingle class +0s ... 0s

#1 checking url part for id 9923 +0s ... 0s

#2 checking url part for id 12426 +0s ... 0s

#3 checking url part for id 9860 +0s ... 0s

#4 redirected to Ajax server, took 1761905263s time from redirect:0 +0s ... 0s

#5 did not recreate cache, as it is less than 5 days old! Created at Fri, 31 Oct 2025 05:18:51 +0100 +0s ... 0s

#6 composed specs +0.007s ... 0.007s

#7 did output specs +0s ... 0.007s

#8 start showIntegratedCPUs +0s ... 0.007s

#9 getting avg benchmarks for device 9923 +0.018s ... 0.025s

#10 got single benchmarks 9923 +0.004s ... 0.028s

#11 getting avg benchmarks for device 12426 +0s ... 0.028s

#12 got single benchmarks 12426 +0.002s ... 0.031s

#13 getting avg benchmarks for device 9860 +0.004s ... 0.035s

#14 got single benchmarks 9860 +0.008s ... 0.042s

#15 got avg benchmarks for devices +0s ... 0.042s

#16 min, max, avg, median took s +0.043s ... 0.085s

#17 before gaming benchmark output +0s ... 0.085s

#18 Got 346 rows for game benchmarks. +0.016s ... 0.101s

#19 composed SQL query for gamebenchmarks +0s ... 0.101s

#20 got data and put it in $dataArray +0.004s ... 0.105s

#21 benchmarks composed for output. +0.018s ... 0.123s

#22 calculated avg scores. +0s ... 0.123s

#23 return log +0.001s ... 0.124s

Please share our article, every link counts!
Mail Logo
> Expert Reviews and News on Laptops, Smartphones and Tech Innovations > Benchmarks / Tech > Graphics Card Comparison - Head 2 Head
Redaktion, 2017-09- 8 (Update: 2023-07- 1)