Notebookcheck Logo

Intel Iris Pro Graphics 580 vs AMD Radeon R4 (Stoney Ridge)

Intel Iris Pro Graphics 580

► remove from comparison

The Intel Iris Pro Graphics 580 (GT4e) is an integrated graphics unit of the Skylake generation (top version). As successors of the Iris Graphics 6200 (Broadwell), the Iris 580 can be found in some high-end quad core CPUs and offers 128 MB of dedicated eDRAM memory. Furthermore, the so-called GT4e-version features 72 Execution Units (EUs). Besides the eDRAM cache, the Iris 580 is able to access the main memory (2x 64bit DDR3L-1600 / DDR4-2133).

Compared to the Iris Graphics 550 (28 W GT3e), the Iris Pro Graphics 580 offers more EUs (72 vs. 48) and a larger eDRAM Cache (128 vs. 64 MB).

Performance

The exact performance of the Iris Graphics 580 depends on memory configuration and CPU model (different clock speeds). However, it should be clearly faster than the old Broadwell Iris Pro 6200 and may compete with a dedicated GeForce 945M. Modern games of 2015/2016 should be playable in medium settings.

Features

The revised video engine now decodes H.265/HEVC completely in hardware and thereby much more efficiently than before. Displays can be connected via DP 1.2 / eDP 1.3 (max. 3840 x 2160 @ 60 Hz), whereas HDMI is limited to the older version 1.4 (max. 3840 x 2160 @ 30 Hz). However, HDMI 2.0 can be added using a DisplayPort converter. Up to three displays can be controlled simultaneously.

Power Consumption

The Iris Graphics 580 can be found in some mobile high-end quad core processors (45 W). Therefore, they are most likely not used in thin and light laptops.

AMD Radeon R4 (Stoney Ridge)

► remove from comparison AMD Radeon R4 (Stoney Ridge)

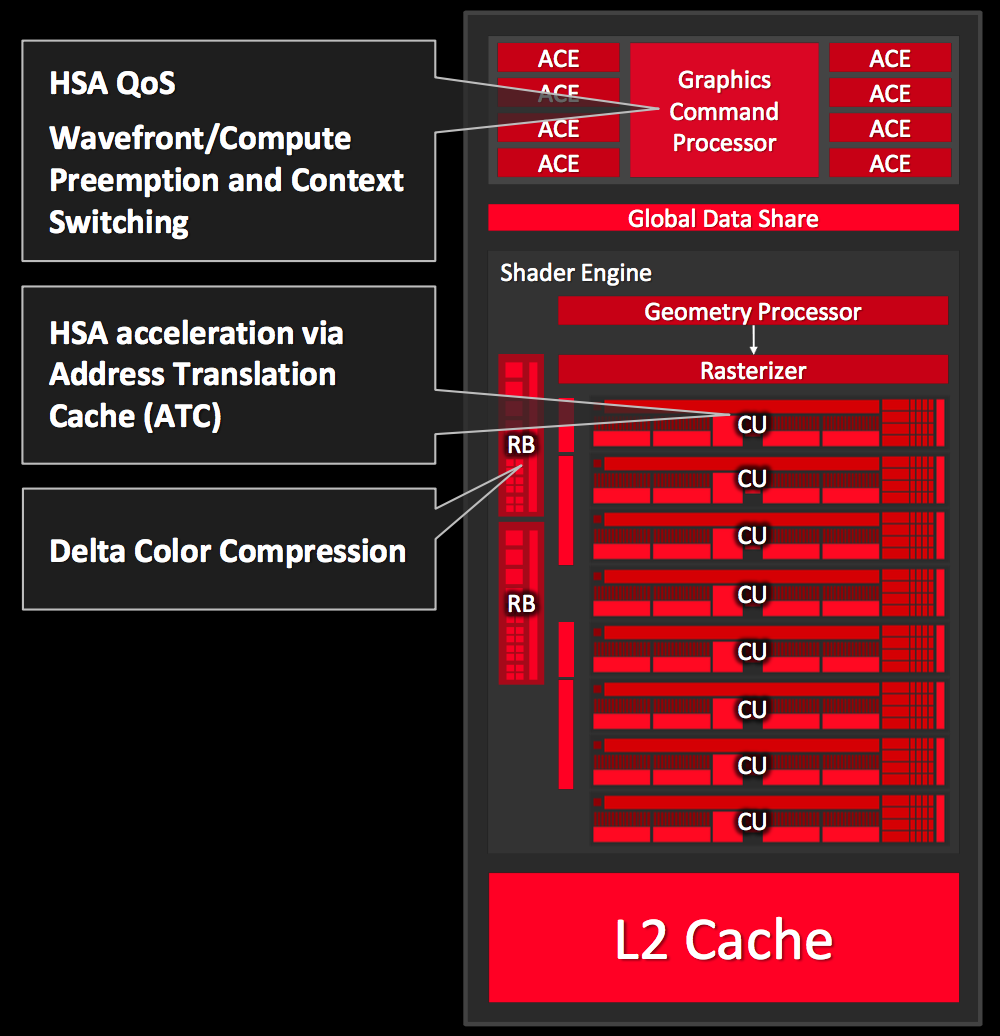
The AMD Radeon R4 (Stoney Ridge) is an integrated graphics adapter of the weaker mobile dual-core Stoney Ridge APUs. At its launch, it is being used in the AMD A6-9210 and probably has 192 shaders running at up to 600 MHz. The performance can vary heavily depending on the configured TDP and the system memory.

Architecture and Features

The Radeon R5 is equipped with three cores from the third GCN generation (often called GCN 1.2 or 2.0 by the press). This means it is very similar to the Tonga desktop chip and supports DirectX 12 (FL 12_0), but the graphics cores can also be accessed via Mantle, OpenGL, and OpenCL. The GPU supports the HSA 1.0 standard as well and can therefore use the connection with the CPU cores very efficiently. The technical specifications are identical to the Carrizo predecessor. 

The video unit includes the UVD 6 (Unified Video Decoder), which can decode HEVC/H.265 and 4K with support from the hardware. More details are available in our dedicated Stoney Ridge article

Power Consumption

Depending on the model and configured TDP (cTDP), the 28 nm chip is specified with 10 up to 15 Watts. This means it can also be used for thin and light notebooks.

Intel Iris Pro Graphics 580AMD Radeon R4 (Stoney Ridge)
Radeon R (Stoney / Bristol Ridge) Series
Iris Pro Graphics P580 compare 72 @ 0.35 - 1.1 GHzeDRAM + 64/128 Bit
Iris Pro Graphics 580 72 @ 0.35 - 1.05 GHzeDRAM + 64/128 Bit
Iris Graphics 550 compare 48 @ 0.3 - 1.1 GHzeDRAM + 64/128 Bit
Iris Graphics 540 compare 48 @ 0.3 - 1.05 GHzeDRAM + 64/128 Bit
HD Graphics 530 compare 24 @ 0.35 - 1.15 GHz64/128 Bit
HD Graphics 520 compare 24 @ 0.3 - 1.05 GHz64/128 Bit
HD Graphics 515 compare 24 @ 0.3 - 1 GHz64/128 Bit
UHD Graphics 610 compare 12 @ 0.3 - 0.95 GHz64/128 Bit
HD Graphics 610 compare 12 @ 0.3 - 0.95 GHz64/128 Bit
HD Graphics 510 compare 12 @ 0.3 - 0.95 GHz64/128 Bit
UHD Graphics 605 compare 18 @ 0.3 - 0.75 GHz64/128 Bit
HD Graphics 505 compare 18 @ 0.3 - 0.75 GHz64/128 Bit
UHD Graphics 600 compare 12 @ 0.3 - 0.7 GHz64/128 Bit
HD Graphics 500 compare 12 @ 0.3 - 0.7 GHz64/128 Bit
Radeon R7 (Bristol Ridge) compare 512 @ 0.9 GHz64/128 Bit
Radeon R5 (Bristol Ridge) compare 384 @ 0.8 GHz64/128 Bit
Radeon R5 (Stoney Ridge) compare 192 @ 0.8 GHz64 Bit
Radeon R4 (Stoney Ridge) 192 @ 0.6 GHz64 Bit
Radeon R2 (Stoney Ridge) compare 128 @ 0.6 GHz64 Bit
CodenameSkylake GT4eStoney Ridge
ArchitectureGen. 9 SkylakeGCN 1.2/2.0
Pipelines72 - unified192 - unified
Core Speed350 - 1050 (Boost) MHz600 (Boost) MHz
Memory Bus WidtheDRAM + 64/128 Bit64 Bit
Memory TypeeDRAM
Max. Amount of Memory128 MB
Shared Memoryyesyes
APIDirectX 12_1, OpenGL 4.4DirectX 12 (FL 12_0), OpenGL 4.4
technology14 nm28 nm
FeaturesQuickSyncUVD 6, VCE
Date of Announcement24.01.2016 01.06.2016
Power Consumption15 Watt
CPU in Iris Pro Graphics 580GPU Base SpeedGPU Boost / Turbo
Intel Core i7-6970HQ4 x 2800 MHz, 45 W350 MHz1050 MHz
Intel Core i7-6870HQ4 x 2700 MHz, 45 W350 MHz1000 MHz
Intel Core i7-6770HQ4 x 2600 MHz, 45 W350 MHz950 MHz
Intel Core i5-6350HQ4 x 2300 MHz, 45 W350 MHz900 MHz
min. - max.350 MHz900 - 1050 MHz
CPU in Radeon R4 (Stoney Ridge)GPU Base SpeedGPU Boost / Turbo
AMD A6-92252 x 2600 MHz, 15 W? MHz686 MHz
AMD A6-92202 x 2500 MHz, 15 W? MHz655 MHz
AMD A6-92102 x 2400 MHz, 15 W? MHz600 MHz
min. - max.? MHz600 - 686 MHz

Benchmarks

Performance Rating - 3DMark 11 + Fire Strike + Time Spy - Iris Pro Graphics 580
0.7 pt (2%)
Restrict / Search: Model: Max. age: years
Performance Rating - 3DMark 11 + Fire Strike + Time Spy - Radeon R4 (Stoney Ridge)
0.2 pt (1%)
Restrict / Search: Model: Max. age: years
3DMark - 3DMark Time Spy Score
min: 215     avg: 228     median: 228 (1%)     max: 241 Points
3DMark - 3DMark Time Spy Graphics
min: 193     avg: 205     median: 205 (0%)     max: 217 Points
3DMark - 3DMark Ice Storm Unlimited Graphics
184880 Points (19%)
min: 19410     avg: 36583     median: 42677 (4%)     max: 47662 Points
3DMark - 3DMark Ice Storm Extreme Graphics
98218 Points (12%)
min: 10921     avg: 21563     median: 25980 (3%)     max: 27787 Points
3DMark - 3DMark Cloud Gate Score
11346 Points (11%)
min: 1029     avg: 2098     median: 2458 (2%)     max: 2806 Points
3DMark - 3DMark Cloud Gate Graphics
14594 Points (4%)
min: 1652     avg: 3084     median: 3416 (1%)     max: 4183 Points
3DMark - 3DMark Fire Strike Standard Score
1836 Points (3%)
min: 253     avg: 393.7     median: 383 (1%)     max: 545 Points
3DMark - 3DMark Fire Strike Standard Graphics
1903 Points (2%)
min: 313     avg: 548     median: 583 (1%)     max: 747 Points
3DMark - 3DMark Ice Storm Graphics
149585 Points (17%)
min: 17820     avg: 35160     median: 42296 (5%)     max: 45364 Points
3DMark 11 - 3DM11 Performance Score
3510 Points (4%)
min: 430     avg: 885     median: 1003.5 (1%)     max: 1103 Points
3DMark 11 - 3DM11 Performance GPU
3220 Points (2%)
min: 429     avg: 861     median: 972.5 (1%)     max: 1068 Points
3DMark Vantage
3DM Vant. Perf. total + AMD Radeon R4 (Stoney Ridge)
3DMark Vantage - 3DM Vant. Perf. total
2542 Points (1%)
3DM Vant. Perf. GPU no PhysX + AMD Radeon R4 (Stoney Ridge)
3DMark Vantage - 3DM Vant. Perf. GPU no PhysX
2243 Points (1%)
3DMark 05 - 3DMark 05 - Standard
8856 Points (10%)
3DMark 06 3DMark 06 - Standard 1280x1024 + AMD Radeon R4 (Stoney Ridge)
3DMark 06
min: 3886     avg: 4247     median: 4246.5 (6%)     max: 4607 Points
Unigine Valley 1.0 - Unigine Valley 1.0 DX
min: 2.6     avg: 3     median: 3 (1%)     max: 3.3 fps
Unigine Heaven 3.0 - Unigine Heaven 3.0 DX 11
min: 7.8     avg: 8.4     median: 8.4 (3%)     max: 8.9 fps
Unigine Heaven 3.0 - Unigine Heaven 3.0 OpenGL
min: 6.6     avg: 7.7     median: 7.7 (3%)     max: 8.8 fps
Unigine Heaven 2.1 - Heaven 2.1 high
min: 6.4     avg: 8.4     median: 8.4 (2%)     max: 10.3 fps
Cinebench R10 Cinebench R10 Shading (32bit) + Intel Iris Pro Graphics 580
Cinebench R10 - Cinebench R10 Shading (32bit)
11355 Points (8%)
Cinebench R10 Shading (32bit) + AMD Radeon R4 (Stoney Ridge)
min: 2218     avg: 3031     median: 2881 (2%)     max: 3995 Points
Cinebench R11.5 Cinebench R11.5 OpenGL 64 Bit + Intel Iris Pro Graphics 580
Cinebench R11.5 - Cinebench R11.5 OpenGL 64 Bit
63 fps (21%)
Cinebench R11.5 OpenGL 64 Bit + AMD Radeon R4 (Stoney Ridge)
min: 15.11     avg: 16.1     median: 16.1 (5%)     max: 17.06 fps
Cinebench R15
Cinebench R15 OpenGL 64 Bit + Intel Iris Pro Graphics 580
Cinebench R15 - Cinebench R15 OpenGL 64 Bit
min: 85.1     avg: 85.6     median: 85.6 (5%)     max: 86 fps
Cinebench R15 OpenGL 64 Bit + AMD Radeon R4 (Stoney Ridge)
min: 15.3     avg: 18.2     median: 18.6 (1%)     max: 20.08 fps
Cinebench R15 OpenGL Ref. Match 64 Bit + Intel Iris Pro Graphics 580
Cinebench R15 - Cinebench R15 OpenGL Ref. Match 64 Bit
min: 97.8     avg: 97.9     median: 97.8 (98%)     max: 98 %
Cinebench R15 OpenGL Ref. Match 64 Bit + AMD Radeon R4 (Stoney Ridge)
98 % (98%)
GFXBench - GFXBench 5.0 Aztec Ruins High Tier Offscreen
6.7 fps (1%)
GFXBench - GFXBench 5.0 Aztec Ruins Normal Tier Offscreen
17.9 fps (1%)
GFXBench - GFXBench Car Chase Offscreen
min: 12.6     avg: 13.5     median: 13.5 (1%)     max: 14.4 fps
GFXBench 3.1 - GFXBench Manhattan ES 3.1 Offscreen
min: 18.1     avg: 22.7     median: 22.7 (0%)     max: 27.2 fps
GFXBench 3.0 - GFXBench 3.0 Manhattan Offscreen
min: 17.8     avg: 18.5     median: 18.5 (1%)     max: 19.2 fps
GFXBench (DX / GLBenchmark) 2.7
GFXBench T-Rex HD Offscreen C24Z16 + AMD Radeon R4 (Stoney Ridge)
GFXBench (DX / GLBenchmark) 2.7 - GFXBench T-Rex HD Offscreen C24Z16
min: 53.4     avg: 57.2     median: 57.2 (0%)     max: 61 fps
LuxMark v2.0 64Bit - LuxMark v2.0 Room GPU
362 Samples/s (1%)
min: 84     avg: 88     median: 88 (0%)     max: 92 Samples/s
LuxMark v2.0 64Bit - LuxMark v2.0 Sala GPU
875 Samples/s (2%)
min: 167     avg: 180.5     median: 180.5 (0%)     max: 194 Samples/s
ComputeMark v2.1 - ComputeMark v2.1 Result
2308 Points (2%)
min: 589     avg: 612     median: 612 (1%)     max: 635 Points

Average Benchmarks Intel Iris Pro Graphics 580 → 100% n=16

Average Benchmarks AMD Radeon R4 (Stoney Ridge) → 30% n=16

- Range of benchmark values for this graphics card
red legend - Average benchmark values for this graphics card
* Smaller numbers mean a higher performance
1 This benchmark is not used for the average calculation

Game Benchmarks

The following benchmarks stem from our benchmarks of review laptops. The performance depends on the used graphics memory, clock rate, processor, system settings, drivers, and operating systems. So the results don't have to be representative for all laptops with this GPU. For detailed information on the benchmark results, click on the fps number.

low 1280x720
Radeon R4 (Stoney Ridge):
7.1  fps
low 1280x720
Radeon R4 (Stoney Ridge):
8.7  fps
low 1280x720
Radeon R4 (Stoney Ridge):
4.1  fps
med. 1920x1080
Radeon R4 (Stoney Ridge):
4.8  fps
low 1280x720
Radeon R4 (Stoney Ridge):
7.1  fps
low 1280x720
Radeon R4 (Stoney Ridge):
5  fps
low 1280x720
Radeon R4 (Stoney Ridge):
8.2  fps
Control

Control

2019
low 1280x720
Radeon R4 (Stoney Ridge):
8.1  fps
F1 2019

F1 2019

2019
low 1280x720
Radeon R4 (Stoney Ridge):
11  fps
low 1280x720
Radeon R4 (Stoney Ridge):
11.8  fps
Anno 1800

Anno 1800

2019
low 1280x720
Radeon R4 (Stoney Ridge):
11.2  fps
low 1280x720
Radeon R4 (Stoney Ridge):
26.3  fps
low 1280x720
Radeon R4 (Stoney Ridge):
3  fps
low 1280x720
Radeon R4 (Stoney Ridge):
7.2  fps
low 1280x720
Radeon R4 (Stoney Ridge):
12.3  fps
low 1280x720
Radeon R4 (Stoney Ridge):
10  fps
low 1280x720
Radeon R4 (Stoney Ridge):
20.6  fps
med. 1920x1080
Radeon R4 (Stoney Ridge):
5.2  fps
low 1280x720
Radeon R4 (Stoney Ridge):
32.4  fps
med. 1920x1080
Radeon R4 (Stoney Ridge):
11.7  fps
Hitman 2

Hitman 2

2018
low 1280x720
Radeon R4 (Stoney Ridge):
6.6  fps
low 1280x720
Radeon R4 (Stoney Ridge):
8.8  fps
low 1280x720
Radeon R4 (Stoney Ridge):
9  fps
low 1280x720
Radeon R4 (Stoney Ridge):
11  fps
F1 2018

F1 2018

2018
low 1280x720
Radeon R4 (Stoney Ridge):
12  fps
low 1280x720
Radeon R4 (Stoney Ridge):
2.5  fps
Far Cry 5

Far Cry 5

2018
low 1280x720
Radeon R4 (Stoney Ridge):
3  fps
World of Tanks enCore

World of Tanks enCore

2018
low 1366x768
Radeon R4 (Stoney Ridge):
80.3  fps
med. 1920x1080
Radeon R4 (Stoney Ridge):
10.7  fps
low 1280x720
Radeon R4 (Stoney Ridge):
12.2  fps
low 1280x720
Radeon R4 (Stoney Ridge):
7.3  fps
low 1280x720
Radeon R4 (Stoney Ridge):
6.8  fps
ELEX

ELEX

2017
low 1280x720
Radeon R4 (Stoney Ridge):
8.9  fps
low 1280x720
Radeon R4 (Stoney Ridge):
15  fps
low 1280x720
Radeon R4 (Stoney Ridge):
23  fps
med. 1366x768
Radeon R4 (Stoney Ridge):
22.6  fps
Dirt 4

Dirt 4

2017
low 1280x720
Radeon R4 (Stoney Ridge):
29.4  fps
low 1280x720
Radeon R4 (Stoney Ridge):
31.3  fps
low 1280x720
Radeon R4 (Stoney Ridge):
9.7  fps
For Honor

For Honor

2017
low 1280x720
Radeon R4 (Stoney Ridge):
15.1  fps
low 1280x720
Radeon R4 (Stoney Ridge):
24.3  fps
med. 1920x1080
Radeon R4 (Stoney Ridge):
18  fps
low 1280x720
Radeon R4 (Stoney Ridge):
38  fps
med. 1366x768
Radeon R4 (Stoney Ridge):
24.8  fps
low 1280x720
Radeon R4 (Stoney Ridge):
8.2  fps
low 1024x768
Radeon R4 (Stoney Ridge):
27.3  fps
low 1280x720
Radeon R4 (Stoney Ridge):
8.4  fps
Overwatch

Overwatch

2016
low 1280x720
100%
Iris Pro Graphics 580:
60.5  fps
34%
Radeon R4 (Stoney Ridge):
20.7  fps
med. 1366x768
100%
Iris Pro Graphics 580:
53.3  fps
32%
Radeon R4 (Stoney Ridge):
16.9  fps
high 1920x1080
100%
Iris Pro Graphics 580:
42.9  fps
ultra 1920x1080
100%
Iris Pro Graphics 580:
23.1  fps
Doom

Doom

2016
low 1280x720
Iris Pro Graphics 580:
0 (!)  fps
low 1280x768
Radeon R4 (Stoney Ridge):
7.3  fps
low 1024x768
100%
Iris Pro Graphics 580:
30.2  fps
med. 1366x768
100%
Iris Pro Graphics 580:
18.2  fps
high 1920x1080
100%
Iris Pro Graphics 580:
12.2  fps
ultra 1920x1080
100%
Iris Pro Graphics 580:
8.9  fps
Fallout 4

Fallout 4

2015
low 1280x720
Iris Pro Graphics 580:
0 (!)  fps
low 1366x768
Radeon R4 (Stoney Ridge):
30  fps
med. 1366x768
Radeon R4 (Stoney Ridge):
22.1  fps
low 1024x768
100%
Iris Pro Graphics 580:
59.9  fps
43%
Radeon R4 (Stoney Ridge):
26  fps
med. 1366x768
100%
Iris Pro Graphics 580:
58.6  fps
31%
Radeon R4 (Stoney Ridge):
17.9  fps
high 1920x1080
100%
Iris Pro Graphics 580:
23  fps
ultra 1920x1080
100%
Iris Pro Graphics 580:
14.9  fps
low 1280x720
100%
Iris Pro Graphics 580:
59.8  fps
54%
Radeon R4 (Stoney Ridge):
32.2 32.4 ~ 32 fps
med. 1366x768
100%
Iris Pro Graphics 580:
37.2  fps
51%
Radeon R4 (Stoney Ridge):
17.7 20.3 ~ 19 fps
high 1920x1080
100%
Iris Pro Graphics 580:
15.3  fps
ultra 1920x1080
100%
Iris Pro Graphics 580:
14  fps
low 1280x720
Iris Pro Graphics 580:
0 (!)  fps
low 1024x768
Radeon R4 (Stoney Ridge):
48.8  fps
med. 1366x768
Radeon R4 (Stoney Ridge):
16.2  fps
low 1024x768
Radeon R4 (Stoney Ridge):
15.1  fps
med. 1366x768
Radeon R4 (Stoney Ridge):
12  fps
low 1024x768
Radeon R4 (Stoney Ridge):
15.1  fps
med. 1366x768
Radeon R4 (Stoney Ridge):
10.9  fps
F1 2014

F1 2014

2014
low 1024x768
Radeon R4 (Stoney Ridge):
30  fps
med. 1366x768
Radeon R4 (Stoney Ridge):
26  fps
low 1280x720
Radeon R4 (Stoney Ridge):
18.1  fps
med. 1344x756
Radeon R4 (Stoney Ridge):
11.6  fps
Sims 4

Sims 4

2014
low 1024x768
Radeon R4 (Stoney Ridge):
90  fps
med. 1366x768
Radeon R4 (Stoney Ridge):
28.8  fps
low 1024x768
Radeon R4 (Stoney Ridge):
57  fps
med. 1366x768
Radeon R4 (Stoney Ridge):
24.5  fps
Thief

Thief

2014
low 1024x768
100%
Iris Pro Graphics 580:
43.8  fps
med. 1366x768
100%
Iris Pro Graphics 580:
30.1  fps
high 1366x768
100%
Iris Pro Graphics 580:
25  fps
ultra 1920x1080
100%
Iris Pro Graphics 580:
12.4  fps
GRID 2

GRID 2

2013
low 1024x768
Radeon R4 (Stoney Ridge):
46.3  fps
med. 1366x768
Radeon R4 (Stoney Ridge):
28.4  fps
high 1366x768
Radeon R4 (Stoney Ridge):
22.5  fps
low 1024x768
100%
Iris Pro Graphics 580:
63.7  fps
med. 1366x768
100%
Iris Pro Graphics 580:
50.8  fps
high 1366x768
100%
Iris Pro Graphics 580:
28.5  fps
ultra 1920x1080
100%
Iris Pro Graphics 580:
14.3  fps
low 1280x720
100%
Iris Pro Graphics 580:
101.3  fps
32%
Radeon R4 (Stoney Ridge):
18.5 34.6 43 ~ 32 fps
med. 1366x768
100%
Iris Pro Graphics 580:
57.9  fps
26%
Radeon R4 (Stoney Ridge):
8.6 20.8 ~ 15 fps
high 1366x768
100%
Iris Pro Graphics 580:
51  fps
24%
Radeon R4 (Stoney Ridge):
7.4 17 ~ 12 fps
ultra 1920x1080
100%
Iris Pro Graphics 580:
14.9  fps
34%
Radeon R4 (Stoney Ridge):
3.7 6.2 ~ 5 fps
low 1024x768
100%
Iris Pro Graphics 580:
380.6  fps
med. 1366x768
100%
Iris Pro Graphics 580:
127.1  fps
high 1366x768
100%
Iris Pro Graphics 580:
73.6  fps
ultra 1920x1080
100%
Iris Pro Graphics 580:
36.2  fps
low 1024x768
Radeon R4 (Stoney Ridge):
39.4  fps
med. 1366x768
Radeon R4 (Stoney Ridge):
19.9  fps
high 1366x768
Radeon R4 (Stoney Ridge):
13.2  fps
low 1024x768
Radeon R4 (Stoney Ridge):
45.5  fps
med. 1366x768
Radeon R4 (Stoney Ridge):
22.9  fps
high 1366x768
Radeon R4 (Stoney Ridge):
19.5  fps
low 1024x768
100%
Iris Pro Graphics 580:
115.8  fps
high 1366x768
100%
Iris Pro Graphics 580:
38.7  fps
ultra 1920x1080
100%
Iris Pro Graphics 580:
16.7  fps
low 1024x768
Radeon R4 (Stoney Ridge):
29.7  fps
med. 1366x768
Radeon R4 (Stoney Ridge):
21.9  fps
high 1366x768
Radeon R4 (Stoney Ridge):
17.8  fps
low 1024x768
100%
Iris Pro Graphics 580:
107.2  fps
med. 1366x768
100%
Iris Pro Graphics 580:
81.2  fps
high 1366x768
100%
Iris Pro Graphics 580:
37.3  fps
ultra 1920x1080
100%
Iris Pro Graphics 580:
8.8  fps
low 1024x768
Radeon R4 (Stoney Ridge):
44.8  fps
med. 1366x768
Radeon R4 (Stoney Ridge):
31.9  fps
high 1366x768
Radeon R4 (Stoney Ridge):
27.7  fps
Anno 2070

Anno 2070

2011
low 1024x768
Radeon R4 (Stoney Ridge):
53.8  fps
med. 1366x768
Radeon R4 (Stoney Ridge):
23.7  fps
high 1366x768
Radeon R4 (Stoney Ridge):
15.5  fps
low 1280x720
Radeon R4 (Stoney Ridge):
25.7  fps
med. 1366x768
Radeon R4 (Stoney Ridge):
16.5  fps
high 1366x768
Radeon R4 (Stoney Ridge):
11.3  fps
low 1024x768
Radeon R4 (Stoney Ridge):
47.7  fps
high 1366x768
Radeon R4 (Stoney Ridge):
21.9  fps
Dirt 3

Dirt 3

2011
low 800x600
Radeon R4 (Stoney Ridge):
66.9  fps
med. 1024x768
Radeon R4 (Stoney Ridge):
39  fps
high 1360x768
Radeon R4 (Stoney Ridge):
28  fps
ultra 1920x1080
Radeon R4 (Stoney Ridge):
12.9  fps
low 1024x768
Radeon R4 (Stoney Ridge):
89.9  fps
med. 1360x768
Radeon R4 (Stoney Ridge):
24.1  fps

Average Gaming Intel Iris Pro Graphics 580 → 100%

Average Gaming 30-70 fps → 100%

Average Gaming AMD Radeon R4 (Stoney Ridge) → 36%

Average Gaming 30-70 fps → 43%

Intel Iris Pro Graphics 580AMD Radeon R4 (Stoney Ridge)
lowmed.highultraQHD4Klowmed.highultraQHD4K
Hunt Showdown7.1
Escape from Tarkov8.7
Red Dead Redemption 24.1
Star Wars Jedi Fallen Order4.8
Need for Speed Heat7.1
Ghost Recon Breakpoint5
Borderlands 38.2
Control8.1
F1 201911
Total War: Three Kingdoms11.8
Anno 180011.2
Dirt Rally 2.026.3
Far Cry New Dawn3
Metro Exodus7.2
Apex Legends12.3
Just Cause 410
Darksiders III20.65.2
Farming Simulator 1932.411.7
Hitman 26.6
Call of Duty Black Ops 48.8
Assassin´s Creed Odyssey9
Shadow of the Tomb Raider11
F1 201812
Monster Hunter World2.5
Far Cry 53
World of Tanks enCore80.310.7
X-Plane 11.1112.2
Kingdom Come: Deliverance7.3
Final Fantasy XV Benchmark6.8
ELEX8.9
Middle-earth: Shadow of War15
Team Fortress 22322.6
Dirt 429.4
Rocket League31.3
Ghost Recon Wildlands9.7
For Honor15.1
Resident Evil 724.318
Farming Simulator 173824.8
Battlefield 18.2
Civilization 627.3
Deus Ex Mankind Divided8.4
Overwatch60.553.342.923.120.716.9
Ashes of the Singularity7.3
World of Warships3022.1
Metal Gear Solid V59.958.62314.92617.9
Dota 2 Reborn59.837.215.3143219
Dirt Rally48.816.2
Battlefield Hardline15.112
Dragon Age: Inquisition15.110.9
F1 20143026
Middle-earth: Shadow of Mordor18.111.6
Sims 49028.8
GRID: Autosport5724.5
GRID 246.328.422.5
BioShock Infinite101.357.95114.93215125
Tomb Raider39.419.913.2
Dead Space 345.522.919.5
Counter-Strike: GO29.721.917.8
Diablo III44.831.927.7
Anno 207053.823.715.5
The Elder Scrolls V: Skyrim25.716.511.3
Deus Ex Human Revolution47.721.9
Dirt 366.9392812.9
StarCraft 289.924.1
Intel Iris Pro Graphics 580AMD Radeon R4 (Stoney Ridge)
lowmed.highultraQHD4Klowmed.highultraQHD4K
< 30 fps
< 60 fps
< 120 fps
≥ 120 fps

2
2

4

2
2

4


< 30 fps
< 60 fps
< 120 fps
≥ 120 fps
44
15
4
26
2

10


2


For more games that might be playable and a list of all games and graphics cards visit our Gaming List

Add one or more devices and compare

In the following list you can select (and also search for) devices that should be added to the comparison. You can select more than one device.

restrict list:
v1.33
log 02. 19:54:51

#0 ran 1s before starting gpusingle class +0s ... 0s

#1 checking url part for id 7236 +0s ... 0s

#2 checking url part for id 7445 +0s ... 0s

#3 redirected to Ajax server, took 1751478891s time from redirect:0 +0s ... 0s

#4 did not recreate cache, as it is less than 5 days old! Created at Tue, 01 Jul 2025 05:20:42 +0200 +0s ... 0s

#5 composed specs +0.016s ... 0.017s

#6 did output specs +0s ... 0.017s

#7 start showIntegratedCPUs +0s ... 0.017s

#8 getting avg benchmarks for device 7236 +0.018s ... 0.035s

#9 got single benchmarks 7236 +0.004s ... 0.038s

#10 getting avg benchmarks for device 7445 +0.003s ... 0.042s

#11 got single benchmarks 7445 +0.007s ... 0.049s

#12 got avg benchmarks for devices +0s ... 0.049s

#13 min, max, avg, median took s +0.02s ... 0.069s

#14 before gaming benchmark output +0s ... 0.069s

#15 Got 152 rows for game benchmarks. +0.005s ... 0.074s

#16 composed SQL query for gamebenchmarks +0s ... 0.074s

#17 got data and put it in $dataArray +0.003s ... 0.077s

#18 benchmarks composed for output. +0.022s ... 0.098s

#19 calculated avg scores. +0s ... 0.098s

#20 return log +0.001s ... 0.099s

Please share our article, every link counts!
Mail Logo
> Expert Reviews and News on Laptops, Smartphones and Tech Innovations > Benchmarks / Tech > Graphics Card Comparison - Head 2 Head
Redaktion, 2017-09- 8 (Update: 2023-07- 1)