

Intel Arc Graphics 140T vs Intel Graphics 4-Core iGPU (Arc)
Intel Arc Graphics 140T
► remove from comparison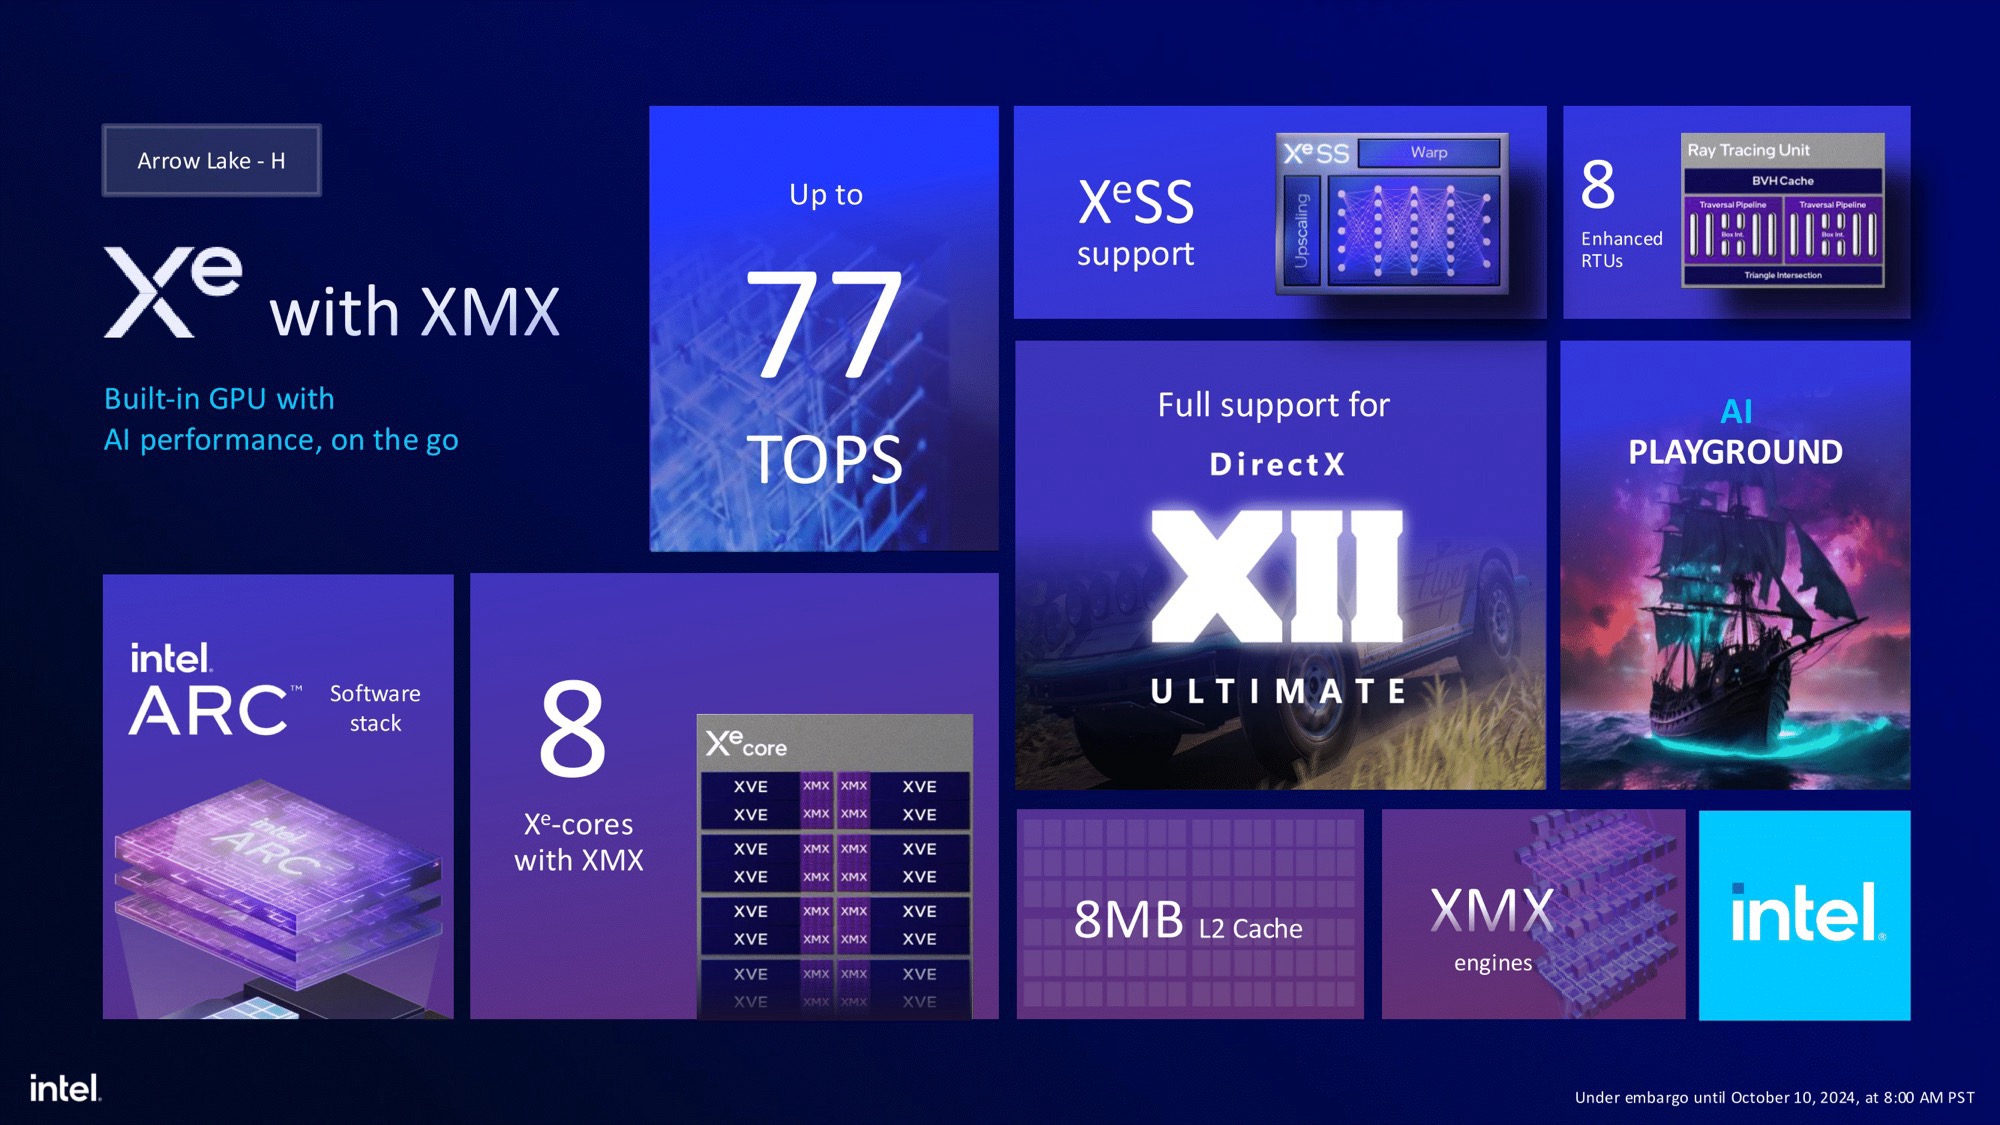
Intel Arc 140T is the iGPU used in the Intel Arrow Lake H/HX processor series. It is based on the Xe+ architecture (and not the newer Xe2 architecture that e.g. the Arc Graphics 140V in Lunar Lake uses). The graphics adapter features 8 cores (128 CUs, 8 Raytracing units) with XMX instructions for improved AI performance and 8 MB L2-Cache.
Thanks to the similar core count and clock speed but higher TDP, the performance should be similar to the Xe2 based Intel Arc 140V iGPU. First leaked benchmarks even showed a vastly better performance. All in all, we think that the Arc 140T will be only suited for entry level gaming in lowest settings.
The Arc 140T is integrated in the H and HX series of CPUs but use an own chiplet that is manufactured at TSMC in 5nm (N5P process).
Intel Graphics 4-Core iGPU (Arc)
► remove from comparison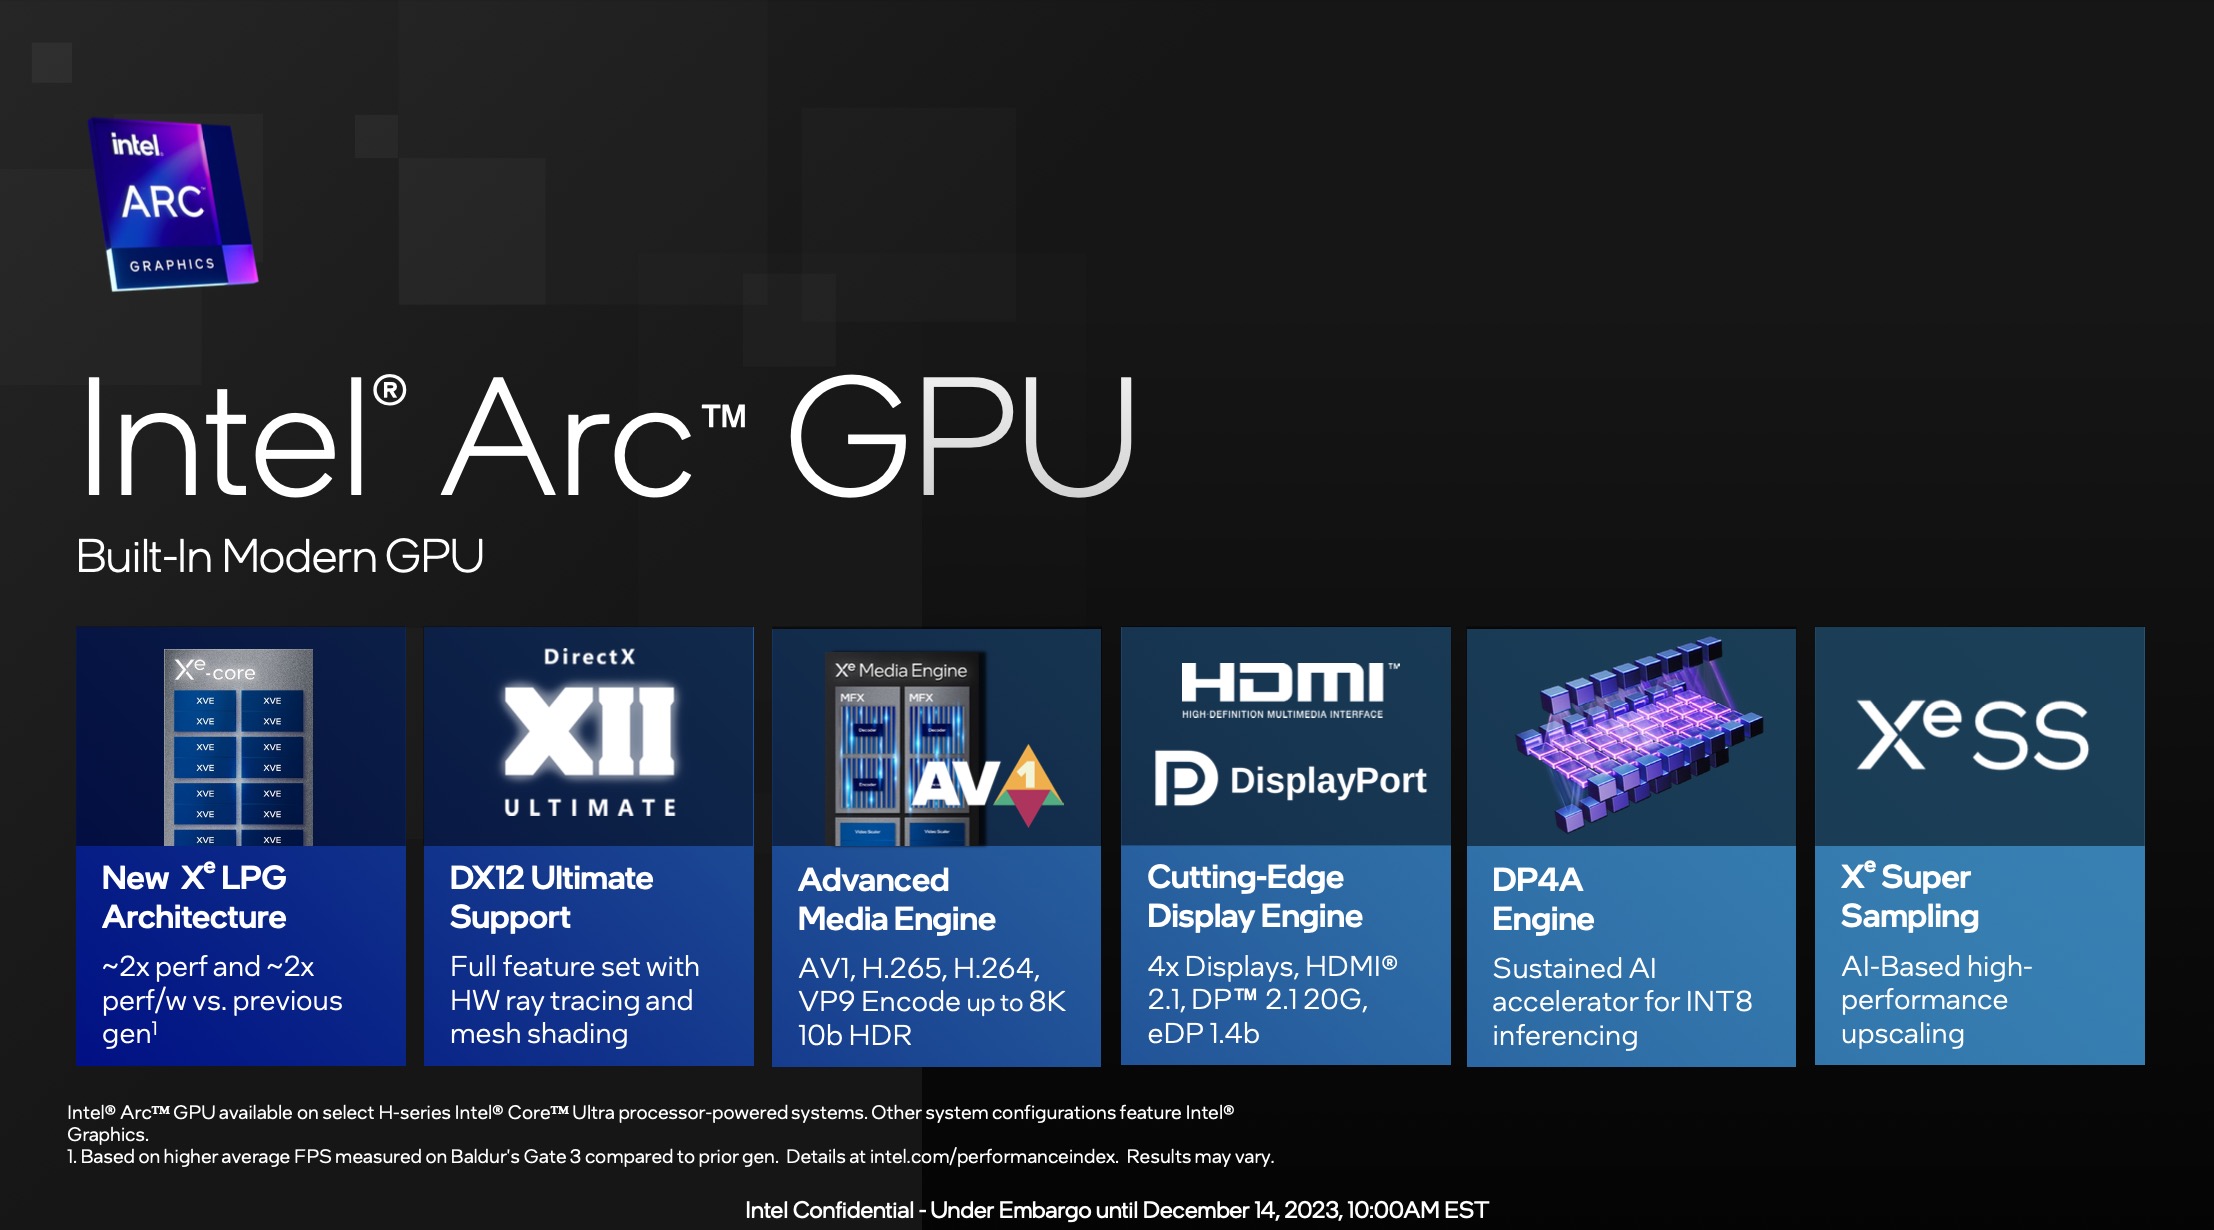
The Intel Graphics iGPU with 4 cores is an integrated graphics card based on the Xe LPG architecture (similar to the dedicated Arc GPUs, but with a focus on efficiency). It offers 4 Xe cores (64 Xe vector engines), 4 ray tracing units, 4 samplers and 2 pixel backends.
In contrast to the more powerful variant with 8 cores in the H Meteor Lake CPUs, the small variant is not allowed to use the Arc name.
The iGPU supports DirectX 12 Ultimate (probably DX 12_2 like the desktop Arc GPUs). The graphics unit also supports XeSS AI Super Sampling.
The media engine of Meteor Lake is in the SOC tile and supports up to 8k60 10-bit HDR encode and decode of MPEG2, AVC, VP9, HEVC and AV1. The display engine is also in the SoC tile and supports HDMI 2.1 and DisplayPort 2.1 20G with up to 8K60 HDR.
The GPU Tile of the Meteor Lake chip is manufactured at TSMC in 5nm (5N process).
| Intel Arc Graphics 140T | Intel Graphics 4-Core iGPU (Arc) | ||||||||||
| Architecture | Xe+ | Xe LPG | |||||||||
| Pipelines | 8 - unified | 4 - unified | |||||||||
| Raytracing Cores | 8 | 4 | |||||||||
| Cache | L2: 8 MB | L1: 768 KB | |||||||||
| Shared Memory | yes | no | |||||||||
| API | DirectX 12 Ultrimate | DirectX 12_2, OpenGL 4.6, Vulkan 1.3 | |||||||||
| Date of Announcement | 06.01.2025 | 14.12.2023 | |||||||||
| Arc LPG Series |
| ||||||||||
| Codename | Meteor Lake iGPU | ||||||||||
| Core Speed | 1950 (Boost) MHz | ||||||||||
| technology | 5 nm | ||||||||||
| Displays | HDMI 2.1, DisplayPort 2.1 20G |
|
| ||||||||||||||||||||||||||||||||||||||||||||||||||||||||||||||||||||||||||||||||||||||||||||||||||||||||||||
Benchmarks
| Model | CPU | GPU | RAM | Value |
|---|---|---|---|---|
| Lenovo ThinkPad E14 G7-21SYS00H00 | Ultra 7 255H 45 W / 28 W | Arc 140T 2050 MHz | 16 GB | 2769 |
| Lenovo ThinkPad E16 G3-21SSS00E00 | Ultra 7 255H | Arc 140T | 32 GB | 3879 |
| Geekom Mini IT15, Ultra 9 285H | Ultra 9 285H 64 W / 33 W | Arc 140T | 32 GB | 3974 |
| Lenovo ThinkBook 14 Gen 8 21SJ007SGE | Ultra 7 255H | Arc 140T | 32 GB | 4041 |
| Asus ZenBook Duo OLED UX8406CA | Ultra 9 285H 60 W / 35 W | Arc 140T 2250 MHz | 32 GB | 4330 |
| Lenovo Yoga Book 9 14IAH10 | Ultra 7 255H 62 W / 32 W | Arc 140T 2150 MHz | 16 GB | 4421 |
Khadas Mind 2s  | Ultra 7 255H 45 W / 35 W | Arc 140T | 64 GB | 4434 |
| MSI Prestige 16 AI Evo B2HMG | Ultra 9 285H 115 W / 45 W | Arc 140T 2250 MHz | 32 GB | 4639 |
| Xiaomi RedmiBook Pro 14 2025 | Ultra 7 255H 115 W / 45 W | Arc 140T | 32 GB | 4694 |
| Model | CPU | GPU | RAM | Value |
|---|---|---|---|---|
| Lenovo ThinkPad E14 G7-21SYS00H00 | Ultra 7 255H 45 W / 28 W | Arc 140T 2050 MHz | 16 GB | 2466 |
| Lenovo ThinkPad E16 G3-21SSS00E00 | Ultra 7 255H | Arc 140T | 32 GB | 3487 |
| Geekom Mini IT15, Ultra 9 285H | Ultra 9 285H 64 W / 33 W | Arc 140T | 32 GB | 3561 |
| Lenovo ThinkBook 14 Gen 8 21SJ007SGE | Ultra 7 255H | Arc 140T | 32 GB | 3629 |
| Lenovo Yoga Book 9 14IAH10 | Ultra 7 255H 62 W / 32 W | Arc 140T 2150 MHz | 16 GB | 3985 |
| Khadas Mind 2s | Ultra 7 255H 45 W / 35 W | Arc 140T | 64 GB | 4008 |
| Asus ZenBook Duo OLED UX8406CA | Ultra 9 285H 60 W / 35 W | Arc 140T 2250 MHz | 32 GB | 4074 |
| MSI Prestige 16 AI Evo B2HMG | Ultra 9 285H 115 W / 45 W | Arc 140T 2250 MHz | 32 GB | 4194 |
| Xiaomi RedmiBook Pro 14 2025 | Ultra 7 255H 115 W / 45 W | Arc 140T | 32 GB | 4212 |
| Model | CPU | GPU | RAM | Value |
|---|---|---|---|---|
| Geekom Mini IT15, Ultra 9 285H | Ultra 9 285H 64 W / 33 W | Arc 140T | 32 GB | 497297 |
| Khadas Mind 2s | Ultra 7 255H 45 W / 35 W | Arc 140T | 64 GB | 518657 |
| Model | CPU | GPU | RAM | Value |
|---|---|---|---|---|
| Asus ExpertBook B5 B5404CMA | Ultra 7 155U 57 W / 32 W | Graphics 4-Core | 16 GB | 294961 |
| HP Envy x360 2-in-1 14-fc0078TU | Ultra 5 125U 29 W / 23 W | Graphics 4-Core | 16 GB | 295187 |
| Dell Latitude 7450 2-in-1 | Ultra 7 165U 44 W / 38 W | Graphics 4-Core | 32 GB | 308872 |
| Model | CPU | GPU | RAM | Value |
|---|---|---|---|---|
| Geekom Mini IT15, Ultra 9 285H | Ultra 9 285H 64 W / 33 W | Arc 140T | 32 GB | 199219 |
| Khadas Mind 2s | Ultra 7 255H 45 W / 35 W | Arc 140T | 64 GB | 209928 |
| MSI Prestige 16 AI Evo B2HMG | Ultra 9 285H 115 W / 45 W | Arc 140T 2250 MHz | 32 GB | 237569 |
| Model | CPU | GPU | RAM | Value |
|---|---|---|---|---|
| HP Envy x360 2-in-1 14-fc0078TU | Ultra 5 125U 29 W / 23 W | Graphics 4-Core | 16 GB | 75102 |
| Asus ExpertBook B5 B5404CMA | Ultra 7 155U 57 W / 32 W | Graphics 4-Core | 16 GB | 113230 |
| Dell Latitude 7450 2-in-1 | Ultra 7 165U 44 W / 38 W | Graphics 4-Core | 32 GB | 120447 |
| Model | CPU | GPU | RAM | Value |
|---|---|---|---|---|
| Lenovo Yoga Book 9 14IAH10 | Ultra 7 255H 62 W / 32 W | Arc 140T 2150 MHz | 16 GB | 36844 |
| Geekom Mini IT15, Ultra 9 285H | Ultra 9 285H 64 W / 33 W | Arc 140T | 32 GB | 38464 |
| Khadas Mind 2s | Ultra 7 255H 45 W / 35 W | Arc 140T | 64 GB | 38746 |
| MSI Prestige 16 AI Evo B2HMG | Ultra 9 285H 115 W / 45 W | Arc 140T 2250 MHz | 32 GB | 40950 |
| Model | CPU | GPU | RAM | Value |
|---|---|---|---|---|
| Lenovo Yoga Book 9 14IAH10 | Ultra 7 255H 62 W / 32 W | Arc 140T 2150 MHz | 16 GB | 48687 |
| Geekom Mini IT15, Ultra 9 285H | Ultra 9 285H 64 W / 33 W | Arc 140T | 32 GB | 50533 |
| Khadas Mind 2s | Ultra 7 255H 45 W / 35 W | Arc 140T | 64 GB | 53391 |
| MSI Prestige 16 AI Evo B2HMG | Ultra 9 285H 115 W / 45 W | Arc 140T 2250 MHz | 32 GB | 54553 |
| Model | CPU | GPU | RAM | Value |
|---|---|---|---|---|
| Lenovo ThinkPad E14 G7-21SYS00H00 | Ultra 7 255H 45 W / 28 W | Arc 140T 2050 MHz | 16 GB | 4899 |
| Lenovo ThinkPad E16 G3-21SSS00E00 | Ultra 7 255H | Arc 140T | 32 GB | 7083 |
| Geekom Mini IT15, Ultra 9 285H | Ultra 9 285H 64 W / 33 W | Arc 140T | 32 GB | 7646 |
| Lenovo Yoga Book 9 14IAH10 | Ultra 7 255H 62 W / 32 W | Arc 140T 2150 MHz | 16 GB | 8153 |
| Lenovo ThinkBook 14 Gen 8 21SJ007SGE | Ultra 7 255H | Arc 140T | 32 GB | 8186 |
| MSI Prestige 16 AI Evo B2HMG | Ultra 9 285H 115 W / 45 W | Arc 140T 2250 MHz | 32 GB | 8721 |
| Khadas Mind 2s | Ultra 7 255H 45 W / 35 W | Arc 140T | 64 GB | 8769 |
| Xiaomi RedmiBook Pro 14 2025 | Ultra 7 255H 115 W / 45 W | Arc 140T | 32 GB | 8919 |
| Asus ZenBook Duo OLED UX8406CA | Ultra 9 285H 60 W / 35 W | Arc 140T 2250 MHz | 32 GB | 9595 |
| Model | CPU | GPU | RAM | Value |
|---|---|---|---|---|
| Lenovo ThinkPad E14 G7-21SYS00H00 | Ultra 7 255H 45 W / 28 W | Arc 140T 2050 MHz | 16 GB | 5433 |
| Lenovo ThinkPad E16 G3-21SSS00E00 | Ultra 7 255H | Arc 140T | 32 GB | 7652 |
| Geekom Mini IT15, Ultra 9 285H | Ultra 9 285H 64 W / 33 W | Arc 140T | 32 GB | 8307 |
| Lenovo Yoga Book 9 14IAH10 | Ultra 7 255H 62 W / 32 W | Arc 140T 2150 MHz | 16 GB | 8697 |
| MSI Prestige 16 AI Evo B2HMG | Ultra 9 285H 115 W / 45 W | Arc 140T 2250 MHz | 32 GB | 9173 |
| Xiaomi RedmiBook Pro 14 2025 | Ultra 7 255H 115 W / 45 W | Arc 140T | 32 GB | 9328 |
| Khadas Mind 2s | Ultra 7 255H 45 W / 35 W | Arc 140T | 64 GB | 9392 |
| Lenovo ThinkBook 14 Gen 8 21SJ007SGE | Ultra 7 255H | Arc 140T | 32 GB | 9870 |
| Asus ZenBook Duo OLED UX8406CA | Ultra 9 285H 60 W / 35 W | Arc 140T 2250 MHz | 32 GB | 10299 |
| Model | CPU | GPU | RAM | Value |
|---|---|---|---|---|
| Geekom Mini IT15, Ultra 9 285H | Ultra 9 285H 64 W / 33 W | Arc 140T | 32 GB | 231964 |
| Khadas Mind 2s | Ultra 7 255H 45 W / 35 W | Arc 140T | 64 GB | 249117 |
| MSI Prestige 16 AI Evo B2HMG | Ultra 9 285H 115 W / 45 W | Arc 140T 2250 MHz | 32 GB | 316591 |
| Model | CPU | GPU | RAM | Value |
|---|---|---|---|---|
| HP Envy x360 2-in-1 14-fc0078TU | Ultra 5 125U 29 W / 23 W | Graphics 4-Core | 16 GB | 89439 |
| Acer Aspire Spin 14 ASP14-52MTN-51V5 | Ultra 5 115U 57 W / 28 W | Graphics 4-Core 1800 MHz | 16 GB | 152161 |
| Dell Latitude 7450 2-in-1 | Ultra 7 165U 44 W / 38 W | Graphics 4-Core | 32 GB | 158290 |
| Asus ExpertBook B5 B5404CMA | Ultra 7 155U 57 W / 32 W | Graphics 4-Core | 16 GB | 163640 |
| Model | CPU | GPU | RAM | Value |
|---|---|---|---|---|
| Dell Latitude 7450 2-in-1 | Ultra 7 165U 44 W / 38 W | Graphics 4-Core | 32 GB | 14464 |
| Model | CPU | GPU | RAM | Value |
|---|---|---|---|---|
| Lenovo ThinkPad E14 G7-21SYS00H00 | Ultra 7 255H 45 W / 28 W | Arc 140T 2050 MHz | 16 GB | 3927 |
| Xiaomi RedmiBook Pro 14 2025 | Ultra 7 255H 115 W / 45 W | Arc 140T | 32 GB | 7632 |
| Model | CPU | GPU | RAM | Value |
|---|---|---|---|---|
| Lenovo ThinkPad E16 G3-21SSS00F00 | Ultra 5 225U 52 W / 35 W | Graphics 4-Core 1350 MHz | 16 GB | 2332 |
| Dell Latitude 7450 2-in-1 | Ultra 7 165U 44 W / 38 W | Graphics 4-Core | 32 GB | 3438 |
| Lenovo ThinkPad L13 2in1 G5 21LNS4AM00 | Ultra 5 125U 42 W / 15 W | Graphics 4-Core 1850 / 2800 MHz | 32 GB | 3631 |
| Lenovo ThinkPad X1 2in1 G9 21KE004AGE | Ultra 7 165U 40 W / 30 W | Graphics 4-Core 2000 MHz | 32 GB | 3681 |
| Model | CPU | GPU | RAM | Value |
|---|---|---|---|---|
| Geekom Mini IT15, Ultra 9 285H | Ultra 9 285H 64 W / 33 W | Arc 140T | 32 GB | 29556 |
| Khadas Mind 2s | Ultra 7 255H 45 W / 35 W | Arc 140T | 64 GB | 33359 |
| Model | CPU | GPU | RAM | Value |
|---|---|---|---|---|
| HP Envy x360 2-in-1 14-fc0078TU | Ultra 5 125U 29 W / 23 W | Graphics 4-Core | 16 GB | 18070 |
| Asus ExpertBook B5 B5404CMA | Ultra 7 155U 57 W / 32 W | Graphics 4-Core | 16 GB | 18446 |
| Dell Latitude 7450 2-in-1 | Ultra 7 165U 44 W / 38 W | Graphics 4-Core | 32 GB | 20000 |
| Model | CPU | GPU | RAM | Value |
|---|---|---|---|---|
| Geekom Mini IT15, Ultra 9 285H | Ultra 9 285H 64 W / 33 W | Arc 140T | 32 GB | 35478 |
| Khadas Mind 2s | Ultra 7 255H 45 W / 35 W | Arc 140T | 64 GB | 40046 |
| Model | CPU | GPU | RAM | Value |
|---|---|---|---|---|
| Asus ExpertBook B5 B5404CMA | Ultra 7 155U 57 W / 32 W | Graphics 4-Core | 16 GB | 21081 |
| HP Envy x360 2-in-1 14-fc0078TU | Ultra 5 125U 29 W / 23 W | Graphics 4-Core | 16 GB | 21828 |
| Dell Latitude 7450 2-in-1 | Ultra 7 165U 44 W / 38 W | Graphics 4-Core | 32 GB | 23544 |
| Model | CPU | GPU | RAM | Value |
|---|---|---|---|---|
| Lenovo ThinkPad E14 G7-21SYS00H00 | Ultra 7 255H 45 W / 28 W | Arc 140T 2050 MHz | 16 GB | 9776 |
| Lenovo ThinkPad E16 G3-21SSS00E00 | Ultra 7 255H | Arc 140T | 32 GB | 11279 |
| Lenovo Yoga Book 9 14IAH10 | Ultra 7 255H 62 W / 32 W | Arc 140T 2150 MHz | 16 GB | 12521 |
| Geekom Mini IT15, Ultra 9 285H | Ultra 9 285H 64 W / 33 W | Arc 140T | 32 GB | 13090 |
| Khadas Mind 2s | Ultra 7 255H 45 W / 35 W | Arc 140T | 64 GB | 13218 |
| MSI Prestige 16 AI Evo B2HMG | Ultra 9 285H 115 W / 45 W | Arc 140T 2250 MHz | 32 GB | 13286 |
| Xiaomi RedmiBook Pro 14 2025 | Ultra 7 255H 115 W / 45 W | Arc 140T | 32 GB | 13428 |
| Lenovo ThinkBook 14 Gen 8 21SJ007SGE | Ultra 7 255H | Arc 140T | 32 GB | 13813 |
| Asus ZenBook Duo OLED UX8406CA | Ultra 9 285H 60 W / 35 W | Arc 140T 2250 MHz | 32 GB | 14934 |
| Model | CPU | GPU | RAM | Value |
|---|---|---|---|---|
| Lenovo ThinkPad E14 G7-21SYS00H00 | Ultra 7 255H 45 W / 28 W | Arc 140T 2050 MHz | 16 GB | 9684 |
| Lenovo ThinkPad E16 G3-21SSS00E00 | Ultra 7 255H | Arc 140T | 32 GB | 10801 |
| Lenovo Yoga Book 9 14IAH10 | Ultra 7 255H 62 W / 32 W | Arc 140T 2150 MHz | 16 GB | 11868 |
| MSI Prestige 16 AI Evo B2HMG | Ultra 9 285H 115 W / 45 W | Arc 140T 2250 MHz | 32 GB | 12445 |
| Xiaomi RedmiBook Pro 14 2025 | Ultra 7 255H 115 W / 45 W | Arc 140T | 32 GB | 12566 |
| Khadas Mind 2s | Ultra 7 255H 45 W / 35 W | Arc 140T | 64 GB | 12634 |
| Geekom Mini IT15, Ultra 9 285H | Ultra 9 285H 64 W / 33 W | Arc 140T | 32 GB | 12740 |
| Lenovo ThinkBook 14 Gen 8 21SJ007SGE | Ultra 7 255H | Arc 140T | 32 GB | 13661 |
| Asus ZenBook Duo OLED UX8406CA | Ultra 9 285H 60 W / 35 W | Arc 140T 2250 MHz | 32 GB | 14932 |
3DM Vant. Perf. total + Intel Arc Graphics 140T
| Model | CPU | GPU | RAM | Value |
|---|---|---|---|---|
| Geekom Mini IT15, Ultra 9 285H | Ultra 9 285H 64 W / 33 W | Arc 140T | 32 GB | 52307 |
| Khadas Mind 2s | Ultra 7 255H 45 W / 35 W | Arc 140T | 64 GB | 55385 |
| MSI Prestige 16 AI Evo B2HMG | Ultra 9 285H 115 W / 45 W | Arc 140T 2250 MHz | 32 GB | 58039 |
| Model | CPU | GPU | RAM | Value |
|---|---|---|---|---|
| Geekom Mini IT15, Ultra 9 285H | Ultra 9 285H 64 W / 33 W | Arc 140T | 32 GB | 46778 |
| Khadas Mind 2s | Ultra 7 255H 45 W / 35 W | Arc 140T | 64 GB | 50059 |
| MSI Prestige 16 AI Evo B2HMG | Ultra 9 285H 115 W / 45 W | Arc 140T 2250 MHz | 32 GB | 52086 |
| Model | CPU | GPU | RAM | Value |
|---|---|---|---|---|
| Khadas Mind 2s | Ultra 7 255H 45 W / 35 W | Arc 140T | 64 GB | 48490 |
| Geekom Mini IT15, Ultra 9 285H | Ultra 9 285H 64 W / 33 W | Arc 140T | 32 GB | 54520 |
| Model | CPU | GPU | RAM | Value | |
|---|---|---|---|---|---|
| 3DMark 06 - Standard 1280x1024 | |||||
| Geekom Mini IT15, Ultra 9 285H (3DMark 06 - Standard 1280x1024) | Ultra 9 285H 64 W / 33 W | Arc 140T | 32 GB | 45558 | |
| Khadas Mind 2s (3DMark 06 - Standard 1280x1024) | Ultra 7 255H 45 W / 35 W | Arc 140T | 64 GB | 46776 | |
| MSI Prestige 16 AI Evo B2HMG (3DMark 06 - Standard 1280x1024) | Ultra 9 285H 115 W / 45 W | Arc 140T 2250 MHz | 32 GB | 48766 | |
| Model | CPU | GPU | RAM | Value | |
|---|---|---|---|---|---|
| 3DMark 06 - Standard 1280x1024 | |||||
| Acer Aspire Spin 14 ASP14-52MTN-51V5 (3DMark 06 - Standard 1280x1024) | Ultra 5 115U 57 W / 28 W | Graphics 4-Core 1800 MHz | 16 GB | 27772 | |
| Model | CPU | GPU | RAM | Value |
|---|---|---|---|---|
| Geekom Mini IT15, Ultra 9 285H | Ultra 9 285H 64 W / 33 W | Arc 140T | 32 GB | 25.4 |
| Khadas Mind 2s | Ultra 7 255H 45 W / 35 W | Arc 140T | 64 GB | 30.4 |
specvp12 sw-03 + Intel Arc Graphics 140T
| Model | CPU | GPU | RAM | Value |
|---|---|---|---|---|
| Geekom Mini IT15, Ultra 9 285H | Ultra 9 285H 64 W / 33 W | Arc 140T | 32 GB | 65 |
| Khadas Mind 2s | Ultra 7 255H 45 W / 35 W | Arc 140T | 64 GB | 81.6 |
| Model | CPU | GPU | RAM | Value |
|---|---|---|---|---|
| Khadas Mind 2s | Ultra 7 255H 45 W / 35 W | Arc 140T | 64 GB | 3.75 |
| Geekom Mini IT15, Ultra 9 285H | Ultra 9 285H 64 W / 33 W | Arc 140T | 32 GB | 4.02 |
| Model | CPU | GPU | RAM | Value |
|---|---|---|---|---|
| Geekom Mini IT15, Ultra 9 285H | Ultra 9 285H 64 W / 33 W | Arc 140T | 32 GB | 27.7 |
| Khadas Mind 2s | Ultra 7 255H 45 W / 35 W | Arc 140T | 64 GB | 34.2 |
| Model | CPU | GPU | RAM | Value |
|---|---|---|---|---|
| Khadas Mind 2s | Ultra 7 255H 45 W / 35 W | Arc 140T | 64 GB | 19.3 |
| Geekom Mini IT15, Ultra 9 285H | Ultra 9 285H 64 W / 33 W | Arc 140T | 32 GB | 19.3 |
| Model | CPU | GPU | RAM | Value |
|---|---|---|---|---|
| Geekom Mini IT15, Ultra 9 285H | Ultra 9 285H 64 W / 33 W | Arc 140T | 32 GB | 69 |
| Khadas Mind 2s | Ultra 7 255H 45 W / 35 W | Arc 140T | 64 GB | 78.2 |
| Model | CPU | GPU | RAM | Value |
|---|---|---|---|---|
| Geekom Mini IT15, Ultra 9 285H | Ultra 9 285H 64 W / 33 W | Arc 140T | 32 GB | 0.81 |
| Khadas Mind 2s | Ultra 7 255H 45 W / 35 W | Arc 140T | 64 GB | 0.92 |
| Model | CPU | GPU | RAM | Value |
|---|---|---|---|---|
| Khadas Mind 2s | Ultra 7 255H 45 W / 35 W | Arc 140T | 64 GB | 36.1 |
| Geekom Mini IT15, Ultra 9 285H | Ultra 9 285H 64 W / 33 W | Arc 140T | 32 GB | 36.1 |
| Model | CPU | GPU | RAM | Value |
|---|---|---|---|---|
| Khadas Mind 2s | Ultra 7 255H 45 W / 35 W | Arc 140T | 64 GB | 71.4 |
| Geekom Mini IT15, Ultra 9 285H | Ultra 9 285H 64 W / 33 W | Arc 140T | 32 GB | 71.8 |
| Model | CPU | GPU | RAM | Value |
|---|---|---|---|---|
| Geekom Mini IT15, Ultra 9 285H | Ultra 9 285H 64 W / 33 W | Arc 140T | 32 GB | 69 |
| Khadas Mind 2s | Ultra 7 255H 45 W / 35 W | Arc 140T | 64 GB | 69.9 |
| Model | CPU | GPU | RAM | Value |
|---|---|---|---|---|
| Khadas Mind 2s | Ultra 7 255H 45 W / 35 W | Arc 140T | 64 GB | 67.1 |
| Geekom Mini IT15, Ultra 9 285H | Ultra 9 285H 64 W / 33 W | Arc 140T | 32 GB | 73.4 |
| Model | CPU | GPU | RAM | Value |
|---|---|---|---|---|
| Khadas Mind 2s | Ultra 7 255H 45 W / 35 W | Arc 140T | 64 GB | 6.64 |
| Geekom Mini IT15, Ultra 9 285H | Ultra 9 285H 64 W / 33 W | Arc 140T | 32 GB | 7.05 |
| Model | CPU | GPU | RAM | Value |
|---|---|---|---|---|
| Geekom Mini IT15, Ultra 9 285H | Ultra 9 285H 64 W / 33 W | Arc 140T | 32 GB | 26.9 |
| Khadas Mind 2s | Ultra 7 255H 45 W / 35 W | Arc 140T | 64 GB | 30.5 |
| Model | CPU | GPU | RAM | Value |
|---|---|---|---|---|
| Khadas Mind 2s | Ultra 7 255H 45 W / 35 W | Arc 140T | 64 GB | 31.1 |
| Geekom Mini IT15, Ultra 9 285H | Ultra 9 285H 64 W / 33 W | Arc 140T | 32 GB | 31.1 |
| Model | CPU | GPU | RAM | Value |
|---|---|---|---|---|
| Geekom Mini IT15, Ultra 9 285H | Ultra 9 285H 64 W / 33 W | Arc 140T | 32 GB | 78.3 |
| Khadas Mind 2s | Ultra 7 255H 45 W / 35 W | Arc 140T | 64 GB | 82.7 |
| Model | CPU | GPU | RAM | Value |
|---|---|---|---|---|
| Khadas Mind 2s | Ultra 7 255H 45 W / 35 W | Arc 140T | 64 GB | 6.39 |
| Geekom Mini IT15, Ultra 9 285H | Ultra 9 285H 64 W / 33 W | Arc 140T | 32 GB | 6.81 |
| Model | CPU | GPU | RAM | Value |
|---|---|---|---|---|
| Khadas Mind 2s | Ultra 7 255H 45 W / 35 W | Arc 140T | 64 GB | 48.8 |
| Geekom Mini IT15, Ultra 9 285H | Ultra 9 285H 64 W / 33 W | Arc 140T | 32 GB | 51 |
| Model | CPU | GPU | RAM | Value |
|---|---|---|---|---|
| Khadas Mind 2s | Ultra 7 255H 45 W / 35 W | Arc 140T | 64 GB | 96.9 |
| Geekom Mini IT15, Ultra 9 285H | Ultra 9 285H 64 W / 33 W | Arc 140T | 32 GB | 99.6 |
| Model | CPU | GPU | RAM | Value |
|---|---|---|---|---|
| Geekom Mini IT15, Ultra 9 285H | Ultra 9 285H 64 W / 33 W | Arc 140T | 32 GB | 58.1 |
| Khadas Mind 2s | Ultra 7 255H 45 W / 35 W | Arc 140T | 64 GB | 60.5 |
| Model | CPU | GPU | RAM | Value |
|---|---|---|---|---|
| Khadas Mind 2s | Ultra 7 255H 45 W / 35 W | Arc 140T | 64 GB | 6.76 |
| Geekom Mini IT15, Ultra 9 285H | Ultra 9 285H 64 W / 33 W | Arc 140T | 32 GB | 7.02 |
| Model | CPU | GPU | RAM | Value |
|---|---|---|---|---|
| Khadas Mind 2s | Ultra 7 255H 45 W / 35 W | Arc 140T | 64 GB | 16.9 |
| Geekom Mini IT15, Ultra 9 285H | Ultra 9 285H 64 W / 33 W | Arc 140T | 32 GB | 17.7 |
| Model | CPU | GPU | RAM | Value |
|---|---|---|---|---|
| Geekom Mini IT15, Ultra 9 285H | Ultra 9 285H 64 W / 33 W | Arc 140T | 32 GB | 119 |
| Khadas Mind 2s | Ultra 7 255H 45 W / 35 W | Arc 140T | 64 GB | 128 |
| Model | CPU | GPU | RAM | Value |
|---|---|---|---|---|
| Khadas Mind 2s | Ultra 7 255H 45 W / 35 W | Arc 140T | 64 GB | 6.84 |
| Geekom Mini IT15, Ultra 9 285H | Ultra 9 285H 64 W / 33 W | Arc 140T | 32 GB | 6.89 |
| Model | CPU | GPU | RAM | Value |
|---|---|---|---|---|
| Khadas Mind 2s | Ultra 7 255H 45 W / 35 W | Arc 140T | 64 GB | 37.1 |
| Geekom Mini IT15, Ultra 9 285H | Ultra 9 285H 64 W / 33 W | Arc 140T | 32 GB | 38.8 |
| Model | CPU | GPU | RAM | Value |
|---|---|---|---|---|
| Khadas Mind 2s | Ultra 7 255H 45 W / 35 W | Arc 140T | 64 GB | 23.8 |
| Geekom Mini IT15, Ultra 9 285H | Ultra 9 285H 64 W / 33 W | Arc 140T | 32 GB | 24.3 |
| Model | CPU | GPU | RAM | Value |
|---|---|---|---|---|
| Khadas Mind 2s | Ultra 7 255H 45 W / 35 W | Arc 140T | 64 GB | 25.3 |
| Geekom Mini IT15, Ultra 9 285H | Ultra 9 285H 64 W / 33 W | Arc 140T | 32 GB | 26.6 |
| Model | CPU | GPU | RAM | Value |
|---|---|---|---|---|
| Khadas Mind 2s | Ultra 7 255H 45 W / 35 W | Arc 140T | 64 GB | 6.27 |
| Geekom Mini IT15, Ultra 9 285H | Ultra 9 285H 64 W / 33 W | Arc 140T | 32 GB | 6.81 |
| Model | CPU | GPU | RAM | Value |
|---|---|---|---|---|
| Khadas Mind 2s | Ultra 7 255H 45 W / 35 W | Arc 140T | 64 GB | 6.8 |
| Geekom Mini IT15, Ultra 9 285H | Ultra 9 285H 64 W / 33 W | Arc 140T | 32 GB | 7.08 |
| Model | CPU | GPU | RAM | Value |
|---|---|---|---|---|
| Geekom Mini IT15, Ultra 9 285H | Ultra 9 285H 64 W / 33 W | Arc 140T | 32 GB | 51.3 |
| Khadas Mind 2s | Ultra 7 255H 45 W / 35 W | Arc 140T | 64 GB | 53.1 |
| Model | CPU | GPU | RAM | Value |
|---|---|---|---|---|
| Khadas Mind 2s | Ultra 7 255H 45 W / 35 W | Arc 140T | 64 GB | 7.27 |
| Geekom Mini IT15, Ultra 9 285H | Ultra 9 285H 64 W / 33 W | Arc 140T | 32 GB | 7.94 |
| Model | CPU | GPU | RAM | Value |
|---|---|---|---|---|
| Khadas Mind 2s | Ultra 7 255H 45 W / 35 W | Arc 140T | 64 GB | 24 |
| Geekom Mini IT15, Ultra 9 285H | Ultra 9 285H 64 W / 33 W | Arc 140T | 32 GB | 26.7 |
| Model | CPU | GPU | RAM | Value |
|---|---|---|---|---|
| Khadas Mind 2s | Ultra 7 255H 45 W / 35 W | Arc 140T | 64 GB | 14.3 |
| Geekom Mini IT15, Ultra 9 285H | Ultra 9 285H 64 W / 33 W | Arc 140T | 32 GB | 14.6 |
| Model | CPU | GPU | RAM | Value |
|---|---|---|---|---|
| Khadas Mind 2s | Ultra 7 255H 45 W / 35 W | Arc 140T | 64 GB | 16.6 |
| Geekom Mini IT15, Ultra 9 285H | Ultra 9 285H 64 W / 33 W | Arc 140T | 32 GB | 17.8 |
| Model | CPU | GPU | RAM | Value |
|---|---|---|---|---|
| Khadas Mind 2s | Ultra 7 255H 45 W / 35 W | Arc 140T | 64 GB | 13323 |
| Geekom Mini IT15, Ultra 9 285H | Ultra 9 285H 64 W / 33 W | Arc 140T | 32 GB | 19230 |
| MSI Prestige 16 AI Evo B2HMG | Ultra 9 285H 115 W / 45 W | Arc 140T 2250 MHz | 32 GB | 21927 |
| Model | CPU | GPU | RAM | Value |
|---|---|---|---|---|
| Lenovo ThinkPad E16 G3-21SSS00F00 | Ultra 5 225U 52 W / 35 W | Graphics 4-Core 1350 MHz | 16 GB | 15457 |
| Model | CPU | GPU | RAM | Value |
|---|---|---|---|---|
| Khadas Mind 2s | Ultra 7 255H 45 W / 35 W | Arc 140T | 64 GB | 155.37 |
| MSI Prestige 16 AI Evo B2HMG | Ultra 9 285H 115 W / 45 W | Arc 140T 2250 MHz | 32 GB | 159.11 |
| Geekom Mini IT15, Ultra 9 285H | Ultra 9 285H 64 W / 33 W | Arc 140T | 32 GB | 174.65 |
| Model | CPU | GPU | RAM | Value |
|---|---|---|---|---|
| Lenovo ThinkPad E16 G3-21SSS00F00 | Ultra 5 225U 52 W / 35 W | Graphics 4-Core 1350 MHz | 16 GB | 88.36 |
Cinebench R15 OpenGL 64 Bit + Intel Arc Graphics 140T
| Model | CPU | GPU | RAM | Value |
|---|---|---|---|---|
| Asus Zenbook 14 OLED UX3405CA | Ultra 7 255H | Arc 140T | 32 GB | 152 |
| Lenovo ThinkPad E14 G7-21SYS00H00 | Ultra 7 255H 45 W / 28 W | Arc 140T 2050 MHz | 16 GB | 158.9 |
| Xiaomi RedmiBook Pro 14 2025 | Ultra 7 255H 115 W / 45 W | Arc 140T | 32 GB | 195.5 |
| HP ZBook 8 G1i 14 | Ultra 7 255H | Arc 140T | 201 | |
| MSI Prestige 16 AI Evo B2HMG | Ultra 9 285H 115 W / 45 W | Arc 140T 2250 MHz | 32 GB | 203 |
| Asus ZenBook Duo OLED UX8406CA | Ultra 9 285H 60 W / 35 W | Arc 140T 2250 MHz | 32 GB | 205 |
| Khadas Mind 2s | Ultra 7 255H 45 W / 35 W | Arc 140T | 64 GB | 206.47 |
| Lenovo Yoga Book 9 14IAH10 | Ultra 7 255H 62 W / 32 W | Arc 140T 2150 MHz | 16 GB | 207 |
| Lenovo ThinkBook 14 Gen 8 21SJ007SGE | Ultra 7 255H | Arc 140T | 32 GB | 209 |
| Lenovo ThinkPad E16 G3-21SSS00E00 | Ultra 7 255H | Arc 140T | 32 GB | 210 |
| Geekom Mini IT15, Ultra 9 285H | Ultra 9 285H 64 W / 33 W | Arc 140T | 32 GB | 219.75 |
| Model | CPU | GPU | RAM | Value |
|---|---|---|---|---|
| Asus ZenBook Duo OLED UX8406CA | Ultra 9 285H 60 W / 35 W | Arc 140T 2250 MHz | 32 GB | 97.8 |
| MSI Prestige 16 AI Evo B2HMG | Ultra 9 285H 115 W / 45 W | Arc 140T 2250 MHz | 32 GB | 97.8 |
| Asus Zenbook 14 OLED UX3405CA | Ultra 7 255H | Arc 140T | 32 GB | 97.8 |
| Xiaomi RedmiBook Pro 14 2025 | Ultra 7 255H 115 W / 45 W | Arc 140T | 32 GB | 97.8 |
| Lenovo Yoga Book 9 14IAH10 | Ultra 7 255H 62 W / 32 W | Arc 140T 2150 MHz | 16 GB | 97.8 |
| Lenovo ThinkBook 14 Gen 8 21SJ007SGE | Ultra 7 255H | Arc 140T | 32 GB | 97.8 |
| Khadas Mind 2s | Ultra 7 255H 45 W / 35 W | Arc 140T | 64 GB | 97.8 |
| Geekom Mini IT15, Ultra 9 285H | Ultra 9 285H 64 W / 33 W | Arc 140T | 32 GB | 97.8 |
| HP ZBook 8 G1i 14 | Ultra 7 255H | Arc 140T | 97.8 | |
| Lenovo ThinkPad E16 G3-21SSS00E00 | Ultra 7 255H | Arc 140T | 32 GB | 97.8 |
| Lenovo ThinkPad E14 G7-21SYS00H00 | Ultra 7 255H 45 W / 28 W | Arc 140T 2050 MHz | 16 GB | 97.8 |
| Model | CPU | GPU | RAM | Value |
|---|---|---|---|---|
| Lenovo ThinkBook 14 Gen 8 21SJ007SGE | Ultra 7 255H | Arc 140T | 32 GB | 38.3 |
| MSI Prestige 16 AI Evo B2HMG | Ultra 9 285H 115 W / 45 W | Arc 140T 2250 MHz | 32 GB | 44.1 |
| Model | CPU | GPU | RAM | Value |
|---|---|---|---|---|
| Lenovo ThinkPad T14 G5 21ML005JGE | Ultra 7 155U 40 W / 22.5 W | Graphics 4-Core | 16 GB | 16.8173 |
| Lenovo ThinkPad T14s Gen 5 21LS001PGE | Ultra 5 125U 40 W / 25 W | Graphics 4-Core | 16 GB | 20.7 |
| Lenovo ThinkPad T16 Gen 3 21MN005XGE | Ultra 5 125U | Graphics 4-Core | 32 GB | 20.8 |
| Model | CPU | GPU | RAM | Value |
|---|---|---|---|---|
| Lenovo ThinkBook 14 Gen 8 21SJ007SGE | Ultra 7 255H | Arc 140T | 32 GB | 81.3 |
| MSI Prestige 16 AI Evo B2HMG | Ultra 9 285H 115 W / 45 W | Arc 140T 2250 MHz | 32 GB | 100.3 |
| Model | CPU | GPU | RAM | Value |
|---|---|---|---|---|
| Lenovo ThinkPad T14 G5 21ML005JGE | Ultra 7 155U 40 W / 22.5 W | Graphics 4-Core | 16 GB | 37.3169 |
| Lenovo ThinkPad T16 Gen 3 21MN005XGE | Ultra 5 125U | Graphics 4-Core | 32 GB | 48.8 |
| Lenovo ThinkPad T14s Gen 5 21LS001PGE | Ultra 5 125U 40 W / 25 W | Graphics 4-Core | 16 GB | 49.1 |
| Model | CPU | GPU | RAM | Value |
|---|---|---|---|---|
| Lenovo ThinkBook 14 Gen 8 21SJ007SGE | Ultra 7 255H | Arc 140T | 32 GB | 208.5 |
| MSI Prestige 16 AI Evo B2HMG | Ultra 9 285H 115 W / 45 W | Arc 140T 2250 MHz | 32 GB | 250.7 |
| Model | CPU | GPU | RAM | Value |
|---|---|---|---|---|
| Lenovo ThinkPad T14 G5 21ML005JGE | Ultra 7 155U 40 W / 22.5 W | Graphics 4-Core | 16 GB | 91.8253 |
| Lenovo ThinkPad T16 Gen 3 21MN005XGE | Ultra 5 125U | Graphics 4-Core | 32 GB | 129.2 |
| Lenovo ThinkPad T14s Gen 5 21LS001PGE | Ultra 5 125U 40 W / 25 W | Graphics 4-Core | 16 GB | 129.5 |
| Model | CPU | GPU | RAM | Value |
|---|---|---|---|---|
| Lenovo ThinkBook 14 Gen 8 21SJ007SGE | Ultra 7 255H | Arc 140T | 32 GB | 155.2 |
| MSI Prestige 16 AI Evo B2HMG | Ultra 9 285H 115 W / 45 W | Arc 140T 2250 MHz | 32 GB | 174.6 |
| Model | CPU | GPU | RAM | Value |
|---|---|---|---|---|
| Lenovo ThinkPad T14 G5 21ML005JGE | Ultra 7 155U 40 W / 22.5 W | Graphics 4-Core | 16 GB | 75.6254 |
| Lenovo ThinkPad T14s Gen 5 21LS001PGE | Ultra 5 125U 40 W / 25 W | Graphics 4-Core | 16 GB | 89.5 |
| Lenovo ThinkPad T16 Gen 3 21MN005XGE | Ultra 5 125U | Graphics 4-Core | 32 GB | 91.5 |
| Model | CPU | GPU | RAM | Value |
|---|---|---|---|---|
| Lenovo ThinkBook 14 Gen 8 21SJ007SGE | Ultra 7 255H | Arc 140T | 32 GB | 249.6 |
| MSI Prestige 16 AI Evo B2HMG | Ultra 9 285H 115 W / 45 W | Arc 140T 2250 MHz | 32 GB | 289.3 |
| Model | CPU | GPU | RAM | Value |
|---|---|---|---|---|
| Lenovo ThinkPad T14 G5 21ML005JGE | Ultra 7 155U 40 W / 22.5 W | Graphics 4-Core | 16 GB | 117.479 |
| Lenovo ThinkPad T16 Gen 3 21MN005XGE | Ultra 5 125U | Graphics 4-Core | 32 GB | 160.1 |
| Lenovo ThinkPad T14s Gen 5 21LS001PGE | Ultra 5 125U 40 W / 25 W | Graphics 4-Core | 16 GB | 161.9 |
| Model | CPU | GPU | RAM | Value |
|---|---|---|---|---|
| Lenovo ThinkBook 14 Gen 8 21SJ007SGE | Ultra 7 255H | Arc 140T | 32 GB | 374.3 |
| MSI Prestige 16 AI Evo B2HMG | Ultra 9 285H 115 W / 45 W | Arc 140T 2250 MHz | 32 GB | 436.2 |
| Model | CPU | GPU | RAM | Value |
|---|---|---|---|---|
| Lenovo ThinkPad T14 G5 21ML005JGE | Ultra 7 155U 40 W / 22.5 W | Graphics 4-Core | 16 GB | 173.822 |
| Lenovo ThinkPad T16 Gen 3 21MN005XGE | Ultra 5 125U | Graphics 4-Core | 32 GB | 246.1 |
| Lenovo ThinkPad T14s Gen 5 21LS001PGE | Ultra 5 125U 40 W / 25 W | Graphics 4-Core | 16 GB | 256.6 |
GFXBench T-Rex HD Offscreen C24Z16 + Intel Arc Graphics 140T
| Model | CPU | GPU | RAM | Value |
|---|---|---|---|---|
| Lenovo ThinkBook 14 Gen 8 21SJ007SGE | Ultra 7 255H | Arc 140T | 32 GB | 822.6 |
| MSI Prestige 16 AI Evo B2HMG | Ultra 9 285H 115 W / 45 W | Arc 140T 2250 MHz | 32 GB | 927 |
| Model | CPU | GPU | RAM | Value |
|---|---|---|---|---|
| Lenovo ThinkPad T14 G5 21ML005JGE | Ultra 7 155U 40 W / 22.5 W | Graphics 4-Core | 16 GB | 370.774 |
| Lenovo ThinkPad T14s Gen 5 21LS001PGE | Ultra 5 125U 40 W / 25 W | Graphics 4-Core | 16 GB | 466.5 |
| Lenovo ThinkPad T16 Gen 3 21MN005XGE | Ultra 5 125U | Graphics 4-Core | 32 GB | 467 |
| Model | CPU | GPU | RAM | Value |
|---|---|---|---|---|
| Lenovo Yoga Book 9 14IAH10 | Ultra 7 255H 62 W / 32 W | Arc 140T 2150 MHz bc7 | 16 GB | 104.6 |
| Lenovo ThinkBook 14 Gen 8 21SJ007SGE | Ultra 7 255H | Arc 140T bc7 | 32 GB | 104.6 |
| HP ZBook 8 G1i 14 | Ultra 7 255H | Arc 140T bc7 | 104.6 | |
| Asus Zenbook 14 OLED UX3405CA | Ultra 7 255H | Arc 140T bc7 | 32 GB | 287 |
| Xiaomi RedmiBook Pro 14 2025 | Ultra 7 255H 115 W / 45 W | Arc 140T bc7 | 32 GB | 315 |
| Lenovo ThinkPad E14 G7-21SYS00H00 | Ultra 7 255H 45 W / 28 W | Arc 140T 2050 MHz bc7 | 16 GB | 315 |
| MSI Prestige 16 AI Evo B2HMG | Ultra 9 285H 115 W / 45 W | Arc 140T 2250 MHz bc7 | 32 GB | 327 |
| Asus ZenBook Duo OLED UX8406CA | Ultra 9 285H 60 W / 35 W | Arc 140T 2250 MHz bc7 | 32 GB | 379 |
| Khadas Mind 2s | Ultra 7 255H 45 W / 35 W | Arc 140T bc7 | 64 GB | 1528 |
| Geekom Mini IT15, Ultra 9 285H | Ultra 9 285H 64 W / 33 W | Arc 140T bc7 | 32 GB | 1528 |
| Model | CPU | GPU | RAM | Value |
|---|---|---|---|---|
| Lenovo Yoga Book 9 14IAH10 | Ultra 7 255H 62 W / 32 W | Arc 140T 2150 MHz bc7 | 16 GB | 3.64 |
| Khadas Mind 2s | Ultra 7 255H 45 W / 35 W | Arc 140T bc7 | 64 GB | 143.6 |
| Geekom Mini IT15, Ultra 9 285H | Ultra 9 285H 64 W / 33 W | Arc 140T bc7 | 32 GB | 143.6 |
| Model | CPU | GPU | RAM | Value |
|---|---|---|---|---|
| Dell Latitude 9450 2-in-1 | Ultra 7 165U 38 W / 21 W | Graphics 4-Core 2000 MHz bc7 | 32 GB | 3.64 |
| Lenovo Yoga Book 9 13IMU9 | Ultra 7 155U 36 W / 24 W | Graphics 4-Core 1950 MHz bc7 | 16 GB | 3.64 |
| Lenovo Yoga 7 2-in-1 16IML9 | Ultra 5 125U 41 W / 29 W | Graphics 4-Core 1850 MHz bc7 | 16 GB | 3.64 |
| Lenovo ThinkBook 14 2-in-1 G4 IML | Ultra 5 125U 49 W / 25 W | Graphics 4-Core 1850 MHz bc7 | 16 GB | 3.64 |
| Dell Latitude 13 7350 | Ultra 5 135U 59 W / 18 W | Graphics 4-Core 1900 MHz bc7 | 32 GB | 3.64 |
| Lenovo Yoga 7 2-in-1 14IML9 | Ultra 5 125U 42 W / 23 W | Graphics 4-Core 1850 MHz bc7 | 16 GB | 3.64 |
| Dell Latitude 7350 Detachable | Ultra 7 164U 31 W / 16 W | Graphics 4-Core 1800 MHz bc7 | 32 GB | 3.64 |
| Lenovo ThinkPad E14 G6 | Ultra 7 155U 59 W / 36 W | Graphics 4-Core 1950 MHz bc7 | 16 GB | 3.64 |
| Lenovo ThinkBook 16 G7 IML | Ultra 5 125U 50 W / 30 W | Graphics 4-Core 1850 MHz bc7 | 16 GB | 3.64 |
| HP Envy x360 15 fe1071cl | Ultra 7 155U | Graphics 4-Core 1950 / 800 MHz bc7 | 16 GB | 3.64 |
| Lenovo IdeaPad 5 2-in-1 16IAL10 | Ultra 7 255U 56 W / 34 W | Graphics 4-Core 2100 MHz bc7 | 16 GB | 3.64 |
| Model | CPU | GPU | RAM | Value |
|---|---|---|---|---|
| Lenovo ThinkPad E14 G7-21SYS00H00 | Ultra 7 255H 45 W / 28 W | Arc 140T 2050 MHz 6.4.0 Pro | 16 GB | 30391 |
| Lenovo ThinkPad E16 G3-21SSS00E00 | Ultra 7 255H | Arc 140T 6.4.0 Pro | 32 GB | 38091 |
| Lenovo ThinkBook 14 Gen 8 21SJ007SGE | Ultra 7 255H | Arc 140T 6.4.0 Pro | 32 GB | 39288 |
| Asus Zenbook 14 OLED UX3405CA | Ultra 7 255H | Arc 140T 6.4.0 Pro | 32 GB | 40024 |
| HP ZBook 8 G1i 14 | Ultra 7 255H | Arc 140T 6.4.0 Pro | 41013 | |
| Lenovo Yoga Book 9 14IAH10 | Ultra 7 255H 62 W / 32 W | Arc 140T 2150 MHz 6.4.0 Pro | 16 GB | 41216 |
| MSI Prestige 16 AI Evo B2HMG | Ultra 9 285H 115 W / 45 W | Arc 140T 2250 MHz 6.3 | 32 GB | 41775 |
| Geekom Mini IT15, Ultra 9 285H | Ultra 9 285H 64 W / 33 W | Arc 140T 6.4.0 Pro | 32 GB | 42061 |
| Xiaomi RedmiBook Pro 14 2025 | Ultra 7 255H 115 W / 45 W | Arc 140T 6.4.0 Pro | 32 GB | 42110 |
| Khadas Mind 2s | Ultra 7 255H 45 W / 35 W | Arc 140T 6.4.0 Pro | 64 GB | 42309 |
| Asus ZenBook Duo OLED UX8406CA | Ultra 9 285H 60 W / 35 W | Arc 140T 2250 MHz 6.3 | 32 GB | 43036 |
| Model | CPU | GPU | RAM | Value |
|---|---|---|---|---|
| Lenovo ThinkPad E14 G7-21SYS00H00 | Ultra 7 255H 45 W / 28 W | Arc 140T 2050 MHz 6.4.0 Pro | 16 GB | 26352 |
| Lenovo ThinkPad E16 G3-21SSS00E00 | Ultra 7 255H | Arc 140T 6.4.0 Pro | 32 GB | 30496 |
| Xiaomi RedmiBook Pro 14 2025 | Ultra 7 255H 115 W / 45 W | Arc 140T 6.4.0 Pro | 32 GB | 32497 |
| Lenovo ThinkBook 14 Gen 8 21SJ007SGE | Ultra 7 255H | Arc 140T 6.4.0 Pro | 32 GB | 33804 |
| MSI Prestige 16 AI Evo B2HMG | Ultra 9 285H 115 W / 45 W | Arc 140T 2250 MHz 6.3 | 32 GB | 34146 |
| Asus Zenbook 14 OLED UX3405CA | Ultra 7 255H | Arc 140T 6.4.0 Pro | 32 GB | 35881 |
| Geekom Mini IT15, Ultra 9 285H | Ultra 9 285H 64 W / 33 W | Arc 140T 6.4.0 Pro | 32 GB | 36367 |
| Lenovo Yoga Book 9 14IAH10 | Ultra 7 255H 62 W / 32 W | Arc 140T 2150 MHz 6.4.0 Pro | 16 GB | 36614 |
| Khadas Mind 2s | Ultra 7 255H 45 W / 35 W | Arc 140T 6.4.0 Pro | 64 GB | 37411 |
| HP ZBook 8 G1i 14 | Ultra 7 255H | Arc 140T 6.4.0 Pro | 37850 | |
| Asus ZenBook Duo OLED UX8406CA | Ultra 9 285H 60 W / 35 W | Arc 140T 2250 MHz 6.3 | 32 GB | 38138 |
| Model | CPU | GPU | RAM | Value |
|---|---|---|---|---|
| Geekom Mini IT15, Ultra 9 285H | Ultra 9 285H 64 W / 33 W | Arc 140T | 32 GB | 965 |
| MSI Prestige 16 AI Evo B2HMG | Ultra 9 285H 115 W / 45 W | Arc 140T 2250 MHz | 32 GB | 1156 |
| Khadas Mind 2s | Ultra 7 255H 45 W / 35 W | Arc 140T | 64 GB | 1203 |
| Model | CPU | GPU | RAM | Value |
|---|---|---|---|---|
| Geekom Mini IT15, Ultra 9 285H | Ultra 9 285H 64 W / 33 W | Arc 140T | 32 GB | 3657 |
| MSI Prestige 16 AI Evo B2HMG | Ultra 9 285H 115 W / 45 W | Arc 140T 2250 MHz | 32 GB | 3762 |
| Khadas Mind 2s | Ultra 7 255H 45 W / 35 W | Arc 140T | 64 GB | 4137 |
| Model | CPU | GPU | RAM | Value |
|---|---|---|---|---|
| Geekom Mini IT15, Ultra 9 285H | Ultra 9 285H 64 W / 33 W | Arc 140T | 32 GB | 7612 |
| Khadas Mind 2s | Ultra 7 255H 45 W / 35 W | Arc 140T | 64 GB | 7757 |
| MSI Prestige 16 AI Evo B2HMG | Ultra 9 285H 115 W / 45 W | Arc 140T 2250 MHz | 32 GB | 7948 |
| Model | CPU | GPU | RAM | Value |
|---|---|---|---|---|
| Lenovo ThinkPad E14 G7-21SYS00H00 | Ultra 7 255H 45 W / 28 W | Arc 140T 2050 MHz | 16 GB | 42.8 |
| Lenovo ThinkBook 14 Gen 8 21SJ007SGE | Ultra 7 255H | Arc 140T | 32 GB | 45.8 |
| Asus ZenBook Duo OLED UX8406CA | Ultra 9 285H 60 W / 35 W | Arc 140T 2250 MHz | 32 GB | 49.2 |
| Geekom Mini IT15, Ultra 9 285H | Ultra 9 285H 64 W / 33 W | Arc 140T | 32 GB | 49.2 |
| Khadas Mind 2s | Ultra 7 255H 45 W / 35 W | Arc 140T | 64 GB | 50.6 |
| Xiaomi RedmiBook Pro 14 2025 | Ultra 7 255H 115 W / 45 W | Arc 140T | 32 GB | 51.1 |
| Lenovo Yoga Book 9 14IAH10 | Ultra 7 255H 62 W / 32 W | Arc 140T 2150 MHz | 16 GB | 54.2 |
| MSI Prestige 16 AI Evo B2HMG | Ultra 9 285H 115 W / 45 W | Arc 140T 2250 MHz | 32 GB | 57.7 |
| Model | CPU | GPU | RAM | Value |
|---|---|---|---|---|
| Lenovo ThinkBook 14 2-in-1 G4 IML | Ultra 5 125U 49 W / 25 W | Graphics 4-Core 1850 MHz | 16 GB | 24.4 |
| HP Envy x360 2-in-1 14-fc0078TU | Ultra 5 125U 29 W / 23 W | Graphics 4-Core | 16 GB | 24.7 |
| Dell Latitude 13 7350 | Ultra 5 135U 59 W / 18 W | Graphics 4-Core 1900 MHz | 32 GB | 26.8 |
| Lenovo ThinkPad X1 2in1 G9 21KE004AGE | Ultra 7 165U 40 W / 30 W | Graphics 4-Core 2000 MHz | 32 GB | 30.2 |
| Dell Latitude 9450 2-in-1 | Ultra 7 165U 38 W / 21 W | Graphics 4-Core 2000 MHz | 32 GB | 32.2 |
| Model | CPU | GPU | RAM | Value |
|---|---|---|---|---|
| Lenovo ThinkBook 14 2-in-1 G4 IML | Ultra 5 125U 49 W / 25 W | Graphics 4-Core 1850 MHz | 16 GB | 27.4 |
| HP Envy x360 2-in-1 14-fc0078TU | Ultra 5 125U 29 W / 23 W | Graphics 4-Core | 16 GB | 27.4 |
| Dell Latitude 13 7350 | Ultra 5 135U 59 W / 18 W | Graphics 4-Core 1900 MHz | 32 GB | 28.5 |
| Lenovo Yoga 7 2-in-1 16IML9 | Ultra 5 125U 41 W / 29 W | Graphics 4-Core 1850 MHz | 16 GB | 30.7 |
| Lenovo ThinkPad X1 2in1 G9 21KE004AGE | Ultra 7 165U 40 W / 30 W | Graphics 4-Core 2000 MHz | 32 GB | 35.2 |
| Dell Latitude 9450 2-in-1 | Ultra 7 165U 38 W / 21 W | Graphics 4-Core 2000 MHz | 32 GB | 35.5 |
| Lenovo Yoga Book 9 13IMU9 | Ultra 7 155U 36 W / 24 W | Graphics 4-Core 1950 MHz | 16 GB | 41.5 |
| Model | CPU | GPU | RAM | Value |
|---|---|---|---|---|
| Lenovo Yoga Book 9 13IMU9 | Ultra 7 155U 36 W / 24 W | Graphics 4-Core 1950 MHz | 16 GB | 0.4313 |
| Lenovo ThinkBook 14 2-in-1 G4 IML | Ultra 5 125U 49 W / 25 W | Graphics 4-Core 1850 MHz | 16 GB | 0.4343 |
| Lenovo ThinkPad X1 2in1 G9 21KE004AGE | Ultra 7 165U 40 W / 30 W | Graphics 4-Core 2000 MHz | 32 GB | 0.4631 |
| Lenovo Yoga 7 2-in-1 16IML9 | Ultra 5 125U 41 W / 29 W | Graphics 4-Core 1850 MHz | 16 GB | 0.4886 |
| Dell Latitude 9450 2-in-1 | Ultra 7 165U 38 W / 21 W | Graphics 4-Core 2000 MHz | 32 GB | 0.504 |
| HP Envy x360 2-in-1 14-fc0078TU | Ultra 5 125U 29 W / 23 W | Graphics 4-Core | 16 GB | 0.544 |
| Model | CPU | GPU | RAM | Value |
|---|---|---|---|---|
| Lenovo ThinkBook 14 2-in-1 G4 IML | Ultra 5 125U 49 W / 25 W | Graphics 4-Core 1850 MHz | 16 GB | 0.4877 |
| Lenovo ThinkPad X1 2in1 G9 21KE004AGE | Ultra 7 165U 40 W / 30 W | Graphics 4-Core 2000 MHz | 32 GB | 0.54 |
| Dell Latitude 9450 2-in-1 | Ultra 7 165U 38 W / 21 W | Graphics 4-Core 2000 MHz | 32 GB | 0.556 |
| HP Envy x360 2-in-1 14-fc0078TU | Ultra 5 125U 29 W / 23 W | Graphics 4-Core | 16 GB | 0.603 |
| Model | CPU | GPU | RAM | Value |
|---|---|---|---|---|
| Asus ZenBook Duo OLED UX8406CA | Ultra 9 285H 60 W / 35 W | Arc 140T 2250 MHz | 32 GB | 48.7 |
| Lenovo ThinkPad E14 G7-21SYS00H00 | Ultra 7 255H 45 W / 28 W | Arc 140T 2050 MHz | 16 GB | 53.2 |
| Lenovo ThinkBook 14 Gen 8 21SJ007SGE | Ultra 7 255H | Arc 140T | 32 GB | 56.9 |
| Lenovo Yoga Book 9 14IAH10 | Ultra 7 255H 62 W / 32 W | Arc 140T 2150 MHz | 16 GB | 58.5 |
| MSI Prestige 16 AI Evo B2HMG | Ultra 9 285H 115 W / 45 W | Arc 140T 2250 MHz | 32 GB | 68.8 |
| Xiaomi RedmiBook Pro 14 2025 | Ultra 7 255H 115 W / 45 W | Arc 140T | 32 GB | 70 |
| Model | CPU | GPU | RAM | Value |
|---|---|---|---|---|
| Lenovo ThinkPad E14 G7-21SYS00H00 | Ultra 7 255H 45 W / 28 W | Arc 140T 2050 MHz | 16 GB | 45.4 |
| Asus ZenBook Duo OLED UX8406CA | Ultra 9 285H 60 W / 35 W | Arc 140T 2250 MHz | 32 GB | 47 |
| Geekom Mini IT15, Ultra 9 285H | Ultra 9 285H 64 W / 33 W | Arc 140T | 32 GB | 51.6 |
| Khadas Mind 2s | Ultra 7 255H 45 W / 35 W | Arc 140T | 64 GB | 54.5 |
| Lenovo Yoga Book 9 14IAH10 | Ultra 7 255H 62 W / 32 W | Arc 140T 2150 MHz | 16 GB | 56.6 |
| Lenovo ThinkBook 14 Gen 8 21SJ007SGE | Ultra 7 255H | Arc 140T | 32 GB | 56.7 |
| Xiaomi RedmiBook Pro 14 2025 | Ultra 7 255H 115 W / 45 W | Arc 140T | 32 GB | 65 |
| MSI Prestige 16 AI Evo B2HMG | Ultra 9 285H 115 W / 45 W | Arc 140T 2250 MHz | 32 GB | 67.4 |
| Model | CPU | GPU | RAM | Value |
|---|---|---|---|---|
| Lenovo ThinkPad E14 G7-21SYS00H00 | Ultra 7 255H 45 W / 28 W | Arc 140T 2050 MHz | 16 GB | 0.326 |
| MSI Prestige 16 AI Evo B2HMG | Ultra 9 285H 115 W / 45 W | Arc 140T 2250 MHz | 32 GB | 0.368 |
| Lenovo ThinkBook 14 Gen 8 21SJ007SGE | Ultra 7 255H | Arc 140T | 32 GB | 0.3792 |
| Xiaomi RedmiBook Pro 14 2025 | Ultra 7 255H 115 W / 45 W | Arc 140T | 32 GB | 0.4031 |
| Geekom Mini IT15, Ultra 9 285H | Ultra 9 285H 64 W / 33 W | Arc 140T | 32 GB | 0.4205 |
| Khadas Mind 2s | Ultra 7 255H 45 W / 35 W | Arc 140T | 64 GB | 0.4257 |
| Asus ZenBook Duo OLED UX8406CA | Ultra 9 285H 60 W / 35 W | Arc 140T 2250 MHz | 32 GB | 0.4468 |
| Model | CPU | GPU | RAM | Value |
|---|---|---|---|---|
| Lenovo Yoga Book 9 13IMU9 | Ultra 7 155U 36 W / 24 W | Graphics 4-Core 1950 MHz | 16 GB | 27.3 |
| Lenovo Yoga 7 2-in-1 16IML9 | Ultra 5 125U 41 W / 29 W | Graphics 4-Core 1850 MHz | 16 GB | 31 |
| Dell Latitude 13 7350 | Ultra 5 135U 59 W / 18 W | Graphics 4-Core 1900 MHz | 32 GB | 34.8 |
| HP Envy x360 2-in-1 14-fc0078TU | Ultra 5 125U 29 W / 23 W | Graphics 4-Core | 16 GB | 37 |
| Lenovo ThinkPad X1 2in1 G9 21KE004AGE | Ultra 7 165U 40 W / 30 W | Graphics 4-Core 2000 MHz | 32 GB | 41.7 |
| Dell Latitude 9450 2-in-1 | Ultra 7 165U 38 W / 21 W | Graphics 4-Core 2000 MHz | 32 GB | 44.7 |
| Lenovo ThinkBook 14 2-in-1 G4 IML | Ultra 5 125U 49 W / 25 W | Graphics 4-Core 1850 MHz | 16 GB | 44.9 |
Average Benchmarks Intel Arc Graphics 140T → 100% n=30
Average Benchmarks Intel Graphics 4-Core iGPU (Arc) → 55% n=30
* Smaller numbers mean a higher performance
1 This benchmark is not used for the average calculation
Game Benchmarks
The following benchmarks stem from our benchmarks of review laptops. The performance depends on the used graphics memory, clock rate, processor, system settings, drivers, and operating systems. So the results don't have to be representative for all laptops with this GPU. For detailed information on the benchmark results, click on the fps number.

Intel Core Ultra 5 115U 0.7GHz
Graphics 4-Core
min: 4 fps, P0.1: 4.21 fps, P1: 4.62 fps, max: 15 fps

Stalker 2
2024Intel Core Ultra 5 115U 0.7GHz
Graphics 4-Core
min: 6.15 fps, P0.1: 6.16 fps, P1: 6.21 fps, max: 7.54 fps
Intel Core Ultra 5 115U 0.7GHz
Graphics 4-Core
min: 4.66 fps, P0.1: 4.75 fps, P1: 5.52 fps, max: 6.45 fps
Intel Core Ultra 5 115U 0.7GHz
Graphics 4-Core
min: 5.13 fps, P0.1: 5.13 fps, P1: 5.13 fps, max: 5.61 fps


Until Dawn
2024Intel Core Ultra 5 115U 0.7GHz
Graphics 4-Core
min: 11.6 fps, P0.1: 12 fps, P1: 16 fps, max: 18.4 fps
Intel Core Ultra 5 115U 0.7GHz
Graphics 4-Core
min: 7.94 fps, P0.1: 8.28 fps, P1: 9.92 fps, max: 14.2 fps
Intel Core Ultra 5 115U 0.7GHz
Graphics 4-Core
min: 5.08 fps, P0.1: 5.2 fps, P1: 6.24 fps, max: 8.91 fps

Final Fantasy XVI
2024Intel Core Ultra 5 115U 0.7GHz
Graphics 4-Core
min: 2.8 fps, P0.1: 3.31 fps, P1: 6.24 fps, max: 11.3 fps
Intel Core Ultra 5 115U 0.7GHz
Graphics 4-Core
min: 1.322 fps, P0.1: 1.511 fps, P1: 5.92 fps, max: 11.5 fps
Intel Core Ultra 5 115U 0.7GHz
Graphics 4-Core
min: 1.55 fps, P0.1: 1.816 fps, P1: 5.29 fps, max: 9.01 fps

Space Marine 2
2024Intel Core Ultra 5 115U 0.7GHz
Graphics 4-Core
min: 8.78 fps, P0.1: 8.87 fps, P1: 9.11 fps, max: 11.3 fps
Intel Core Ultra 5 115U 0.7GHz
Graphics 4-Core
min: 6.78 fps, P0.1: 6.9 fps, P1: 7.25 fps, max: 9.31 fps
Intel Core Ultra 5 115U 0.7GHz
Graphics 4-Core
min: 6.61 fps, P0.1: 6.63 fps, P1: 6.74 fps, max: 8.27 fps

Star Wars Outlaws
2024Intel Core Ultra 5 115U 0.7GHz
Graphics 4-Core
Problem during benchmarking occured: game wont start crash
Intel Core Ultra 5 115U 0.7GHz
Graphics 4-Core
Problem during benchmarking occured: game wont start crash
Intel Core Ultra 5 115U 0.7GHz
Graphics 4-Core
Problem during benchmarking occured: game wont start crash

F1 24
20241222678
Intel Core Ultra 7 255H 4.4GHz
Arc 140T
min: 38 fps, P1: 41 fps, max: 63 fps
1222678
Intel Core Ultra 7 255H 4.4GHz
Arc 140T
min: 40 fps, P1: 54 fps, max: 90 fps
1222678
Intel Core Ultra 7 255H 4.4GHz
Arc 140T
min: 61 fps, P1: 54 fps, max: 90 fps
1185515
Intel Core Ultra 9 285H 4.5GHz
Arc 140T
min: 63 fps, P1: 58 fps, max: 90 fps
1222678
Intel Core Ultra 9 285H 4.5GHz
Arc 140T
min: 62 fps, P1: 57 fps, max: 91 fps
1185515
Intel Core Ultra 9 285H 4.5GHz
Arc 140T
min: 69 fps, P1: 63 fps, max: 96 fps
1222678
Intel Core Ultra 7 255H 4.4GHz
Arc 140T
min: 72 fps, P1: 63 fps, max: 98 fps
1185515
Intel Core Ultra 7 155U 3.8GHz
Graphics 4-Core
min: 19 fps, P1: 27 fps, max: 37 fps
1222678
Intel Core Ultra 5 225U 2.4GHz
Graphics 4-Core
min: 23 fps, P1: 27 fps, max: 38 fps
1140008
Intel Core Ultra 7 155U 3.8GHz
Graphics 4-Core
min: 30 fps, P1: 29 fps, max: 42 fps
1131675
Intel Core Ultra 5 125U 3.6GHz
Graphics 4-Core
min: 29 fps, P1: 27 fps, max: 45 fps
1222678
Intel Core Ultra 7 255U 3.8GHz
Graphics 4-Core
min: 22 fps, P1: 29 fps, max: 46 fps
1174923
Intel Core Ultra 5 125U 3.6GHz
Graphics 4-Core
min: 34 fps, P1: 31 fps, max: 47 fps
1222678
Intel Core Ultra 7 255H 4.4GHz
Arc 140T
min: 33 fps, P1: 36 fps, max: 56 fps
1222678
Intel Core Ultra 7 255H 4.4GHz
Arc 140T
min: 26 fps, P1: 52 fps, max: 83 fps
1185515
Intel Core Ultra 9 285H 4.5GHz
Arc 140T
min: 59 fps, P1: 53 fps, max: 80 fps
1222678
Intel Core Ultra 7 255H 4.4GHz
Arc 140T
min: 55 fps, P1: 50 fps, max: 85 fps
1222678
Intel Core Ultra 9 285H 4.5GHz
Arc 140T
min: 57 fps, P1: 53 fps, max: 82 fps
1185515
Intel Core Ultra 9 285H 4.5GHz
Arc 140T
min: 64 fps, P1: 56 fps, max: 84 fps
1222678
Intel Core Ultra 7 255H 4.4GHz
Arc 140T
min: 69 fps, P1: 61 fps, max: 86 fps
1185515
Intel Core Ultra 7 155U 3.8GHz
Graphics 4-Core
min: 25 fps, P1: 24 fps, max: 34 fps
1222678
Intel Core Ultra 5 225U 2.4GHz
Graphics 4-Core
min: 19 fps, P1: 23 fps, max: 34 fps
1140008
Intel Core Ultra 7 155U 3.8GHz
Graphics 4-Core
min: 27 fps, P1: 25 fps, max: 36 fps
1131675
Intel Core Ultra 5 125U 3.6GHz
Graphics 4-Core
min: 23 fps, P1: 24 fps, max: 39 fps
1222678
Intel Core Ultra 7 255U 3.8GHz
Graphics 4-Core
min: 1 fps, P1: 27 fps, max: 41 fps
1174923
Intel Core Ultra 5 125U 3.6GHz
Graphics 4-Core
min: 31 fps, P1: 28 fps, max: 42 fps
1222678
Intel Core Ultra 7 255H 4.4GHz
Arc 140T
min: 27 fps, P1: 29 fps, max: 44 fps
1222678
Intel Core Ultra 7 255H 4.4GHz
Arc 140T
min: 40 fps, P1: 40 fps, max: 63 fps
1222678
Intel Core Ultra 9 285H 4.5GHz
Arc 140T
min: 43 fps, P1: 41 fps, max: 64 fps
1185515
Intel Core Ultra 9 285H 4.5GHz
Arc 140T
min: 45 fps, P1: 41 fps, max: 65 fps
1185515
Intel Core Ultra 9 285H 4.5GHz
Arc 140T
min: 51 fps, P1: 49 fps, max: 67 fps
1222678
Intel Core Ultra 7 255H 4.4GHz
Arc 140T
min: 50 fps, P1: 33 fps, max: 68 fps
1185515
Intel Core Ultra 7 155U 3.8GHz
Graphics 4-Core
min: 11 fps, P1: 18 fps, max: 26 fps
1222678
Intel Core Ultra 5 225U 2.4GHz
Graphics 4-Core
min: 15 fps, P1: 17 fps, max: 27 fps
1222678
Intel Core Ultra 7 255U 3.8GHz
Graphics 4-Core
min: 5 fps, P1: 20 fps, max: 31 fps
1174923
Intel Core Ultra 5 125U 3.6GHz
Graphics 4-Core
min: 22 fps, P1: 20 fps, max: 31 fps
1222678
Intel Core Ultra 7 255H 4.4GHz
Arc 140T
min: 13 fps, P1: 13 fps, max: 21 fps
1222678
Intel Core Ultra 9 285H 4.5GHz
Arc 140T
min: 13 fps, P1: 13 fps, max: 22 fps
1185515
Intel Core Ultra 9 285H 4.5GHz
Arc 140T
min: 16 fps, P1: 15 fps, max: 23 fps
1185515
Intel Core Ultra 9 285H 4.5GHz
Arc 140T
min: 16 fps, P1: 16 fps, max: 23 fps
1174923
Intel Core Ultra 5 125U 3.6GHz
Graphics 4-Core
min: 5 fps, P1: 5 fps, max: 9 fps

Intel Core Ultra 5 115U 0.7GHz
Graphics 4-Core
min: 5.26 fps, P0.1: 5.41 fps, P1: 6.12 fps, max: 6.84 fps
Intel Core Ultra 5 115U 0.7GHz
Graphics 4-Core
min: 4.84 fps, P0.1: 4.86 fps, P1: 4.98 fps, max: 6.12 fps
Intel Core Ultra 5 115U 0.7GHz
Graphics 4-Core
min: 3.81 fps, P0.1: 3.81 fps, P1: 3.84 fps, max: 4.85 fps

Ghost of Tsushima
2024Intel Core Ultra 5 115U 0.7GHz
Graphics 4-Core
min: 9.15 fps, P0.1: 9.24 fps, P1: 9.43 fps, max: 15.4 fps
Intel Core Ultra 5 115U 0.7GHz
Graphics 4-Core
min: 7.78 fps, P0.1: 7.84 fps, P1: 8.07 fps, max: 12.9 fps
Intel Core Ultra 5 115U 0.7GHz
Graphics 4-Core
min: 7.03 fps, P0.1: 7.04 fps, P1: 7.2 fps, max: 11.6 fps

Intel Core Ultra 5 115U 0.7GHz
Graphics 4-Core
min: 10.6 fps, P0.1: 10.7 fps, P1: 10.9 fps, max: 19.1 fps
Intel Core Ultra 5 115U 0.7GHz
Graphics 4-Core
min: 9.97 fps, P0.1: 10 fps, P1: 10.2 fps, max: 16.2 fps
Intel Core Ultra 5 115U 0.7GHz
Graphics 4-Core
min: 6.13 fps, P0.1: 6.15 fps, P1: 6.46 fps, max: 10.2 fps

Dragon's Dogma 2
2024Intel Core Ultra 5 115U 0.7GHz
Graphics 4-Core
min: 7.69 fps, P0.1: 7.71 fps, P1: 7.79 fps, max: 12.4 fps
Intel Core Ultra 5 115U 0.7GHz
Graphics 4-Core
min: 5.8 fps, P0.1: 5.81 fps, P1: 5.92 fps, max: 8.67 fps

Helldivers 2
2024Intel Core Ultra 5 115U 0.7GHz
Graphics 4-Core
min: 14.5 fps, P0.1: 14.5 fps, P1: 14.7 fps, max: 17.2 fps
Intel Core Ultra 5 115U 0.7GHz
Graphics 4-Core
min: 11.2 fps, P0.1: 11.3 fps, P1: 11.4 fps, max: 13.6 fps
Intel Core Ultra 5 115U 0.7GHz
Graphics 4-Core
min: 10 fps, P0.1: 10.1 fps, P1: 10.1 fps, max: 12.1 fps

Intel Core Ultra 5 115U 0.7GHz
Graphics 4-Core
min: 14.7 fps, P0.1: 27 fps, P1: 73 fps, max: 179 fps
Intel Core Ultra 5 115U 0.7GHz
Graphics 4-Core
min: 14.6 fps, P0.1: 16.1 fps, P1: 43.2 fps, max: 165.9 fps
Intel Core Ultra 5 115U 0.7GHz
Graphics 4-Core
min: 13.5 fps, P0.1: 15.7 fps, P1: 38.8 fps, max: 143.4 fps

Total War Pharaoh
2023
2.21
Intel Core Ultra 7 255H 4.4GHz
Arc 140T
min: 21.9 fps, max: 28.5 fps
2.21
Intel Core Ultra 9 285H 4.5GHz
Arc 140T
min: 30.4 fps, max: 41.9 fps
2.21
Intel Core Ultra 7 255H 4.4GHz
Arc 140T
min: 30.9 fps, P1: 28.5 fps, max: 41.7 fps
2.21
Intel Core Ultra 7 255H 4.4GHz
Arc 140T
min: 31.8 fps, P1: 30 fps, max: 44.1 fps
2.21
Intel Core Ultra 9 285H 4.5GHz
Arc 140T
min: 32.8 fps, max: 43 fps
2.21
Intel Core Ultra 7 255H 4.4GHz
Arc 140T
min: 33.5 fps, P1: 32.2 fps, max: 44 fps
2.21
Intel Core Ultra 7 255H 4.4GHz
Arc 140T
min: 35.5 fps, max: 47 fps
2.12
Intel Core Ultra 9 285H 4.5GHz
Arc 140T
min: 36.3 fps, max: 48.5 fps
2.12
Intel Core Ultra 7 155U 3.8GHz
Graphics 4-Core
min: 13.3 fps, max: 26.2 fps
2.21
Intel Core Ultra 7 165U 3.8GHz
Graphics 4-Core
min: 14.6 fps, P1: 14.2 fps, max: 20.3 fps
2.12
Intel Core Ultra 5 134U 3.6GHz
Graphics 4-Core
min: 14.8 fps, max: 20.8 fps
2.12
Intel Core Ultra 7 165U 3.8GHz
Graphics 4-Core
min: 14.2 fps, max: 21.6 fps
2.12
Intel Core Ultra 7 164U 3.8GHz
Graphics 4-Core
min: 12.9 fps, max: 27.1 fps
2.12
Intel Core Ultra 5 135U 3.6GHz
Graphics 4-Core
min: 13.6 fps, max: 30.1 fps
2.02
Intel Core Ultra 5 125U 3.6GHz
Graphics 4-Core
min: 6.99 fps, max: 32.4 fps
2.21
Intel Core Ultra 5 225U 2.4GHz
Graphics 4-Core
min: 16 fps, max: 21.9 fps
2.12
Intel Core Ultra 5 125U 3.6GHz
Graphics 4-Core
min: 16.1 fps, max: 21.9 fps
2.12
Intel Core Ultra 5 125U 3.6GHz
Graphics 4-Core
min: 10.8 fps, max: 30.3 fps
2.11
Intel Core Ultra 7 155U 3.8GHz
Graphics 4-Core
min: 16.1 fps, max: 22.1 fps
2.12
Intel Core Ultra 5 125U 3.6GHz
Graphics 4-Core
min: 16.1 fps, max: 23.4 fps
2.11
Intel Core Ultra 7 165U 3.8GHz
Graphics 4-Core
min: 13.3 fps, max: 34.3 fps
2.12
Intel Core Ultra 5 125U 3.6GHz
Graphics 4-Core
min: 12.9 fps, max: 28.6 fps
2.21
Intel Core Ultra 5 125U 3.6GHz
Graphics 4-Core
min: 16.5 fps, max: 23.2 fps
2.12
Intel Core Ultra 5 125U 3.6GHz
Graphics 4-Core
min: 14.8 fps, max: 31.6 fps
2.02
Intel Core Ultra 7 165U 3.8GHz
Graphics 4-Core
min: 12.7 fps, max: 26.1 fps
2.21
Intel Core Ultra 7 155U 3.8GHz
Graphics 4-Core
min: 17.3 fps, P1: 16.6 fps, max: 24.3 fps
2.12
Intel Core Ultra 7 155U 3.8GHz
Graphics 4-Core
min: 17.5 fps, max: 24 fps
2.02
Intel Core Ultra 5 125U 3.6GHz
Graphics 4-Core
min: 8.34 fps, max: 34.5 fps
2.02
Intel Core Ultra 7 155U 3.8GHz
Graphics 4-Core
min: 16.7 fps, max: 28.2 fps
2.21
Intel Core Ultra 7 255U 3.8GHz
Graphics 4-Core
min: 18.9 fps, P1: 18 fps, max: 26.1 fps
2.21
Intel Core Ultra 7 255H 4.4GHz
Arc 140T
min: 19.5 fps, max: 24.6 fps
2.21
Intel Core Ultra 9 285H 4.5GHz
Arc 140T
min: 25.1 fps, max: 36.2 fps
2.21
Intel Core Ultra 7 255H 4.4GHz
Arc 140T
min: 26.5 fps, P1: 25.4 fps, max: 35.1 fps
2.21
Intel Core Ultra 9 285H 4.5GHz
Arc 140T
min: 27.1 fps, max: 38.1 fps
2.21
Intel Core Ultra 7 255H 4.4GHz
Arc 140T
min: 29.3 fps, max: 38.6 fps
2.12
Intel Core Ultra 9 285H 4.5GHz
Arc 140T
min: 30.7 fps, max: 39.6 fps
2.12
Intel Core Ultra 5 134U 3.6GHz
Graphics 4-Core
min: 11.2 fps, max: 15.7 fps
2.21
Intel Core Ultra 7 165U 3.8GHz
Graphics 4-Core
min: 11.5 fps, P1: 10.5 fps, max: 16.9 fps
2.12
Intel Core Ultra 5 135U 3.6GHz
Graphics 4-Core
min: 11.9 fps, max: 19.6 fps
2.12
Intel Core Ultra 7 165U 3.8GHz
Graphics 4-Core
min: 11.9 fps, max: 16.9 fps
2.12
Intel Core Ultra 7 155U 3.8GHz
Graphics 4-Core
min: 12.4 fps, max: 17.8 fps
2.02
Intel Core Ultra 5 125U 3.6GHz
Graphics 4-Core
min: 6.99 fps, max: 20.5 fps
2.12
Intel Core Ultra 7 164U 3.8GHz
Graphics 4-Core
min: 11.9 fps, max: 21.2 fps
2.12
Intel Core Ultra 5 125U 3.6GHz
Graphics 4-Core
min: 13.2 fps, max: 17.3 fps
2.12
Intel Core Ultra 5 125U 3.6GHz
Graphics 4-Core
min: 12.9 fps, max: 19.7 fps
2.11
Intel Core Ultra 7 155U 3.8GHz
Graphics 4-Core
min: 13.3 fps, max: 17.8 fps
2.21
Intel Core Ultra 5 225U 2.4GHz
Graphics 4-Core
min: 13.5 fps, max: 17.6 fps
2.11
Intel Core Ultra 7 165U 3.8GHz
Graphics 4-Core
min: 10.9 fps, max: 27.4 fps
2.12
Intel Core Ultra 5 125U 3.6GHz
Graphics 4-Core
min: 13.8 fps, max: 21.5 fps
2.21
Intel Core Ultra 5 125U 3.6GHz
Graphics 4-Core
min: 13.9 fps, max: 18.5 fps
2.12
Intel Core Ultra 5 125U 3.6GHz
Graphics 4-Core
min: 12 fps, max: 27.4 fps
2.12
Intel Core Ultra 5 125U 3.6GHz
Graphics 4-Core
min: 14.3 fps, max: 21.7 fps
2.12
Intel Core Ultra 7 155U 3.8GHz
Graphics 4-Core
min: 14.4 fps, max: 19.2 fps
2.21
Intel Core Ultra 7 155U 3.8GHz
Graphics 4-Core
min: 14.4 fps, P1: 13.9 fps, max: 19.6 fps
2.02
Intel Core Ultra 7 165U 3.8GHz
Graphics 4-Core
min: 12.8 fps, max: 20.8 fps
2.02
Intel Core Ultra 5 125U 3.6GHz
Graphics 4-Core
min: 7.96 fps, max: 29 fps
2.02
Intel Core Ultra 7 155U 3.8GHz
Graphics 4-Core
min: 14.4 fps, max: 22.1 fps
2.21
Intel Core Ultra 7 255U 3.8GHz
Graphics 4-Core
min: 15.3 fps, P1: 14.7 fps, max: 20.6 fps
2.21
Intel Core Ultra 7 255H 4.4GHz
Arc 140T
min: 15.1 fps, max: 19.6 fps
2.21
Intel Core Ultra 9 285H 4.5GHz
Arc 140T
min: 20.4 fps, max: 30.9 fps
2.21
Intel Core Ultra 7 255H 4.4GHz
Arc 140T
min: 22.8 fps, P1: 21.5 fps, max: 32.1 fps
2.21
Intel Core Ultra 9 285H 4.5GHz
Arc 140T
min: 23.9 fps, max: 33.2 fps
2.21
Intel Core Ultra 7 255H 4.4GHz
Arc 140T
min: 24.8 fps, max: 33.7 fps
2.12
Intel Core Ultra 9 285H 4.5GHz
Arc 140T
min: 25.9 fps, max: 35.1 fps
2.12
Intel Core Ultra 5 135U 3.6GHz
Graphics 4-Core
min: 10 fps, max: 19.5 fps
2.12
Intel Core Ultra 7 155U 3.8GHz
Graphics 4-Core
min: 10.2 fps, max: 16 fps
2.12
Intel Core Ultra 5 134U 3.6GHz
Graphics 4-Core
min: 10.6 fps, max: 14.6 fps
2.02
Intel Core Ultra 5 125U 3.6GHz
Graphics 4-Core
min: 6.86 fps, max: 20.8 fps
2.12
Intel Core Ultra 7 165U 3.8GHz
Graphics 4-Core
min: 10.3 fps, max: 15.4 fps
2.12
Intel Core Ultra 5 125U 3.6GHz
Graphics 4-Core
min: 10.7 fps, max: 14.7 fps
2.21
Intel Core Ultra 5 225U 2.4GHz
Graphics 4-Core
min: 11 fps, max: 15.1 fps
2.11
Intel Core Ultra 7 165U 3.8GHz
Graphics 4-Core
min: 8.99 fps, max: 21.5 fps
2.12
Intel Core Ultra 5 125U 3.6GHz
Graphics 4-Core
min: 11 fps, max: 18.6 fps
2.12
Intel Core Ultra 7 164U 3.8GHz
Graphics 4-Core
min: 9.43 fps, max: 18.2 fps
2.12
Intel Core Ultra 5 125U 3.6GHz
Graphics 4-Core
min: 10.4 fps, max: 16.6 fps
2.11
Intel Core Ultra 7 155U 3.8GHz
Graphics 4-Core
min: 11.2 fps, max: 15.6 fps
2.21
Intel Core Ultra 7 155U 3.8GHz
Graphics 4-Core
min: 11.4 fps, P1: 11.1 fps, max: 15.9 fps
2.21
Intel Core Ultra 5 125U 3.6GHz
Graphics 4-Core
min: 11.6 fps, max: 16.7 fps
2.12
Intel Core Ultra 5 125U 3.6GHz
Graphics 4-Core
min: 9.4 fps, max: 25 fps
2.12
Intel Core Ultra 5 125U 3.6GHz
Graphics 4-Core
min: 11.7 fps, max: 21.4 fps
2.12
Intel Core Ultra 7 155U 3.8GHz
Graphics 4-Core
min: 12.1 fps, max: 17 fps
2.02
Intel Core Ultra 5 125U 3.6GHz
Graphics 4-Core
min: 3.34 fps, max: 25.6 fps
2.02
Intel Core Ultra 7 165U 3.8GHz
Graphics 4-Core
min: 10.7 fps, max: 18.9 fps
2.02
Intel Core Ultra 7 155U 3.8GHz
Graphics 4-Core
min: 12.1 fps, max: 19.5 fps
2.21
Intel Core Ultra 7 255U 3.8GHz
Graphics 4-Core
min: 13.2 fps, P1: 12.8 fps, max: 18.5 fps
2.21
Intel Core Ultra 7 255H 4.4GHz
Arc 140T
min: 13.5 fps, max: 18 fps
2.21
Intel Core Ultra 7 255H 4.4GHz
Arc 140T
min: 19.2 fps, P1: 17.6 fps, max: 27.4 fps
2.21
Intel Core Ultra 9 285H 4.5GHz
Arc 140T
min: 18.8 fps, max: 29 fps
2.21
Intel Core Ultra 9 285H 4.5GHz
Arc 140T
min: 20 fps, max: 30.2 fps
2.21
Intel Core Ultra 7 255H 4.4GHz
Arc 140T
min: 20.9 fps, P1: 19.5 fps, max: 29.2 fps
2.21
Intel Core Ultra 7 255H 4.4GHz
Arc 140T
min: 21.4 fps, P1: 20.8 fps, max: 29.5 fps
2.21
Intel Core Ultra 7 255H 4.4GHz
Arc 140T
min: 22.8 fps, max: 31.8 fps
2.12
Intel Core Ultra 9 285H 4.5GHz
Arc 140T
min: 23.6 fps, max: 32.9 fps
2.12
Intel Core Ultra 5 135U 3.6GHz
Graphics 4-Core
min: 8.89 fps, max: 15 fps
2.21
Intel Core Ultra 7 165U 3.8GHz
Graphics 4-Core
min: 8.87 fps, P1: 8.65 fps, max: 12.6 fps
2.12
Intel Core Ultra 7 155U 3.8GHz
Graphics 4-Core
min: 8.91 fps, max: 14.5 fps
2.12
Intel Core Ultra 7 165U 3.8GHz
Graphics 4-Core
min: 8.84 fps, max: 13.5 fps
2.11
Intel Core Ultra 7 165U 3.8GHz
Graphics 4-Core
min: 8.83 fps, max: 17.2 fps
2.12
Intel Core Ultra 5 134U 3.6GHz
Graphics 4-Core
min: 9.23 fps, max: 13.5 fps
2.02
Intel Core Ultra 5 125U 3.6GHz
Graphics 4-Core
min: 3.55 fps, max: 25.9 fps
2.12
Intel Core Ultra 5 125U 3.6GHz
Graphics 4-Core
min: 9.58 fps, max: 13.5 fps
2.12
Intel Core Ultra 5 125U 3.6GHz
Graphics 4-Core
min: 9.07 fps, max: 15.2 fps
2.12
Intel Core Ultra 7 164U 3.8GHz
Graphics 4-Core
min: 8.63 fps, max: 16.9 fps
2.21
Intel Core Ultra 5 225U 2.4GHz
Graphics 4-Core
min: 9.8 fps, max: 13.7 fps
2.11
Intel Core Ultra 7 155U 3.8GHz
Graphics 4-Core
min: 9.96 fps, max: 14.2 fps
2.12
Intel Core Ultra 5 125U 3.6GHz
Graphics 4-Core
min: 10.1 fps, max: 16.1 fps
2.21
Intel Core Ultra 5 125U 3.6GHz
Graphics 4-Core
min: 9.96 fps, max: 14.8 fps
2.12
Intel Core Ultra 5 125U 3.6GHz
Graphics 4-Core
min: 8.61 fps, max: 21.2 fps
2.12
Intel Core Ultra 5 125U 3.6GHz
Graphics 4-Core
min: 10.4 fps, max: 18.1 fps
2.02
Intel Core Ultra 5 125U 3.6GHz
Graphics 4-Core
min: 2.72 fps, max: 28.9 fps
2.12
Intel Core Ultra 7 155U 3.8GHz
Graphics 4-Core
min: 10.8 fps, max: 15.4 fps
2.02
Intel Core Ultra 7 165U 3.8GHz
Graphics 4-Core
min: 9.58 fps, max: 17.5 fps
2.02
Intel Core Ultra 7 155U 3.8GHz
Graphics 4-Core
min: 10.4 fps, max: 18 fps
2.21
Intel Core Ultra 7 255U 3.8GHz
Graphics 4-Core
min: 11.5 fps, P1: 11.2 fps, max: 16.7 fps

Baldur's Gate 3
2023Intel Core Ultra 7 255H 4.4GHz
Arc 140T
min: 28 fps, P0.1: 28.6 fps, P1: 30.8 fps, max: 44.2 fps
Intel Core Ultra 7 255H 4.4GHz
Arc 140T
min: 23.8 fps, P0.1: 24.2 fps, P1: 32.4 fps, max: 43.5 fps
Intel Core Ultra 9 285H 4.5GHz
Arc 140T
min: 4.42 fps, P0.1: 21.1 fps, P1: 30.5 fps, max: 45.2 fps
Intel Core Ultra 5 115U 0.7GHz
Graphics 4-Core
min: 13.4 fps, P0.1: 13.7 fps, P1: 14.4 fps, max: 17.7 fps
Intel Core Ultra 7 155U 3.8GHz
Graphics 4-Core
min: 14.8 fps, P0.1: 14.9 fps, P1: 15.5 fps, max: 19.3 fps
Intel Core Ultra 5 125U 3.6GHz
Graphics 4-Core
min: 13.8 fps, P0.1: 13.8 fps, P1: 14 fps, max: 27.5 fps
Intel Core Ultra 7 155U 3.8GHz
Graphics 4-Core
min: 13.8 fps, P0.1: 14 fps, P1: 15.3 fps, max: 30.5 fps
Intel Core Ultra 7 165U 3.8GHz
Graphics 4-Core
min: 16.9 fps, P0.1: 17 fps, P1: 18.9 fps, max: 30.1 fps
Intel Core Ultra 5 125U 3.6GHz
Graphics 4-Core
min: 9.66 fps, P0.1: 10.5 fps, P1: 16.1 fps, max: 1599 fps
Intel Core Ultra 7 255H 4.4GHz
Arc 140T
min: 23.1 fps, P0.1: 23.9 fps, P1: 24.9 fps, max: 33.1 fps
Intel Core Ultra 7 255H 4.4GHz
Arc 140T
min: 20.5 fps, P0.1: 20.6 fps, P1: 21.7 fps, max: 34.5 fps
Intel Core Ultra 9 285H 4.5GHz
Arc 140T
min: 24.9 fps, P0.1: 25.5 fps, P1: 26.6 fps, max: 34.8 fps
Intel Core Ultra 5 125U 3.6GHz
Graphics 4-Core
min: 6.17 fps, P0.1: 6.9 fps, P1: 9.5 fps, max: 48.1 fps
Intel Core Ultra 5 115U 0.7GHz
Graphics 4-Core
min: 11.1 fps, P0.1: 11.1 fps, P1: 11.4 fps, max: 14.6 fps
Intel Core Ultra 7 155U 3.8GHz
Graphics 4-Core
min: 9.71 fps, P0.1: 9.79 fps, P1: 10.1 fps, max: 16.2 fps
Intel Core Ultra 7 155U 3.8GHz
Graphics 4-Core
min: 6.37 fps, P0.1: 7.21 fps, P1: 11.2 fps, max: 82.3 fps
Intel Core Ultra 7 165U 3.8GHz
Graphics 4-Core
min: 12.9 fps, P0.1: 13 fps, P1: 13.3 fps, max: 22.1 fps
Intel Core Ultra 5 125U 3.6GHz
Graphics 4-Core
min: 12.1 fps, P0.1: 12.4 fps, P1: 14.3 fps, max: 34 fps
Intel Core Ultra 7 255H 4.4GHz
Arc 140T
min: 20.5 fps, P0.1: 20.6 fps, P1: 22 fps, max: 27.9 fps
Intel Core Ultra 7 255H 4.4GHz
Arc 140T
min: 18.6 fps, P0.1: 18.7 fps, P1: 21 fps, max: 29.2 fps
Intel Core Ultra 9 285H 4.5GHz
Arc 140T
min: 21.6 fps, P0.1: 21.6 fps, P1: 22.4 fps, max: 29.6 fps
Intel Core Ultra 5 125U 3.6GHz
Graphics 4-Core
min: 8.91 fps, P0.1: 8.98 fps, P1: 9.12 fps, max: 13.2 fps
Intel Core Ultra 5 115U 0.7GHz
Graphics 4-Core
min: 8.95 fps, P0.1: 8.95 fps, P1: 9.47 fps, max: 12.1 fps
Intel Core Ultra 7 155U 3.8GHz
Graphics 4-Core
min: 9.11 fps, P0.1: 9.4 fps, P1: 10.2 fps, max: 17.5 fps
Intel Core Ultra 7 155U 3.8GHz
Graphics 4-Core
min: 5.21 fps, P0.1: 8.94 fps, P1: 10.3 fps, max: 60.4 fps
Intel Core Ultra 7 165U 3.8GHz
Graphics 4-Core
min: 10.7 fps, P0.1: 10.9 fps, P1: 12 fps, max: 18.9 fps
Intel Core Ultra 5 125U 3.6GHz
Graphics 4-Core
min: 10.8 fps, P0.1: 11 fps, P1: 12.6 fps, max: 28.4 fps
Intel Core Ultra 7 255H 4.4GHz
Arc 140T
min: 19.1 fps, P0.1: 19.1 fps, P1: 20.4 fps, max: 27.2 fps
Intel Core Ultra 7 255H 4.4GHz
Arc 140T
min: 18.6 fps, P0.1: 18.7 fps, P1: 19.4 fps, max: 28.3 fps
Intel Core Ultra 9 285H 4.5GHz
Arc 140T
min: 21.4 fps, P0.1: 21.5 fps, P1: 22 fps, max: 29 fps
Intel Core Ultra 5 115U 0.7GHz
Graphics 4-Core
min: 8.14 fps, P0.1: 8.42 fps, P1: 9.03 fps, max: 11.6 fps
Intel Core Ultra 7 155U 3.8GHz
Graphics 4-Core
min: 7.26 fps, P0.1: 7.77 fps, P1: 10.2 fps, max: 29.3 fps
Intel Core Ultra 7 155U 3.8GHz
Graphics 4-Core
min: 0.03588 fps, P0.1: 4.57 fps, P1: 9.98 fps, max: 766 fps
Intel Core Ultra 7 165U 3.8GHz
Graphics 4-Core
min: 11.2 fps, P0.1: 11.4 fps, P1: 12 fps, max: 20.5 fps
Intel Core Ultra 5 125U 3.6GHz
Graphics 4-Core
min: 10.1 fps, P0.1: 10.2 fps, P1: 11.7 fps, max: 27.6 fps

F1 23
20231093534
Intel Core Ultra 5 125U 3.6GHz
Graphics 4-Core
min: 34 fps, P1: 33 fps, max: 46 fps
1093534
Intel Core Ultra 7 165U 3.8GHz
Graphics 4-Core
min: 37 fps, P1: 36 fps, max: 51 fps
1093534
Intel Core Ultra 5 125U 3.6GHz
Graphics 4-Core
min: 31 fps, P1: 30 fps, max: 44 fps
1093534
Intel Core Ultra 7 165U 3.8GHz
Graphics 4-Core
min: 35 fps, P1: 33 fps, max: 48 fps
1093534
Intel Core Ultra 5 125U 3.6GHz
Graphics 4-Core
min: 20 fps, P1: 18 fps, max: 27 fps
1093534
Intel Core Ultra 7 165U 3.8GHz
Graphics 4-Core
min: 22 fps, P1: 22 fps, max: 29 fps
1093534
Intel Core Ultra 7 165U 3.8GHz
Graphics 4-Core
min: 5 fps, P1: 5 fps, max: 8 fps

F1 22
2022959964
Intel Core Ultra 5 125U 3.6GHz
Graphics 4-Core
min: 31 fps, P1: 32 fps, max: 46 fps
959964
Intel Core Ultra 5 125U 3.6GHz
Graphics 4-Core
min: 32 fps, P1: 32 fps, max: 50 fps
959964
Intel Core Ultra 5 125U 3.6GHz
Graphics 4-Core
min: 34 fps, P1: 33 fps, max: 52 fps
959964
Intel Core Ultra 7 164U 3.8GHz
Graphics 4-Core
min: 29 fps, P1: 29 fps, max: 53 fps
959964
Intel Core Ultra 7 155U 3.8GHz
Graphics 4-Core
min: 36 fps, P1: 35 fps, max: 54 fps
959964
Intel Core Ultra 7 155U 3.8GHz
Graphics 4-Core
min: 36 fps, P1: 36 fps, max: 52 fps
959964
Intel Core Ultra 5 125U 3.6GHz
Graphics 4-Core
min: 38 fps, P1: 37 fps, max: 54 fps
959964
Intel Core Ultra 7 155U 3.8GHz
Graphics 4-Core
min: 37 fps, P1: 36 fps, max: 56 fps
959964
Intel Core Ultra 7 165U 3.8GHz
Graphics 4-Core
min: 38 fps, P1: 37 fps, max: 57 fps
959964
Intel Core Ultra 5 135U 3.6GHz
Graphics 4-Core
min: 36 fps, P1: 35 fps, max: 58 fps
959964
Intel Core Ultra 7 164U 3.8GHz
Graphics 4-Core
min: 26 fps, P1: 26 fps, max: 41 fps
959964
Intel Core Ultra 5 125U 3.6GHz
Graphics 4-Core
min: 30 fps, P1: 30 fps, max: 44 fps
959964
Intel Core Ultra 5 125U 3.6GHz
Graphics 4-Core
min: 32 fps, P1: 31 fps, max: 44 fps
959964
Intel Core Ultra 5 125U 3.6GHz
Graphics 4-Core
min: 33 fps, P1: 32 fps, max: 49 fps
959964
Intel Core Ultra 7 155U 3.8GHz
Graphics 4-Core
min: 32 fps, P1: 33 fps, max: 50 fps
959964
Intel Core Ultra 7 155U 3.8GHz
Graphics 4-Core
min: 35 fps, P1: 34 fps, max: 51 fps
959964
Intel Core Ultra 5 135U 3.6GHz
Graphics 4-Core
min: 35 fps, P1: 34 fps, max: 48 fps
959964
Intel Core Ultra 7 165U 3.8GHz
Graphics 4-Core
min: 35 fps, P1: 34 fps, max: 50 fps
959964
Intel Core Ultra 5 125U 3.6GHz
Graphics 4-Core
min: 33 fps, P1: 34 fps, max: 51 fps
959964
Intel Core Ultra 7 155U 3.8GHz
Graphics 4-Core
min: 35 fps, P1: 34 fps, max: 51 fps
959964
Intel Core Ultra 7 164U 3.8GHz
Graphics 4-Core
min: 16 fps, P1: 17 fps, max: 29 fps
959964
Intel Core Ultra 5 125U 3.6GHz
Graphics 4-Core
min: 23 fps, P1: 23 fps, max: 33 fps
959964
Intel Core Ultra 7 165U 3.8GHz
Graphics 4-Core
min: 25 fps, P1: 24 fps, max: 34 fps
959964
Intel Core Ultra 7 155U 3.8GHz
Graphics 4-Core
min: 25 fps, P1: 25 fps, max: 34 fps
959964
Intel Core Ultra 7 155U 3.8GHz
Graphics 4-Core
min: 26 fps, P1: 25 fps, max: 35 fps
959964
Intel Core Ultra 5 135U 3.6GHz
Graphics 4-Core
min: 25 fps, P1: 25 fps, max: 36 fps
959964
Intel Core Ultra 5 125U 3.6GHz
Graphics 4-Core
min: 26 fps, P1: 25 fps, max: 38 fps
959964
Intel Core Ultra 7 164U 3.8GHz
Graphics 4-Core
min: 5 fps, P1: 5 fps, max: 9 fps
959964
Intel Core Ultra 7 165U 3.8GHz
Graphics 4-Core
min: 5 fps, P1: 5 fps, max: 10 fps
959964
Intel Core Ultra 7 155U 3.8GHz
Graphics 4-Core
min: 6 fps, P1: 6 fps, max: 9 fps
959964
Intel Core Ultra 5 135U 3.6GHz
Graphics 4-Core
min: 6 fps, P1: 6 fps, max: 9 fps


Strange Brigade
20181.47.22.14 D3D12
Intel Core Ultra 7 255H 4.4GHz
Arc 140T
min: 32 fps, P1: 43.4 fps, max: 327 fps
1.47.22.14 D3D12
Intel Core Ultra 9 285H 4.5GHz
Arc 140T
min: 50.6 fps, P1: 123.4 fps, max: 506 fps
1.47.22.14 D3D12
Intel Core Ultra 7 255H 4.4GHz
Arc 140T
min: 29.7 fps, P1: 105.2 fps, max: 539 fps
1.47.22.14 D3D12
Intel Core Ultra 7 255H 4.4GHz
Arc 140T
min: 53.5 fps, P1: 152 fps, max: 527 fps
1.47.22.14 D3D12
Intel Core Ultra 9 285H 4.5GHz
Arc 140T
min: 65.9 fps, P1: 148.6 fps, max: 599 fps
1.47.22.14 D3D12
Intel Core Ultra 7 255H 4.4GHz
Arc 140T
min: 53.4 fps, P1: 96.8 fps, max: 633 fps
1.47.22.14 D3D12
Intel Core Ultra 9 285H 4.5GHz
Arc 140T
min: 55.6 fps, P1: 166.8 fps, max: 554 fps
1.47.22.14 D3D12
Intel Core Ultra 5 225U 2.4GHz
Graphics 4-Core
min: 26.7 fps, P1: 58.1 fps, max: 210 fps
1.47.22.14 D3D12
Intel Core Ultra 5 125U 3.6GHz
Graphics 4-Core
min: 13 fps, P1: 58.2 fps, max: 293 fps
1.47.22.14 D3D12
Intel Core Ultra 7 165U 3.8GHz
Graphics 4-Core
min: 17.5 fps, P1: 33.6 fps, max: 174.9 fps
1.47.22.14 D3D12
Intel Core Ultra 5 125U 3.6GHz
Graphics 4-Core
min: 14.9 fps, P1: 59.5 fps, max: 308 fps
1.47.22.14 D3D12
Intel Core Ultra 5 115U 0.7GHz
Graphics 4-Core
min: 20.8 fps, P1: 57.1 fps, max: 282 fps
1.47.22.14 D3D12
Intel Core Ultra 7 165U 3.8GHz
Graphics 4-Core
min: 14.9 fps, P1: 57.1 fps, max: 266 fps
1.47.22.14 D3D12
Intel Core Ultra 5 134U 3.6GHz
Graphics 4-Core
min: 14.9 fps, P1: 57.1 fps, max: 266 fps
1.47.22.14 D3D12
Intel Core Ultra 7 155U 3.8GHz
Graphics 4-Core
min: 11 fps, P1: 59.4 fps, max: 286 fps
1.47.22.14 D3D12
Intel Core Ultra 7 164U 3.8GHz
Graphics 4-Core
min: 25.4 fps, P1: 56.3 fps, max: 290 fps
1.47.22.14 D3D12
Intel Core Ultra 7 165U 3.8GHz
Graphics 4-Core
min: 5 fps, P1: 50.8 fps, max: 241 fps
1.47.22.14 D3D12
Intel Core Ultra 7 155U 3.8GHz
Graphics 4-Core
min: 10.4 fps, P1: 89.7 fps, max: 288 fps
1.47.22.14 D3D12
Intel Core Ultra 5 125U 3.6GHz
Graphics 4-Core
min: 33.3 fps, P1: 76.9 fps, max: 316 fps
1.47.22.14 D3D12
Intel Core Ultra 7 255U 3.8GHz
Graphics 4-Core
min: 39.5 fps, P1: 79.7 fps, max: 274 fps
1.47.22.14 D3D12
Intel Core Ultra 5 125U 3.6GHz
Graphics 4-Core
min: 45.5 fps, P1: 86 fps, max: 330 fps
1.47.22.14 D3D12
Intel Core Ultra 7 155U 3.8GHz
Graphics 4-Core
min: 31.8 fps, P1: 95.7 fps, max: 258 fps
1.47.22.14 D3D12
Intel Core Ultra 7 165U 3.8GHz
Graphics 4-Core
min: 60 fps, P1: 89 fps, max: 368 fps
1.47.22.14 D3D12
Intel Core Ultra 7 155U 3.8GHz
Graphics 4-Core
min: 28.9 fps, P1: 93.5 fps, max: 322 fps
1.47.22.14 D3D12
Intel Core Ultra 5 135U 3.6GHz
Graphics 4-Core
min: 25.8 fps, P1: 85.9 fps, max: 351 fps
1.47.22.14 D3D12
Intel Core Ultra 5 125U 3.6GHz
Graphics 4-Core
min: 39.2 fps, P1: 96.2 fps, max: 269 fps
1.47.22.14 D3D12
Intel Core Ultra 7 165U 3.8GHz
Graphics 4-Core
min: 32.1 fps, P1: 95.5 fps, max: 362 fps
1.47.22.14 D3D12
Intel Core Ultra 5 125U 3.6GHz
Graphics 4-Core
min: 29.4 fps, P1: 97.4 fps, max: 307 fps
1.47.22.14 D3D12
Intel Core Ultra 7 255H 4.4GHz
Arc 140T
min: 23.1 fps, P1: 30.3 fps, max: 82.1 fps
1.47.22.14 D3D12
Intel Core Ultra 7 255H 4.4GHz
Arc 140T
min: 44.3 fps, P1: 50.6 fps, max: 85.6 fps
1.47.22.14 D3D12
Intel Core Ultra 9 285H 4.5GHz
Arc 140T
min: 56.7 fps, P1: 65.3 fps, max: 107.6 fps
1.47.22.14 D3D12
Intel Core Ultra 7 255H 4.4GHz
Arc 140T
min: 36.5 fps, P1: 67.5 fps, max: 259 fps
1.47.22.14 D3D12
Intel Core Ultra 9 285H 4.5GHz
Arc 140T
min: 52.1 fps, P1: 77.2 fps, max: 121.8 fps
1.47.22.14 D3D12
Intel Core Ultra 9 285H 4.5GHz
Arc 140T
min: 66.6 fps, P1: 77.5 fps, max: 131.8 fps
1.47.22.14 D3D12
Intel Core Ultra 7 255H 4.4GHz
Arc 140T
min: 43.2 fps, P1: 77.4 fps, max: 125.1 fps
1.47.22.14 D3D12
Intel Core Ultra 5 225U 2.4GHz
Graphics 4-Core
min: 22.9 fps, P1: 23.9 fps, max: 36.8 fps
1.47.22.14 D3D12
Intel Core Ultra 7 165U 3.8GHz
Graphics 4-Core
min: 10 fps, P1: 24.5 fps, max: 130.6 fps
1.47.22.14 D3D12
Intel Core Ultra 5 125U 3.6GHz
Graphics 4-Core
min: 9.7 fps, P1: 27.1 fps, max: 216 fps
1.47.22.14 D3D12
Intel Core Ultra 5 125U 3.6GHz
Graphics 4-Core
min: 11.4 fps, P1: 27.8 fps, max: 220 fps
1.47.22.14 D3D12
Intel Core Ultra 5 115U 0.7GHz
Graphics 4-Core
min: 19 fps, P1: 27 fps, max: 103.4 fps
1.47.22.14 D3D12
Intel Core Ultra 7 165U 3.8GHz
Graphics 4-Core
min: 8.4 fps, P1: 28.8 fps, max: 254 fps
1.47.22.14 D3D12
Intel Core Ultra 5 134U 3.6GHz
Graphics 4-Core
min: 8.4 fps, P1: 28.8 fps, max: 254 fps
1.47.22.14 D3D12
Intel Core Ultra 7 155U 3.8GHz
Graphics 4-Core
min: 9.8 fps, P1: 29.7 fps, max: 249 fps
1.47.22.14 D3D12
Intel Core Ultra 7 165U 3.8GHz
Graphics 4-Core
min: 5 fps, P1: 32 fps, max: 191.2 fps
1.47.22.14 D3D12
Intel Core Ultra 7 164U 3.8GHz
Graphics 4-Core
min: 22.8 fps, P1: 31.9 fps, max: 57.9 fps
1.47.22.14 D3D12
Intel Core Ultra 7 155U 3.8GHz
Graphics 4-Core
min: 24.6 fps, P1: 38 fps, max: 107.7 fps
1.47.22.14 D3D12
Intel Core Ultra 5 125U 3.6GHz
Graphics 4-Core
min: 13.2 fps, P1: 37.6 fps, max: 210 fps
1.47.22.14 D3D12
Intel Core Ultra 5 125U 3.6GHz
Graphics 4-Core
min: 30.9 fps, P1: 39.1 fps, max: 70.3 fps
1.47.22.14 D3D12
Intel Core Ultra 5 135U 3.6GHz
Graphics 4-Core
min: 26.4 fps, P1: 39.7 fps, max: 183.3 fps
1.47.22.14 D3D12
Intel Core Ultra 7 155U 3.8GHz
Graphics 4-Core
min: 19.6 fps, P1: 41 fps, max: 234 fps
1.47.22.14 D3D12
Intel Core Ultra 5 125U 3.6GHz
Graphics 4-Core
min: 35.9 fps, P1: 41.3 fps, max: 68.2 fps
1.47.22.14 D3D12
Intel Core Ultra 5 125U 3.6GHz
Graphics 4-Core
min: 24.3 fps, P1: 41.3 fps, max: 187.8 fps
1.47.22.14 D3D12
Intel Core Ultra 7 255U 3.8GHz
Graphics 4-Core
min: 27.7 fps, P1: 40.6 fps, max: 117.3 fps
1.47.22.14 D3D12
Intel Core Ultra 7 155U 3.8GHz
Graphics 4-Core
min: 25.8 fps, P1: 42.3 fps, max: 187.2 fps
1.47.22.14 D3D12
Intel Core Ultra 7 165U 3.8GHz
Graphics 4-Core
min: 31.3 fps, P1: 42.2 fps, max: 68.7 fps
1.47.22.14 D3D12
Intel Core Ultra 7 165U 3.8GHz
Graphics 4-Core
min: 23.9 fps, P1: 42 fps, max: 171.4 fps
1.47.22.14 D3D12
Intel Core Ultra 7 255H 4.4GHz
Arc 140T
min: 19.2 fps, P1: 21.9 fps, max: 134 fps
1.47.22.14 D3D12
Intel Core Ultra 7 255H 4.4GHz
Arc 140T
min: 17.3 fps, P1: 37.4 fps, max: 227 fps
1.47.22.14 D3D12
Intel Core Ultra 9 285H 4.5GHz
Arc 140T
min: 44.9 fps, P1: 52.8 fps, max: 112.1 fps
1.47.22.14 D3D12
Intel Core Ultra 7 255H 4.4GHz
Arc 140T
min: 31.4 fps, P1: 53 fps, max: 265 fps
1.47.22.14 D3D12
Intel Core Ultra 9 285H 4.5GHz
Arc 140T
min: 53.1 fps, P1: 59.3 fps, max: 109.5 fps
1.47.22.14 D3D12
Intel Core Ultra 9 285H 4.5GHz
Arc 140T
min: 41.3 fps, P1: 55.5 fps, max: 169.7 fps
1.47.22.14 D3D12
Intel Core Ultra 7 255H 4.4GHz
Arc 140T
min: 38.5 fps, P1: 60.4 fps, max: 106.9 fps
1.47.22.14 D3D12
Intel Core Ultra 5 225U 2.4GHz
Graphics 4-Core
min: 12.2 fps, P1: 15.9 fps, max: 47.5 fps
1.47.22.14 D3D12
Intel Core Ultra 5 125U 3.6GHz
Graphics 4-Core
min: 7.8 fps, P1: 12.9 fps, max: 199.2 fps
1.47.22.14 D3D12
Intel Core Ultra 5 125U 3.6GHz
Graphics 4-Core
min: 8.2 fps, P1: 11.3 fps, max: 237 fps
1.47.22.14 D3D12
Intel Core Ultra 7 165U 3.8GHz
Graphics 4-Core
min: 8.6 fps, P1: 11.4 fps, max: 100.8 fps
1.47.22.14 D3D12
Intel Core Ultra 5 115U 0.7GHz
Graphics 4-Core
min: 16.7 fps, P1: 18.9 fps, max: 106 fps
1.47.22.14 D3D12
Intel Core Ultra 7 155U 3.8GHz
Graphics 4-Core
min: 8.7 fps, P1: 13.9 fps, max: 256 fps
1.47.22.14 D3D12
Intel Core Ultra 7 165U 3.8GHz
Graphics 4-Core
min: 5 fps, P1: 6.84 fps, max: 204 fps
1.47.22.14 D3D12
Intel Core Ultra 7 164U 3.8GHz
Graphics 4-Core
min: 20 fps, P1: 23.9 fps, max: 48 fps
1.47.22.14 D3D12
Intel Core Ultra 5 125U 3.6GHz
Graphics 4-Core
min: 7.9 fps, P1: 13.1 fps, max: 266 fps
1.47.22.14 D3D12
Intel Core Ultra 7 155U 3.8GHz
Graphics 4-Core
min: 19.8 fps, P1: 24.8 fps, max: 147.4 fps
1.47.22.14 D3D12
Intel Core Ultra 7 255U 3.8GHz
Graphics 4-Core
min: 12.2 fps, P1: 24 fps, max: 125.9 fps
1.47.22.14 D3D12
Intel Core Ultra 5 134U 3.6GHz
Graphics 4-Core
min: 22 fps, P1: 26.5 fps, max: 66.8 fps
1.47.22.14 D3D12
Intel Core Ultra 7 155U 3.8GHz
Graphics 4-Core
min: 18.5 fps, P1: 27.3 fps, max: 120.4 fps
1.47.22.14 D3D12
Intel Core Ultra 7 155U 3.8GHz
Graphics 4-Core
min: 6.8 fps, P1: 13.1 fps, max: 267 fps
1.47.22.14 D3D12
Intel Core Ultra 5 125U 3.6GHz
Graphics 4-Core
min: 22.6 fps, P1: 28.8 fps, max: 58.2 fps
1.47.22.14 D3D12
Intel Core Ultra 5 125U 3.6GHz
Graphics 4-Core
min: 10 fps, P1: 24 fps, max: 277 fps
1.47.22.14 D3D12
Intel Core Ultra 5 135U 3.6GHz
Graphics 4-Core
min: 20.1 fps, P1: 24.2 fps, max: 222 fps
1.47.22.14 D3D12
Intel Core Ultra 5 125U 3.6GHz
Graphics 4-Core
min: 22.9 fps, P1: 26.7 fps, max: 202 fps
1.47.22.14 D3D12
Intel Core Ultra 7 165U 3.8GHz
Graphics 4-Core
min: 15.4 fps, P1: 28.4 fps, max: 154.6 fps
1.47.22.14 D3D12
Intel Core Ultra 7 165U 3.8GHz
Graphics 4-Core
min: 20.6 fps, P1: 30.5 fps, max: 165.1 fps
1.47.22.14 D3D12
Intel Core Ultra 7 255H 4.4GHz
Arc 140T
min: 6.1 fps, P1: 8.09 fps, max: 336 fps
1.47.22.14 D3D12
Intel Core Ultra 7 255H 4.4GHz
Arc 140T
min: 6.6 fps, P1: 12.2 fps, max: 344 fps
1.47.22.14 D3D12
Intel Core Ultra 7 255H 4.4GHz
Arc 140T
min: 25.9 fps, P1: 29.6 fps, max: 172.9 fps
1.47.22.14 D3D12
Intel Core Ultra 9 285H 4.5GHz
Arc 140T
min: 35.8 fps, P1: 41.5 fps, max: 111.1 fps
1.47.22.14 D3D12
Intel Core Ultra 7 255H 4.4GHz
Arc 140T
min: 27.8 fps, P1: 32.1 fps, max: 226 fps
1.47.22.14 D3D12
Intel Core Ultra 9 285H 4.5GHz
Arc 140T
min: 37.9 fps, P1: 48.3 fps, max: 106.6 fps
1.47.22.14 D3D12
Intel Core Ultra 9 285H 4.5GHz
Arc 140T
min: 45.2 fps, P1: 49.5 fps, max: 83.9 fps
1.47.22.14 D3D12
Intel Core Ultra 7 255H 4.4GHz
Arc 140T
min: 33.6 fps, P1: 50.1 fps, max: 83.3 fps
1.47.22.14 D3D12
Intel Core Ultra 5 225U 2.4GHz
Graphics 4-Core
min: 17.8 fps, P1: 18.4 fps, max: 28.7 fps
1.47.22.14 D3D12
Intel Core Ultra 5 125U 3.6GHz
Graphics 4-Core
min: 7.8 fps, P1: 9.43 fps, max: 238 fps
1.47.22.14 D3D12
Intel Core Ultra 7 165U 3.8GHz
Graphics 4-Core
min: 5 fps, P1: 9.13 fps, max: 101.4 fps
1.47.22.14 D3D12
Intel Core Ultra 5 125U 3.6GHz
Graphics 4-Core
min: 7.3 fps, P1: 9.15 fps, max: 242 fps
1.47.22.14 D3D12
Intel Core Ultra 5 115U 0.7GHz
Graphics 4-Core
min: 14.2 fps, P1: 15.3 fps, max: 61.6 fps
1.47.22.14 D3D12
Intel Core Ultra 5 125U 3.6GHz
Graphics 4-Core
min: 7.3 fps, P1: 8.8 fps, max: 296 fps
1.47.22.14 D3D12
Intel Core Ultra 7 164U 3.8GHz
Graphics 4-Core
min: 13.7 fps, P1: 15 fps, max: 43.4 fps
1.47.22.14 D3D12
Intel Core Ultra 7 155U 3.8GHz
Graphics 4-Core
min: 7.3 fps, P1: 9.68 fps, max: 264 fps
1.47.22.14 D3D12
Intel Core Ultra 7 165U 3.8GHz
Graphics 4-Core
min: 5 fps, P1: 5.64 fps, max: 238 fps
1.47.22.14 D3D12
Intel Core Ultra 7 155U 3.8GHz
Graphics 4-Core
min: 7.3 fps, P1: 10.1 fps, max: 268 fps
1.47.22.14 D3D12
Intel Core Ultra 7 255U 3.8GHz
Graphics 4-Core
min: 14.6 fps, P1: 18.6 fps, max: 130.4 fps
1.47.22.14 D3D12
Intel Core Ultra 7 155U 3.8GHz
Graphics 4-Core
min: 17.5 fps, P1: 19 fps, max: 59.4 fps
1.47.22.14 D3D12
Intel Core Ultra 5 125U 3.6GHz
Graphics 4-Core
min: 6.1 fps, P1: 9.16 fps, max: 256 fps
1.47.22.14 D3D12
Intel Core Ultra 5 134U 3.6GHz
Graphics 4-Core
min: 15.9 fps, P1: 21.6 fps, max: 50.6 fps
1.47.22.14 D3D12
Intel Core Ultra 7 155U 3.8GHz
Graphics 4-Core
min: 16.7 fps, P1: 19.1 fps, max: 78 fps
1.47.22.14 D3D12
Intel Core Ultra 5 135U 3.6GHz
Graphics 4-Core
min: 7.1 fps, P1: 10 fps, max: 269 fps
1.47.22.14 D3D12
Intel Core Ultra 5 125U 3.6GHz
Graphics 4-Core
min: 7.6 fps, P1: 10.6 fps, max: 303 fps
1.47.22.14 D3D12
Intel Core Ultra 7 155U 3.8GHz
Graphics 4-Core
min: 7.5 fps, P1: 11.1 fps, max: 288 fps
1.47.22.14 D3D12
Intel Core Ultra 5 125U 3.6GHz
Graphics 4-Core
min: 15.2 fps, P1: 19 fps, max: 126.7 fps
1.47.22.14 D3D12
Intel Core Ultra 7 165U 3.8GHz
Graphics 4-Core
min: 7.8 fps, P1: 12.8 fps, max: 139.4 fps
1.47.22.14 D3D12
Intel Core Ultra 7 165U 3.8GHz
Graphics 4-Core
min: 21.1 fps, P1: 24.8 fps, max: 49.5 fps

Far Cry 5
2018Intel Core Ultra 5 125U 3.6GHz
Graphics 4-Core
min: 7 fps, max: 48 fps
Intel Core Ultra 5 125U 3.6GHz
Graphics 4-Core
min: 21 fps, max: 46 fps
Intel Core Ultra 7 155U 3.8GHz
Graphics 4-Core
min: 17 fps, max: 45 fps
Intel Core Ultra 5 125U 3.6GHz
Graphics 4-Core
min: 21 fps, max: 49 fps
Intel Core Ultra 7 155U 3.8GHz
Graphics 4-Core
min: 11 fps, max: 49 fps
Intel Core Ultra 5 125U 3.6GHz
Graphics 4-Core
min: 27 fps, max: 51 fps
Intel Core Ultra 5 125U 3.6GHz
Graphics 4-Core
min: 39 fps, max: 53 fps
Intel Core Ultra 7 164U 3.8GHz
Graphics 4-Core
min: 30 fps, max: 58 fps
Intel Core Ultra 5 125U 3.6GHz
Graphics 4-Core
min: 12 fps, max: 24 fps
Intel Core Ultra 7 155U 3.8GHz
Graphics 4-Core
min: 11 fps, max: 24 fps
Intel Core Ultra 5 125U 3.6GHz
Graphics 4-Core
min: 10 fps, max: 26 fps
Intel Core Ultra 5 125U 3.6GHz
Graphics 4-Core
min: 9 fps, max: 28 fps
Intel Core Ultra 7 155U 3.8GHz
Graphics 4-Core
min: 21 fps, max: 27 fps
Intel Core Ultra 5 125U 3.6GHz
Graphics 4-Core
min: 17 fps, max: 30 fps
Intel Core Ultra 7 164U 3.8GHz
Graphics 4-Core
min: 20 fps, max: 33 fps
Intel Core Ultra 5 125U 3.6GHz
Graphics 4-Core
min: 17 fps, max: 22 fps
Intel Core Ultra 7 155U 3.8GHz
Graphics 4-Core
min: 17 fps, max: 22 fps
Intel Core Ultra 5 125U 3.6GHz
Graphics 4-Core
min: 18 fps, max: 23 fps
Intel Core Ultra 5 125U 3.6GHz
Graphics 4-Core
min: 9 fps, max: 24 fps
Intel Core Ultra 5 125U 3.6GHz
Graphics 4-Core
min: 16 fps, max: 27 fps
Intel Core Ultra 7 155U 3.8GHz
Graphics 4-Core
min: 20 fps, max: 25 fps
Intel Core Ultra 5 125U 3.6GHz
Graphics 4-Core
min: 22 fps, max: 29 fps
Intel Core Ultra 7 164U 3.8GHz
Graphics 4-Core
min: 19 fps, max: 31 fps
Intel Core Ultra 5 125U 3.6GHz
Graphics 4-Core
min: 16 fps, max: 21 fps
Intel Core Ultra 5 125U 3.6GHz
Graphics 4-Core
min: 7 fps, max: 23 fps
Intel Core Ultra 7 155U 3.8GHz
Graphics 4-Core
min: 13 fps, max: 21 fps
Intel Core Ultra 5 125U 3.6GHz
Graphics 4-Core
min: 11 fps, max: 21 fps
Intel Core Ultra 7 155U 3.8GHz
Graphics 4-Core
min: 15 fps, max: 23 fps
Intel Core Ultra 5 125U 3.6GHz
Graphics 4-Core
min: 19 fps, max: 24 fps
Intel Core Ultra 5 125U 3.6GHz
Graphics 4-Core
min: 20 fps, max: 26 fps
Intel Core Ultra 7 164U 3.8GHz
Graphics 4-Core
min: 18 fps, max: 28 fps

X-Plane 11.11
2018
Dota 2 Reborn
2015Intel Core Ultra 7 255H 4.4GHz
Arc 140T
min: 60.4 fps, max: -1 fps
Intel Core Ultra 7 255H 4.4GHz
Arc 140T
min: 56.2 fps, max: -1 fps
Intel Core Ultra 7 255H 4.4GHz
Arc 140T
min: 59.4 fps, max: -1 fps
Intel Core Ultra 7 165U 3.8GHz
Graphics 4-Core
min: 23.3 fps, max: -1 fps
Intel Core Ultra 5 134U 3.6GHz
Graphics 4-Core
min: 23.3 fps, max: -1 fps
Intel Core Ultra 5 125U 3.6GHz
Graphics 4-Core
min: 28.7 fps, max: -1 fps
Intel Core Ultra 7 165U 3.8GHz
Graphics 4-Core
min: 32 fps, max: -1 fps
Intel Core Ultra 7 155U 3.8GHz
Graphics 4-Core
min: 50.3 fps, max: -1 fps
Intel Core Ultra 7 164U 3.8GHz
Graphics 4-Core
min: 58.2 fps, max: -1 fps
Intel Core Ultra 7 155U 3.8GHz
Graphics 4-Core
min: 61.8 fps, max: -1 fps
Intel Core Ultra 5 115U 0.7GHz
Graphics 4-Core
min: 60.2 fps, max: -1 fps
Intel Core Ultra 5 125U 3.6GHz
Graphics 4-Core
min: 63.5 fps, max: -1 fps
Intel Core Ultra 5 125U 3.6GHz
Graphics 4-Core
min: 62.3 fps, max: -1 fps
Intel Core Ultra 7 155U 3.8GHz
Graphics 4-Core
min: 61.3 fps, max: -1 fps
Intel Core Ultra 7 165U 3.8GHz
Graphics 4-Core
min: 64.6 fps, max: -1 fps
Intel Core Ultra 7 165U 3.8GHz
Graphics 4-Core
min: 62.8 fps, max: -1 fps
Intel Core Ultra 5 125U 3.6GHz
Graphics 4-Core
min: 63.4 fps, max: -1 fps
Intel Core Ultra 5 125U 3.6GHz
Graphics 4-Core
min: 64 fps, max: -1 fps
Intel Core Ultra 5 125U 3.6GHz
Graphics 4-Core
min: 63.9 fps, max: -1 fps
Intel Core Ultra 7 255U 3.8GHz
Graphics 4-Core
min: 57.4 fps, max: -1 fps
Intel Core Ultra 5 125U 3.6GHz
Graphics 4-Core
min: 60.1 fps, max: -1 fps
Intel Core Ultra 5 225U 2.4GHz
Graphics 4-Core
min: 65.9 fps, max: -1 fps
Intel Core Ultra 7 165U 3.8GHz
Graphics 4-Core
min: 50.4 fps, max: -1 fps
Intel Core Ultra 7 155U 3.8GHz
Graphics 4-Core
min: 61.2 fps, max: -1 fps
Intel Core Ultra 5 125U 3.6GHz
Graphics 4-Core
min: 62 fps, max: -1 fps
Intel Core Ultra 7 255H 4.4GHz
Arc 140T
min: 49 fps, max: -1 fps
Intel Core Ultra 7 255H 4.4GHz
Arc 140T
min: 52 fps, max: -1 fps
Intel Core Ultra 7 255H 4.4GHz
Arc 140T
min: 43.7 fps, max: -1 fps
Intel Core Ultra 7 165U 3.8GHz
Graphics 4-Core
min: 24.6 fps, max: -1 fps
Intel Core Ultra 5 134U 3.6GHz
Graphics 4-Core
min: 24.6 fps, max: -1 fps
Intel Core Ultra 5 125U 3.6GHz
Graphics 4-Core
min: 27.9 fps, max: -1 fps
Intel Core Ultra 7 165U 3.8GHz
Graphics 4-Core
min: 29.8 fps, max: -1 fps
Intel Core Ultra 5 125U 3.6GHz
Graphics 4-Core
min: 37 fps, max: -1 fps
Intel Core Ultra 5 125U 3.6GHz
Graphics 4-Core
min: 28.8 fps, max: -1 fps
Intel Core Ultra 7 155U 3.8GHz
Graphics 4-Core
min: 29.2 fps, max: -1 fps
Intel Core Ultra 5 125U 3.6GHz
Graphics 4-Core
min: 32.5 fps, max: -1 fps
Intel Core Ultra 7 155U 3.8GHz
Graphics 4-Core
min: 35.2 fps, max: -1 fps
Intel Core Ultra 5 125U 3.6GHz
Graphics 4-Core
min: 29.1 fps, max: -1 fps
Intel Core Ultra 7 164U 3.8GHz
Graphics 4-Core
min: 43.4 fps, max: -1 fps
Intel Core Ultra 7 155U 3.8GHz
Graphics 4-Core
min: 33.2 fps, max: -1 fps
Intel Core Ultra 7 155U 3.8GHz
Graphics 4-Core
min: 41.9 fps, max: -1 fps
Intel Core Ultra 7 255U 3.8GHz
Graphics 4-Core
min: 35 fps, max: -1 fps
Intel Core Ultra 5 125U 3.6GHz
Graphics 4-Core
min: 38.1 fps, max: -1 fps
Intel Core Ultra 5 115U 0.7GHz
Graphics 4-Core
min: 46.4 fps, max: -1 fps
Intel Core Ultra 5 125U 3.6GHz
Graphics 4-Core
min: 47.9 fps, max: -1 fps
Intel Core Ultra 7 165U 3.8GHz
Graphics 4-Core
min: 42.7 fps, max: -1 fps
Intel Core Ultra 7 165U 3.8GHz
Graphics 4-Core
min: 50.9 fps, max: -1 fps
Intel Core Ultra 7 165U 3.8GHz
Graphics 4-Core
min: 55.4 fps, max: -1 fps
Intel Core Ultra 5 125U 3.6GHz
Graphics 4-Core
min: 52.3 fps, max: -1 fps
Intel Core Ultra 5 225U 2.4GHz
Graphics 4-Core
min: 31 fps, max: -1 fps
Intel Core Ultra 7 255H 4.4GHz
Arc 140T
min: 27.7 fps, max: -1 fps
Intel Core Ultra 7 255H 4.4GHz
Arc 140T
min: 43.2 fps, max: -1 fps
Intel Core Ultra 7 255H 4.4GHz
Arc 140T
min: 49.6 fps, max: -1 fps
Intel Core Ultra 5 225U 2.4GHz
Graphics 4-Core
min: 22.3 fps, max: -1 fps
Intel Core Ultra 7 165U 3.8GHz
Graphics 4-Core
min: 28.2 fps, max: -1 fps
Intel Core Ultra 5 134U 3.6GHz
Graphics 4-Core
min: 28.2 fps, max: -1 fps
Intel Core Ultra 5 125U 3.6GHz
Graphics 4-Core
min: 28.3 fps, max: -1 fps
Intel Core Ultra 7 165U 3.8GHz
Graphics 4-Core
min: 31.4 fps, max: -1 fps
Intel Core Ultra 5 125U 3.6GHz
Graphics 4-Core
min: 29.8 fps, max: -1 fps
Intel Core Ultra 7 164U 3.8GHz
Graphics 4-Core
min: 39.2 fps, max: -1 fps
Intel Core Ultra 7 155U 3.8GHz
Graphics 4-Core
min: 31.8 fps, max: -1 fps
Intel Core Ultra 5 125U 3.6GHz
Graphics 4-Core
min: 41.3 fps, max: -1 fps
Intel Core Ultra 7 165U 3.8GHz
Graphics 4-Core
min: 31.5 fps, max: -1 fps
Intel Core Ultra 5 115U 0.7GHz
Graphics 4-Core
min: 30.7 fps, max: -1 fps
Intel Core Ultra 7 155U 3.8GHz
Graphics 4-Core
min: 33.1 fps, max: -1 fps
Intel Core Ultra 7 155U 3.8GHz
Graphics 4-Core
min: 42.7 fps, max: -1 fps
Intel Core Ultra 7 155U 3.8GHz
Graphics 4-Core
min: 33.7 fps, max: -1 fps
Intel Core Ultra 5 125U 3.6GHz
Graphics 4-Core
min: 30.2 fps, max: -1 fps
Intel Core Ultra 7 165U 3.8GHz
Graphics 4-Core
min: 43.9 fps, max: -1 fps
Intel Core Ultra 7 165U 3.8GHz
Graphics 4-Core
min: 45.2 fps, max: -1 fps
Intel Core Ultra 5 125U 3.6GHz
Graphics 4-Core
min: 37.9 fps, max: -1 fps
Intel Core Ultra 5 125U 3.6GHz
Graphics 4-Core
min: 36.4 fps, max: -1 fps
Intel Core Ultra 5 125U 3.6GHz
Graphics 4-Core
min: 36.9 fps, max: -1 fps
Intel Core Ultra 5 125U 3.6GHz
Graphics 4-Core
min: 37.2 fps, max: -1 fps
Intel Core Ultra 7 255U 3.8GHz
Graphics 4-Core
min: 38.6 fps, max: -1 fps
Intel Core Ultra 7 255H 4.4GHz
Arc 140T
min: 41.1 fps, max: -1 fps
Intel Core Ultra 7 255H 4.4GHz
Arc 140T
min: 48.9 fps, max: -1 fps
Intel Core Ultra 7 255H 4.4GHz
Arc 140T
min: 48.7 fps, max: -1 fps
Intel Core Ultra 7 165U 3.8GHz
Graphics 4-Core
min: 25 fps, max: -1 fps
Intel Core Ultra 5 134U 3.6GHz
Graphics 4-Core
min: 25 fps, max: -1 fps
Intel Core Ultra 5 125U 3.6GHz
Graphics 4-Core
min: 27.7 fps, max: -1 fps
Intel Core Ultra 5 125U 3.6GHz
Graphics 4-Core
min: 28.8 fps, max: -1 fps
Intel Core Ultra 7 165U 3.8GHz
Graphics 4-Core
min: 31.4 fps, max: -1 fps
Intel Core Ultra 7 155U 3.8GHz
Graphics 4-Core
min: 29.4 fps, max: -1 fps
Intel Core Ultra 7 164U 3.8GHz
Graphics 4-Core
min: 38.5 fps, max: -1 fps
Intel Core Ultra 5 225U 2.4GHz
Graphics 4-Core
min: 18.9 fps, max: -1 fps
Intel Core Ultra 5 125U 3.6GHz
Graphics 4-Core
min: 40.1 fps, max: -1 fps
Intel Core Ultra 5 125U 3.6GHz
Graphics 4-Core
min: 29.1 fps, max: -1 fps
Intel Core Ultra 5 115U 0.7GHz
Graphics 4-Core
min: 30.1 fps, max: -1 fps
Intel Core Ultra 7 155U 3.8GHz
Graphics 4-Core
min: 32.6 fps, max: -1 fps
Intel Core Ultra 7 155U 3.8GHz
Graphics 4-Core
min: 41.9 fps, max: -1 fps
Intel Core Ultra 7 155U 3.8GHz
Graphics 4-Core
min: 33.9 fps, max: -1 fps
Intel Core Ultra 5 125U 3.6GHz
Graphics 4-Core
min: 33.1 fps, max: -1 fps
Intel Core Ultra 5 125U 3.6GHz
Graphics 4-Core
min: 31.1 fps, max: -1 fps
Intel Core Ultra 7 165U 3.8GHz
Graphics 4-Core
min: 42.7 fps, max: -1 fps
Intel Core Ultra 5 125U 3.6GHz
Graphics 4-Core
min: 37.5 fps, max: -1 fps
Intel Core Ultra 5 125U 3.6GHz
Graphics 4-Core
min: 36.3 fps, max: -1 fps
Intel Core Ultra 7 165U 3.8GHz
Graphics 4-Core
min: 38.8 fps, max: -1 fps
Intel Core Ultra 7 255U 3.8GHz
Graphics 4-Core
min: 37.8 fps, max: -1 fps

The Witcher 3
2015Intel Core Ultra 9 285H 4.5GHz
Arc 140T
min: 12.7 fps, P0.1: 100.9 fps, P1: 127.4 fps, max: 211 fps
Intel Core Ultra 7 255H 4.4GHz
Arc 140T
min: 9.2 fps, P0.1: 91.7 fps, P1: 135 fps, max: 227 fps
Intel Core Ultra 5 125U 3.6GHz
Graphics 4-Core
min: 56 fps, max: 71 fps
Intel Core Ultra 5 125U 3.6GHz
Graphics 4-Core
min: 74 fps, P1: 74.34 fps, max: 88 fps
Intel Core Ultra 5 125U 3.6GHz
Graphics 4-Core
min: 78 fps, max: 91 fps
Intel Core Ultra 5 125U 3.6GHz
Graphics 4-Core
min: 75 fps, max: 95 fps
Intel Core Ultra 7 165U 3.8GHz
Graphics 4-Core
min: 75 fps, max: 101 fps
Intel Core Ultra 7 155U 3.8GHz
Graphics 4-Core
min: 75 fps, max: 101 fps
Intel Core Ultra 9 285H 4.5GHz
Arc 140T
min: 15.4 fps, P0.1: 71.5 fps, P1: 85.2 fps, max: 127.5 fps
Intel Core Ultra 7 255H 4.4GHz
Arc 140T
min: 17.8 fps, P0.1: 43.6 fps, P1: 90.7 fps, max: 138.3 fps
Intel Core Ultra 5 125U 3.6GHz
Graphics 4-Core
min: 39 fps, max: 44 fps
Intel Core Ultra 5 125U 3.6GHz
Graphics 4-Core
min: 40 fps, max: 54 fps
Intel Core Ultra 5 125U 3.6GHz
Graphics 4-Core
min: 46 fps, P1: 46.32 fps, max: 55 fps
Intel Core Ultra 5 125U 3.6GHz
Graphics 4-Core
min: 47 fps, max: 54 fps
Intel Core Ultra 9 285H 4.5GHz
Arc 140T
min: 43.5 fps, P0.1: 44.6 fps, P1: 47.6 fps, max: 66.7 fps
Intel Core Ultra 7 255H 4.4GHz
Arc 140T
min: 15 fps, P0.1: 34.1 fps, P1: 54.1 fps, max: 76.2 fps
Intel Core Ultra 5 125U 3.6GHz
Graphics 4-Core
min: 17 fps, max: 24 fps
Intel Core Ultra 5 125U 3.6GHz
Graphics 4-Core
min: 24 fps, P1: 24 fps, max: 31 fps
Intel Core Ultra 5 125U 3.6GHz
Graphics 4-Core
min: 25 fps, max: 32 fps
Intel Core Ultra 5 125U 3.6GHz
Graphics 4-Core
min: 27 fps, max: 30 fps
Intel Core Ultra 9 285H 4.5GHz
Arc 140T
min: 22.7 fps, P0.1: 23.6 fps, P1: 24.7 fps, max: 32.1 fps
Intel Core Ultra 7 255H 4.4GHz
Arc 140T
min: 16.5 fps, P0.1: 20.9 fps, P1: 27.4 fps, max: 35.5 fps
Intel Core Ultra 5 125U 3.6GHz
Graphics 4-Core
min: 10 fps, max: 14 fps
Intel Core Ultra 5 125U 3.6GHz
Graphics 4-Core
min: 9 fps, P1: 10.4 fps, max: 16 fps
Intel Core Ultra 5 125U 3.6GHz
Graphics 4-Core
min: 11 fps, max: 18 fps
Intel Core Ultra 5 125U 3.6GHz
Graphics 4-Core
min: 13 fps, max: 18 fps
Intel Core Ultra 7 165U 3.8GHz
Graphics 4-Core
min: 15 fps, P1: 15 fps, max: 18 fps

GTA V
2015Intel Core Ultra 7 255H 4.4GHz
Arc 140T
min: 6.63 fps, P1: 83.3 fps, max: 273 fps
Intel Core Ultra 9 285H 4.5GHz
Arc 140T
min: 3.49 fps, P1: 38.5 fps, max: 374 fps
Intel Core Ultra 7 255H 4.4GHz
Arc 140T
min: 3.31 fps, P1: 100 fps, max: 360 fps
Intel Core Ultra 7 255H 4.4GHz
Arc 140T
min: 3.19 fps, P1: 111.1 fps, max: 379 fps
Intel Core Ultra 9 285H 4.5GHz
Arc 140T
min: 4.08 fps, P1: 111.1 fps, max: 314 fps
Intel Core Ultra 7 255H 4.4GHz
Arc 140T
min: 3.81 fps, P1: 125 fps, max: 350 fps
Intel Core Ultra 9 285H 4.5GHz
Arc 140T
min: 5.36 fps, P1: 125 fps, max: 321 fps
Intel Core Ultra 5 134U 3.6GHz
Graphics 4-Core
min: 7.37 fps, P1: 31.3 fps, max: 146.7 fps
Intel Core Ultra 7 165U 3.8GHz
Graphics 4-Core
min: 7.86 fps, P1: 35.7 fps, max: 151.5 fps
Intel Core Ultra 7 165U 3.8GHz
Graphics 4-Core
min: 9.2 fps, P1: 55.6 fps, max: 174.1 fps
Intel Core Ultra 7 155U 3.8GHz
Graphics 4-Core
min: 15.7 fps, P1: 55.6 fps, max: 192.1 fps
Intel Core Ultra 5 225U 2.4GHz
Graphics 4-Core
min: 17.8 fps, P1: 62.5 fps, max: 223 fps
Intel Core Ultra 7 165U 3.8GHz
Graphics 4-Core
min: 13.6 fps, P1: 40 fps, max: 210 fps
Intel Core Ultra 5 125U 3.6GHz
Graphics 4-Core
min: 14 fps, P1: 47.6 fps, max: 234 fps
Intel Core Ultra 5 125U 3.6GHz
Graphics 4-Core
min: 17 fps, P1: 58.8 fps, max: 191.1 fps
Intel Core Ultra 7 155U 3.8GHz
Graphics 4-Core
min: 13.2 fps, P1: 62.5 fps, max: 221 fps
Intel Core Ultra 7 155U 3.8GHz
Graphics 4-Core
min: 13.3 fps, P1: 66.7 fps, max: 201 fps
Intel Core Ultra 7 164U 3.8GHz
Graphics 4-Core
min: 16.7 fps, P1: 71.4 fps, max: 215 fps
Intel Core Ultra 5 115U 0.7GHz
Graphics 4-Core
min: 20 fps, P1: 71.4 fps, max: 219 fps
Intel Core Ultra 5 125U 3.6GHz
Graphics 4-Core
min: 9.39 fps, P1: 50 fps, max: 237 fps
Intel Core Ultra 7 155U 3.8GHz
Graphics 4-Core
min: 4.44 fps, P1: 62.5 fps, max: 241 fps
Intel Core Ultra 5 125U 3.6GHz
Graphics 4-Core
min: 5.14 fps, P1: 62.5 fps, max: 286 fps
Intel Core Ultra 7 255U 3.8GHz
Graphics 4-Core
min: 4.73 fps, P1: 83.3 fps, max: 276 fps
Intel Core Ultra 7 165U 3.8GHz
Graphics 4-Core
min: 5.53 fps, P1: 76.9 fps, max: 276 fps
Intel Core Ultra 5 125U 3.6GHz
Graphics 4-Core
min: 3.79 fps, P1: 62.5 fps, max: 334 fps
Intel Core Ultra 7 255H 4.4GHz
Arc 140T
min: 12.6 fps, P1: 66.7 fps, max: 247 fps
Intel Core Ultra 9 285H 4.5GHz
Arc 140T
min: 5.41 fps, P1: 55.6 fps, max: 316 fps
Intel Core Ultra 7 255H 4.4GHz
Arc 140T
min: 4.14 fps, P1: 100 fps, max: 319 fps
Intel Core Ultra 9 285H 4.5GHz
Arc 140T
min: 4.74 fps, P1: 90.9 fps, max: 279 fps
Intel Core Ultra 9 285H 4.5GHz
Arc 140T
min: 4.34 fps, P1: 100 fps, max: 320 fps
Intel Core Ultra 7 255H 4.4GHz
Arc 140T
min: 5.6 fps, P1: 111.1 fps, max: 315 fps
Intel Core Ultra 7 165U 3.8GHz
Graphics 4-Core
min: 4.98 fps, P1: 37 fps, max: 133.4 fps
Intel Core Ultra 5 125U 3.6GHz
Graphics 4-Core
min: 5.74 fps, P1: 35.7 fps, max: 157 fps
Intel Core Ultra 7 155U 3.8GHz
Graphics 4-Core
min: 11.7 fps, P1: 50 fps, max: 166.3 fps
Intel Core Ultra 5 225U 2.4GHz
Graphics 4-Core
min: 12.9 fps, P1: 55.6 fps, max: 183.1 fps
Intel Core Ultra 5 125U 3.6GHz
Graphics 4-Core
min: 10.5 fps, P1: 52.6 fps, max: 178.6 fps
Intel Core Ultra 7 155U 3.8GHz
Graphics 4-Core
min: 8.3 fps, P1: 55.6 fps, max: 186.3 fps
Intel Core Ultra 7 165U 3.8GHz
Graphics 4-Core
min: 8.88 fps, P1: 40 fps, max: 163.9 fps
Intel Core Ultra 5 115U 0.7GHz
Graphics 4-Core
min: 11.3 fps, P1: 58.8 fps, max: 169 fps
Intel Core Ultra 7 164U 3.8GHz
Graphics 4-Core
min: 8.89 fps, P1: 58.8 fps, max: 209 fps
Intel Core Ultra 5 134U 3.6GHz
Graphics 4-Core
min: 10.6 fps, P1: 37 fps, max: 199.9 fps
Intel Core Ultra 7 155U 3.8GHz
Graphics 4-Core
min: 11.6 fps, P1: 58.8 fps, max: 188.2 fps
Intel Core Ultra 5 125U 3.6GHz
Graphics 4-Core
min: 7.35 fps, P1: 52.6 fps, max: 240 fps
Intel Core Ultra 7 165U 3.8GHz
Graphics 4-Core
min: 8.4 fps, P1: 50 fps, max: 210 fps
Intel Core Ultra 7 155U 3.8GHz
Graphics 4-Core
min: 12.9 fps, P1: 66.7 fps, max: 209 fps
Intel Core Ultra 5 125U 3.6GHz
Graphics 4-Core
min: 5.97 fps, P1: 62.5 fps, max: 202 fps
Intel Core Ultra 5 125U 3.6GHz
Graphics 4-Core
min: 6.1 fps, P1: 58.8 fps, max: 254 fps
Intel Core Ultra 7 255U 3.8GHz
Graphics 4-Core
min: 9.97 fps, P1: 66.7 fps, max: 238 fps
Intel Core Ultra 7 165U 3.8GHz
Graphics 4-Core
min: 8.51 fps, P1: 71.4 fps, max: 244 fps
Intel Core Ultra 7 255H 4.4GHz
Arc 140T
min: 6.66 fps, P1: 18.5 fps, max: 92.1 fps
Intel Core Ultra 7 255H 4.4GHz
Arc 140T
min: 8.08 fps, P1: 30.3 fps, max: 113.2 fps
Intel Core Ultra 7 255H 4.4GHz
Arc 140T
min: 4.51 fps, P1: 34.5 fps, max: 143.8 fps
Intel Core Ultra 9 285H 4.5GHz
Arc 140T
min: 4.99 fps, P1: 29.4 fps, max: 195.6 fps
Intel Core Ultra 9 285H 4.5GHz
Arc 140T
min: 10 fps, P1: 32.3 fps, max: 137.1 fps
Intel Core Ultra 9 285H 4.5GHz
Arc 140T
min: 8.38 fps, P1: 34.5 fps, max: 155.1 fps
Intel Core Ultra 7 155U 3.8GHz
Graphics 4-Core
min: 1.725 fps, P1: 12 fps, max: 93.5 fps
Intel Core Ultra 7 164U 3.8GHz
Graphics 4-Core
min: 2.25 fps, P1: 12.5 fps, max: 80.4 fps
Intel Core Ultra 7 165U 3.8GHz
Graphics 4-Core
min: 3.2 fps, P1: 11.1 fps, max: 95.1 fps
Intel Core Ultra 7 155U 3.8GHz
Graphics 4-Core
min: 2.41 fps, P1: 15.2 fps, max: 106.4 fps
Intel Core Ultra 5 225U 2.4GHz
Graphics 4-Core
min: 5.41 fps, P1: 15.4 fps, max: 89.6 fps
Intel Core Ultra 5 115U 0.7GHz
Graphics 4-Core
min: 4.62 fps, P1: 15.9 fps, max: 121.3 fps
Intel Core Ultra 5 134U 3.6GHz
Graphics 4-Core
min: 2.97 fps, P1: 15.9 fps, max: 88.5 fps
Intel Core Ultra 5 125U 3.6GHz
Graphics 4-Core
min: 3 fps, P1: 15.2 fps, max: 80.5 fps
Intel Core Ultra 5 125U 3.6GHz
Graphics 4-Core
min: 2.05 fps, P1: 14.7 fps, max: 82 fps
Intel Core Ultra 5 125U 3.6GHz
Graphics 4-Core
min: 2.35 fps, P1: 15.6 fps, max: 106.2 fps
Intel Core Ultra 7 165U 3.8GHz
Graphics 4-Core
min: 1.866 fps, P1: 14.9 fps, max: 91.7 fps
Intel Core Ultra 5 125U 3.6GHz
Graphics 4-Core
min: 2.61 fps, P1: 15.6 fps, max: 116.7 fps
Intel Core Ultra 7 165U 3.8GHz
Graphics 4-Core
min: 2.16 fps, P1: 11.6 fps, max: 82.2 fps
Intel Core Ultra 5 125U 3.6GHz
Graphics 4-Core
min: 5.71 fps, P1: 17.9 fps, max: 101 fps
Intel Core Ultra 7 165U 3.8GHz
Graphics 4-Core
min: 2.14 fps, P1: 13.5 fps, max: 96 fps
Intel Core Ultra 7 155U 3.8GHz
Graphics 4-Core
min: 4.04 fps, P1: 19.6 fps, max: 112.7 fps
Intel Core Ultra 7 155U 3.8GHz
Graphics 4-Core
min: 2.92 fps, P1: 20 fps, max: 97.1 fps
Intel Core Ultra 7 255U 3.8GHz
Graphics 4-Core
min: 9.05 fps, P1: 20.8 fps, max: 102.3 fps
Intel Core Ultra 7 255H 4.4GHz
Arc 140T
min: 4.06 fps, P1: 7.81 fps, max: 78.5 fps
Intel Core Ultra 7 255H 4.4GHz
Arc 140T
min: 5.75 fps, P1: 11.9 fps, max: 97.2 fps
Intel Core Ultra 7 255H 4.4GHz
Arc 140T
min: 6.75 fps, P1: 12.2 fps, max: 97.8 fps
Intel Core Ultra 9 285H 4.5GHz
Arc 140T
min: 3.75 fps, P1: 12.8 fps, max: 107.5 fps
Intel Core Ultra 9 285H 4.5GHz
Arc 140T
min: 6.65 fps, P1: 13 fps, max: 98.4 fps
Intel Core Ultra 9 285H 4.5GHz
Arc 140T
min: 5.43 fps, P1: 13.7 fps, max: 98 fps
Intel Core Ultra 7 255H 4.4GHz
Arc 140T
min: 7.56 fps, P1: 13.3 fps, max: 124.2 fps
Intel Core Ultra 7 255H 4.4GHz
Arc 140T
min: 8.33 fps, P1: 14.1 fps, max: 92.2 fps
Intel Core Ultra 7 155U 3.8GHz
Graphics 4-Core
min: 1.883 fps, P1: 5 fps, max: 67.8 fps
Intel Core Ultra 7 155U 3.8GHz
Graphics 4-Core
min: 2.31 fps, P1: 5.59 fps, max: 76.7 fps
Intel Core Ultra 7 164U 3.8GHz
Graphics 4-Core
min: 1.677 fps, P1: 4.78 fps, max: 62.6 fps
Intel Core Ultra 5 225U 2.4GHz
Graphics 4-Core
min: 4.54 fps, P1: 5.92 fps, max: 91.3 fps
Intel Core Ultra 5 115U 0.7GHz
Graphics 4-Core
min: 3.86 fps, P1: 6.45 fps, max: 57.2 fps
Intel Core Ultra 7 155U 3.8GHz
Graphics 4-Core
min: 4.7 fps, P1: 6.17 fps, max: 75.1 fps
Intel Core Ultra 5 125U 3.6GHz
Graphics 4-Core
min: 2.29 fps, P1: 6.29 fps, max: 79.2 fps
Intel Core Ultra 7 165U 3.8GHz
Graphics 4-Core
min: 1.953 fps, P1: 6.06 fps, max: 71.2 fps
Intel Core Ultra 5 134U 3.6GHz
Graphics 4-Core
min: 2.4 fps, P1: 6.54 fps, max: 86.9 fps
Intel Core Ultra 5 125U 3.6GHz
Graphics 4-Core
min: 1.788 fps, P1: 6.33 fps, max: 63.5 fps
Intel Core Ultra 5 125U 3.6GHz
Graphics 4-Core
min: 2.6 fps, P1: 6.29 fps, max: 79.8 fps
Intel Core Ultra 5 125U 3.6GHz
Graphics 4-Core
min: 1.867 fps, P1: 6.33 fps, max: 100.4 fps
Intel Core Ultra 7 165U 3.8GHz
Graphics 4-Core
min: 1.463 fps, P1: 6.33 fps, max: 57.8 fps
Intel Core Ultra 7 165U 3.8GHz
Graphics 4-Core
min: 1.588 fps, P1: 6.54 fps, max: 84.7 fps
Intel Core Ultra 7 165U 3.8GHz
Graphics 4-Core
min: 1.644 fps, P1: 7.41 fps, max: 38.1 fps
Intel Core Ultra 7 155U 3.8GHz
Graphics 4-Core
min: 2.71 fps, P1: 7.46 fps, max: 88.1 fps
Intel Core Ultra 5 125U 3.6GHz
Graphics 4-Core
min: 4.73 fps, P1: 7.41 fps, max: 85 fps
Intel Core Ultra 7 255U 3.8GHz
Graphics 4-Core
min: 4.93 fps, P1: 8.47 fps, max: 73.8 fps
Average Gaming Intel Arc Graphics 140T → 100%
Average Gaming 30-70 fps → 100%
Average Gaming Intel Graphics 4-Core iGPU (Arc) → 55%
Average Gaming 30-70 fps → 59%
| Intel Arc Graphics 140T | Intel Graphics 4-Core iGPU (Arc) | |||||||||||||
|---|---|---|---|---|---|---|---|---|---|---|---|---|---|---|
| low | med. | high | ultra | QHD | 4K | low | med. | high | ultra | QHD | 4K | |||
| Indiana Jones and the Great Circle | 7.09 | |||||||||||||
| Stalker 2 | 6.8 | 5.99 | 5.33 | |||||||||||
| Call of Duty Black Ops 6 | 15 | 14 | 10 | |||||||||||
| Until Dawn | 17.3 | 11.5 | 7.44 | |||||||||||
| Final Fantasy XVI | 7.97 | 7.96 | 6.71 | |||||||||||
| Space Marine 2 | 10.2 | 8.12 | 7.41 | |||||||||||
| Star Wars Outlaws | ||||||||||||||
| F1 24 | 76 | 69 | 54 | 19 | 37 | 33 | 25 | 7.33 | ||||||
| Senua's Saga Hellblade 2 | 6.43 | 5.37 | 4.14 | |||||||||||
| Ghost of Tsushima | 11.5 | 9.75 | 8.89 | |||||||||||
| Horizon Forbidden West | 13.8 | 12.3 | 8 | |||||||||||
| Dragon's Dogma 2 | 9.13 | 6.81 | ||||||||||||
| Helldivers 2 | 16 | 12.2 | 11 | |||||||||||
| Prince of Persia The Lost Crown | 96.4 | 48.4 | 45.7 | |||||||||||
| Cyberpunk 2077 2.2 Phantom Liberty | 37 | 31 | 26 | 23 | 19 | 15 | 13 | 12 | ||||||
| Baldur's Gate 3 | 37 | 29 | 25 | 24 | 18 | 14 | 12 | 12 | ||||||
| F1 23 | 42 | 39 | 25 | 7.14 | ||||||||||
| F1 22 | 43 | 40 | 29 | 8 | ||||||||||
| Tiny Tina's Wonderlands | 29 | 23 | 16 | 13 | ||||||||||
| Strange Brigade | 177 | 76 | 64 | 53 | 99 | 43 | 34 | 28 | ||||||
| Far Cry 5 | 84 | 48 | 45 | 40 | 43 | 24 | 22 | 20 | ||||||
| X-Plane 11.11 | 59 | 48 | 40 | 36 | 28 | 24 | ||||||||
| Final Fantasy XV Benchmark | 77 | 43 | 29 | 23.4 | 40 | 22 | 17 | |||||||
| Dota 2 Reborn | 104 | 78 | 69 | 75 | 88 | 58 | 55 | 52 | ||||||
| The Witcher 3 | 162 | 105 | 59 | 30 | 86 | 53 | 29 | 16 | ||||||
| GTA V | 165 | 153 | 40 | 16 | 111 | 99 | 21 | 9 | ||||||
| Intel Arc Graphics 140T | Intel Graphics 4-Core iGPU (Arc) | |||||||||||||
| low | med. | high | ultra | QHD | 4K | low | med. | high | ultra | QHD | 4K | < 30 fps < 60 fps < 120 fps ≥ 120 fps | 3 4 3 | 1 4 4 1 | 3 5 2 | 4 3 1 | 1 | | < 30 fps < 60 fps < 120 fps ≥ 120 fps | 14 6 4 | 15 6 2 | 21 3 | 10 2 | | |
For more games that might be playable and a list of all games and graphics cards visit our Gaming List
#0 ran 0s before starting gpusingle class +0s ... 0s
#1 checking url part for id 12966 +0s ... 0s
#2 checking url part for id 12259 +0s ... 0s
#3 redirected to Ajax server, took 1754335584s time from redirect:0 +0s ... 0s
#4 did not recreate cache, as it is less than 5 days old! Created at Mon, 04 Aug 2025 18:06:45 +0200 +0s ... 0s
#5 composed specs +0.018s ... 0.018s
#6 did output specs +0s ... 0.018s
#7 start showIntegratedCPUs +0s ... 0.018s
#8 getting avg benchmarks for device 12966 +0.018s ... 0.036s
#9 got single benchmarks 12966 +0.014s ... 0.05s
#10 getting avg benchmarks for device 12259 +0.004s ... 0.054s
#11 got single benchmarks 12259 +0.031s ... 0.085s
#12 got avg benchmarks for devices +0s ... 0.085s
#13 min, max, avg, median took s +0.049s ... 0.134s
#14 before gaming benchmark output +0s ... 0.134s
#15 Got 1200 rows for game benchmarks. +0.062s ... 0.196s
#16 composed SQL query for gamebenchmarks +0s ... 0.196s
#17 got data and put it in $dataArray +0.004s ... 0.201s
#18 benchmarks composed for output. +0.013s ... 0.214s
#19 calculated avg scores. +0s ... 0.214s
#20 return log +0.001s ... 0.215s