Palit GeForce RTX 4090 GameRock OC Desktop GPU review: High end performance with a price to match

Nvidia's new top model bears the name GeForce RTX 4090 and has a whopping 24 GB VRAM, like its predecessor. Consequently, it is increasingly establishing itself as the standard in the high end segment of consumer graphics cards. AMD's recently unveiled Radeon RX 7900 XTX is similarly following suit and comes equipped with 24 GB VRAM.
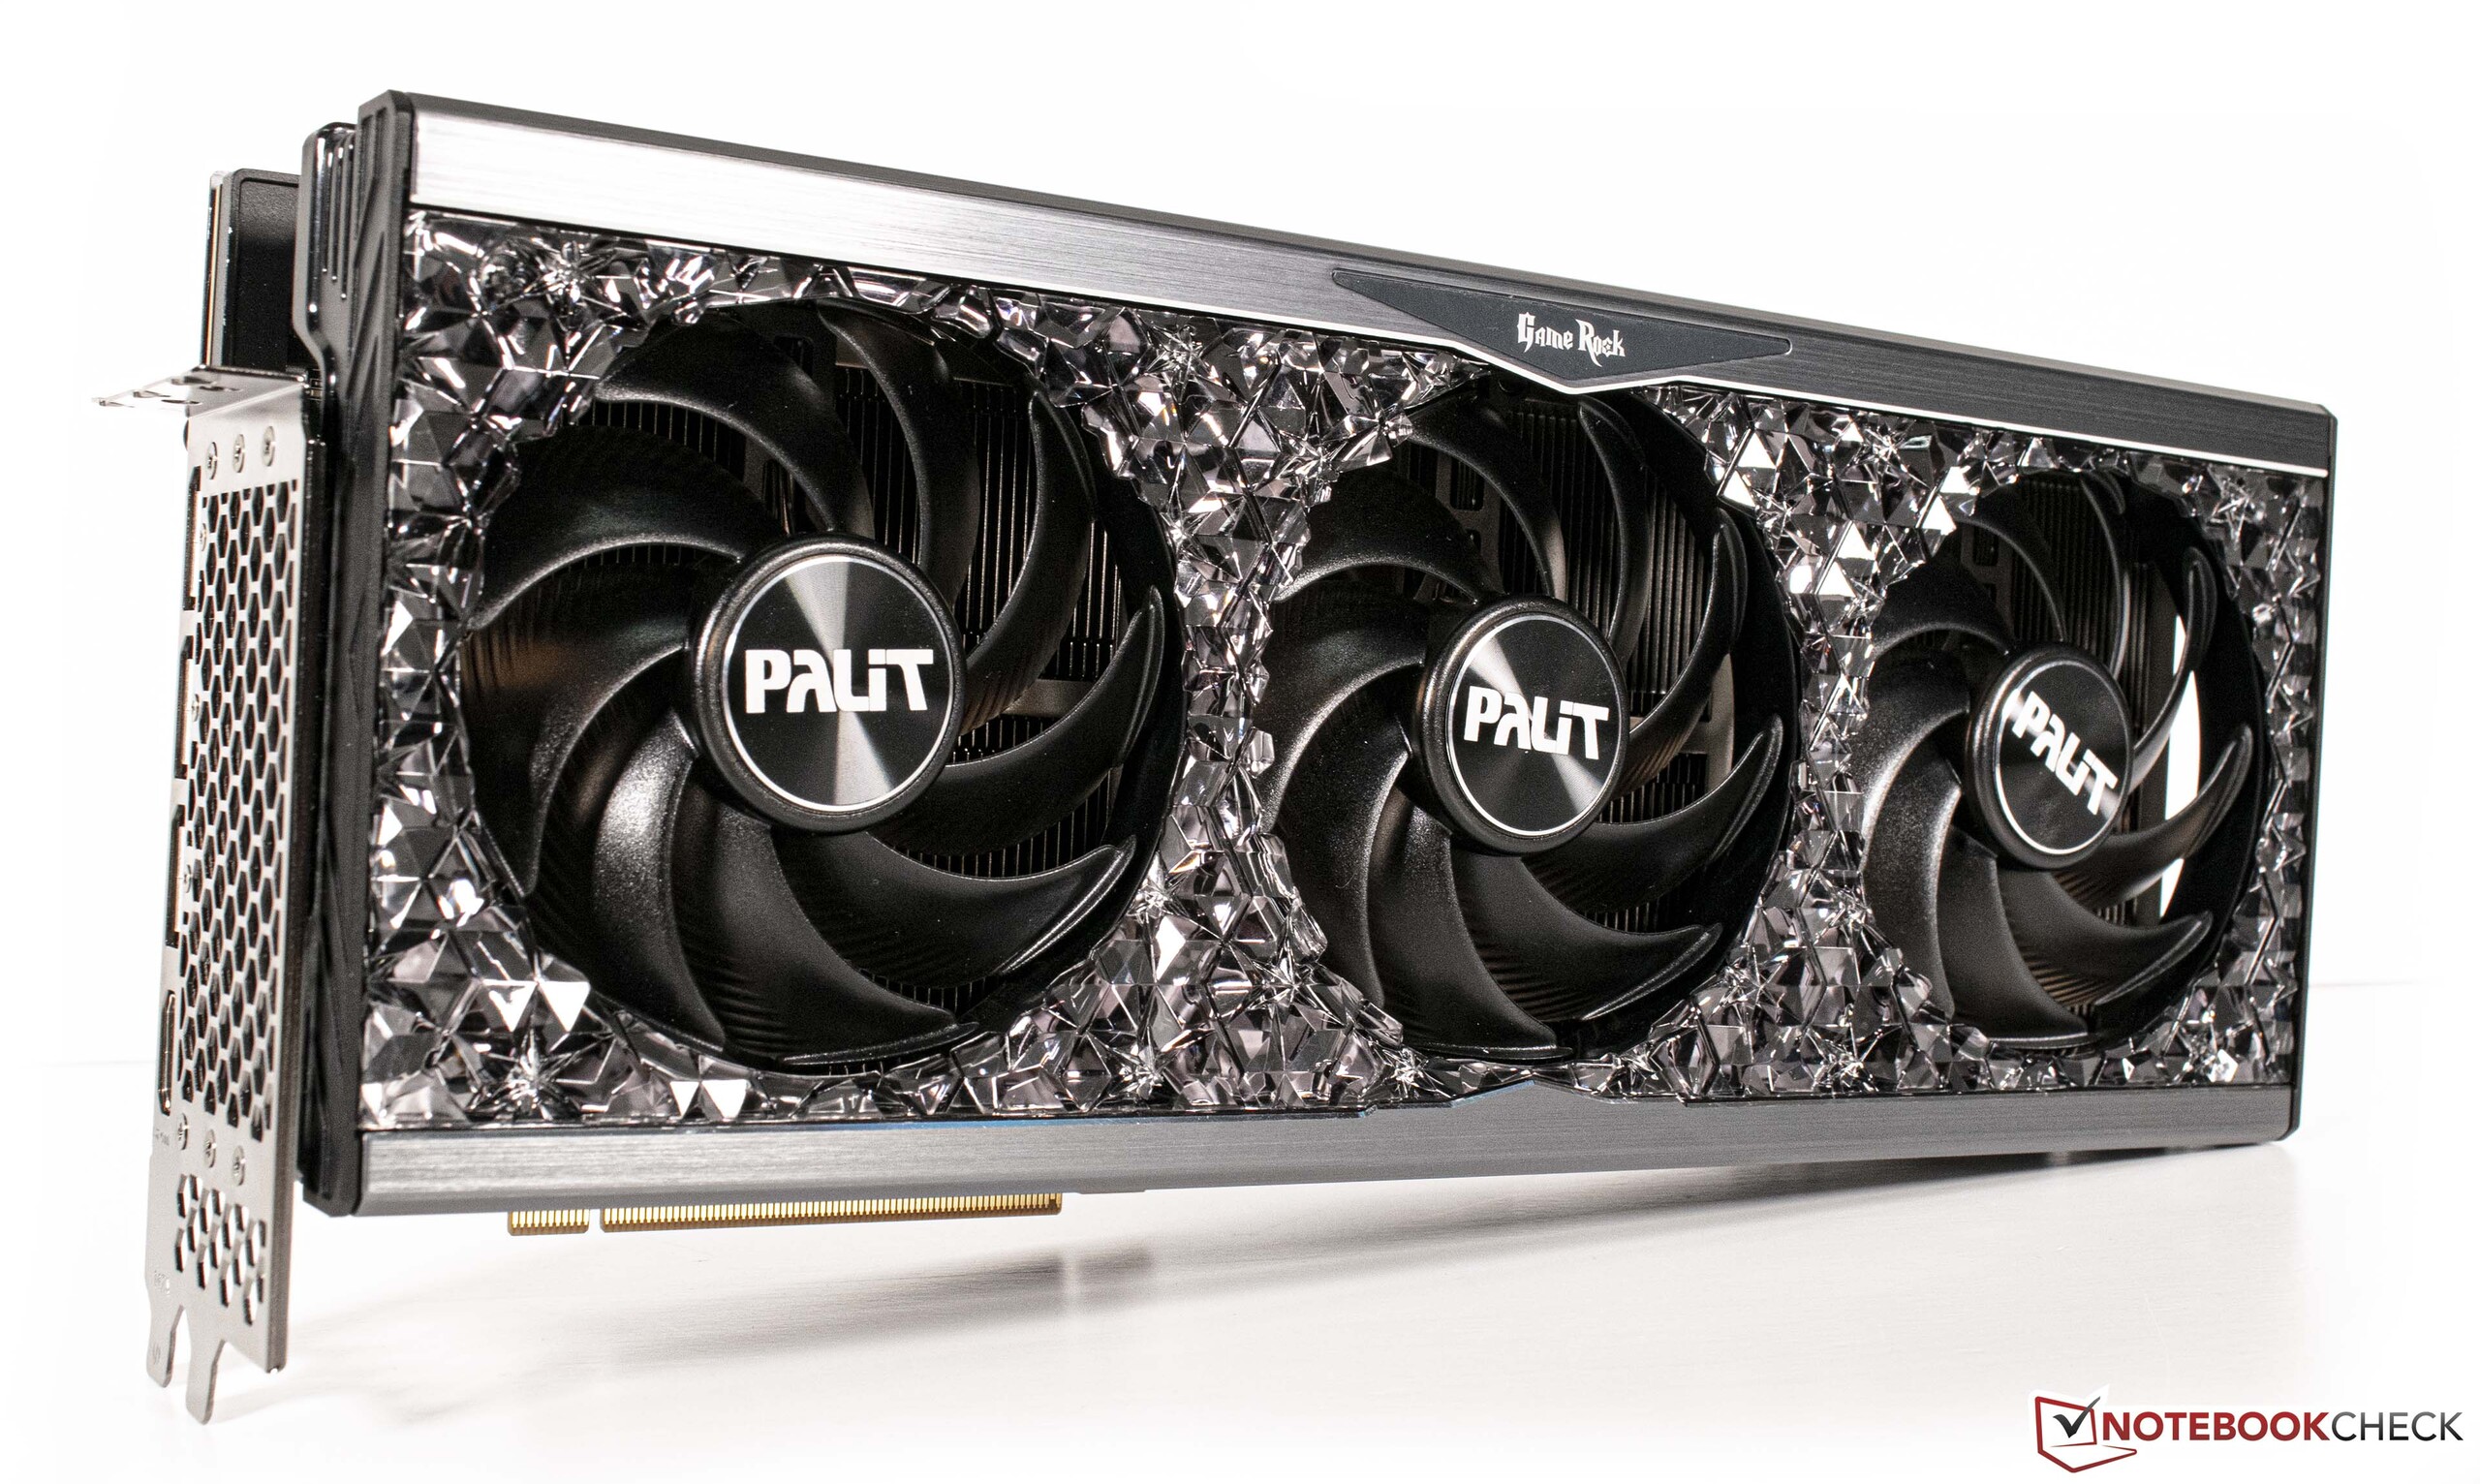
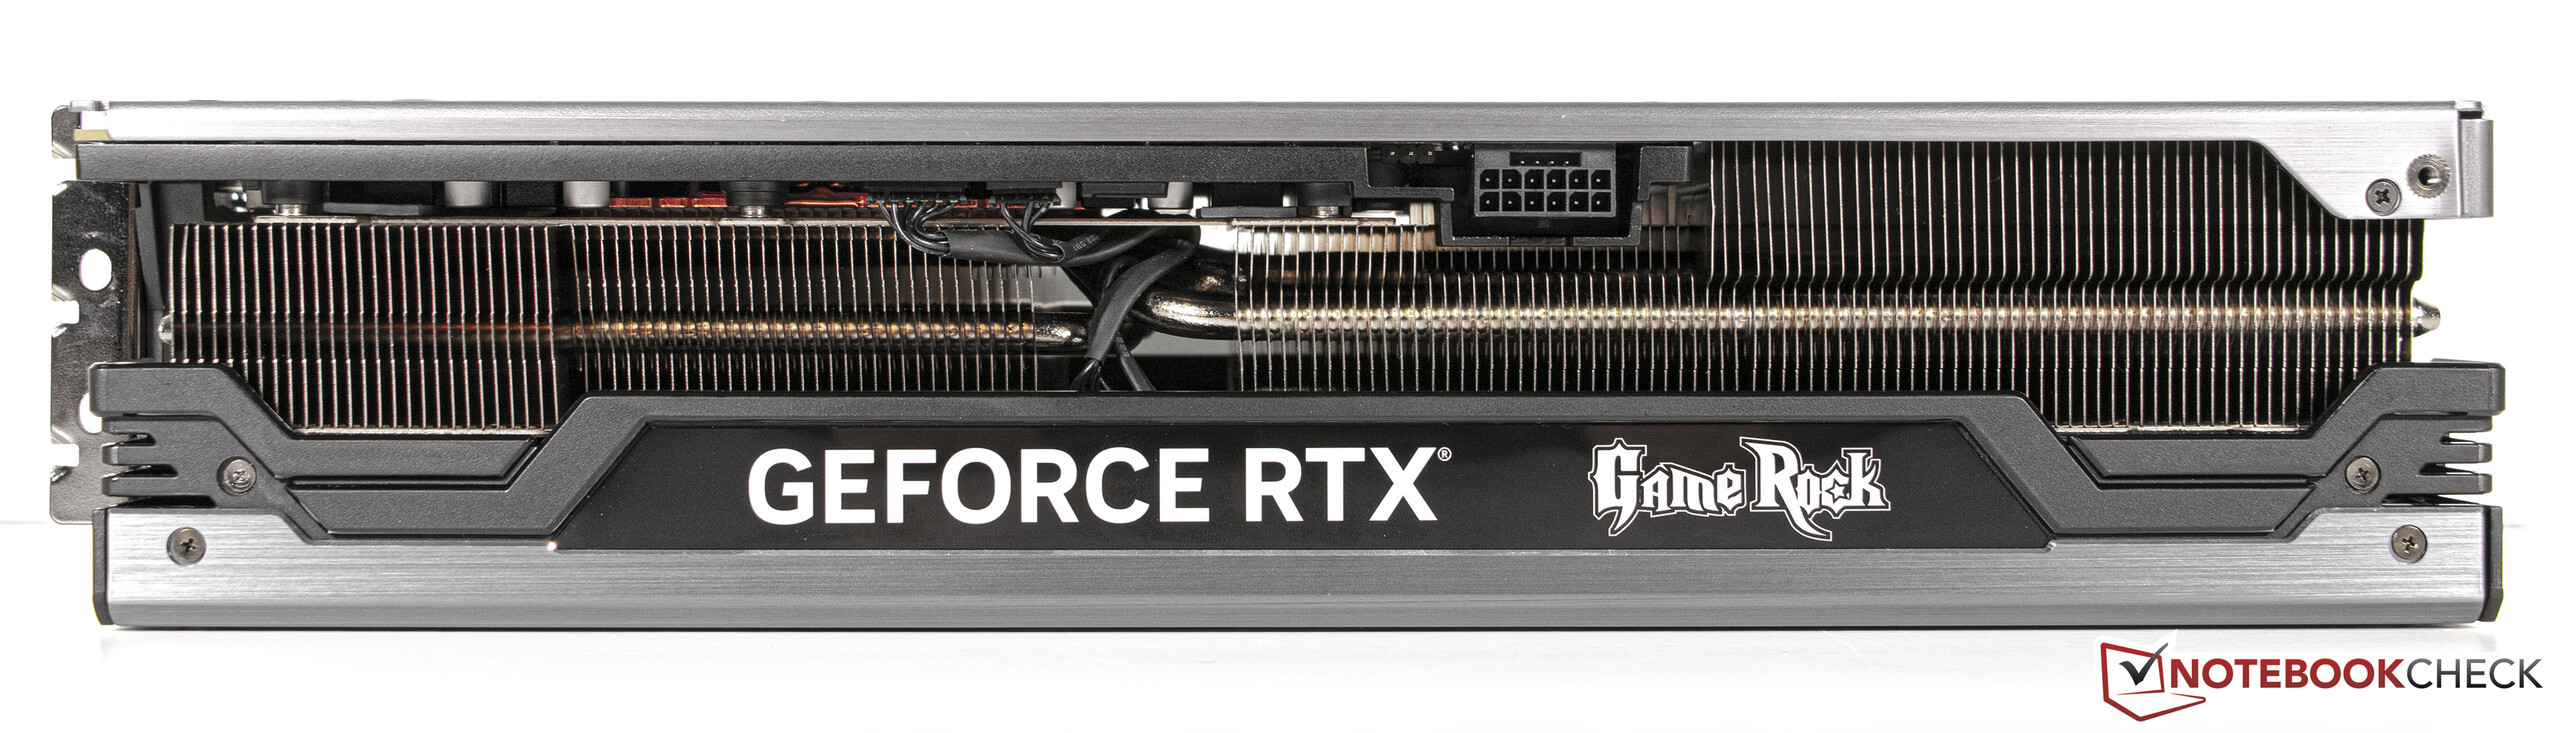
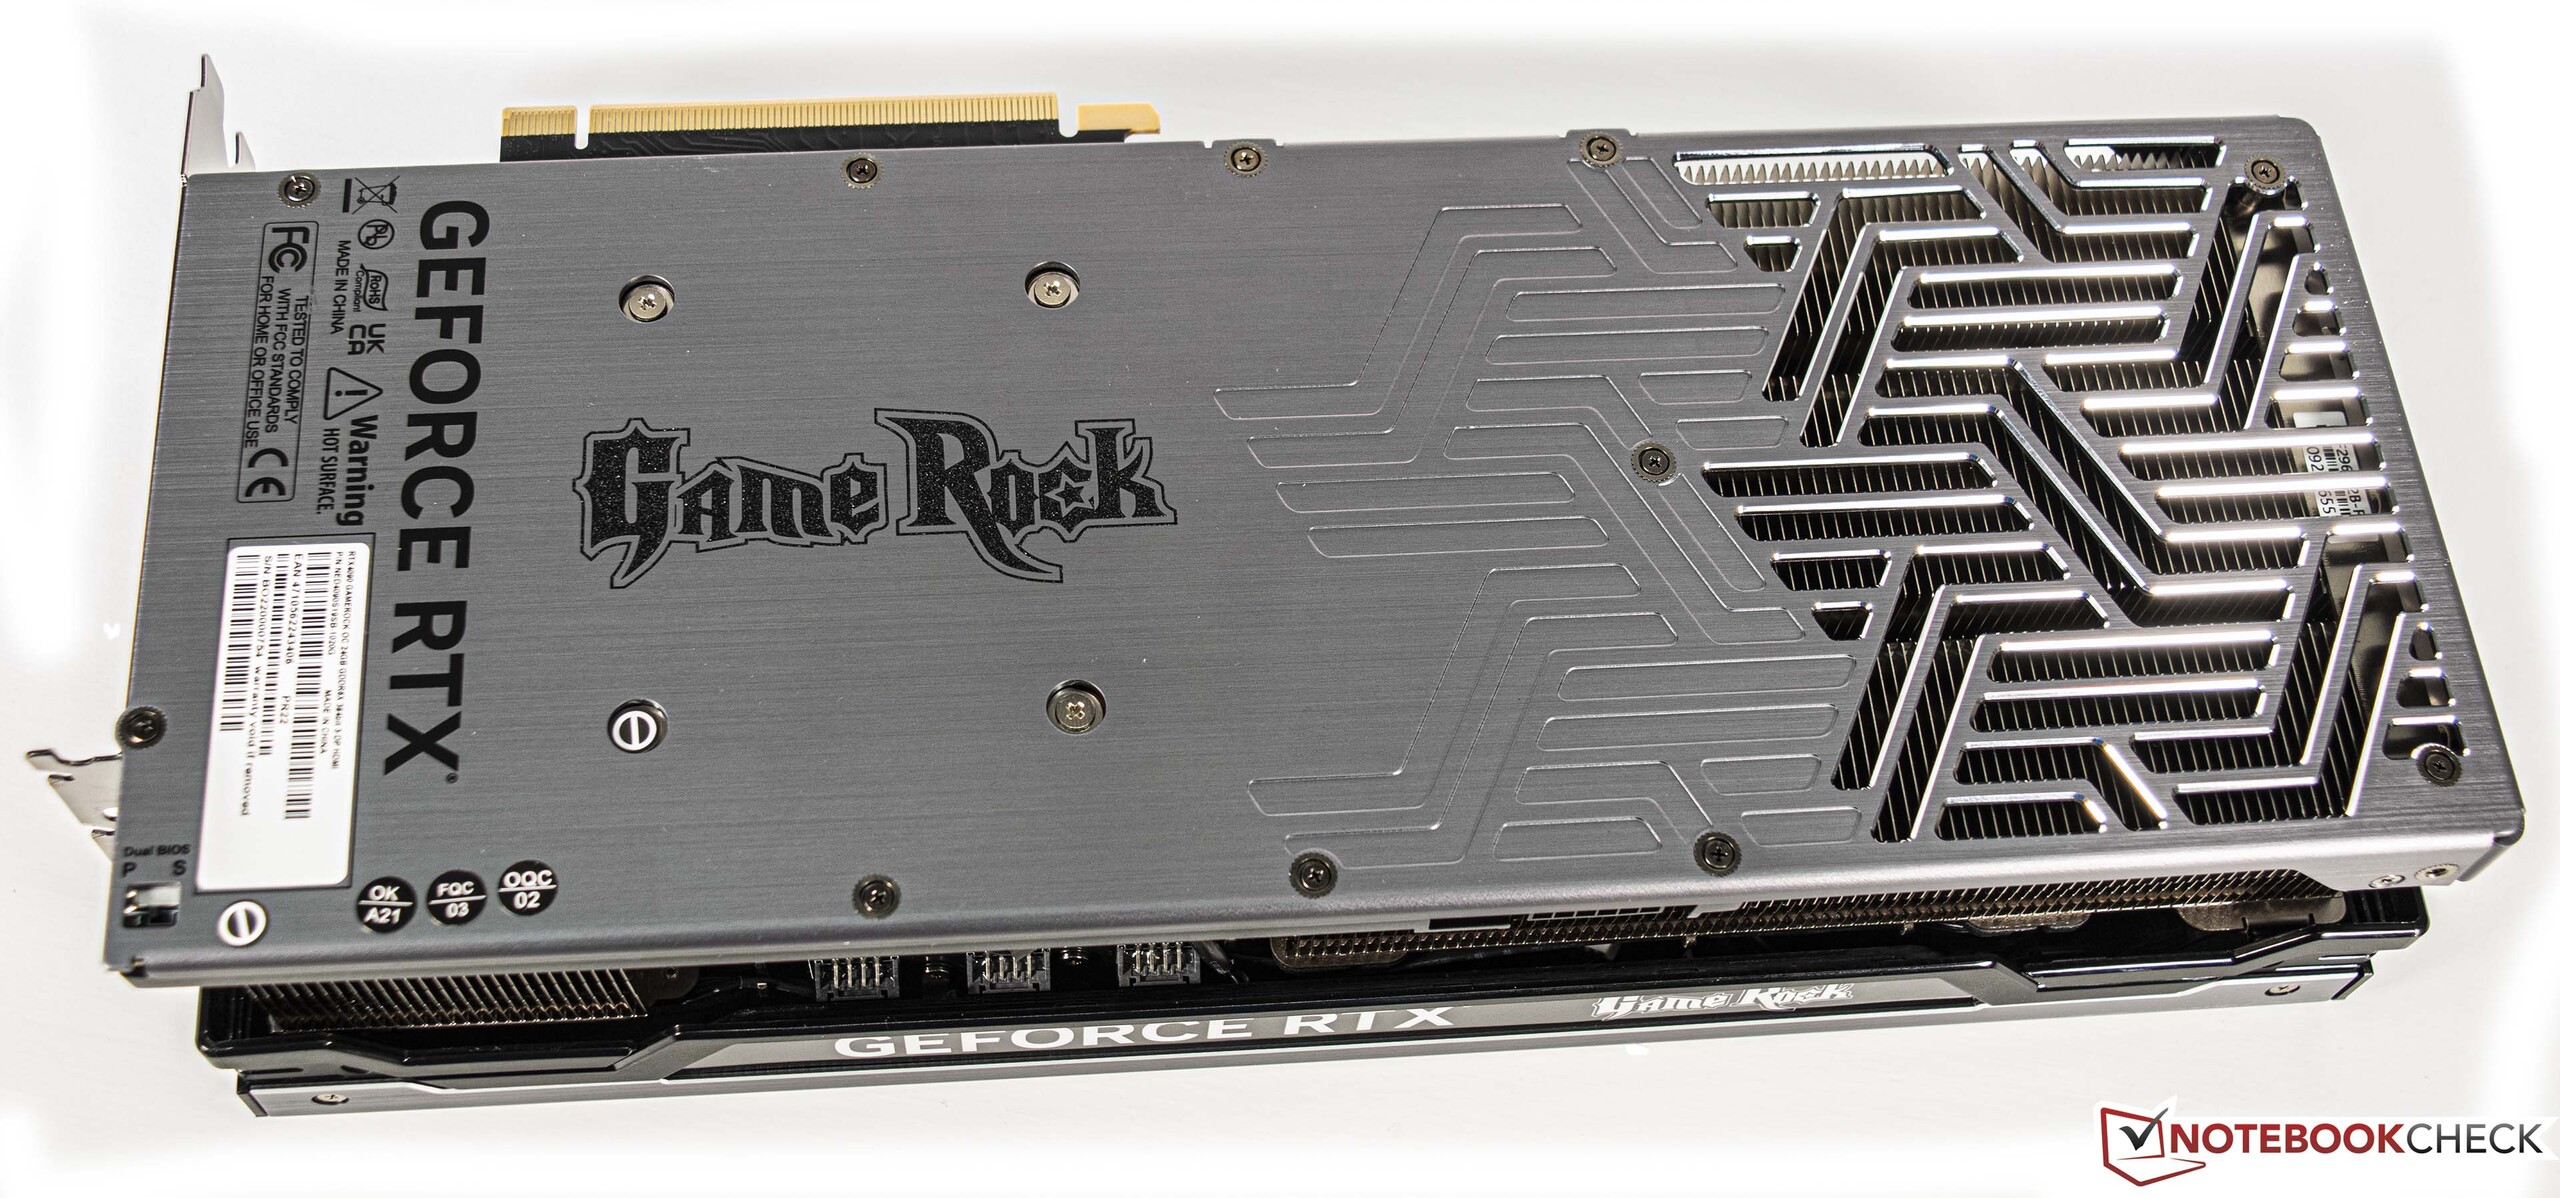
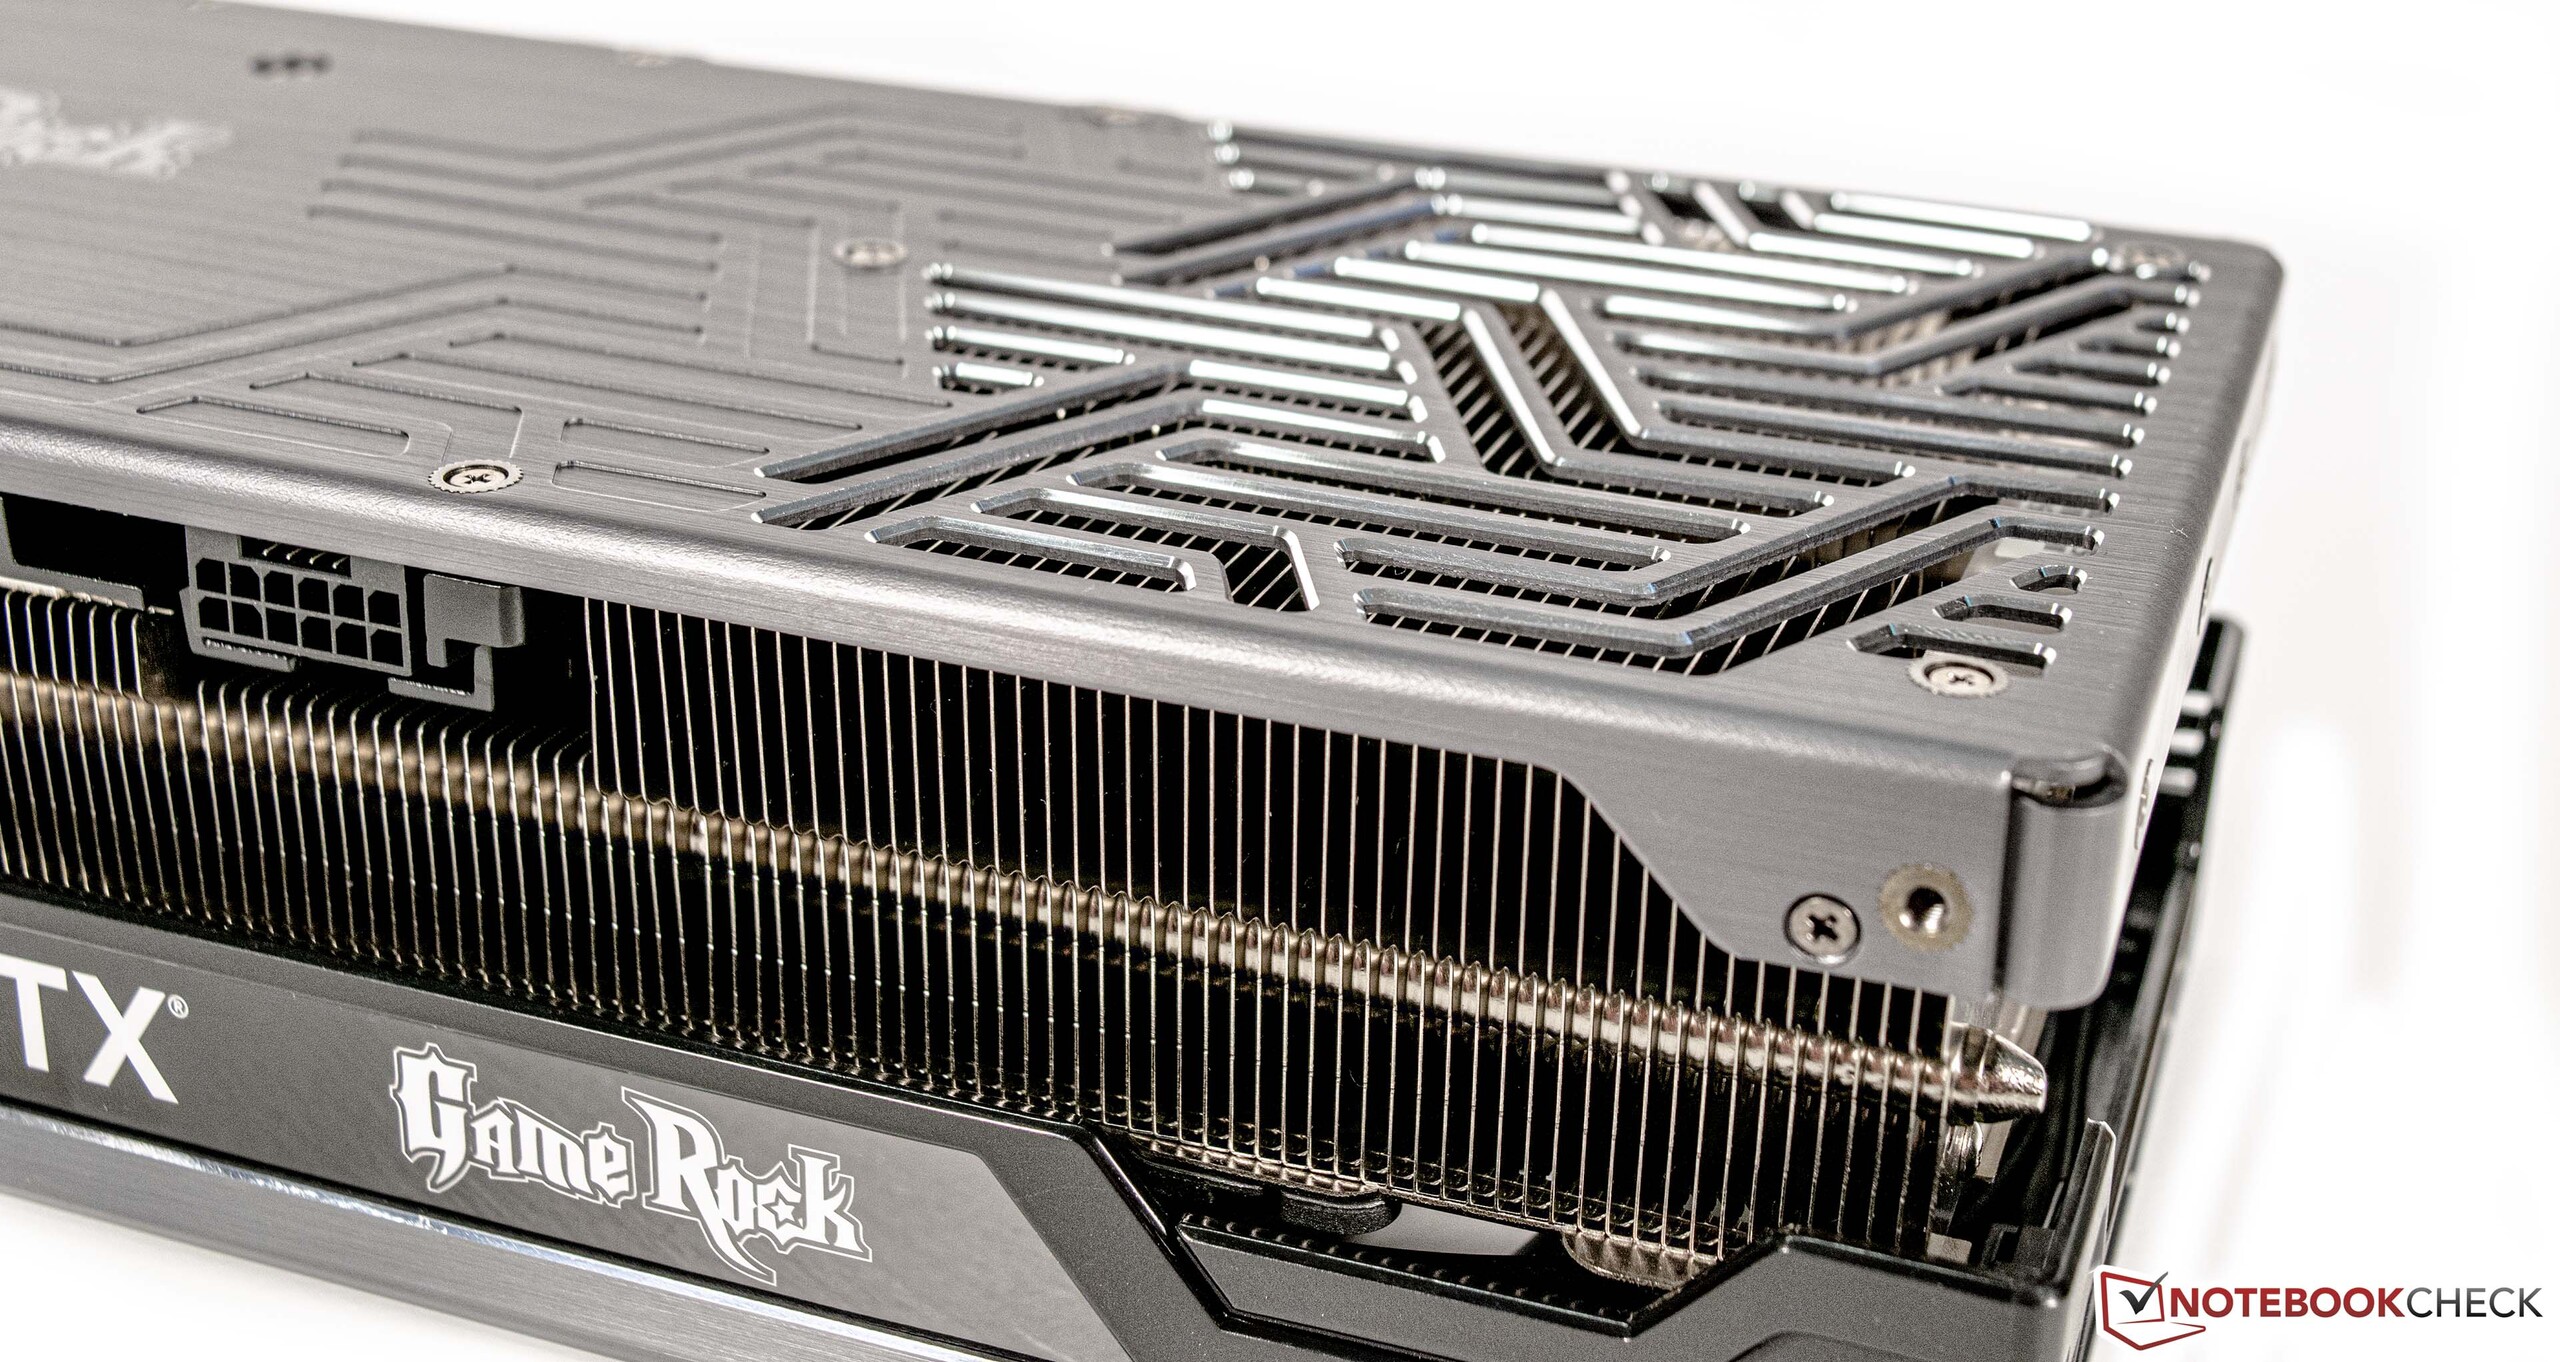
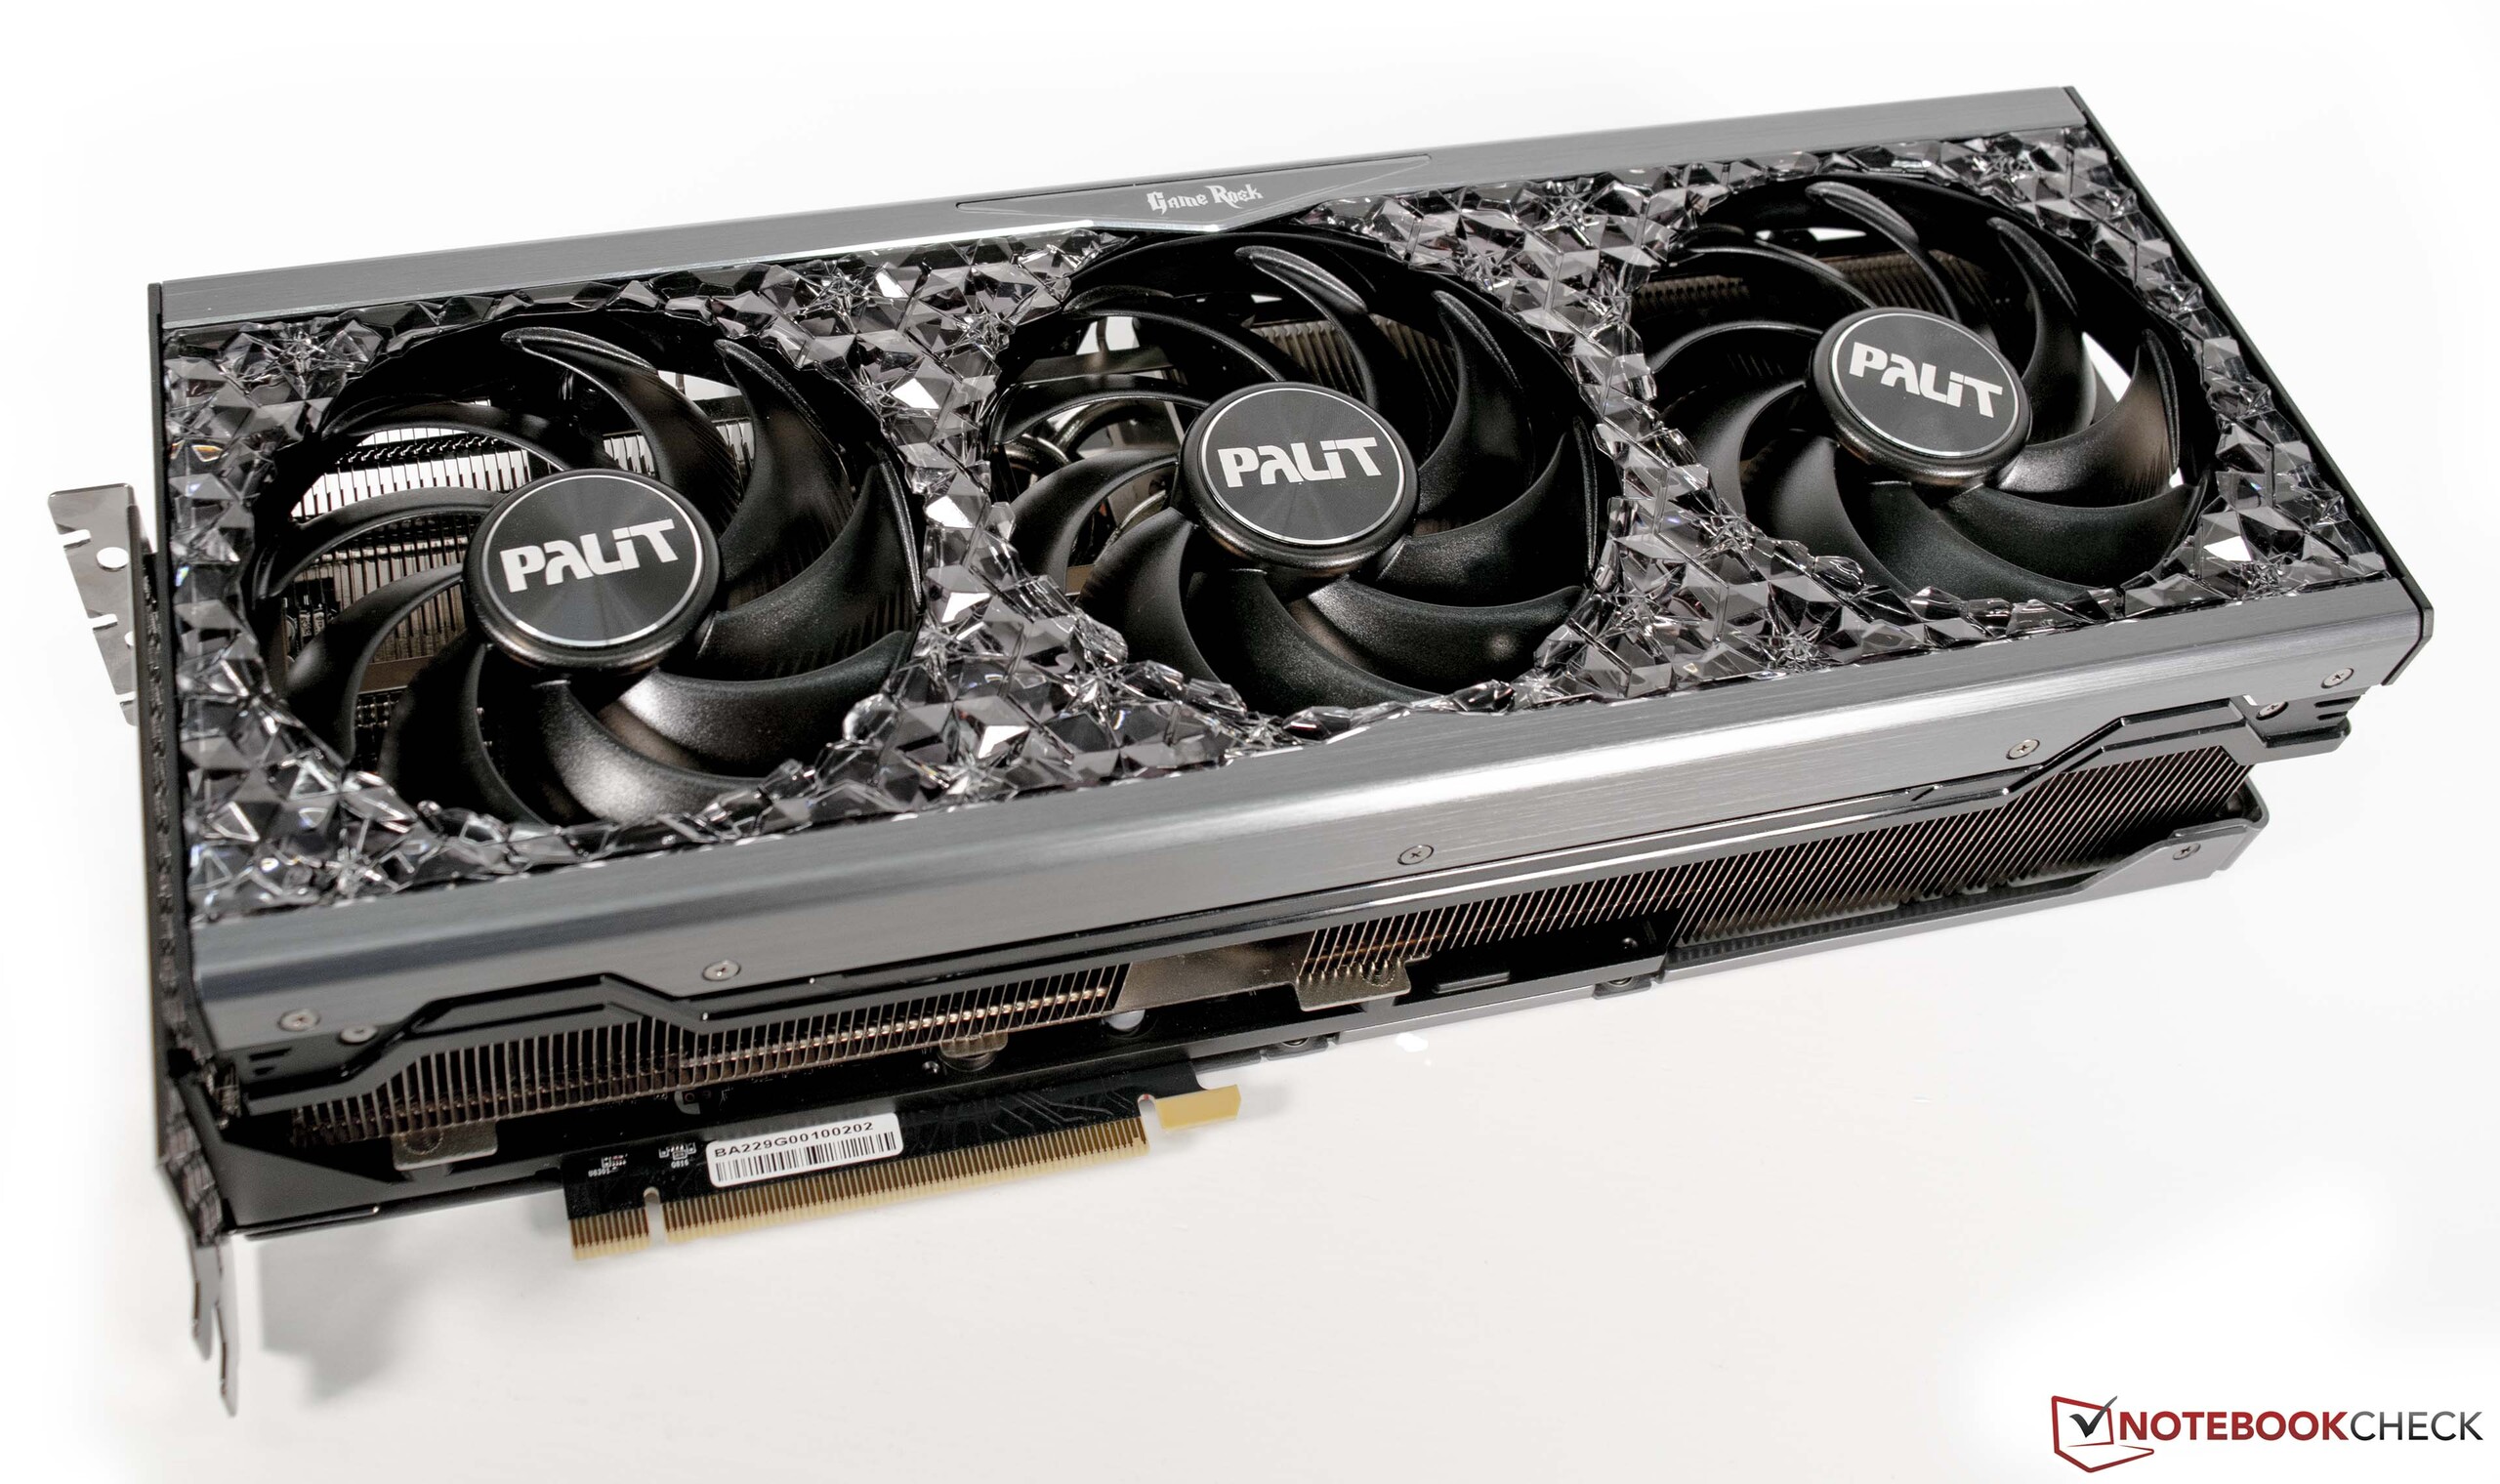
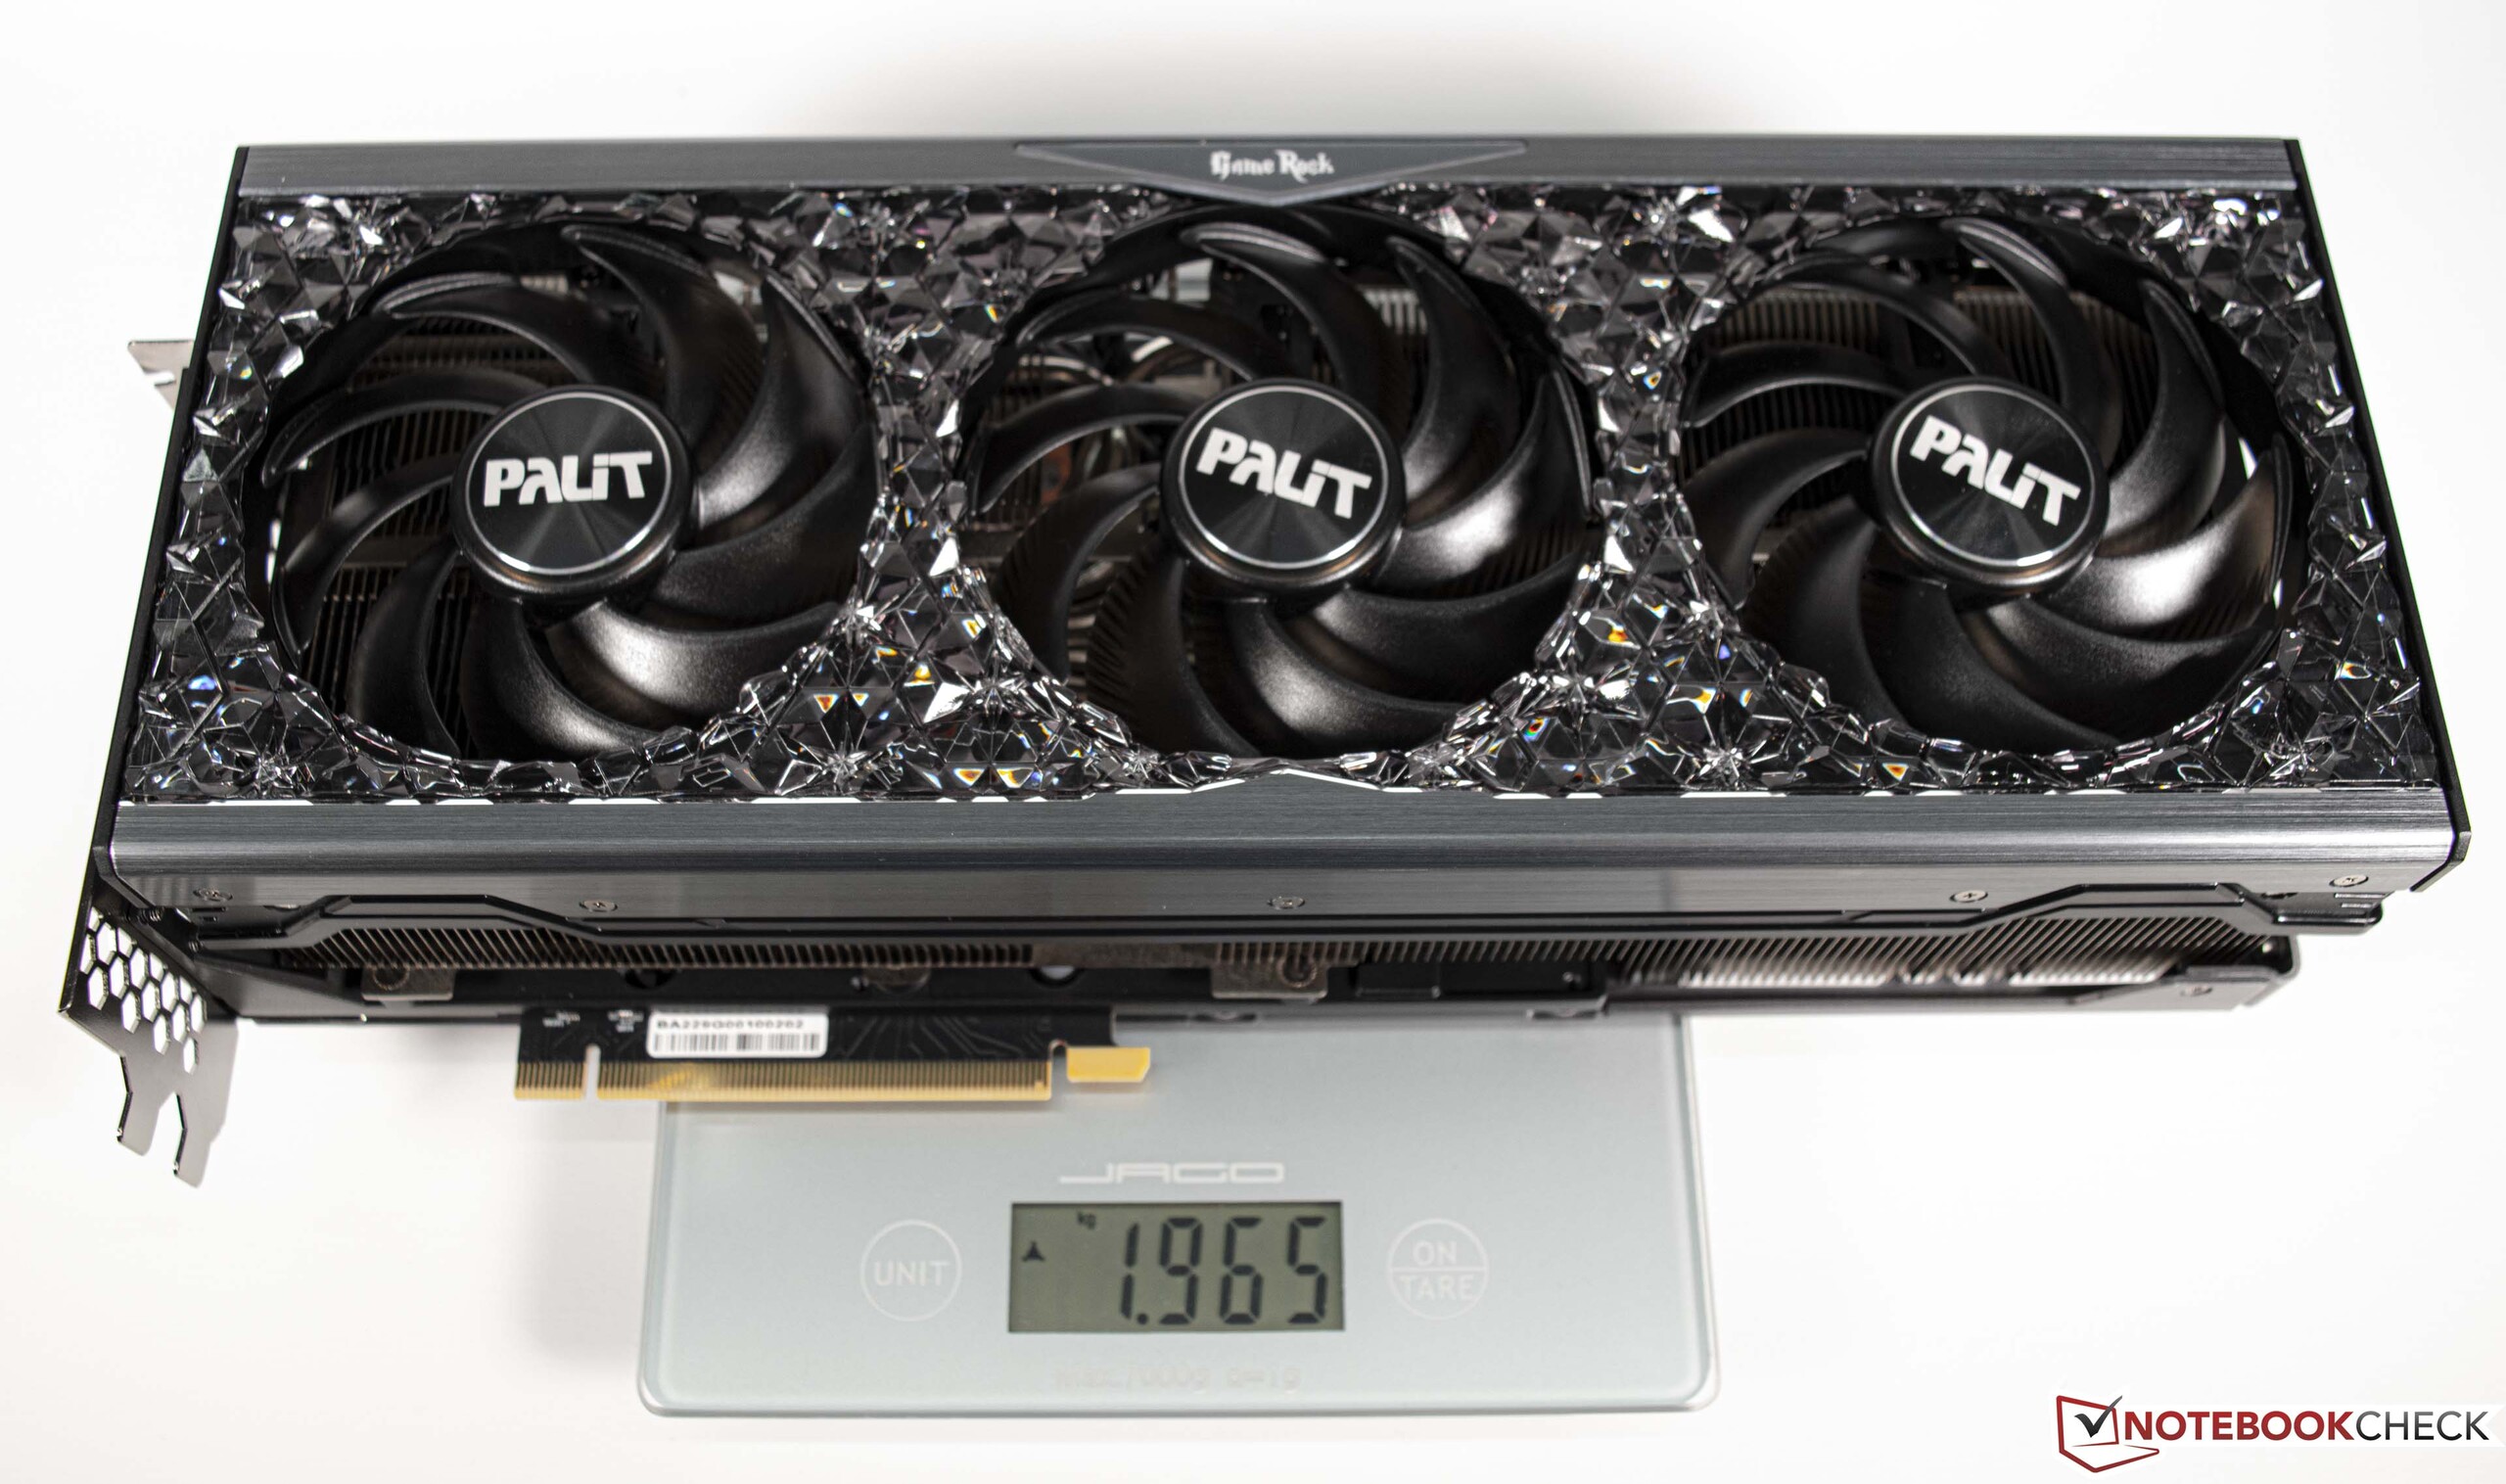
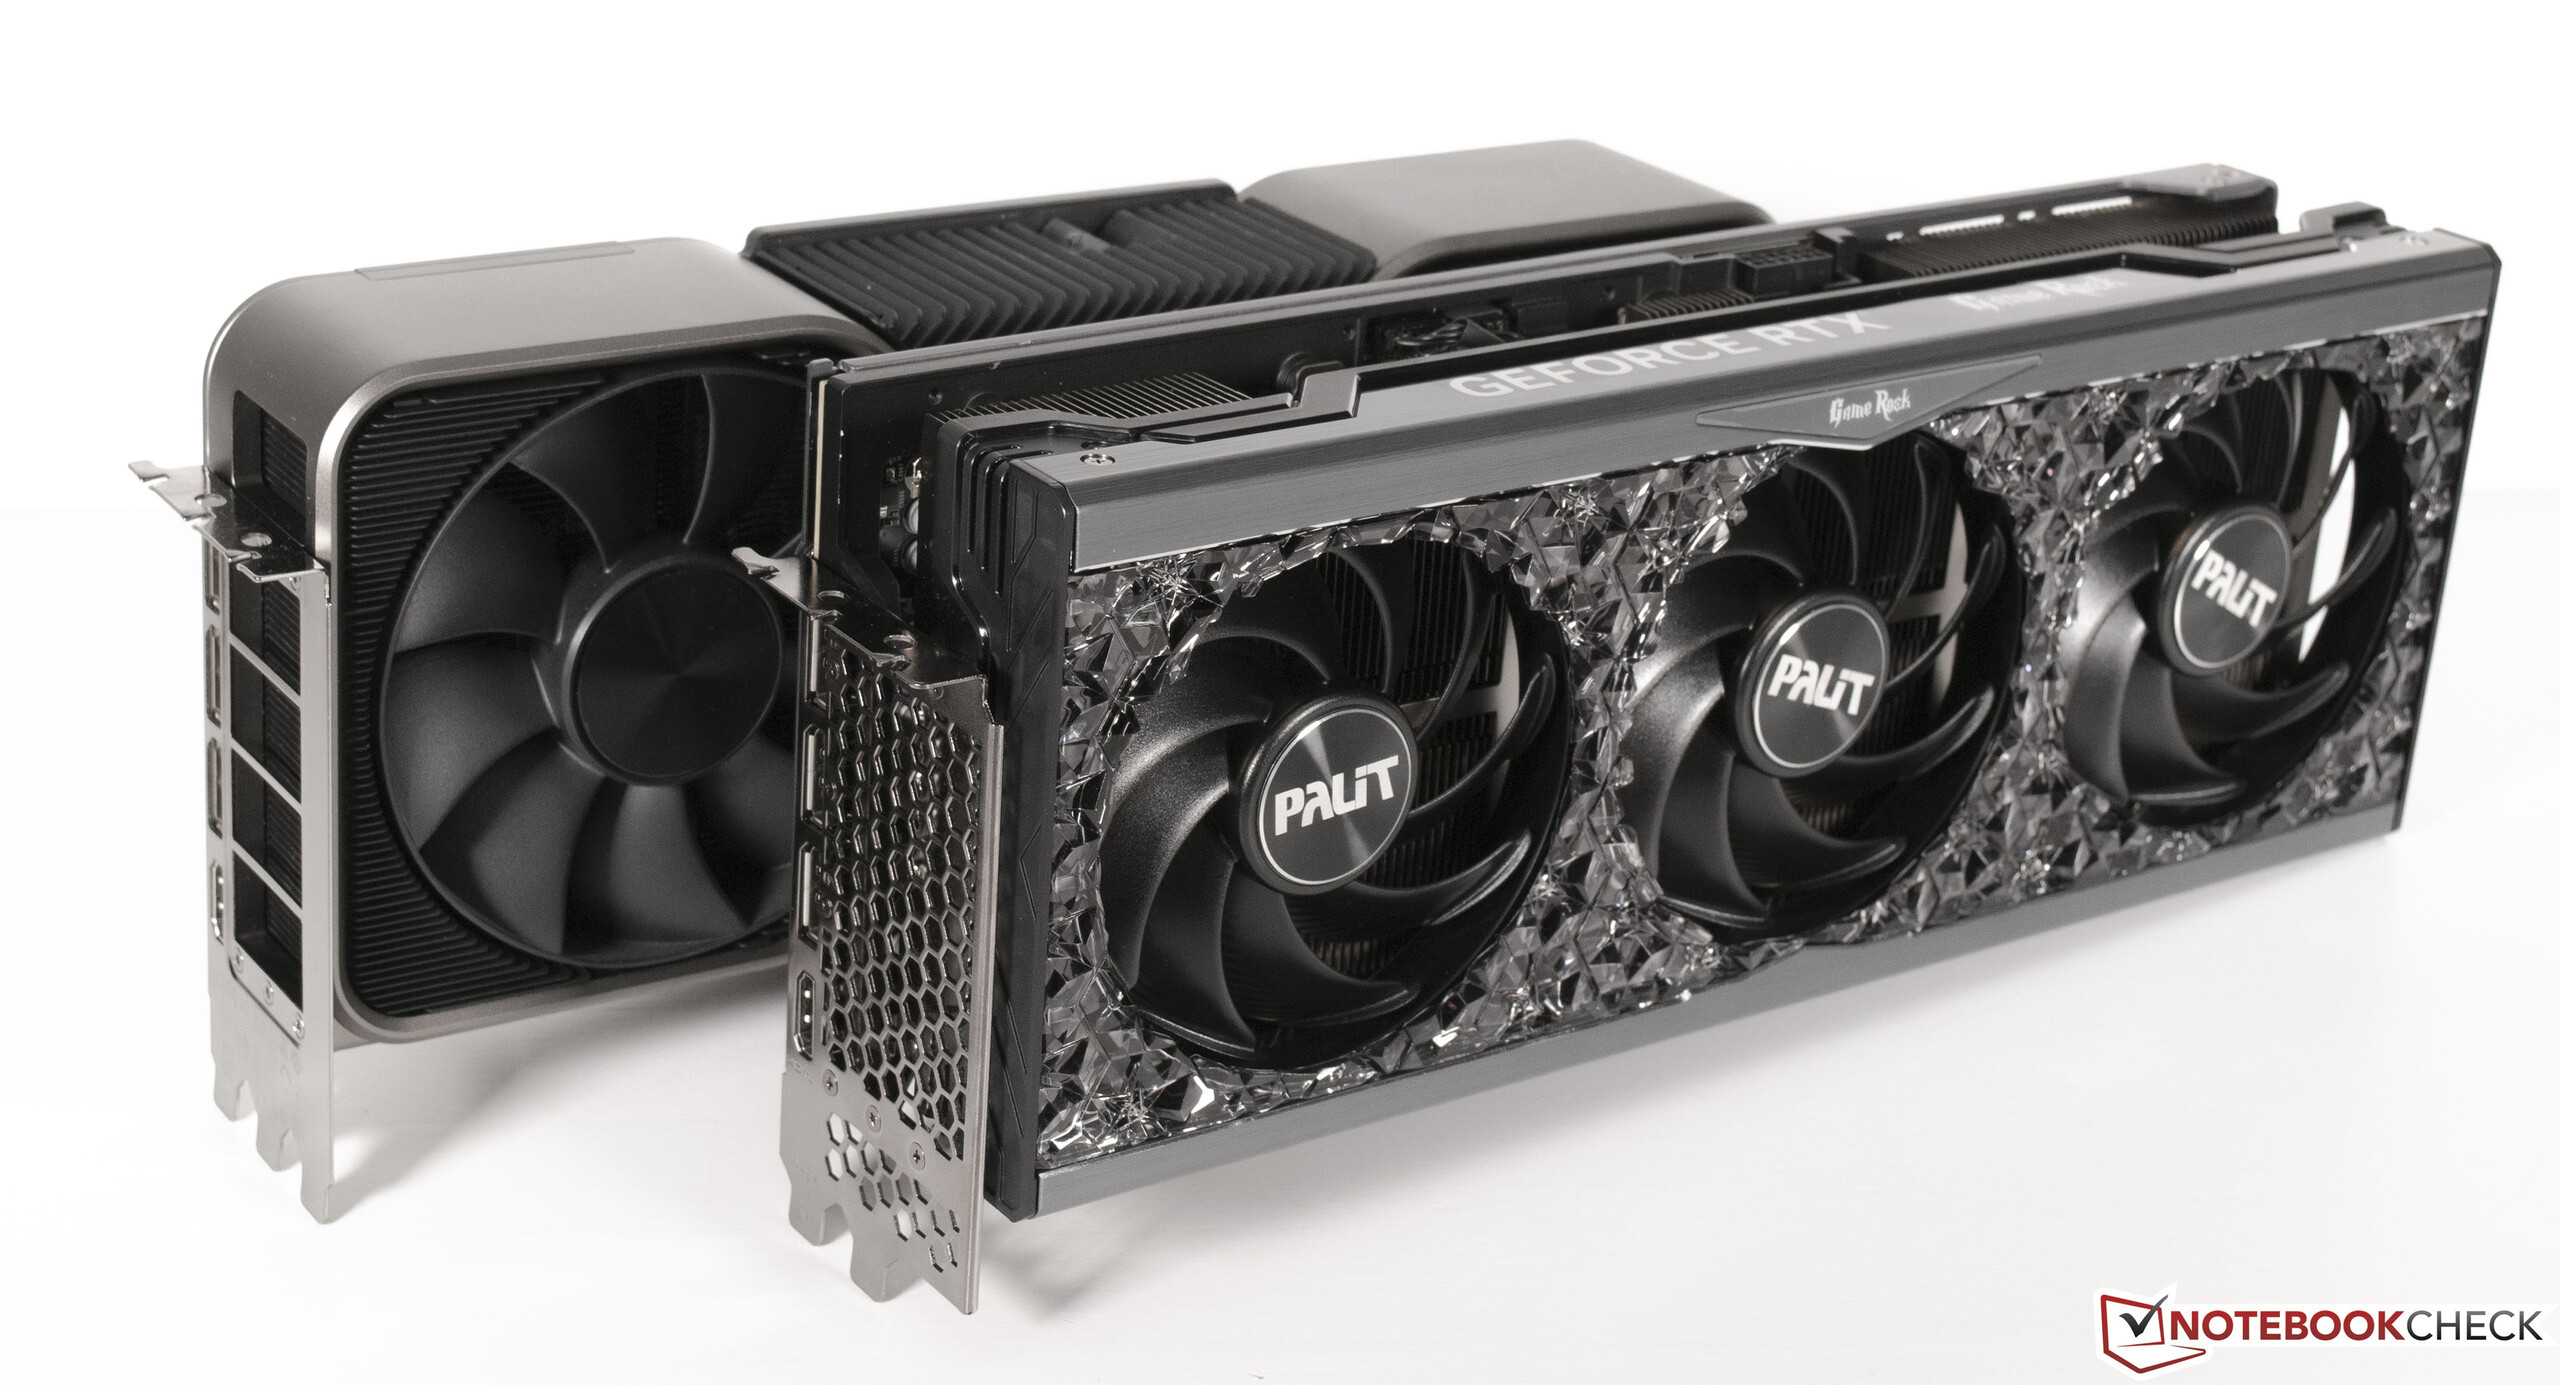
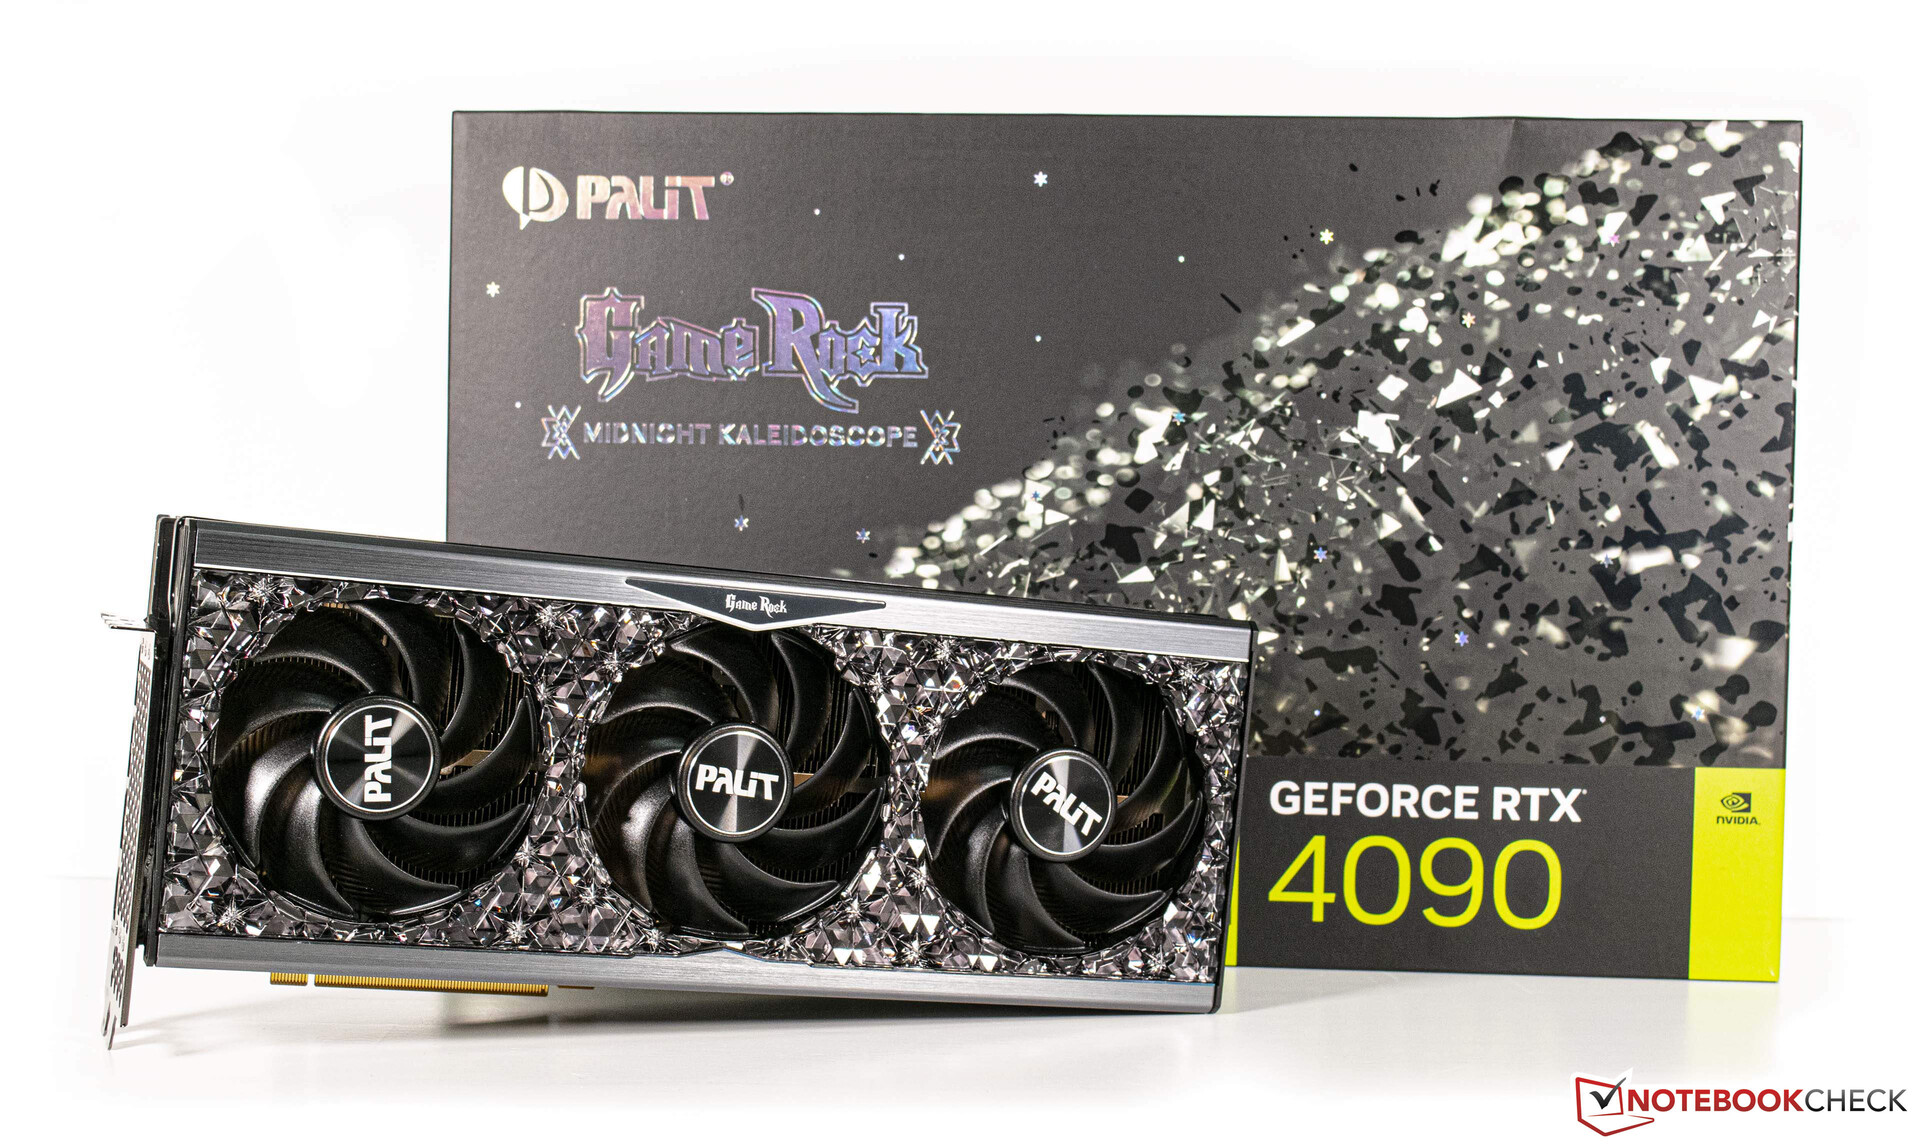
For this review, we are using the Palit GeForce RTX 4090 GameRock OC which, visually speaking, differs greatly from the Founders Edition. The 3.5 slot cooling design requires considerable space inside the case and is fitted with three 90 millimetre fans. The rumored 600 watt power dissipation of the new high end graphic cards is the reason for this powerful cooling construction and can be found throughout the entire GeForce RTX 4090 series, independent of the manufacturer. It has something positive going for it as neither chip nor VRAM temperature problems are anywhere to be seen - that much we can already reveal. Ultimately, the graphics card power draw is 450 watts.
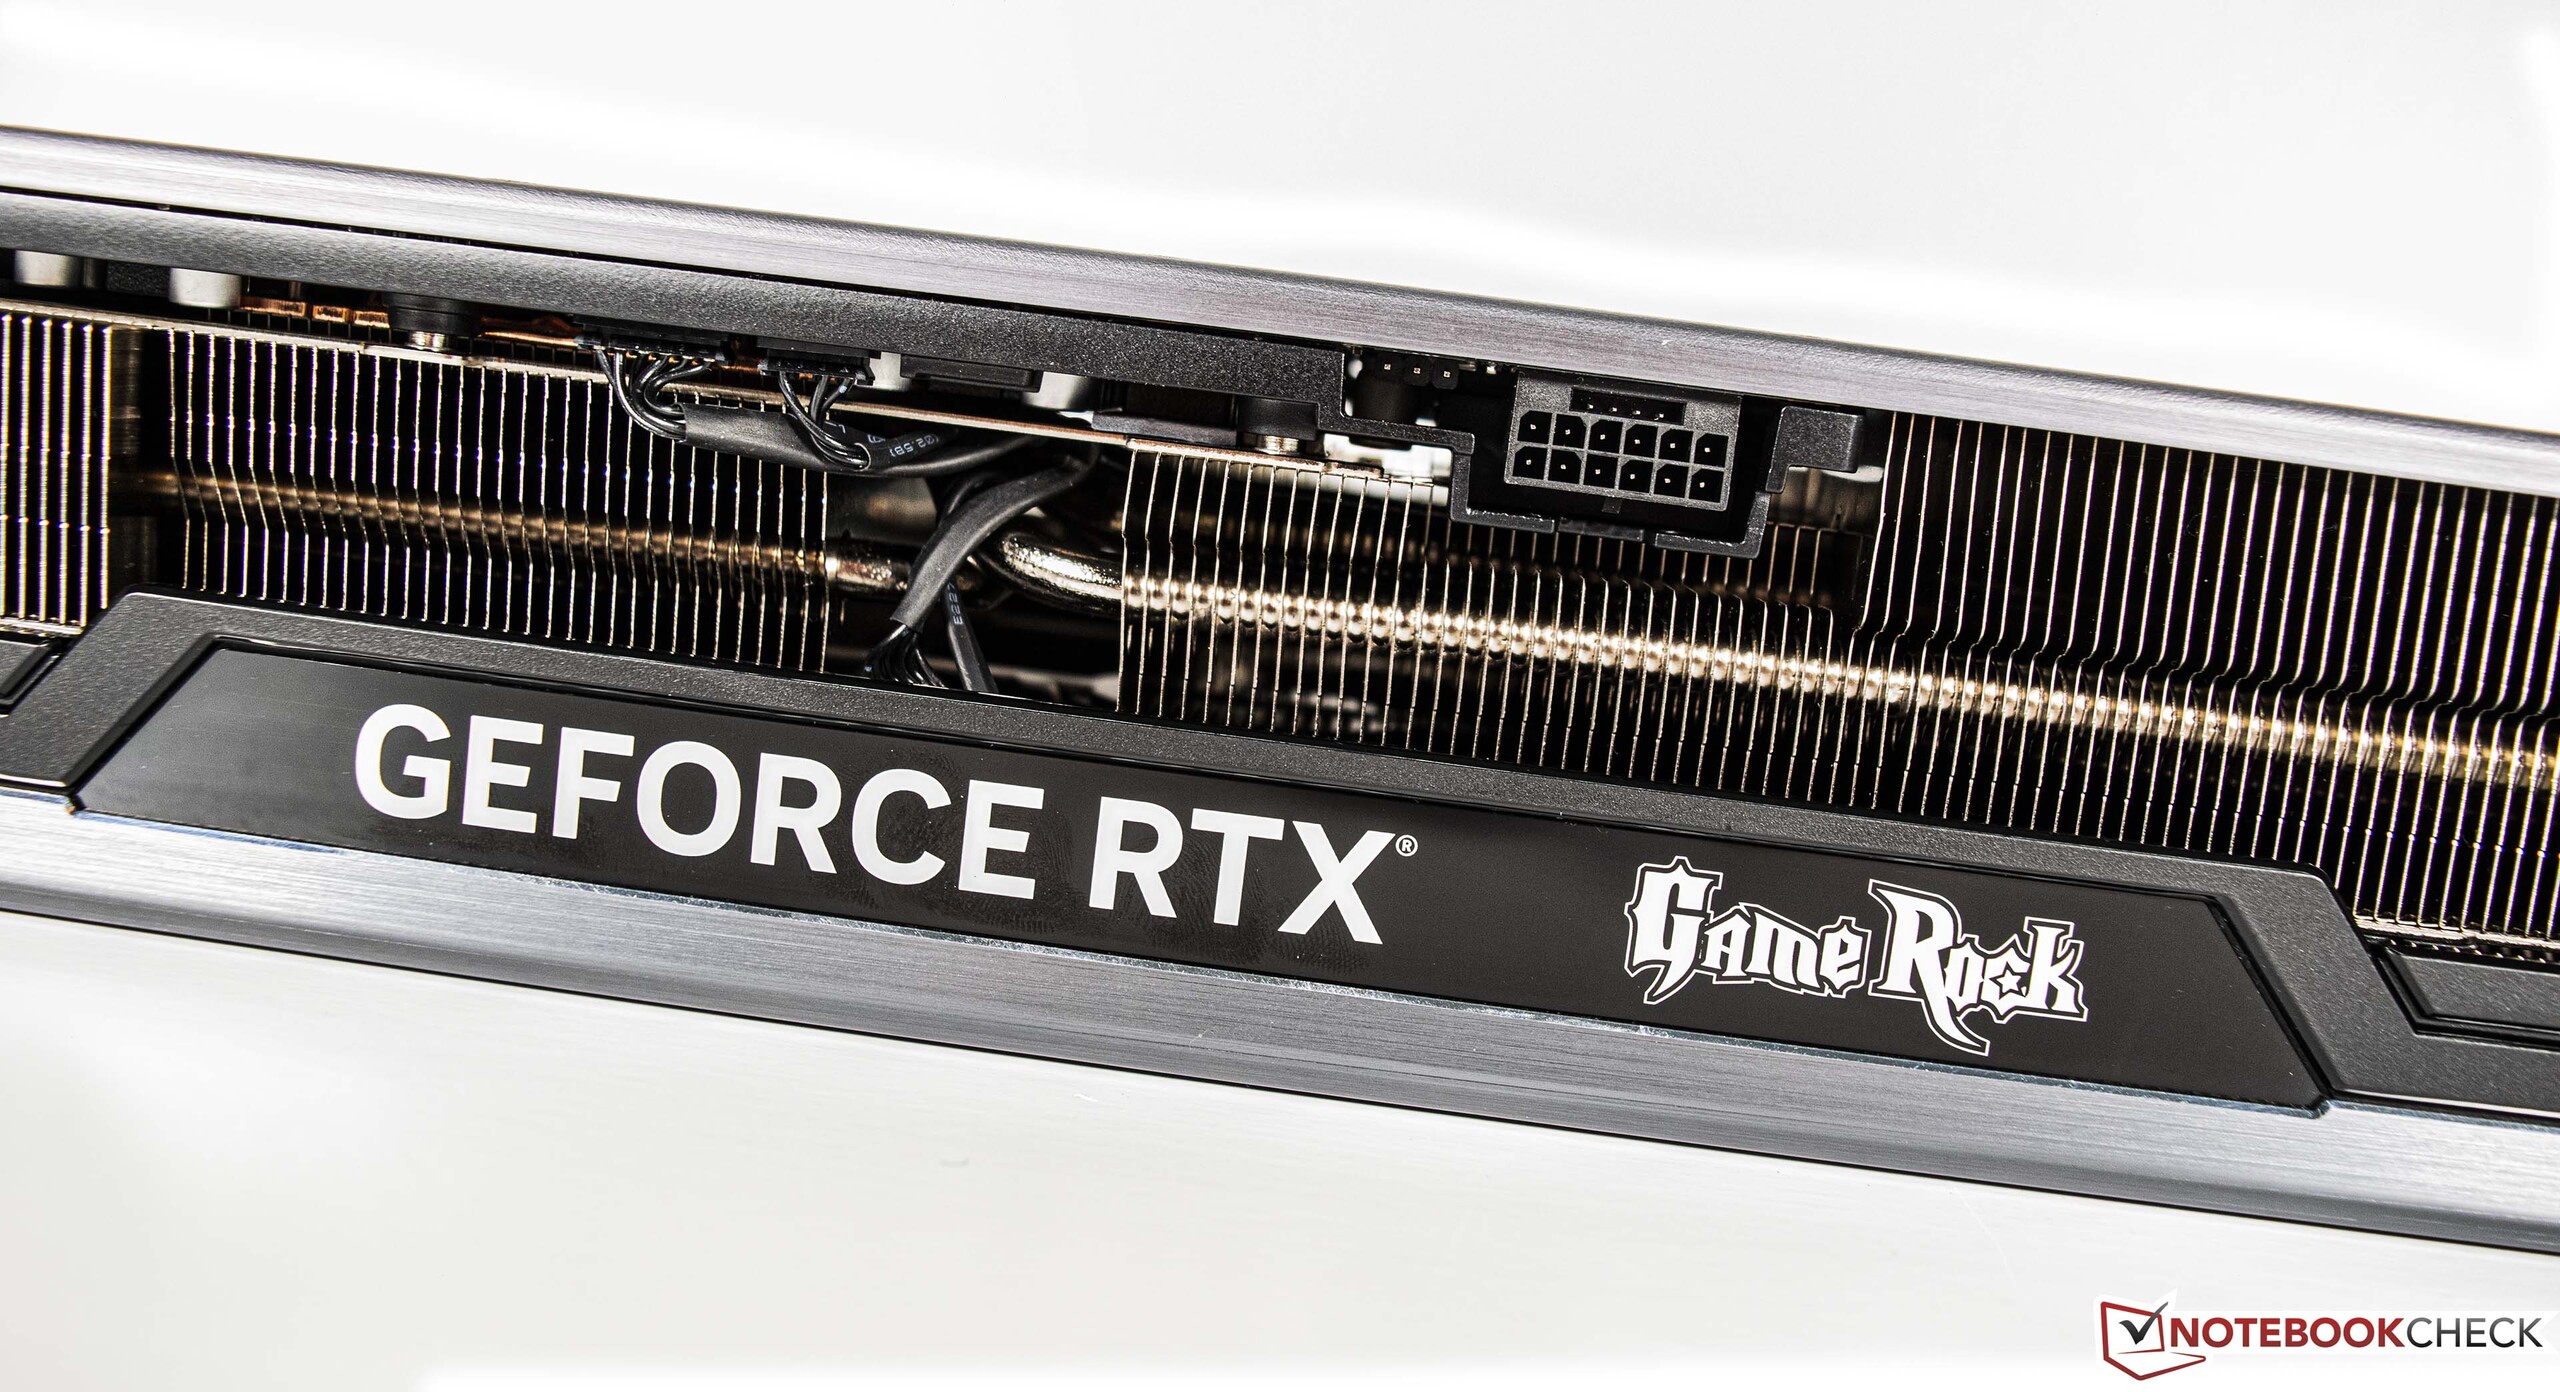
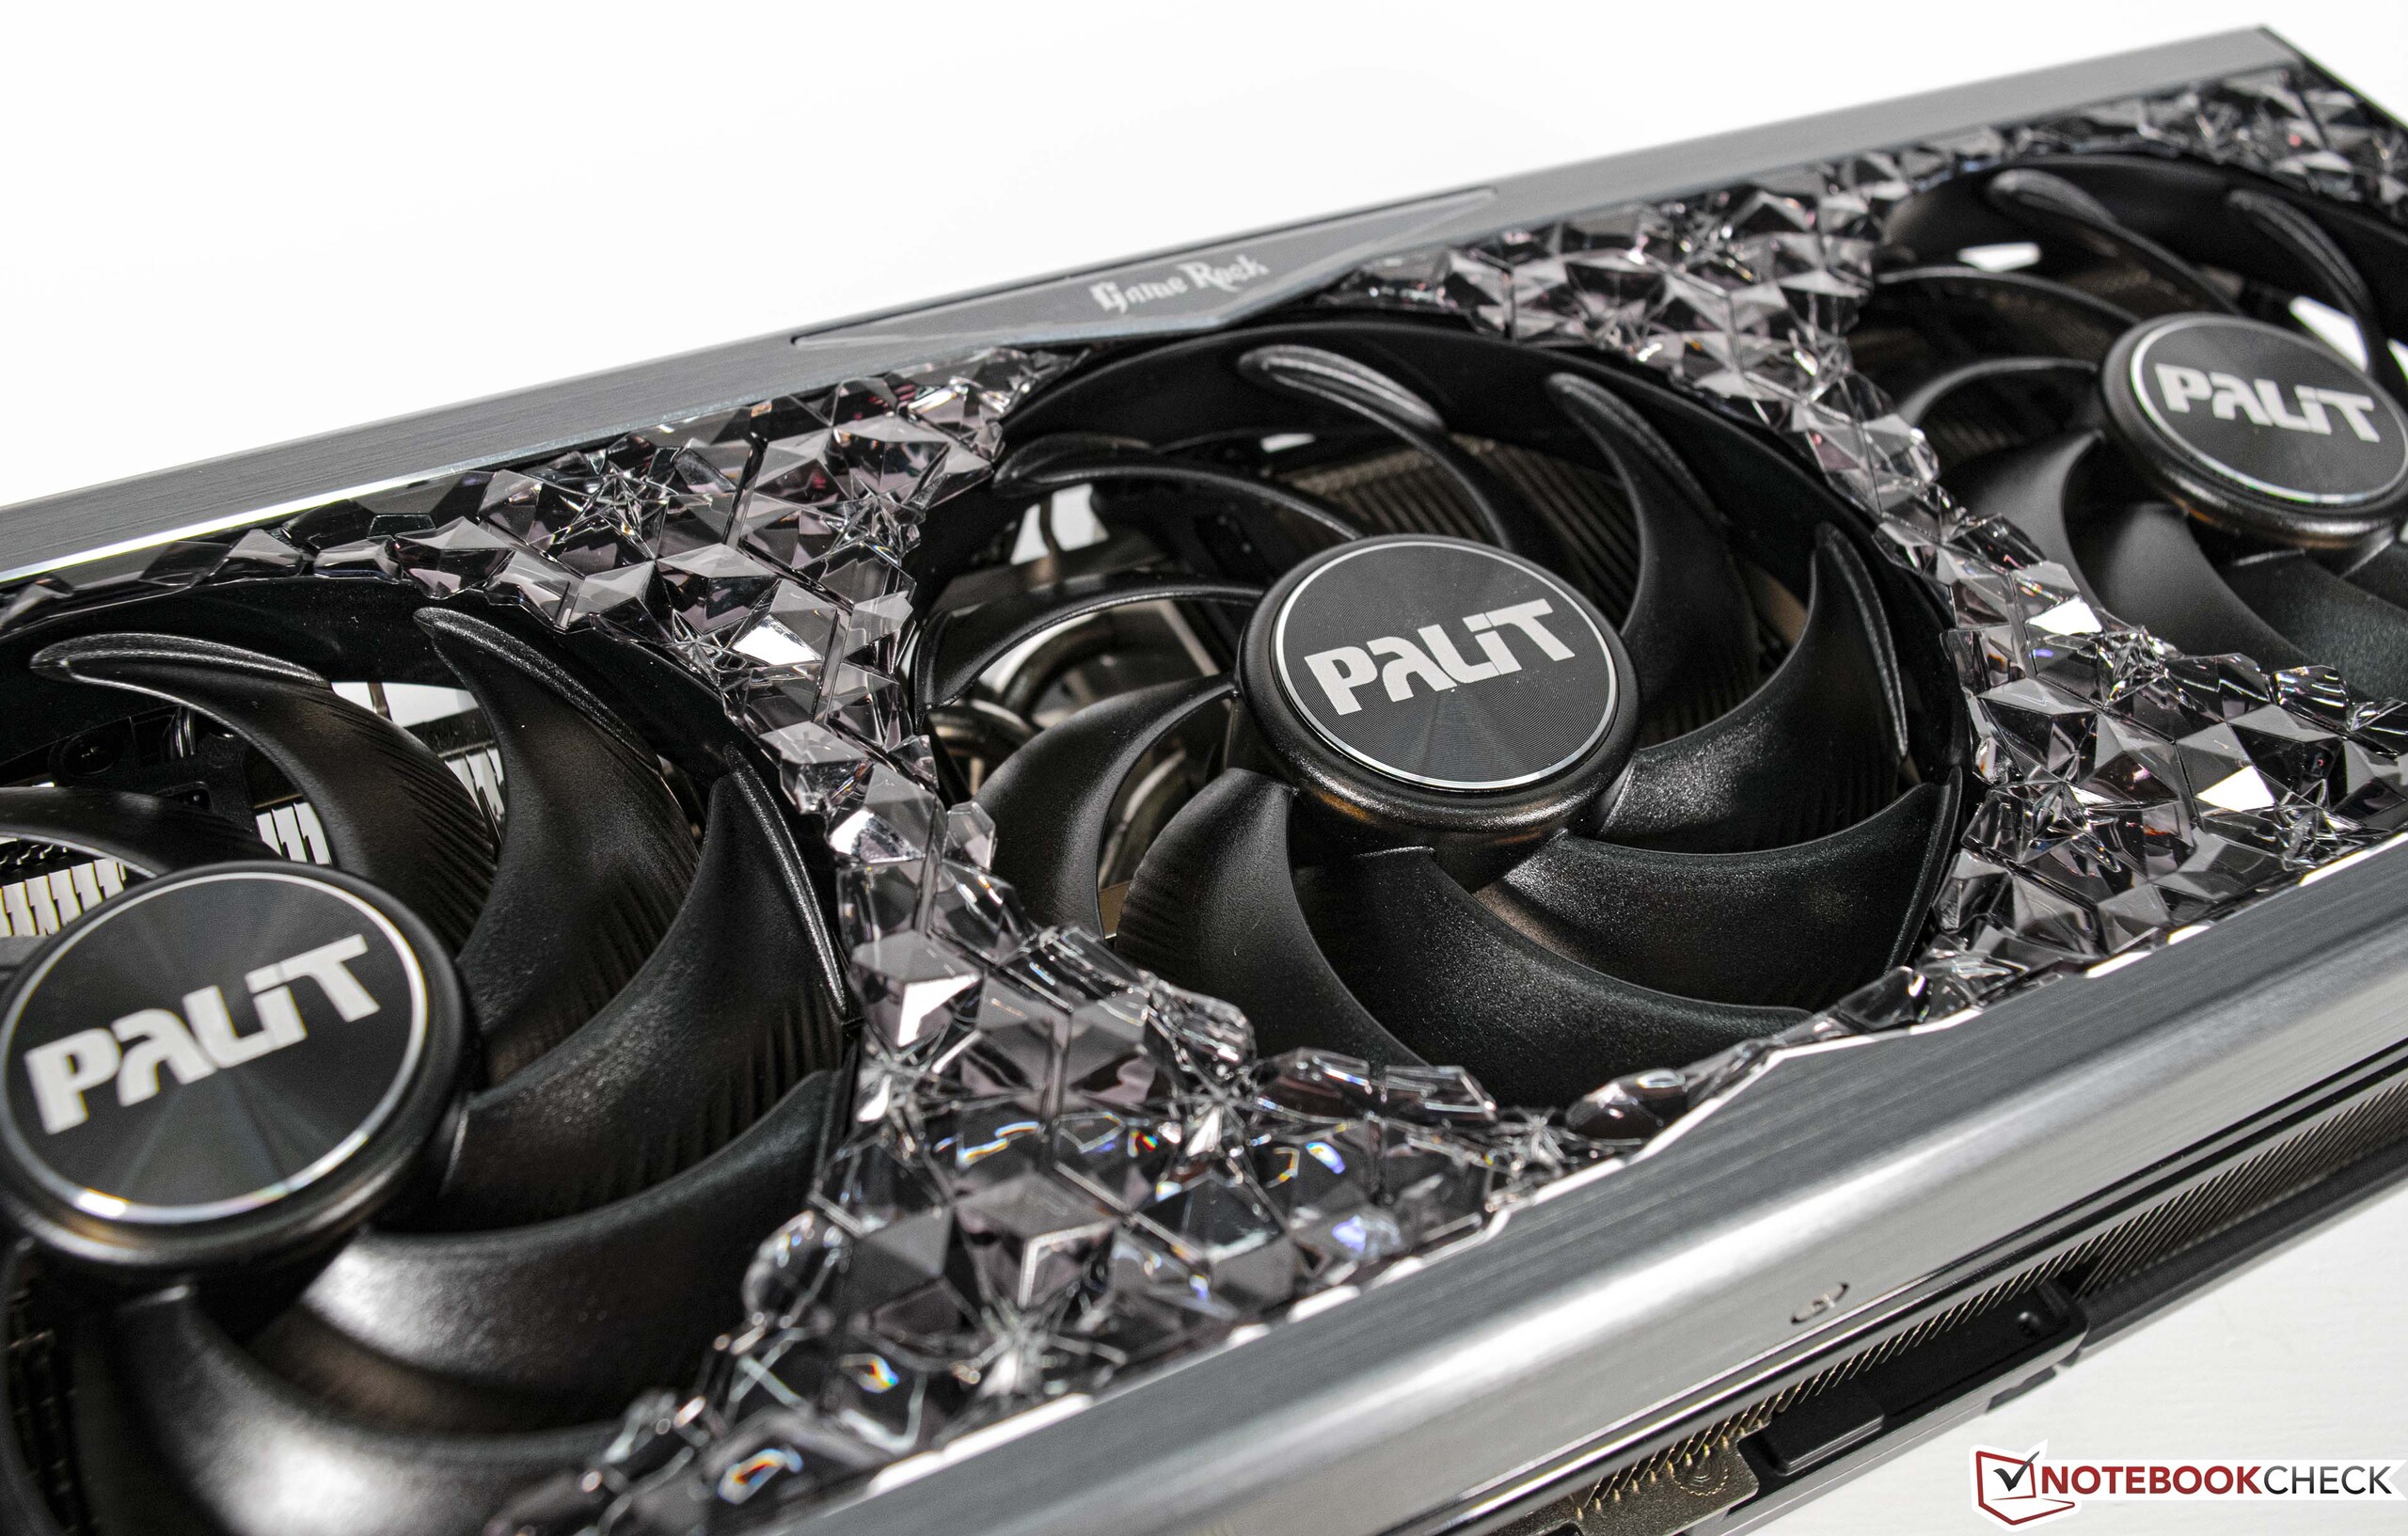
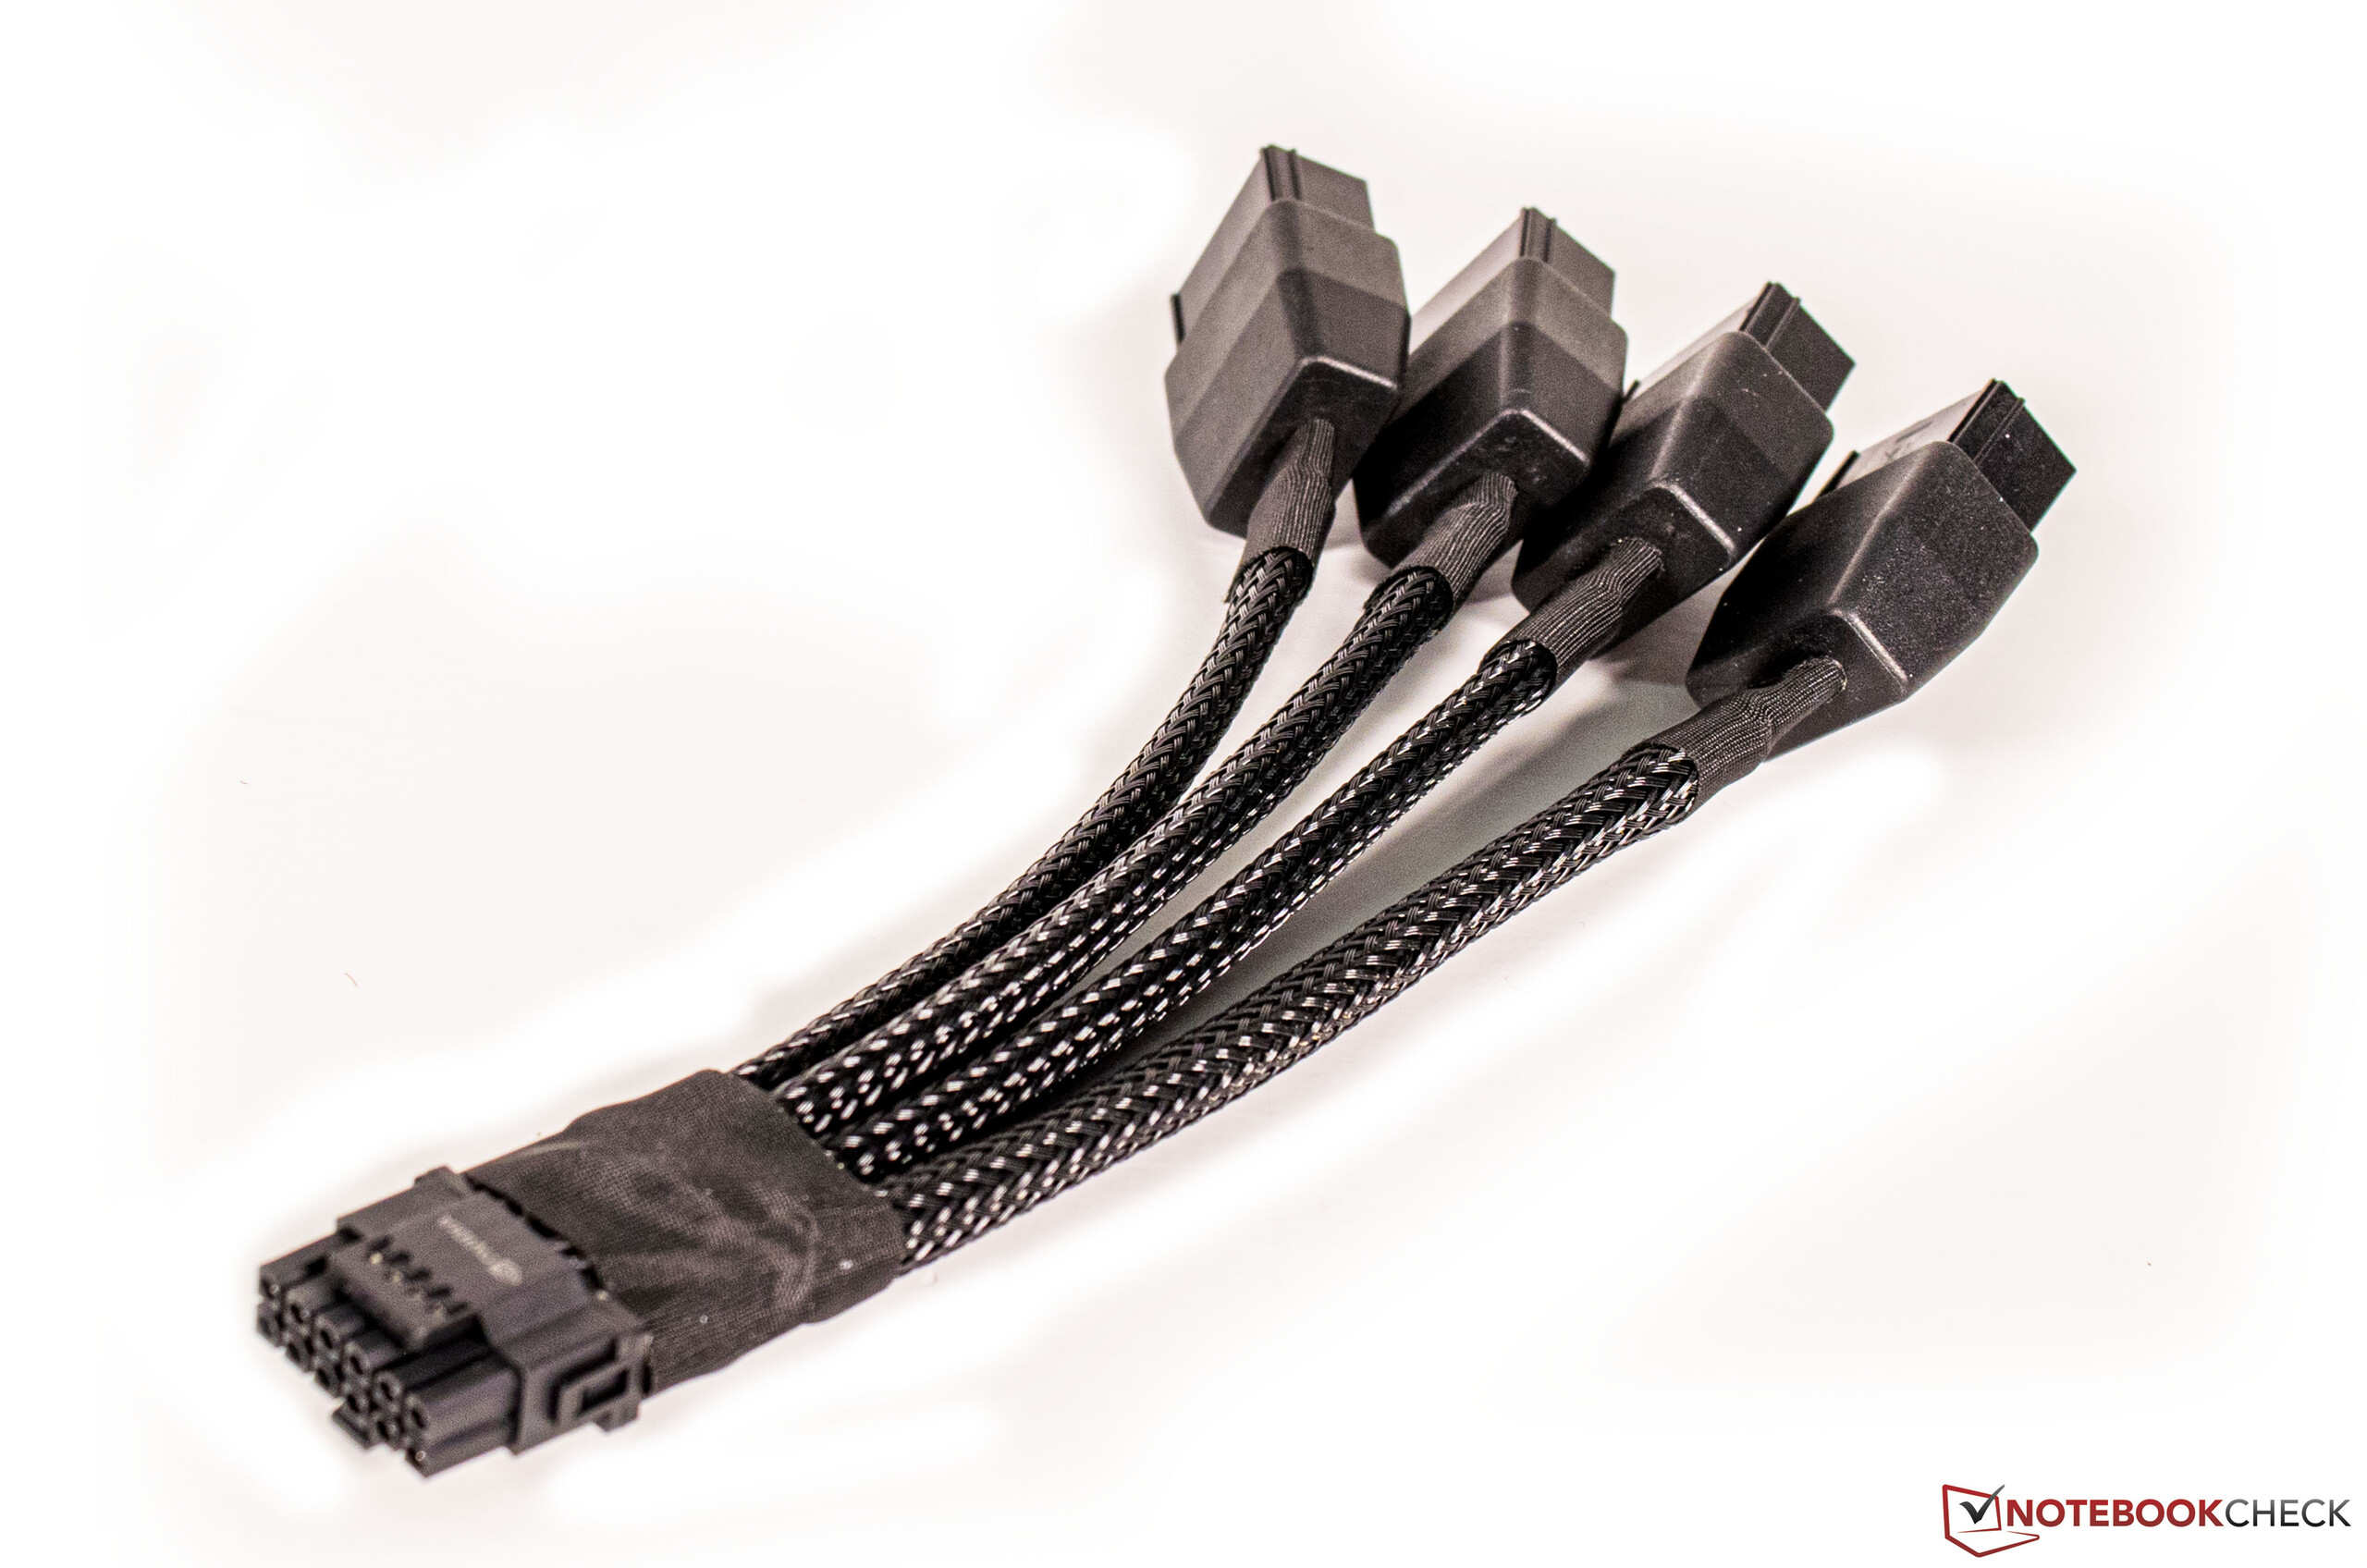
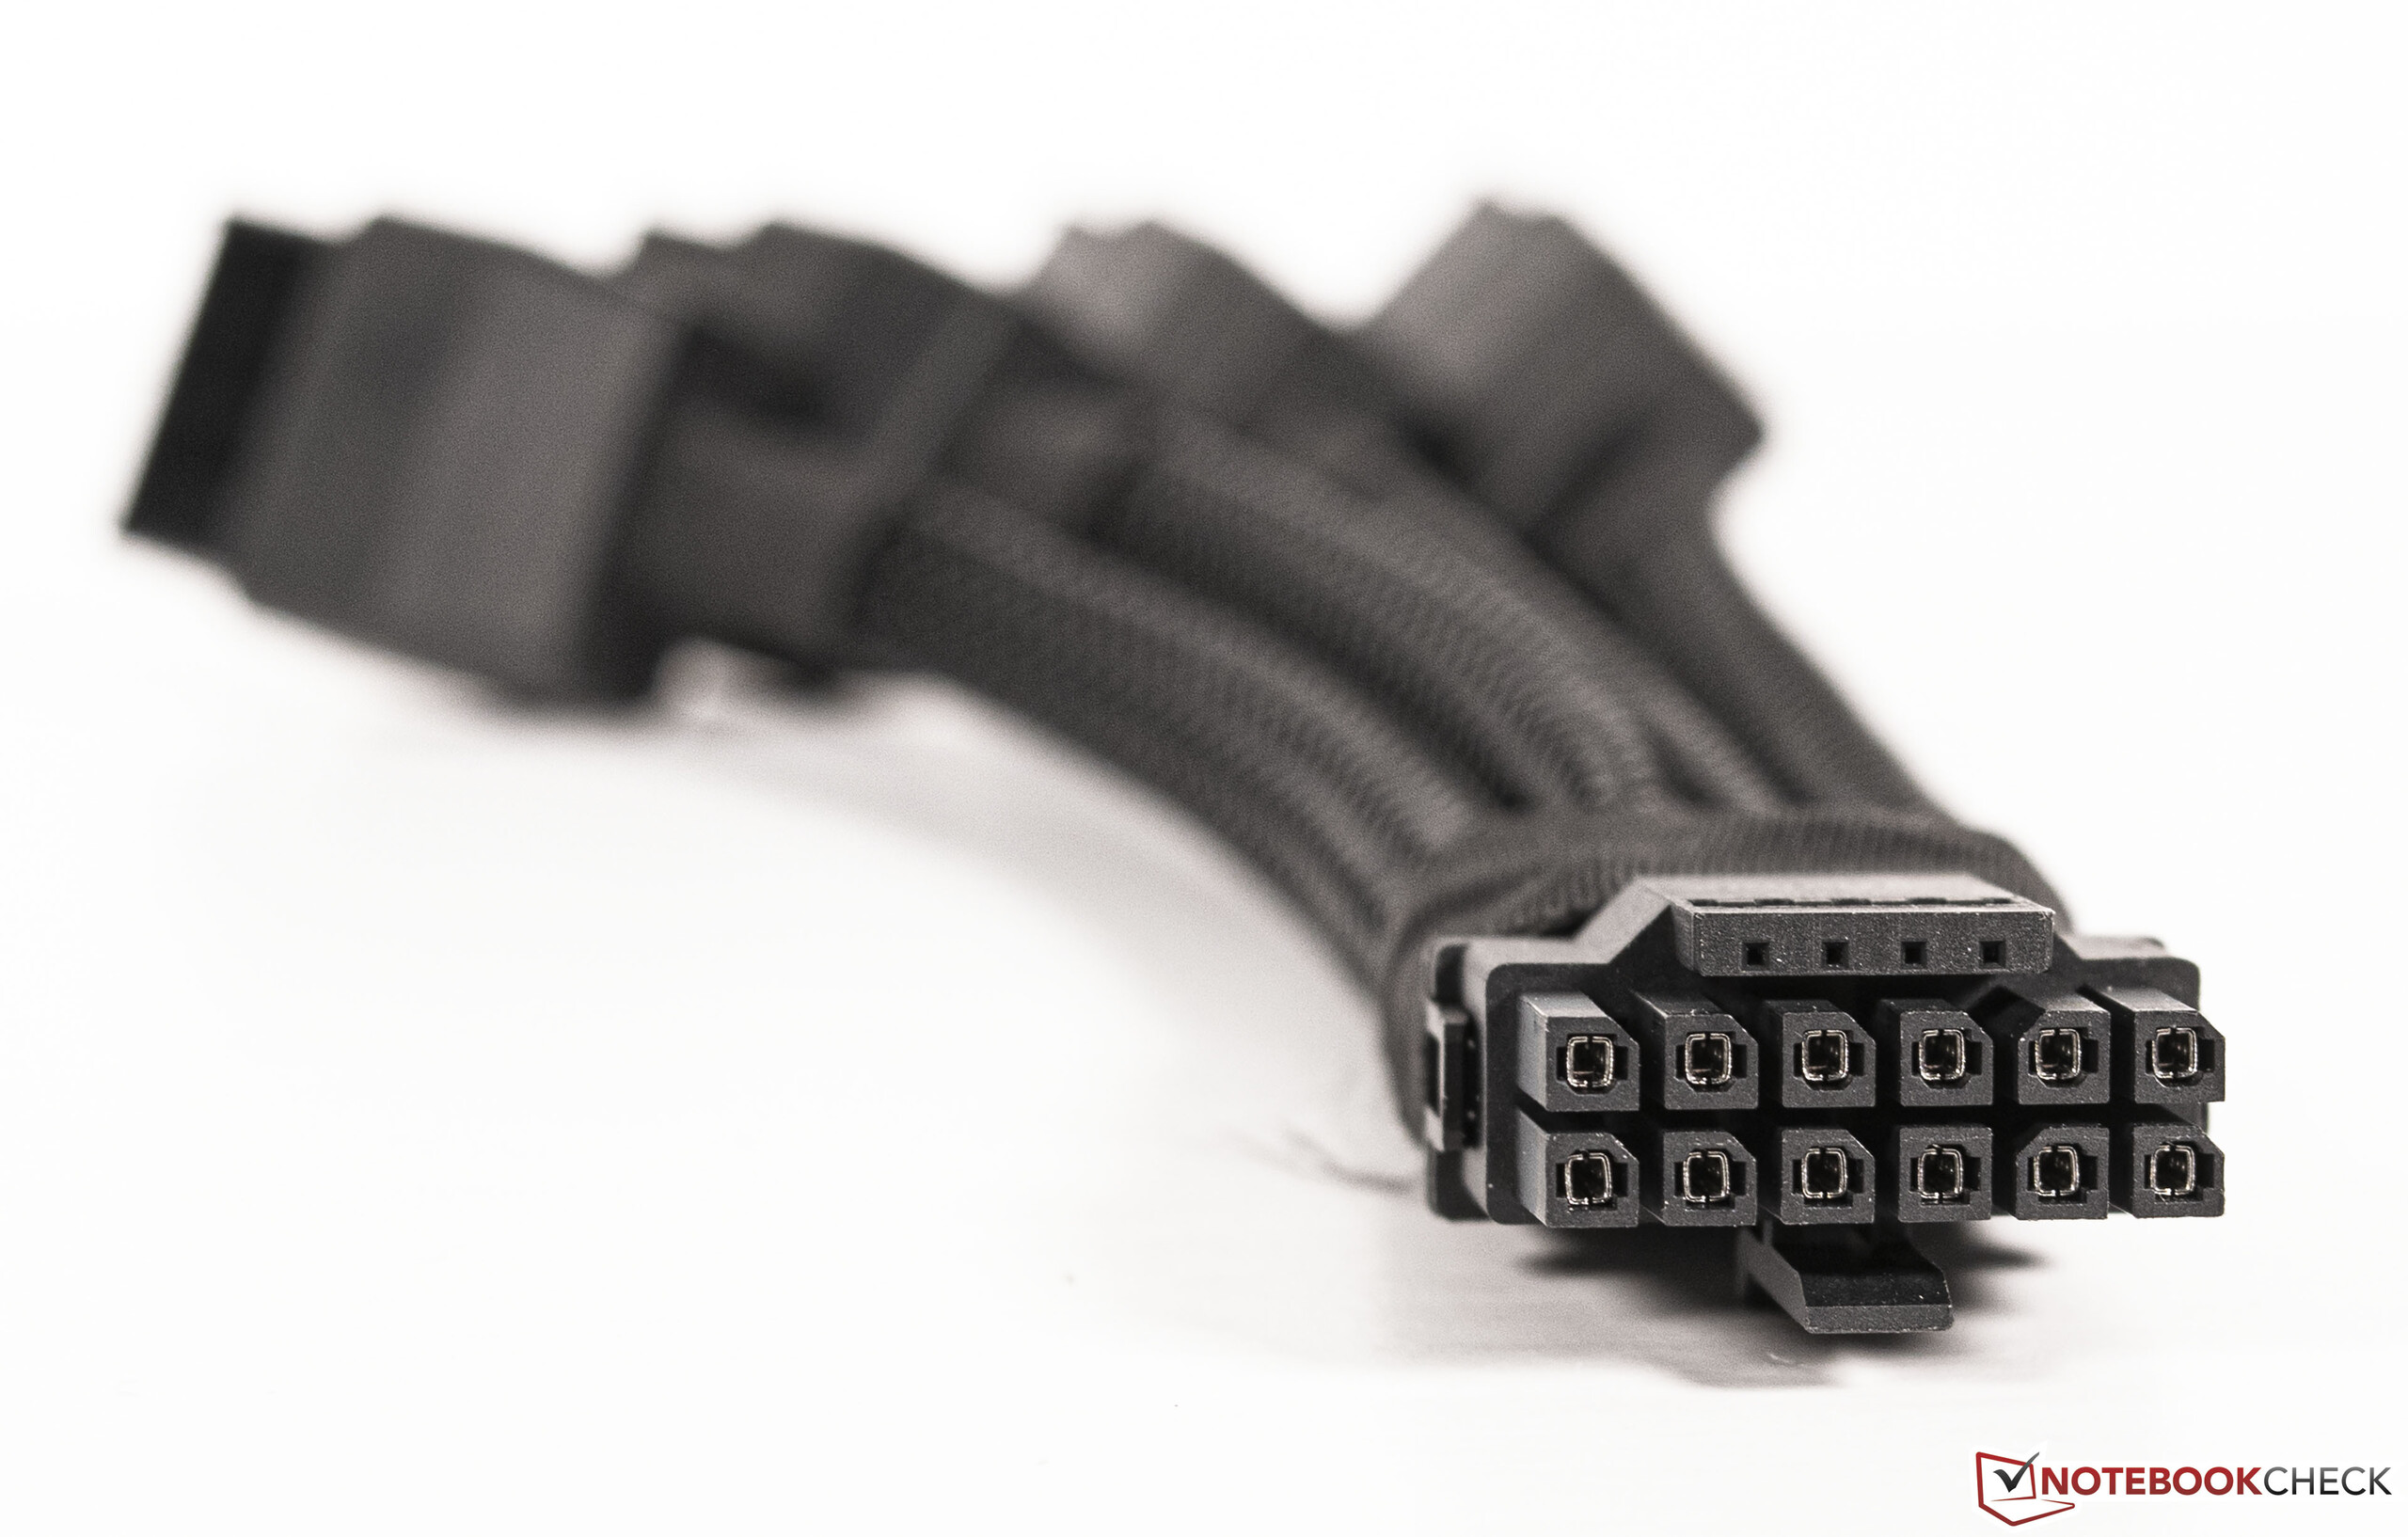
The Palit GeForce RTX 4090 GameRock OC model is a real eye-catcher due to the so-called Midnight Kaleidoscope Design, including subtle RGB lighting. At just under 2 kg (4.4 pounds) our review sample belongs to the lightweights when compared to other RTX 4090 graphics cards. Nevertheless, a graphics card holder is included in the box, helping suppport the card's horizontal installation. In addition, there's also the much talked about mains adapter which merges four 8 pin power connectors onto the graphics card's new 12VHPWR connector. At this point, we don't want to go into the technical build and accuracy. However, the adapter should be handled with care in order to avoid potential malfunction. We recommend using an appropriate connector cable from the power supply manufacturer. All of our tests have been carried out with the corresponding adapter, so far without encountering any problems.
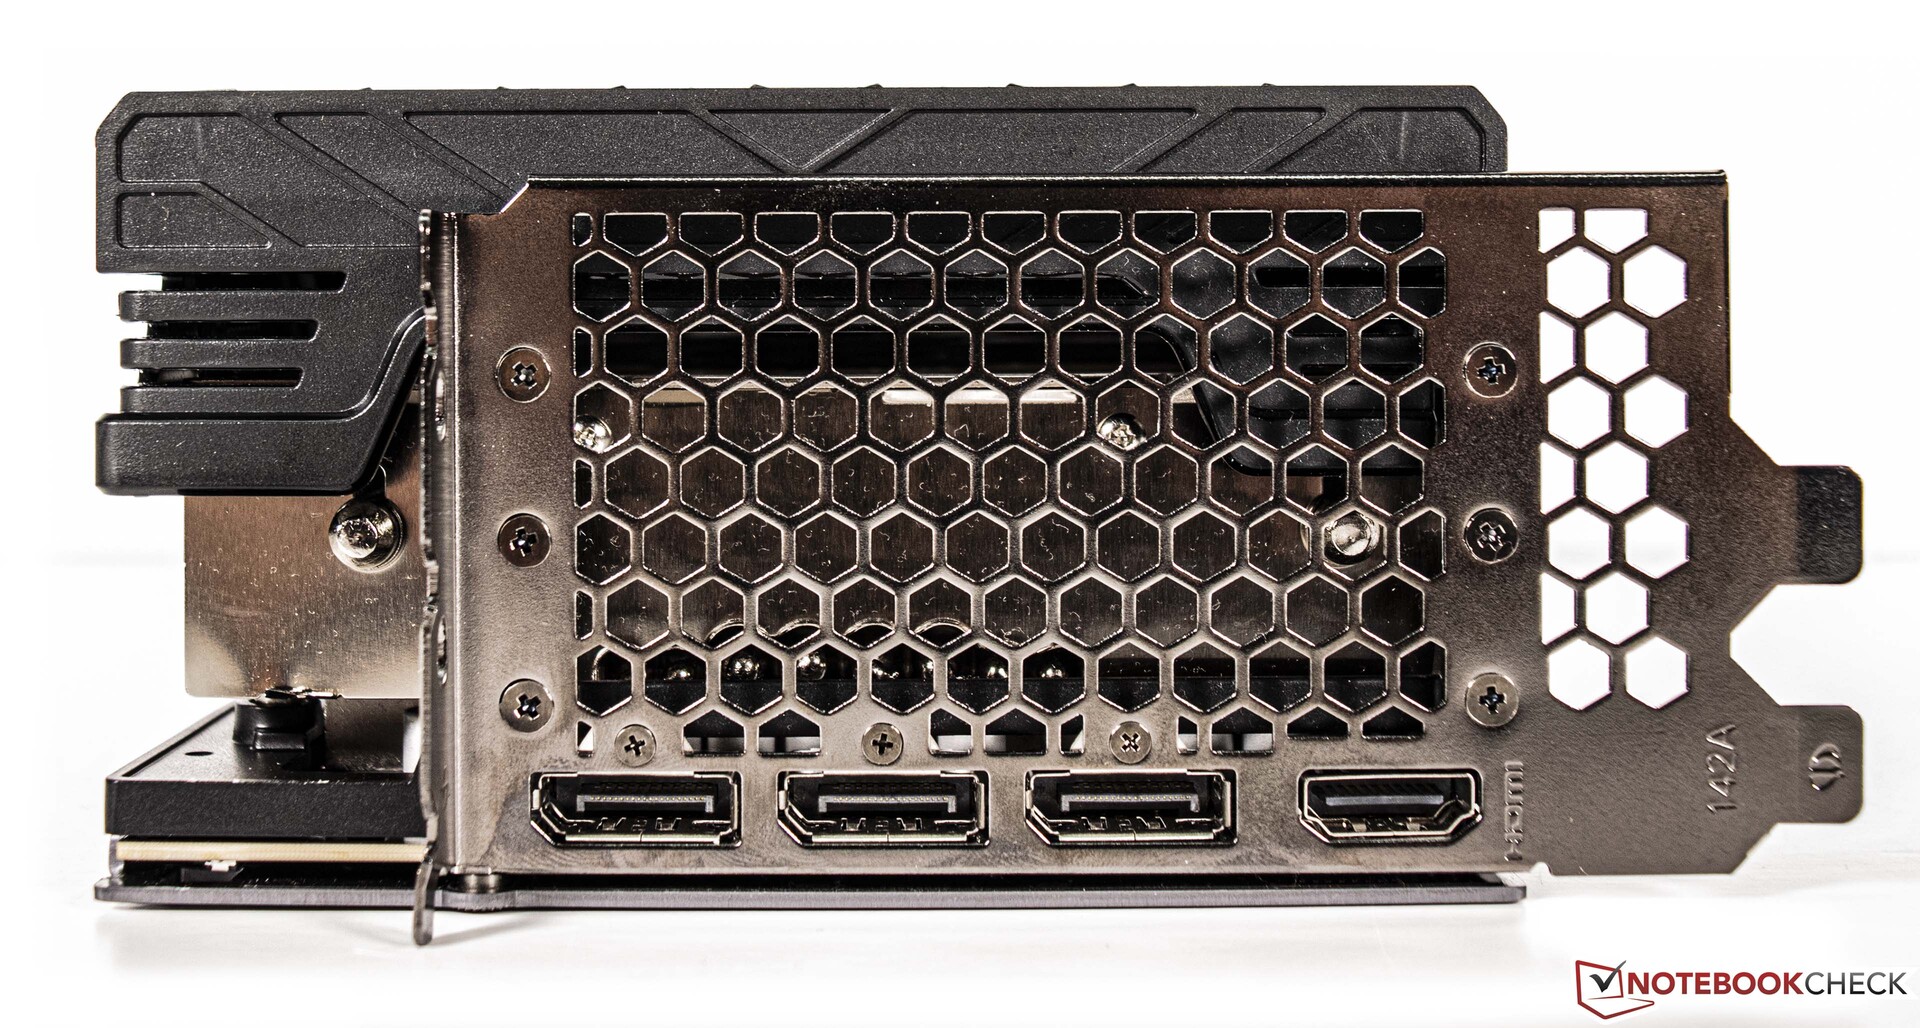
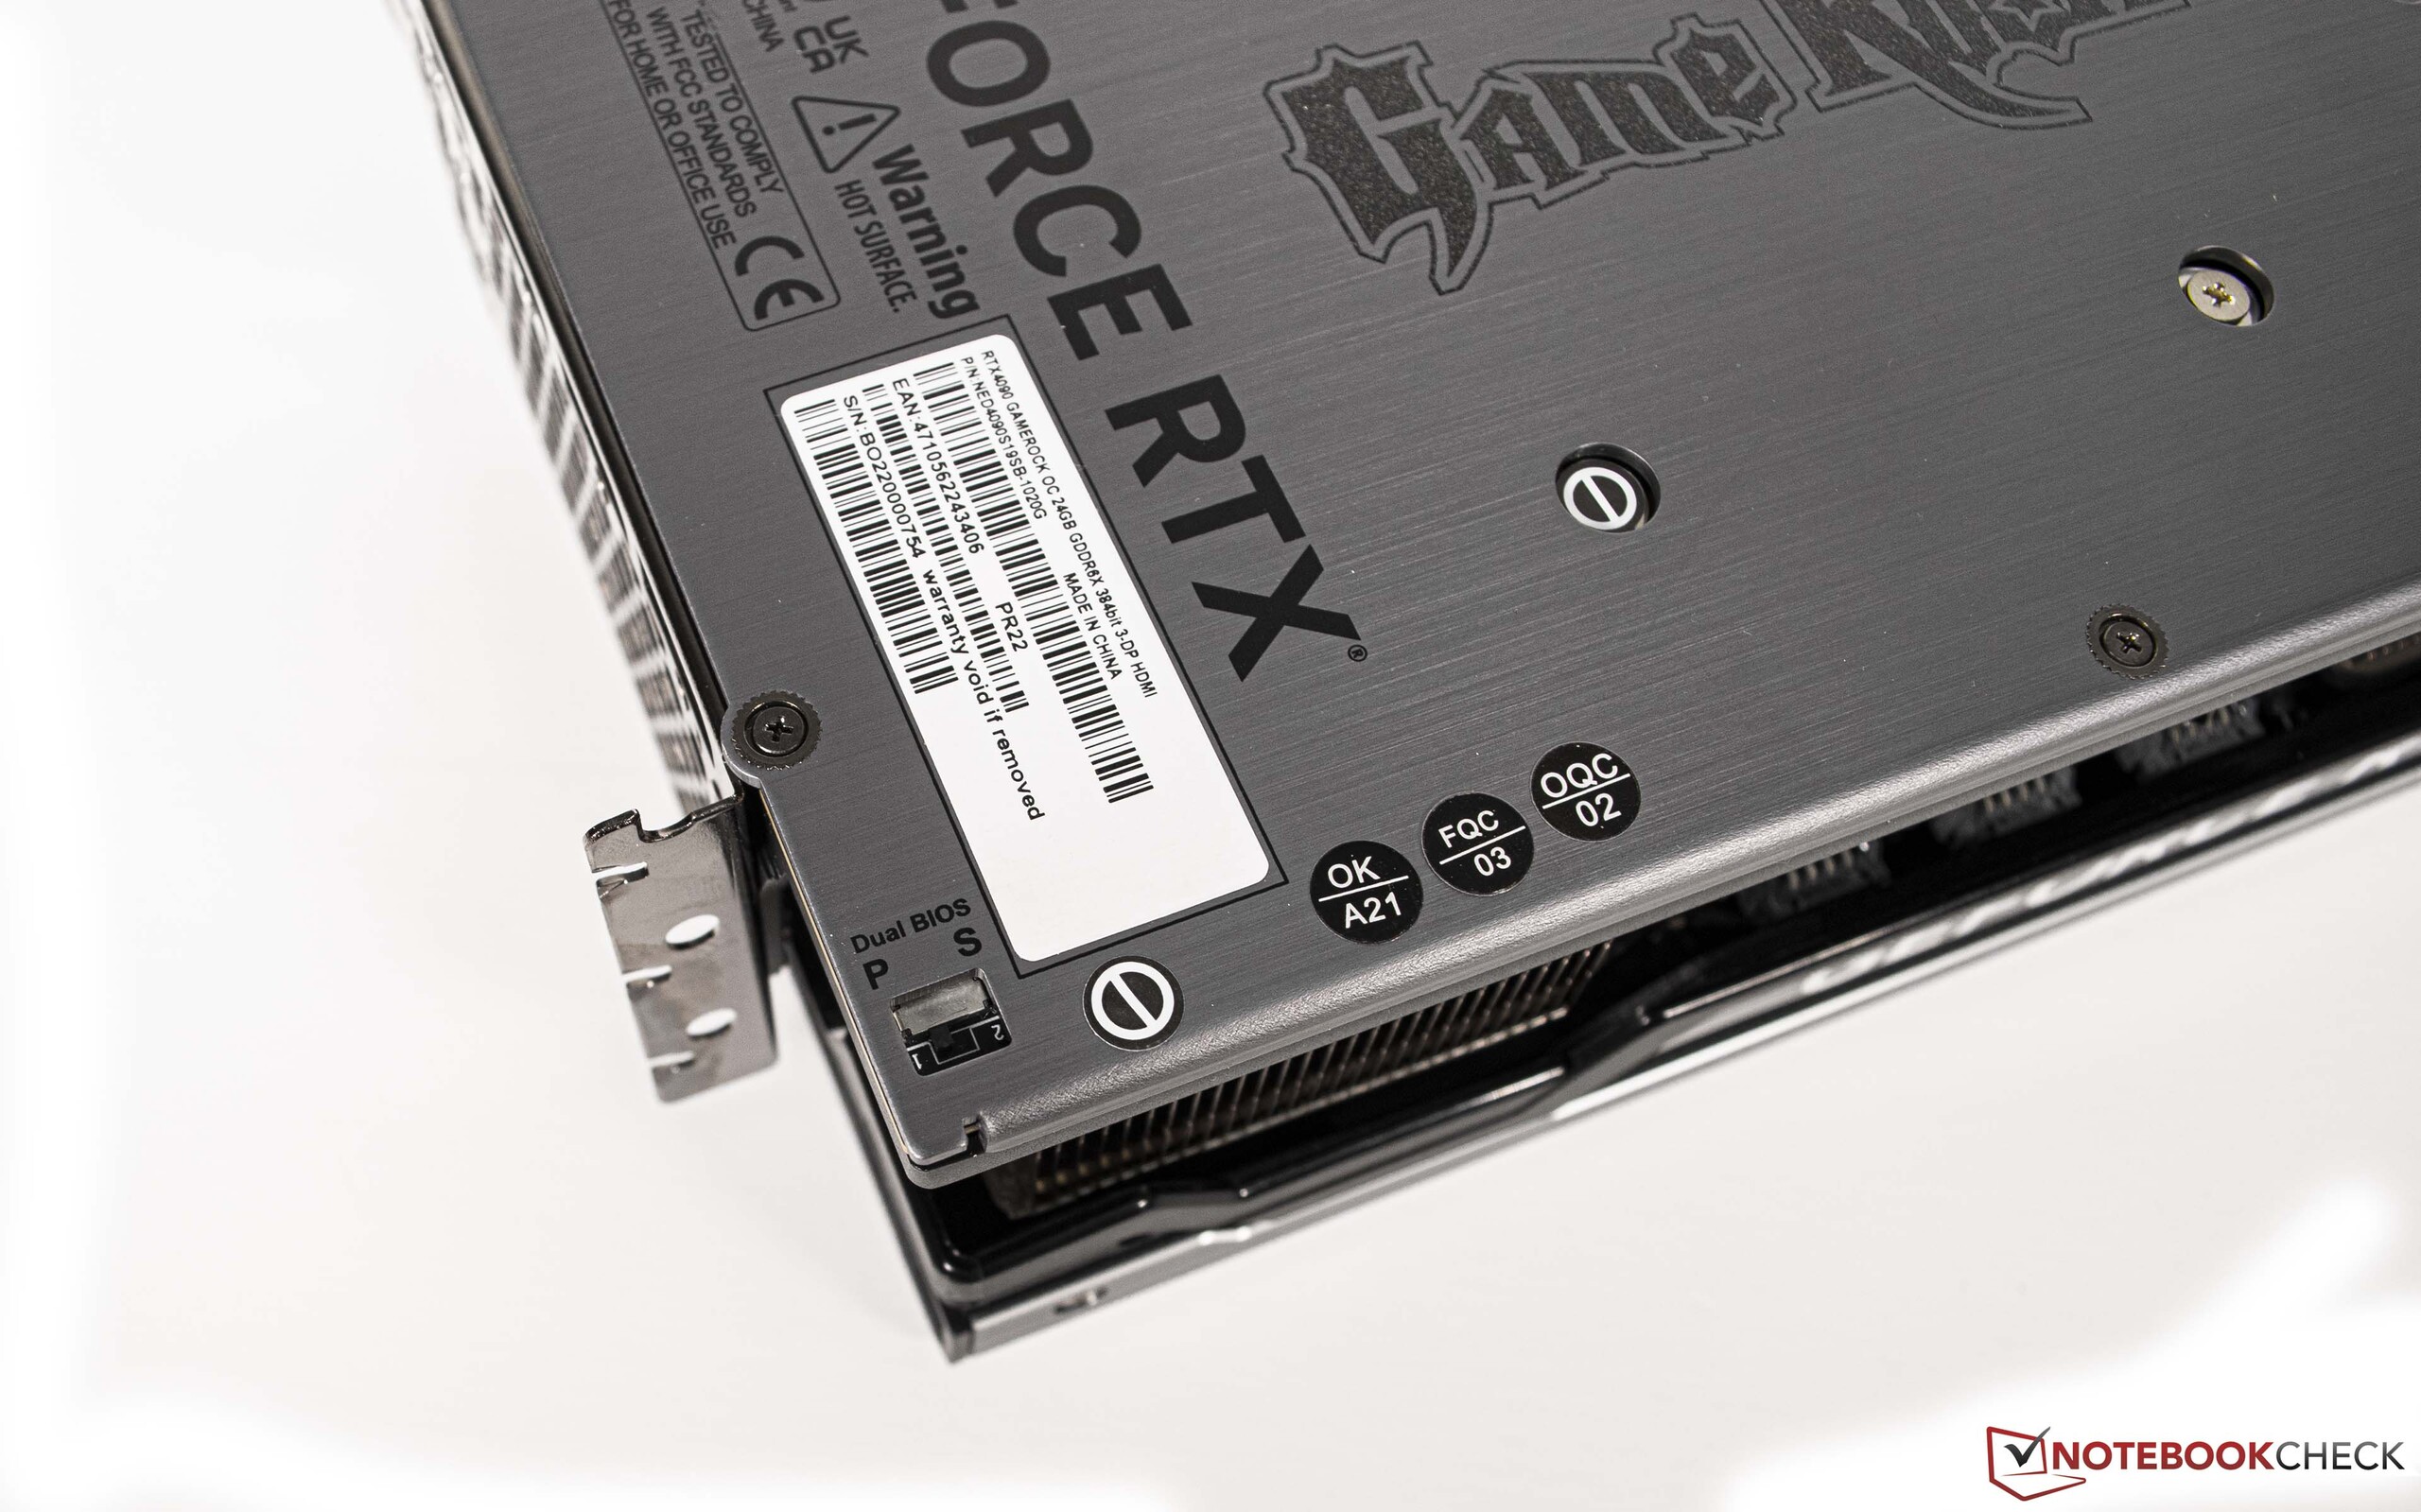
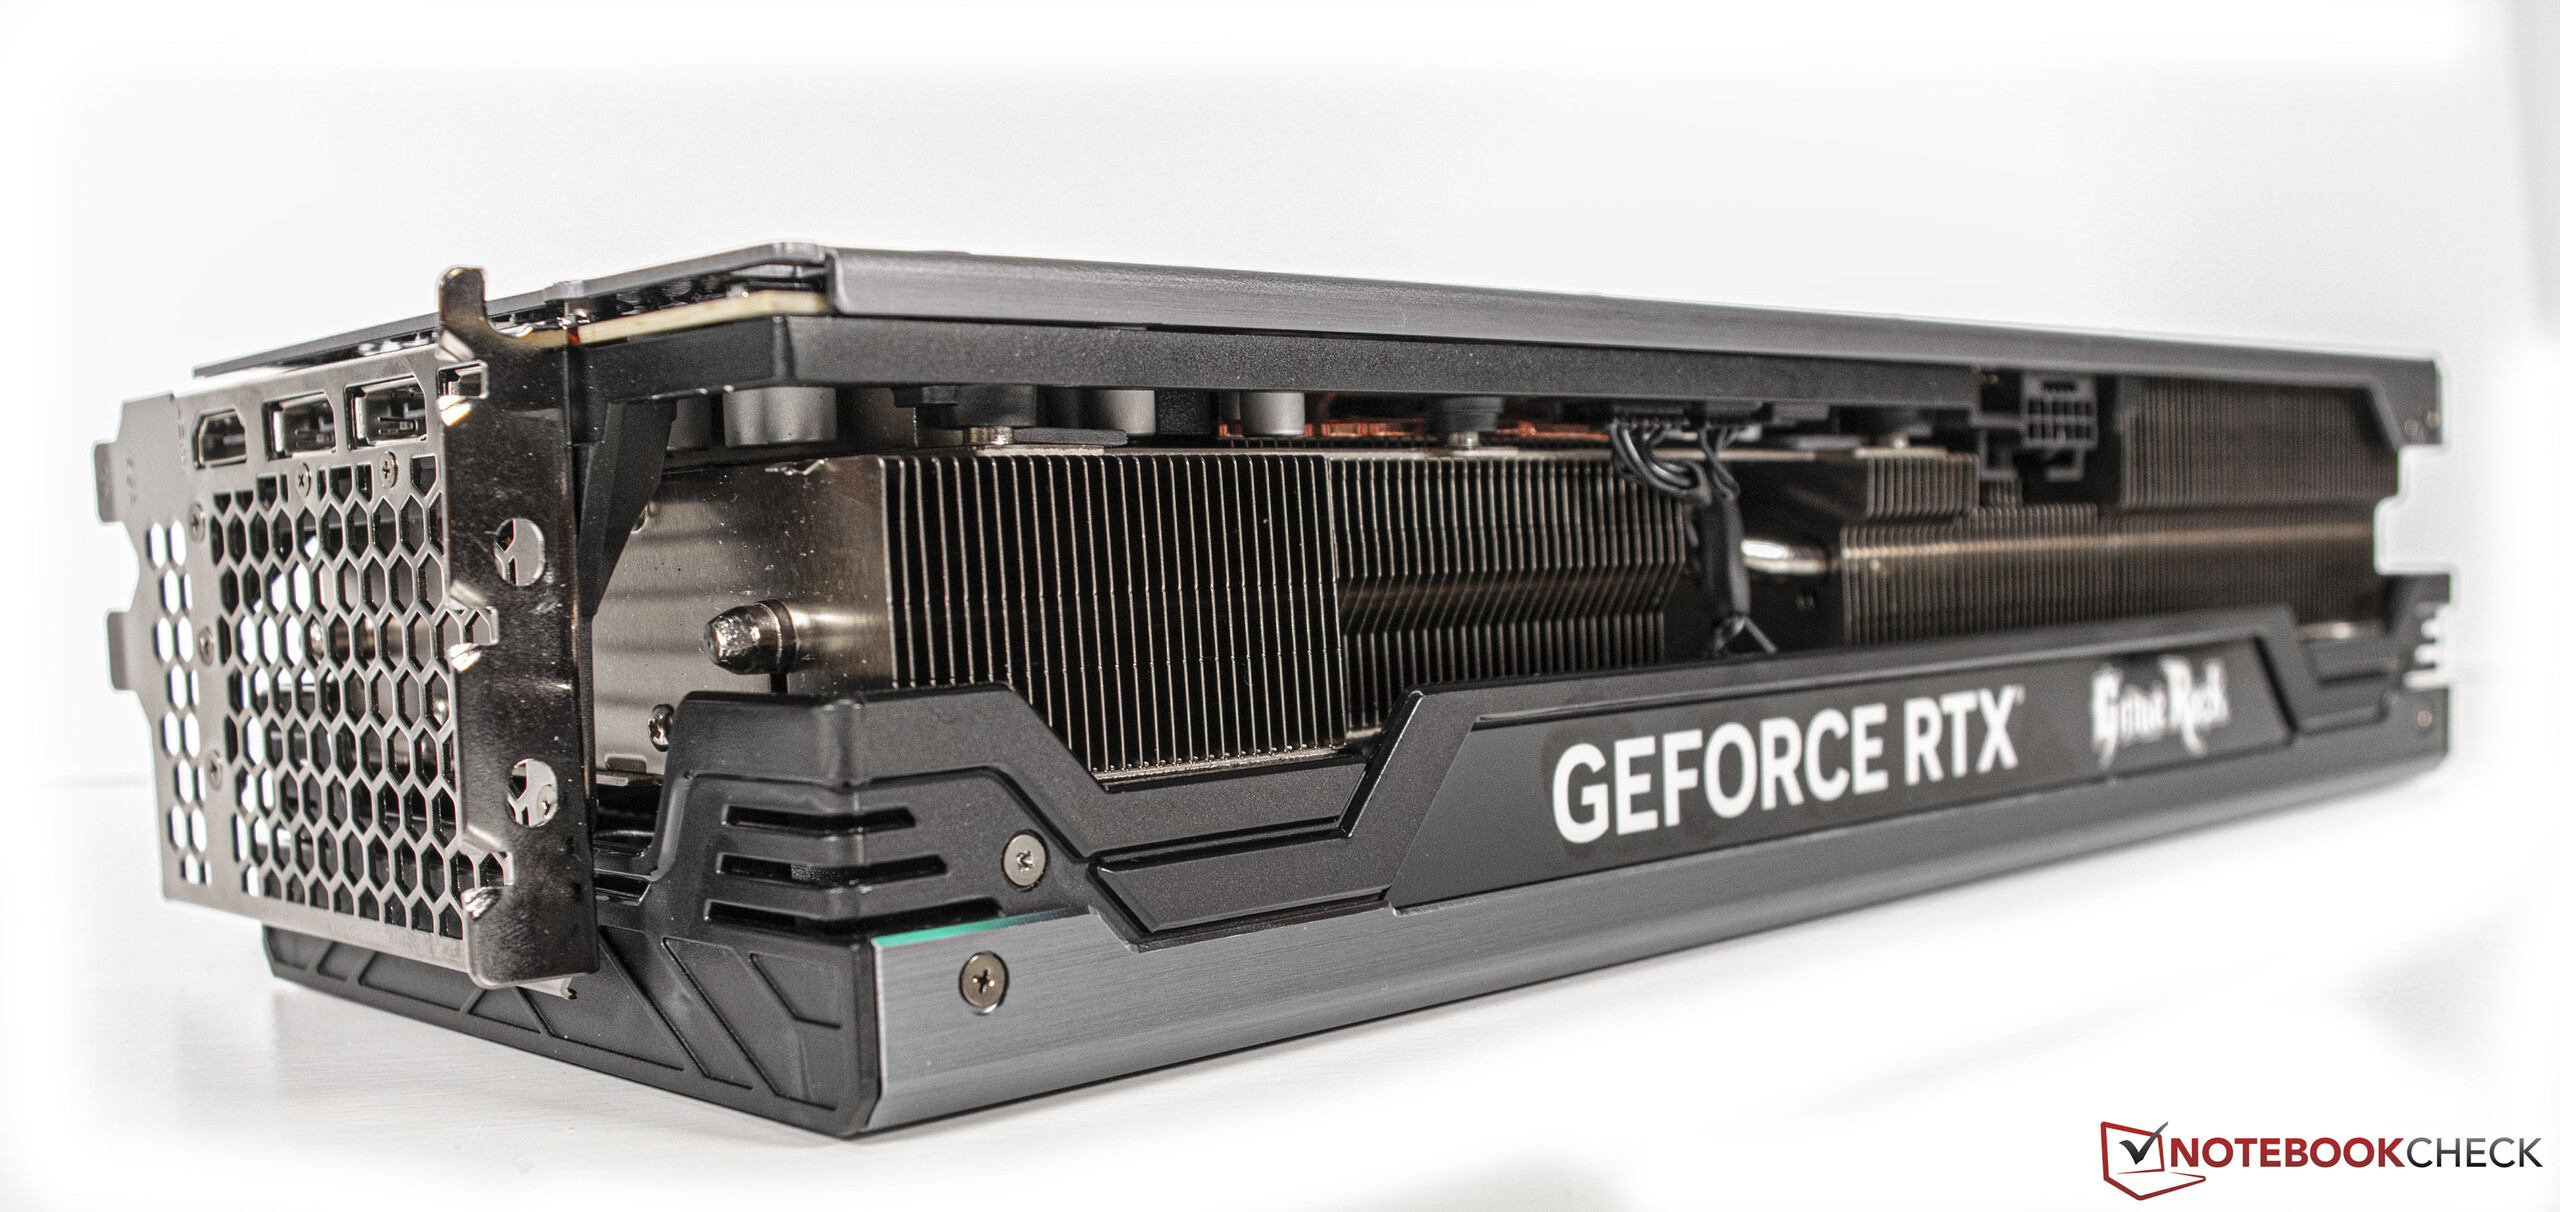
Externally, the Palit GeForce RTX 4090 GameRock OC comes with 1x HDMI 2.1a and 3x DisplayPort 1.4a.

Flagship GeForce graphics cards: Specs
| RTX 4090 (FE) | RTX 4080 | RTX 3090 Ti | RTX 3090 (FE) | RTX 3080 Ti (FE) | RTX 3080 (FE) | Titan RTX | |
| GPU | AD102 | AD103 | GA102 | GA102 | GA102 | GA102 | TU102 |
| FinFET process | 4 nm | 4 nm | 8 nm | 8 nm | 8 nm | 8 nm | 12 nm |
| CUDA Cores | 16,384 | 9,728 | 10,752 | 10,496 | 10,240 | 8,704 | 4,608 |
| Texture Units | 512 | 304 | 336 | 328 | 320 | 272 | 288 |
| Tensor Cores | 512 Gen 4 | 304 Gen 4 | 336 Gen 3 | 328 Gen 3 | 320 Gen 3 | 272 Gen 3 | 576 Gen 2 |
| RT Cores | 128 | 76 | 84 | 82 | 80 | 68 | 72 |
| GPU Base clock speed | 2,235 MHz | 2,205 | 1,560 MHz | 1,395 MHz | 1,365 MHz | 1,440 MHz | 1,350 MHz |
| GPU Boost clock speed | 2,520 MHz | 2,505 | 1,860 MHz | 1,695 MHz | 1,665 MHz | 1,710 MHz | 1,770 MHz |
| Memory bus | 384 bit | 256 bits | 384 bits | 384 bits | 384 bits | 320 bits | 384 bits |
| Memory bandwidth | 1,008 GB/s | 735,7 GB/s | 1,008 GB/s | 936 GB/s | 912,4 GB/s | 760 GB/s | 672 GB/s |
| VRAM | 24 GB GDDR6X | 16 GB GDDR6X | 24 GB GDDR6X | 24 GB GDDR6X | 12 GB GDDR6X | 10 GB GDDR6X | 24 GB GDDR6 |
| Power consumption | 450 W | 320 W | 450 W | 350 W | 350 W | 320 W | 280 W |
Our review unit with AMD Ryzen 9 7950X as a basis
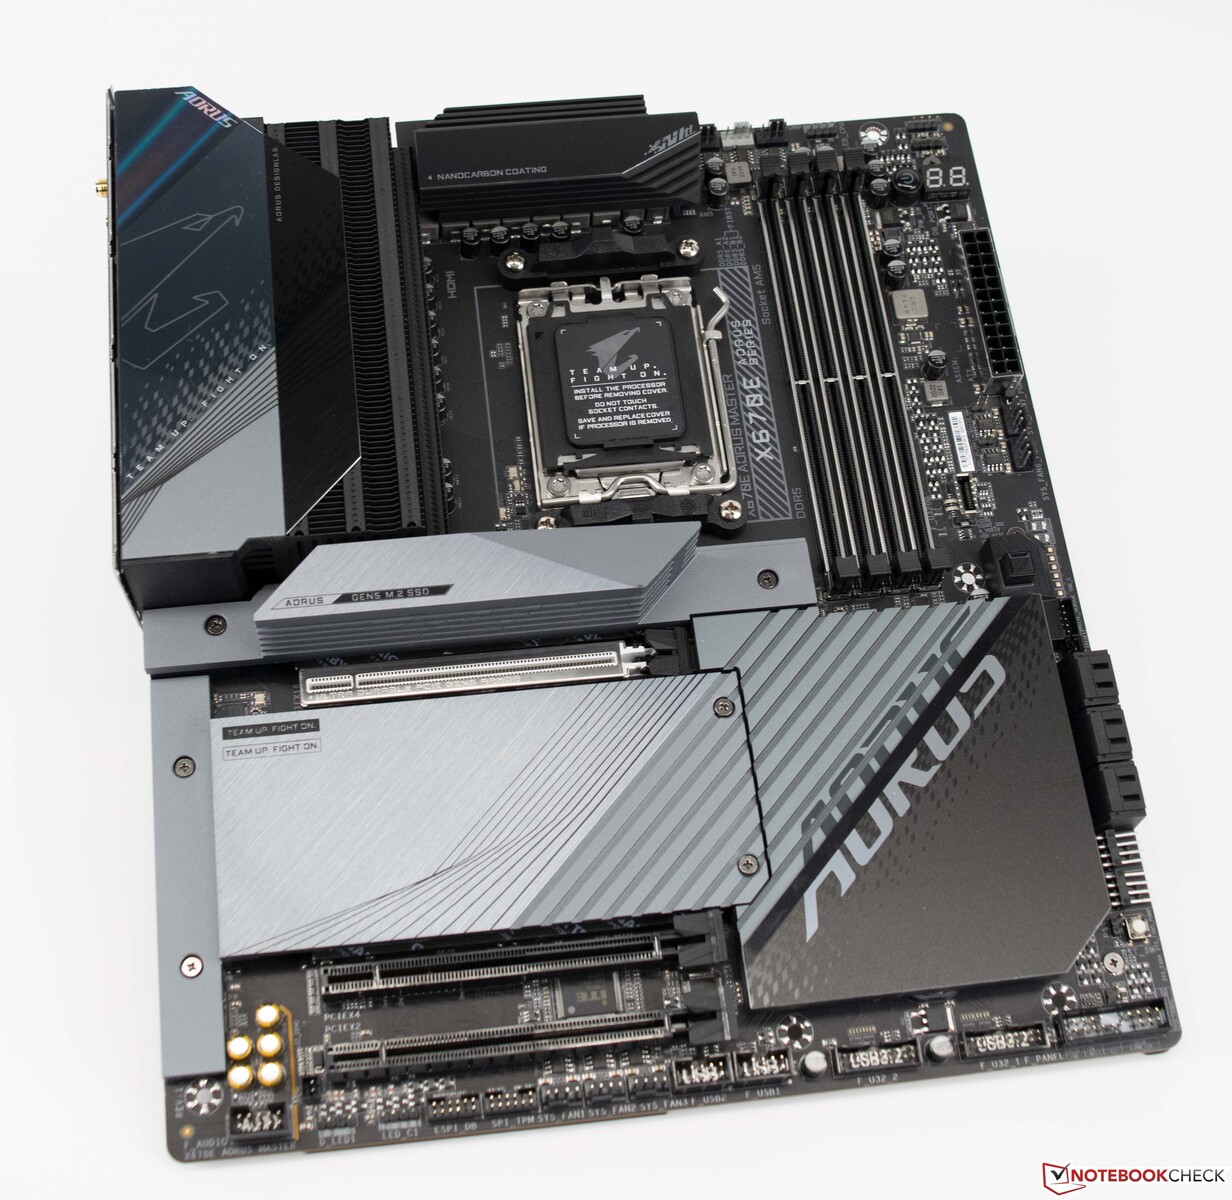
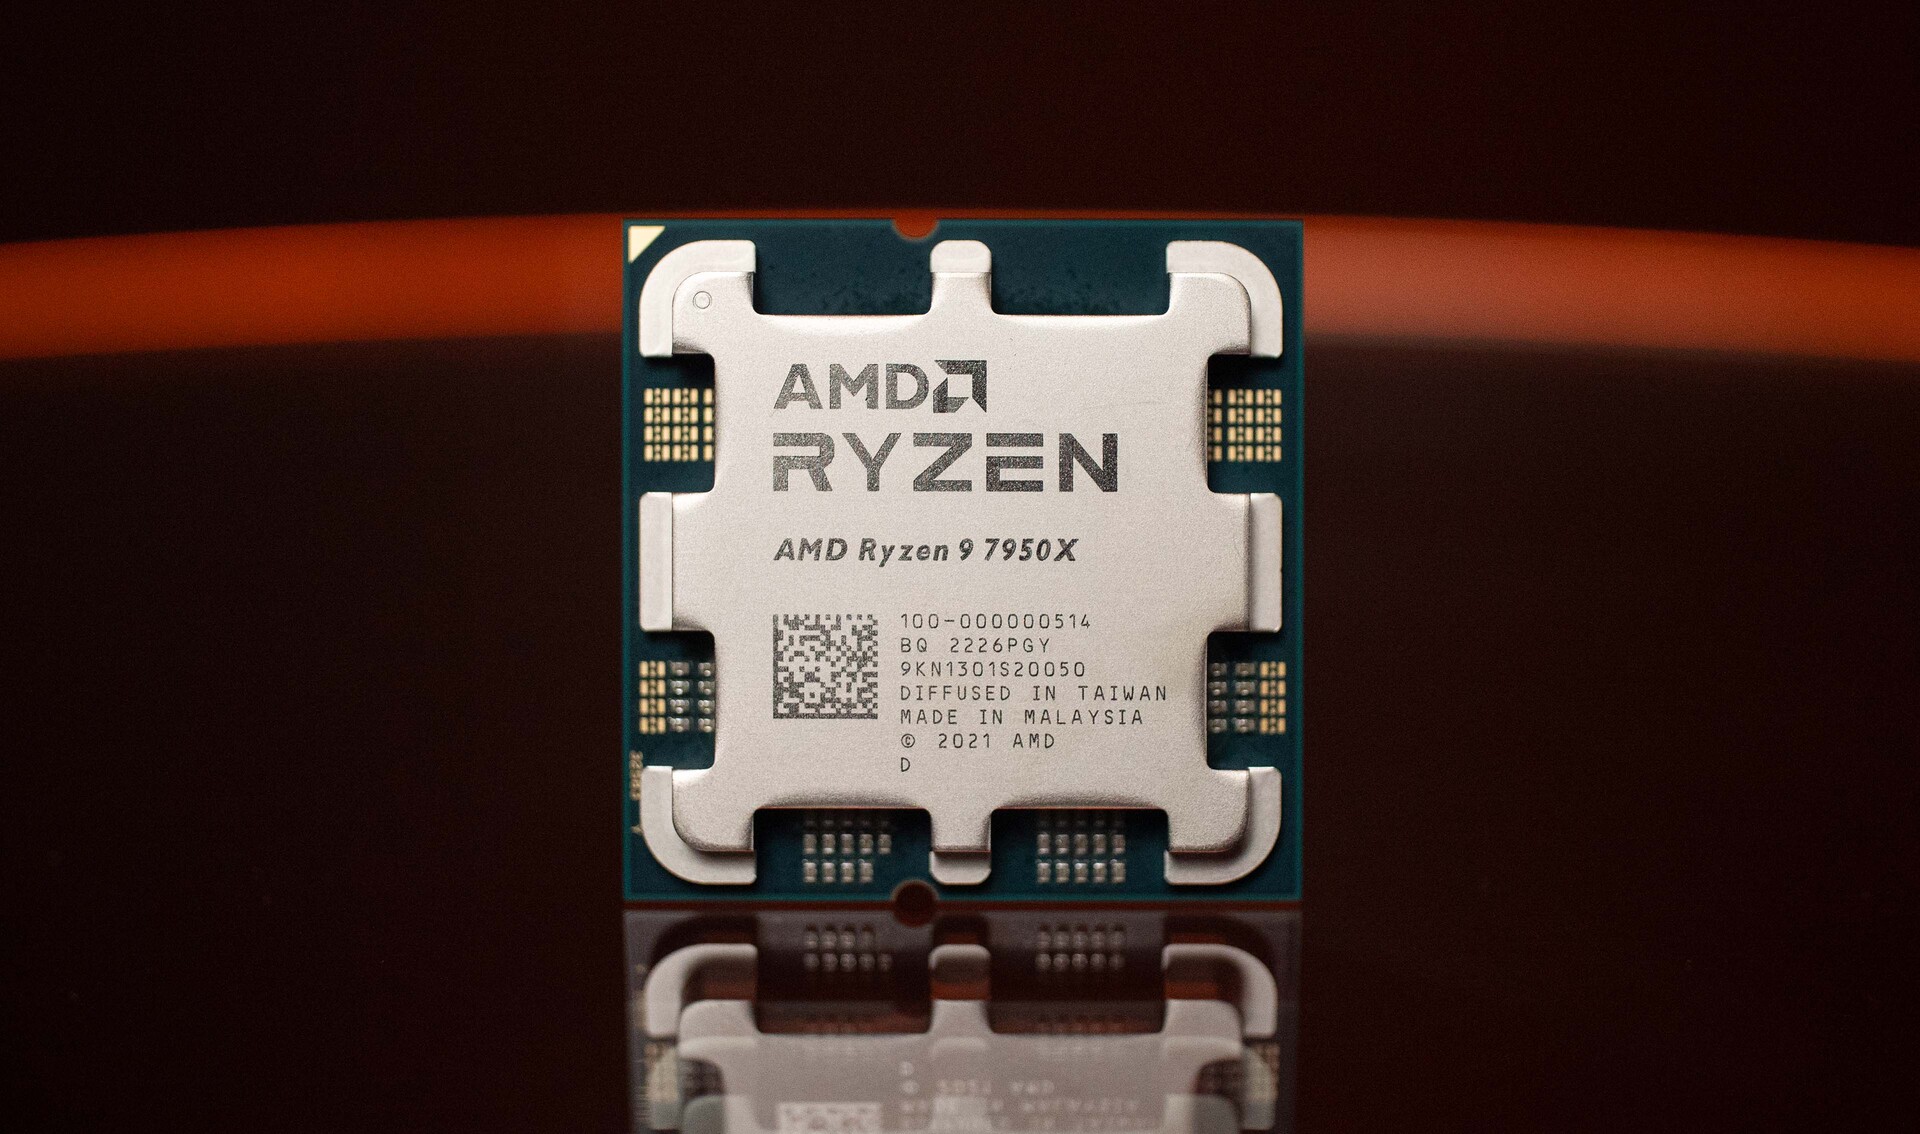
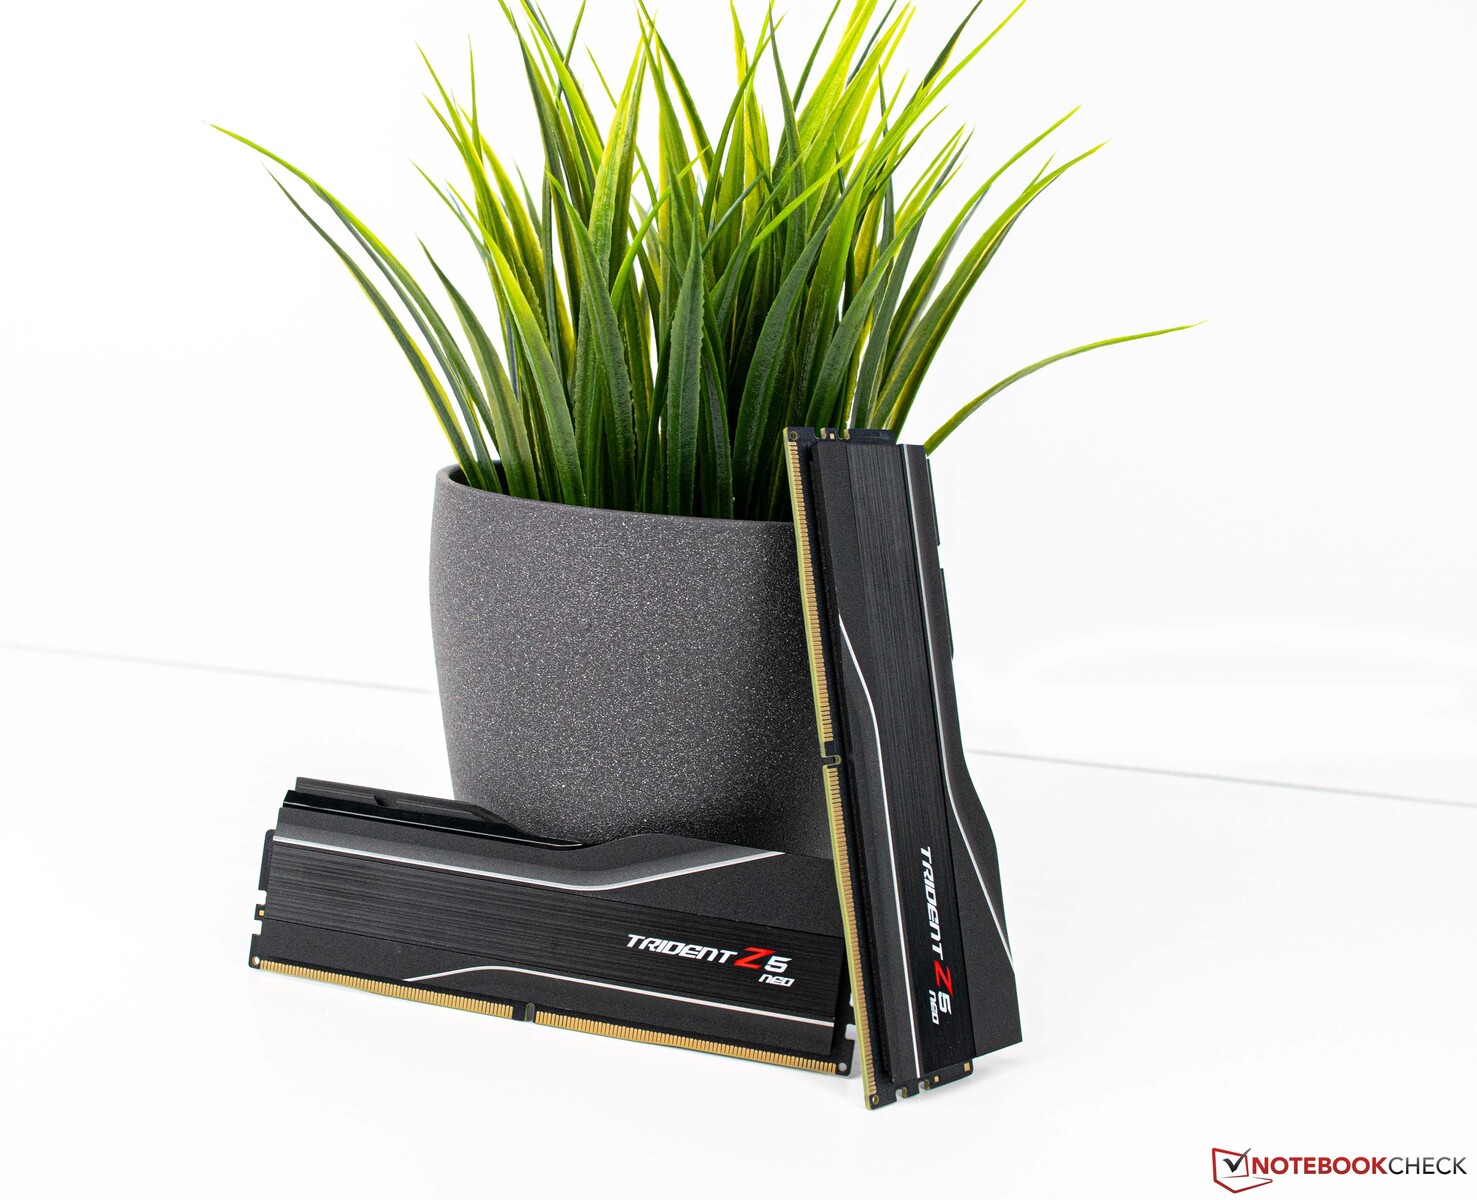
As our test system, we used a current AMD platform based on the Gigabyte X670E Aorus Master motherboard. The CPU (AMD Ryzen 9 7950X) offers good CPU performance and for cooling we used an AiO solution from Alphacool (Alphacool Eisbear Aurora 360 mm). The 32 GB RAM comes from G.Skill and uses a suitable EXPO profile. The monitor we used was the Gigabyte M32U.
Details of our system
For the following benchmarks and tests we used this system:
- Lian-Li O11 Dynamic
- AMD Ryzen 9 7950X
- Gigabyte X670E Aorus Master, BIOS: F8a
- Alphacool Eisbear 360 AiO
- Corsair RM 1000x power supply
- G.Skill Trident Z5 Neo DDR5-6000 2x 16 GB, EXPO (DDR5-6000 CL30-38-38-96)
- Corsair MP600 2 TB
- Crucial MX500 2 TB
- Microsoft Windows 11 Professional 64-Bit (Version 22H2)
Synthetic Benchmarks
The synthetic tests already clearly demonstrate what the Nvidia GeForce RTX 4090 is capable of. The performance of the current top models is almost completely pulverized and in the overall synthetic benchmark rating the Palit GeForce RTX 4090 GameRock OC outperforms the Nvidia GeForce RTX 3090 Ti by 52 percent. The previous top model from AMD (AMD Radeon RX 6950 XT) finds itself further back in the pack and takes fourth place behind the Nvidia GeForce RTX 3090 Founders Edition.
| Performance rating - Percent | |
| NVIDIA GeForce RTX 4090 | |
| NVIDIA Titan RTX | |
| AMD Radeon RX 6950 XT | |
| NVIDIA GeForce RTX 3090 | |
| NVIDIA GeForce RTX 3090 Ti -8! | |
| AMD Radeon RX 6900 XT | |
| NVIDIA GeForce RTX 3080 12 GB | |
| 3DMark | |
| 2560x1440 Time Spy Graphics | |
| NVIDIA GeForce RTX 4090 | |
| AMD Radeon RX 6950 XT | |
| NVIDIA GeForce RTX 3090 Ti | |
| NVIDIA GeForce RTX 3090 | |
| AMD Radeon RX 6900 XT | |
| NVIDIA GeForce RTX 3080 12 GB | |
| NVIDIA Titan RTX | |
| Fire Strike Extreme Graphics | |
| NVIDIA GeForce RTX 4090 | |
| AMD Radeon RX 6950 XT | |
| NVIDIA GeForce RTX 3090 Ti | |
| AMD Radeon RX 6900 XT | |
| NVIDIA GeForce RTX 3090 | |
| NVIDIA GeForce RTX 3080 12 GB | |
| NVIDIA Titan RTX | |
| 3840x2160 Fire Strike Ultra Graphics | |
| NVIDIA GeForce RTX 4090 | |
| AMD Radeon RX 6950 XT | |
| NVIDIA GeForce RTX 3090 Ti | |
| AMD Radeon RX 6900 XT | |
| NVIDIA GeForce RTX 3090 | |
| NVIDIA GeForce RTX 3080 12 GB | |
| NVIDIA Titan RTX | |
| 1920x1080 Fire Strike Graphics | |
| NVIDIA GeForce RTX 4090 | |
| AMD Radeon RX 6950 XT | |
| NVIDIA GeForce RTX 3090 Ti | |
| AMD Radeon RX 6900 XT | |
| NVIDIA GeForce RTX 3090 | |
| NVIDIA GeForce RTX 3080 12 GB | |
| NVIDIA Titan RTX | |
| Unigine Superposition | |
| 7680x4320 8k Optimized | |
| NVIDIA GeForce RTX 4090 | |
| NVIDIA GeForce RTX 3090 Ti | |
| NVIDIA GeForce RTX 3090 | |
| AMD Radeon RX 6950 XT | |
| NVIDIA GeForce RTX 3080 12 GB | |
| AMD Radeon RX 6900 XT | |
| NVIDIA Titan RTX | |
| 3840x2160 4k Optimized | |
| NVIDIA GeForce RTX 4090 | |
| NVIDIA GeForce RTX 3090 Ti | |
| AMD Radeon RX 6950 XT | |
| NVIDIA GeForce RTX 3090 | |
| NVIDIA GeForce RTX 3080 12 GB | |
| AMD Radeon RX 6900 XT | |
| NVIDIA Titan RTX | |
| 1920x1080 1080p Extreme | |
| NVIDIA GeForce RTX 4090 | |
| NVIDIA GeForce RTX 3090 Ti | |
| AMD Radeon RX 6950 XT | |
| NVIDIA GeForce RTX 3090 | |
| NVIDIA GeForce RTX 3080 12 GB | |
| AMD Radeon RX 6900 XT | |
| NVIDIA Titan RTX | |
| 1920x1080 1080p High | |
| NVIDIA GeForce RTX 4090 | |
| NVIDIA GeForce RTX 3090 Ti | |
| AMD Radeon RX 6950 XT | |
| NVIDIA GeForce RTX 3090 | |
| AMD Radeon RX 6900 XT | |
| NVIDIA GeForce RTX 3080 12 GB | |
| NVIDIA Titan RTX | |
| 1280x720 720p Low | |
| NVIDIA GeForce RTX 4090 | |
| NVIDIA Titan RTX | |
| NVIDIA GeForce RTX 3090 | |
| NVIDIA GeForce RTX 3090 Ti | |
| NVIDIA GeForce RTX 3080 12 GB | |
| AMD Radeon RX 6900 XT | |
| AMD Radeon RX 6950 XT | |
| Unigine Heaven 4.0 | |
| Extreme Preset DX11 | |
| NVIDIA GeForce RTX 4090 | |
| NVIDIA GeForce RTX 3090 | |
| NVIDIA GeForce RTX 3090 Ti | |
| AMD Radeon RX 6950 XT | |
| NVIDIA GeForce RTX 3080 12 GB | |
| AMD Radeon RX 6900 XT | |
| NVIDIA Titan RTX | |
| Extreme Preset OpenGL | |
| NVIDIA GeForce RTX 4090 | |
| NVIDIA GeForce RTX 3090 Ti | |
| NVIDIA GeForce RTX 3090 | |
| NVIDIA GeForce RTX 3080 12 GB | |
| AMD Radeon RX 6950 XT | |
| NVIDIA Titan RTX | |
| AMD Radeon RX 6900 XT | |
| Unigine Valley 1.0 | |
| 1920x1080 Extreme HD DirectX AA:x8 | |
| NVIDIA GeForce RTX 4090 | |
| NVIDIA GeForce RTX 3090 | |
| AMD Radeon RX 6950 XT | |
| NVIDIA GeForce RTX 3080 12 GB | |
| NVIDIA GeForce RTX 3090 Ti | |
| AMD Radeon RX 6900 XT | |
| NVIDIA Titan RTX | |
| 1920x1080 Extreme HD Preset OpenGL AA:x8 | |
| NVIDIA GeForce RTX 4090 | |
| NVIDIA GeForce RTX 3090 Ti | |
| NVIDIA GeForce RTX 3090 | |
| NVIDIA GeForce RTX 3080 12 GB | |
| AMD Radeon RX 6950 XT | |
| AMD Radeon RX 6900 XT | |
| NVIDIA Titan RTX | |
| 3DMark 11 | |
| 1280x720 Performance GPU | |
| NVIDIA GeForce RTX 4090 | |
| AMD Radeon RX 6950 XT | |
| NVIDIA GeForce RTX 3090 Ti | |
| NVIDIA GeForce RTX 3090 | |
| AMD Radeon RX 6900 XT | |
| NVIDIA GeForce RTX 3080 12 GB | |
| NVIDIA Titan RTX | |
| 1280x720 Performance | |
| NVIDIA GeForce RTX 4090 | |
| NVIDIA GeForce RTX 3090 Ti | |
| NVIDIA GeForce RTX 3090 | |
| NVIDIA Titan RTX | |
| AMD Radeon RX 6950 XT | |
| AMD Radeon RX 6900 XT | |
| NVIDIA GeForce RTX 3080 12 GB | |
| ComputeMark v2.1 | |
| 1024x600 Normal, QJuliaRayTrace | |
| NVIDIA GeForce RTX 4090 | |
| NVIDIA GeForce RTX 3090 | |
| NVIDIA GeForce RTX 3080 12 GB | |
| AMD Radeon RX 6950 XT | |
| AMD Radeon RX 6900 XT | |
| NVIDIA Titan RTX | |
| 1024x600 Normal, Mandel Scalar | |
| NVIDIA GeForce RTX 4090 | |
| AMD Radeon RX 6950 XT | |
| NVIDIA GeForce RTX 3090 | |
| AMD Radeon RX 6900 XT | |
| NVIDIA GeForce RTX 3080 12 GB | |
| NVIDIA Titan RTX | |
| 1024x600 Normal, Mandel Vector | |
| NVIDIA GeForce RTX 4090 | |
| NVIDIA GeForce RTX 3090 | |
| AMD Radeon RX 6950 XT | |
| AMD Radeon RX 6900 XT | |
| NVIDIA GeForce RTX 3080 12 GB | |
| NVIDIA Titan RTX | |
| 1024x600 Normal, Fluid 2DTexArr | |
| NVIDIA GeForce RTX 4090 | |
| NVIDIA GeForce RTX 3090 | |
| AMD Radeon RX 6950 XT | |
| NVIDIA GeForce RTX 3080 12 GB | |
| AMD Radeon RX 6900 XT | |
| NVIDIA Titan RTX | |
| 1024x600 Normal, Fluid 3DTex | |
| NVIDIA GeForce RTX 4090 | |
| AMD Radeon RX 6950 XT | |
| NVIDIA GeForce RTX 3090 | |
| AMD Radeon RX 6900 XT | |
| NVIDIA GeForce RTX 3080 12 GB | |
| NVIDIA Titan RTX | |
| 1024x600 Normal, Score | |
| NVIDIA GeForce RTX 4090 | |
| NVIDIA GeForce RTX 3090 | |
| AMD Radeon RX 6950 XT | |
| NVIDIA GeForce RTX 3080 12 GB | |
| AMD Radeon RX 6900 XT | |
| NVIDIA Titan RTX | |
| LuxMark v2.0 64Bit | |
| Sala GPUs-only | |
| AMD Radeon RX 6950 XT | |
| AMD Radeon RX 6900 XT | |
| NVIDIA GeForce RTX 4090 | |
| NVIDIA GeForce RTX 3090 | |
| NVIDIA GeForce RTX 3080 12 GB | |
| NVIDIA Titan RTX | |
| Room GPUs-only | |
| NVIDIA GeForce RTX 4090 | |
| NVIDIA GeForce RTX 3090 | |
| NVIDIA GeForce RTX 3080 12 GB | |
| AMD Radeon RX 6950 XT | |
| AMD Radeon RX 6900 XT | |
| NVIDIA Titan RTX | |
Palit GeForce RTX 4090 GameRock OC with Ryzen 9 vs. Core i9
| Performance rating - Percent | |
| NVIDIA GeForce RTX 4090, AMD Ryzen 9 7950X | |
| NVIDIA GeForce RTX 4090, Intel Core i9-13900K | |
| 3DMark | |
| 2560x1440 Time Spy Graphics | |
| NVIDIA GeForce RTX 4090, Intel Core i9-13900K | |
| NVIDIA GeForce RTX 4090, AMD Ryzen 9 7950X | |
| Fire Strike Extreme Graphics | |
| NVIDIA GeForce RTX 4090, AMD Ryzen 9 7950X | |
| NVIDIA GeForce RTX 4090, Intel Core i9-13900K | |
| 3840x2160 Fire Strike Ultra Graphics | |
| NVIDIA GeForce RTX 4090, Intel Core i9-13900K | |
| NVIDIA GeForce RTX 4090, AMD Ryzen 9 7950X | |
| 1920x1080 Fire Strike Graphics | |
| NVIDIA GeForce RTX 4090, AMD Ryzen 9 7950X | |
| NVIDIA GeForce RTX 4090, Intel Core i9-13900K | |
| Unigine Superposition | |
| 7680x4320 8k Optimized | |
| NVIDIA GeForce RTX 4090, AMD Ryzen 9 7950X | |
| NVIDIA GeForce RTX 4090, Intel Core i9-13900K | |
| 3840x2160 4k Optimized | |
| NVIDIA GeForce RTX 4090, Intel Core i9-13900K | |
| NVIDIA GeForce RTX 4090, AMD Ryzen 9 7950X | |
| 1920x1080 1080p Extreme | |
| NVIDIA GeForce RTX 4090, Intel Core i9-13900K | |
| NVIDIA GeForce RTX 4090, AMD Ryzen 9 7950X | |
| 1920x1080 1080p High | |
| NVIDIA GeForce RTX 4090, Intel Core i9-13900K | |
| NVIDIA GeForce RTX 4090, AMD Ryzen 9 7950X | |
| 1280x720 720p Low | |
| NVIDIA GeForce RTX 4090, Intel Core i9-13900K | |
| NVIDIA GeForce RTX 4090, AMD Ryzen 9 7950X | |
| Unigine Heaven 4.0 | |
| Extreme Preset DX11 | |
| NVIDIA GeForce RTX 4090, AMD Ryzen 9 7950X | |
| NVIDIA GeForce RTX 4090, Intel Core i9-13900K | |
| Extreme Preset OpenGL | |
| NVIDIA GeForce RTX 4090, Intel Core i9-13900K | |
| NVIDIA GeForce RTX 4090, AMD Ryzen 9 7950X | |
| Unigine Valley 1.0 | |
| 1920x1080 Extreme HD DirectX AA:x8 | |
| NVIDIA GeForce RTX 4090, Intel Core i9-13900K | |
| NVIDIA GeForce RTX 4090, AMD Ryzen 9 7950X | |
| 1920x1080 Extreme HD Preset OpenGL AA:x8 | |
| NVIDIA GeForce RTX 4090, Intel Core i9-13900K | |
| NVIDIA GeForce RTX 4090, AMD Ryzen 9 7950X | |
| 3DMark 11 | |
| 1280x720 Performance GPU | |
| NVIDIA GeForce RTX 4090, AMD Ryzen 9 7950X | |
| NVIDIA GeForce RTX 4090, Intel Core i9-13900K | |
| 1280x720 Performance | |
| NVIDIA GeForce RTX 4090, AMD Ryzen 9 7950X | |
| NVIDIA GeForce RTX 4090, Intel Core i9-13900K | |
Compute Benchmarks and professional applications
| ComputeMark v2.1 | |
| 1024x600 Normal, QJuliaRayTrace | |
| NVIDIA GeForce RTX 4090 | |
| NVIDIA GeForce RTX 3090 | |
| NVIDIA GeForce RTX 3080 12 GB | |
| AMD Radeon RX 6950 XT | |
| AMD Radeon RX 6900 XT | |
| NVIDIA Titan RTX | |
| 1024x600 Normal, Mandel Scalar | |
| NVIDIA GeForce RTX 4090 | |
| AMD Radeon RX 6950 XT | |
| NVIDIA GeForce RTX 3090 | |
| AMD Radeon RX 6900 XT | |
| NVIDIA GeForce RTX 3080 12 GB | |
| NVIDIA Titan RTX | |
| 1024x600 Normal, Mandel Vector | |
| NVIDIA GeForce RTX 4090 | |
| NVIDIA GeForce RTX 3090 | |
| AMD Radeon RX 6950 XT | |
| AMD Radeon RX 6900 XT | |
| NVIDIA GeForce RTX 3080 12 GB | |
| NVIDIA Titan RTX | |
| 1024x600 Normal, Fluid 2DTexArr | |
| NVIDIA GeForce RTX 4090 | |
| NVIDIA GeForce RTX 3090 | |
| AMD Radeon RX 6950 XT | |
| NVIDIA GeForce RTX 3080 12 GB | |
| AMD Radeon RX 6900 XT | |
| NVIDIA Titan RTX | |
| 1024x600 Normal, Fluid 3DTex | |
| NVIDIA GeForce RTX 4090 | |
| AMD Radeon RX 6950 XT | |
| NVIDIA GeForce RTX 3090 | |
| AMD Radeon RX 6900 XT | |
| NVIDIA GeForce RTX 3080 12 GB | |
| NVIDIA Titan RTX | |
| 1024x600 Normal, Score | |
| NVIDIA GeForce RTX 4090 | |
| NVIDIA GeForce RTX 3090 | |
| AMD Radeon RX 6950 XT | |
| NVIDIA GeForce RTX 3080 12 GB | |
| AMD Radeon RX 6900 XT | |
| NVIDIA Titan RTX | |
| LuxMark v2.0 64Bit | |
| Sala GPUs-only | |
| AMD Radeon RX 6950 XT | |
| AMD Radeon RX 6900 XT | |
| NVIDIA GeForce RTX 4090 | |
| NVIDIA GeForce RTX 3090 | |
| NVIDIA GeForce RTX 3080 12 GB | |
| NVIDIA Titan RTX | |
| Room GPUs-only | |
| NVIDIA GeForce RTX 4090 | |
| NVIDIA GeForce RTX 3090 | |
| NVIDIA GeForce RTX 3080 12 GB | |
| AMD Radeon RX 6950 XT | |
| AMD Radeon RX 6900 XT | |
| NVIDIA Titan RTX | |
| Blender - v3.3 Classroom CUDA | |
| NVIDIA Titan RTX | |
| Geekbench 5.5 | |
| OpenCL Score | |
| NVIDIA GeForce RTX 4090 | |
| NVIDIA GeForce RTX 3090 Ti | |
| NVIDIA GeForce RTX 3090 | |
| NVIDIA GeForce RTX 3080 12 GB | |
| AMD Radeon RX 6950 XT | |
| AMD Radeon RX 6900 XT | |
| NVIDIA Titan RTX | |
| Vulkan Score 5.5 | |
| NVIDIA GeForce RTX 3090 Ti | |
| NVIDIA GeForce RTX 4090 | |
| NVIDIA Titan RTX | |
| NVIDIA GeForce RTX 3090 | |
| AMD Radeon RX 6900 XT | |
| AMD Radeon RX 6950 XT | |
| NVIDIA GeForce RTX 3080 12 GB | |
| V-Ray 5 Benchmark | |
| GPU CUDA | |
| NVIDIA GeForce RTX 4090 | |
| NVIDIA GeForce RTX 3090 | |
| NVIDIA GeForce RTX 3080 12 GB | |
| AMD Radeon RX 6950 XT | |
| GPU RTX | |
| NVIDIA GeForce RTX 4090 | |
| NVIDIA GeForce RTX 3090 | |
* ... smaller is better
Gaming benchmarks
The Palit GeForce RTX 4090 GameRock OC performs very well not only in synthetic benchmarks but in gaming tests as well. Gains of as much as 50 to 60 percent are a piece of cake to this monster of a graphics card. Although AMD lags far behind here, the new AMD Radeon RX 7900 XTX is already in the starting blocks.
For a fair comparison, we have also tested the Palit GeForce RTX 4090 GameRock OC with the Intel Core i9-13900K. Here it is possible to extract a little more performance from the graphics card. Once more, this confirms that Intel's Core i9-13900K currently offers the fastest gaming CPU solution. The performance when paired with an AMD Ryzen 9 7950X is nothing to sneeze at. However, if the goal is to squeeze every last frame per second from the graphics card, there's currently no getting around an Intel platform. A 4K display should be used due to the enormous power of the Palit GeForce RTX 4090 GameRock OC. Even at this high resolution, we sometimes reached the CPU's limits which somewhat slows down the GPU. Currently, there are only a few games, for example Cyberpunk 2077, F1 2022 or The Quarry which really make the GeForce RTX 4090 break sweat in 4K. With features such as DLSS this can be counteracted so that three digit frame rates can also be achieved here. We determined all benchmark results using Nvidia's DLSS.
The new DLSS 3.0 which is based on DLSS 2.0 and is expanded with the Frame Generation (FG) feature set, drastically helps increase frame rates. THe most famous game to benefit from this is Cyberpunk 2077. In native 4K resolution and the Ray Tracing Ultra Preset even the GeForce RTX 4090 hovers around an average of only 43 frames per second. By activating DLSS over 100 frames per second are possible which nearly triples the performance. DLSS 3.0 relies on the fourth generation Tensor Core which is currently only used in the RTX 4000 series. A list of games which either already support DLSS 3.0 or will be supported with this feature in future can be found here:
| GTA V - 3840x2160 High/On (Advanced Graphics Off) AA:FX AF:8x | |
| NVIDIA GeForce RTX 4090, AMD Ryzen 9 7950X | |
| NVIDIA GeForce RTX 3090 Ti, AMD Ryzen 7 5800X3D | |
| NVIDIA GeForce RTX 3090, AMD Ryzen 9 7950X | |
| AMD Radeon RX 6950 XT, AMD Ryzen 9 5900X | |
| NVIDIA GeForce RTX 3080 12 GB, AMD Ryzen 9 5900X | |
| NVIDIA Titan RTX, AMD Ryzen 9 7950X | |
| The Witcher 3 - 3840x2160 High Graphics & Postprocessing (Nvidia HairWorks Off) | |
| NVIDIA GeForce RTX 4090, AMD Ryzen 9 7950X | |
| NVIDIA GeForce RTX 3090 Ti, AMD Ryzen 7 5800X3D | |
| NVIDIA GeForce RTX 3090, AMD Ryzen 9 7950X | |
| AMD Radeon RX 6950 XT, AMD Ryzen 9 5900X | |
| NVIDIA GeForce RTX 3080 12 GB, AMD Ryzen 9 5900X | |
| AMD Radeon RX 6900 XT, AMD Ryzen 9 5950X | |
| NVIDIA Titan RTX, AMD Ryzen 9 7950X | |
| Final Fantasy XV Benchmark - 3840x2160 High Quality | |
| NVIDIA GeForce RTX 4090, AMD Ryzen 9 7950X | |
| NVIDIA GeForce RTX 3090 Ti, AMD Ryzen 7 5800X3D | |
| NVIDIA GeForce RTX 3090, AMD Ryzen 9 7950X | |
| AMD Radeon RX 6950 XT, AMD Ryzen 9 5900X | |
| NVIDIA GeForce RTX 3080 12 GB, AMD Ryzen 9 5900X | |
| NVIDIA Titan RTX, AMD Ryzen 9 7950X | |
| Strange Brigade - 3840x2160 ultra AA:ultra AF:16 | |
| NVIDIA GeForce RTX 4090, AMD Ryzen 9 7950X | |
| AMD Radeon RX 6950 XT, AMD Ryzen 9 5900X | |
| NVIDIA GeForce RTX 3090, AMD Ryzen 9 7950X | |
| NVIDIA GeForce RTX 3080 12 GB, AMD Ryzen 9 5900X | |
| NVIDIA Titan RTX, AMD Ryzen 9 7950X | |
| Far Cry 5 - 3840x2160 Ultra Preset AA:T | |
| NVIDIA GeForce RTX 4090, AMD Ryzen 9 7950X | |
| AMD Radeon RX 6950 XT, AMD Ryzen 9 5900X | |
| NVIDIA GeForce RTX 3090, AMD Ryzen 9 7950X | |
| NVIDIA GeForce RTX 3080 12 GB, AMD Ryzen 9 5900X | |
| NVIDIA Titan RTX, AMD Ryzen 9 7950X | |
| Far Cry New Dawn - 3840x2160 Ultra Preset | |
| NVIDIA GeForce RTX 4090, AMD Ryzen 9 7950X | |
| AMD Radeon RX 6950 XT, AMD Ryzen 9 5900X | |
| NVIDIA GeForce RTX 3090, AMD Ryzen 9 7950X | |
| AMD Radeon RX 6900 XT, AMD Ryzen 9 5950X | |
| NVIDIA GeForce RTX 3080 12 GB, AMD Ryzen 9 5900X | |
| NVIDIA Titan RTX, AMD Ryzen 9 7950X | |
| Far Cry 6 - 3840x2160 Ultra Graphics Quality + HD Textures AA:T | |
| NVIDIA GeForce RTX 4090, AMD Ryzen 9 7950X | |
| NVIDIA GeForce RTX 3090 Ti, AMD Ryzen 7 5800X3D | |
| AMD Radeon RX 6950 XT, AMD Ryzen 9 5900X | |
| NVIDIA GeForce RTX 3090, AMD Ryzen 9 7950X | |
| NVIDIA Titan RTX, AMD Ryzen 9 7950X | |
| NVIDIA GeForce RTX 3080 12 GB, AMD Ryzen 9 5900X | |
| Metro Exodus - 3840x2160 Ultra Quality AF:16x | |
| NVIDIA GeForce RTX 4090, AMD Ryzen 9 7950X | |
| NVIDIA GeForce RTX 3090 Ti, AMD Ryzen 7 5800X3D | |
| NVIDIA GeForce RTX 3090, AMD Ryzen 9 7950X | |
| AMD Radeon RX 6950 XT, AMD Ryzen 9 5900X | |
| AMD Radeon RX 6900 XT, AMD Ryzen 9 5950X | |
| NVIDIA GeForce RTX 3080 12 GB, AMD Ryzen 9 5900X | |
| NVIDIA Titan RTX, AMD Ryzen 9 7950X | |
| F1 2020 - 3840x2160 Ultra High Preset AA:T AF:16x | |
| NVIDIA GeForce RTX 4090, AMD Ryzen 9 7950X | |
| AMD Radeon RX 6950 XT, AMD Ryzen 9 5900X | |
| NVIDIA GeForce RTX 3090, AMD Ryzen 9 7950X | |
| AMD Radeon RX 6900 XT, AMD Ryzen 9 5950X | |
| AMD Radeon RX 6900 XT, AMD Ryzen 9 5950X | |
| NVIDIA GeForce RTX 3080 12 GB, AMD Ryzen 9 5900X | |
| NVIDIA Titan RTX, AMD Ryzen 9 7950X | |
| F1 2021 - 3840x2160 Ultra High Preset + Raytracing AA:T AF:16x | |
| NVIDIA GeForce RTX 4090, AMD Ryzen 9 7950X | |
| NVIDIA GeForce RTX 3090 Ti, AMD Ryzen 7 5800X3D | |
| NVIDIA GeForce RTX 3090, AMD Ryzen 9 7950X | |
| AMD Radeon RX 6950 XT, AMD Ryzen 9 5900X | |
| NVIDIA GeForce RTX 3080 12 GB, AMD Ryzen 9 5900X | |
| NVIDIA Titan RTX, AMD Ryzen 9 7950X | |
| F1 22 - 3840x2160 Ultra High Preset AA:T AF:16x | |
| NVIDIA GeForce RTX 4090, AMD Ryzen 9 7950X | |
| NVIDIA GeForce RTX 3090, AMD Ryzen 9 7950X | |
| AMD Radeon RX 6950 XT, AMD Ryzen 9 5900X | |
| NVIDIA Titan RTX, AMD Ryzen 9 7950X | |
| Borderlands 3 - 3840x2160 Badass Overall Quality (DX11) | |
| NVIDIA GeForce RTX 4090, AMD Ryzen 9 7950X | |
| NVIDIA GeForce RTX 3090 Ti, AMD Ryzen 7 5800X3D | |
| NVIDIA GeForce RTX 3090, AMD Ryzen 9 7950X | |
| NVIDIA GeForce RTX 3080 12 GB, AMD Ryzen 9 5900X | |
| AMD Radeon RX 6950 XT, AMD Ryzen 9 5900X | |
| AMD Radeon RX 6900 XT, AMD Ryzen 9 5950X | |
| AMD Radeon RX 6900 XT, AMD Ryzen 9 5950X | |
| NVIDIA Titan RTX, AMD Ryzen 9 7950X | |
| Cyberpunk 2077 1.6 - 3840x2160 Ultra Preset | |
| NVIDIA GeForce RTX 4090, AMD Ryzen 9 7950X | |
| NVIDIA GeForce RTX 3090 Ti, AMD Ryzen 7 5800X3D | |
| AMD Radeon RX 6950 XT, AMD Ryzen 9 5900X | |
Palit GeForce RTX 4090 GameRock OC with Ryzen 9 vs. Core i9
| Performance rating - Percent | |
| Palit GeForce RTX 4090 GameRock OC -1! | |
| Palit GeForce RTX 4090 GameRock OC | |
| GTA V - 3840x2160 Highest AA:4xMSAA + FX AF:16x | |
| Palit GeForce RTX 4090 GameRock OC | |
| Palit GeForce RTX 4090 GameRock OC | |
| The Witcher 3 - 3840x2160 Ultra Graphics & Postprocessing (HBAO+) | |
| Palit GeForce RTX 4090 GameRock OC | |
| Palit GeForce RTX 4090 GameRock OC | |
| Dota 2 Reborn - 3840x2160 ultra (3/3) best looking | |
| Palit GeForce RTX 4090 GameRock OC | |
| Palit GeForce RTX 4090 GameRock OC | |
| Final Fantasy XV Benchmark - 3840x2160 High Quality | |
| Palit GeForce RTX 4090 GameRock OC | |
| Palit GeForce RTX 4090 GameRock OC | |
| X-Plane 11.11 - 3840x2160 high (fps_test=3) | |
| Palit GeForce RTX 4090 GameRock OC | |
| Palit GeForce RTX 4090 GameRock OC | |
| Shadow of the Tomb Raider - 3840x2160 Highest Preset AA:T | |
| Palit GeForce RTX 4090 GameRock OC | |
| Palit GeForce RTX 4090 GameRock OC | |
| Far Cry 5 - 3840x2160 Ultra Preset AA:T | |
| Palit GeForce RTX 4090 GameRock OC | |
| Palit GeForce RTX 4090 GameRock OC | |
| Far Cry New Dawn - 3840x2160 Ultra Preset | |
| Palit GeForce RTX 4090 GameRock OC | |
| Palit GeForce RTX 4090 GameRock OC | |
| Far Cry 6 - 3840x2160 Ultra Graphics Quality + HD Textures AA:T | |
| Palit GeForce RTX 4090 GameRock OC | |
| Palit GeForce RTX 4090 GameRock OC | |
| GRID Legends - 3840x2160 Ultra Preset | |
| Palit GeForce RTX 4090 GameRock OC | |
| Palit GeForce RTX 4090 GameRock OC | |
| Metro Exodus - 3840x2160 Ultra Quality AF:16x | |
| Palit GeForce RTX 4090 GameRock OC | |
| Palit GeForce RTX 4090 GameRock OC | |
| Forza Horizon 5 - 3840x2160 Extreme Preset | |
| Palit GeForce RTX 4090 GameRock OC | |
| F1 2020 - 3840x2160 Ultra High Preset AA:T AF:16x | |
| Palit GeForce RTX 4090 GameRock OC | |
| Palit GeForce RTX 4090 GameRock OC | |
| F1 2021 - 3840x2160 Ultra High Preset + Raytracing AA:T AF:16x | |
| Palit GeForce RTX 4090 GameRock OC | |
| Palit GeForce RTX 4090 GameRock OC | |
| F1 22 - 3840x2160 Ultra High Preset AA:T AF:16x | |
| Palit GeForce RTX 4090 GameRock OC | |
| Palit GeForce RTX 4090 GameRock OC | |
| Borderlands 3 - 3840x2160 Badass Overall Quality (DX11) | |
| Palit GeForce RTX 4090 GameRock OC | |
| Palit GeForce RTX 4090 GameRock OC | |
| Tiny Tina's Wonderlands - 3840x2160 Badass Preset (DX12) | |
| Palit GeForce RTX 4090 GameRock OC | |
| Palit GeForce RTX 4090 GameRock OC | |
| God of War - 3840x2160 Ultra Preset | |
| Palit GeForce RTX 4090 GameRock OC | |
| Palit GeForce RTX 4090 GameRock OC | |
| The Quarry - 3840x2160 Ultra Preset | |
| Palit GeForce RTX 4090 GameRock OC | |
| Palit GeForce RTX 4090 GameRock OC | |
| Cyberpunk 2077 1.6 | |
| 3840x2160 Ray Tracing Ultra Preset (DLSS off) | |
| Palit GeForce RTX 4090 GameRock OC | |
| Palit GeForce RTX 4090 GameRock OC | |
| 3840x2160 Ultra Preset | |
| Palit GeForce RTX 4090 GameRock OC | |
| Palit GeForce RTX 4090 GameRock OC | |
| low | med. | high | ultra | QHD | 4K DLSS | 4K | |
|---|---|---|---|---|---|---|---|
| GTA V (2015) | 188.2 | 187.9 | 187.4 | 162 | 164.8 | 187.5 | |
| The Witcher 3 (2015) | 826 | 747 | 642 | 320 | 284 | ||
| Dota 2 Reborn (2015) | 310.6 | 276 | 262.9 | 239.2 | 234.4 | ||
| Rise of the Tomb Raider (2016) | 494 | 403 | 379 | 378 | 239 | ||
| Final Fantasy XV Benchmark (2018) | 236 | 233 | 233 | 225 | 161.1 | ||
| X-Plane 11.11 (2018) | 223 | 196.3 | 151.6 | 124.5 | |||
| Far Cry 5 (2018) | 238 | 209 | 200 | 188 | 185 | 175 | |
| Strange Brigade (2018) | 698 | 575 | 570 | 565 | 512 | 281 | |
| Shadow of the Tomb Raider (2018) | 332 | 325 | 323 | 304 | 279 | 186 | |
| Far Cry New Dawn (2019) | 200 | 177 | 171 | 154 | 152 | 145 | |
| Metro Exodus (2019) | 300 | 265 | 234 | 201 | 185.8 | 139.7 | |
| Anno 1800 (2019) | 211 | 199.3 | 143.1 | 73.6 | 72.8 | 66.9 | |
| Control (2019) | 240 | 240 | 240 | 219 | 113.3 | ||
| Borderlands 3 (2019) | 242 | 216 | 200 | 186.8 | 186 | 135 | |
| F1 2020 (2020) | 563 | 475 | 471 | 412 | 407 | 286 | |
| Crysis Remastered (2020) | 491 | 446 | 327 | 284 | 231 | 147.3 | |
| Mafia Definitive Edition (2020) | 292 | 266 | 237 | 226 | 162.7 | ||
| Watch Dogs Legion (2020) | 184.6 | 178.7 | 160.3 | 149.7 | 146.5 | 116.7 | |
| Dirt 5 (2020) | 385.7 | 356.1 | 333.8 | 325.7 | 287.4 | 190.4 | |
| F1 2021 (2021) | 677 | 642 | 529 | 271 | 263 | 199.1 | |
| New World (2021) | 215 | 188 | 183.5 | 175.3 | 174.8 | 149.3 | |
| Far Cry 6 (2021) | 209 | 189.4 | 169.5 | 173.9 | 168.4 | 136.9 | |
| Riders Republic (2021) | 318 | 309 | 292 | 279 | 229 | 149 | |
| Forza Horizon 5 (2021) | 411 | 302 | 283 | 208 | 197 | 162 | |
| God of War (2022) | 278 | 276 | 269 | 212 | 179.5 | 130.1 | |
| GRID Legends (2022) | 330 | 297 | 262 | 252 | 244 | 201 | |
| Cyberpunk 2077 1.6 (2022) | 229 | 225 | 215 | 207 | 149.6 | 78 | |
| Ghostwire Tokyo (2022) | 284 | 281 | 280 | 277 | 277 | 163.4 | |
| Tiny Tina's Wonderlands (2022) | 428 | 354 | 311 | 289 | 229 | 130.3 | |
| Vampire Bloodhunt (2022) | 460 | 398 | 394 | 382 | 374 | 254 | |
| F1 22 (2022) | 443 | 414 | 414 | 194.5 | 157.5 | 82.5 | |
| The Quarry (2022) | 427 | 337 | 290 | 256 | 193.8 | 75.4 | |
| FIFA 23 (2022) | 276 | 273 | 270 | 267 | 248 | 245 | |
| A Plague Tale Requiem (2022) | 179.6 | 173.6 | 167.9 | 154.3 | 125.8 | 73.7 | |
| Uncharted Legacy of Thieves Collection (2022) | 146.3 | 145.5 | 144.5 | 143.7 | 143.6 | 100.7 | |
| Call of Duty Modern Warfare 2 2022 (2022) | 304 | 287 | 245 | 240 | 191 | 183 | 128 |
| Spider-Man Miles Morales (2022) | 208 | 198.9 | 174.5 | 175.4 | 174.4 | 130.8 | |
| The Callisto Protocol (2022) | 229 | 222 | 202 | 201 | 183 | 127 | |
| Need for Speed Unbound (2022) | 178.2 | 171.1 | 154.3 | 153.7 | 152.8 | 146.3 | |
| High On Life (2023) | 388 | 357 | 307 | 293 | 224 | 106.6 | |
| The Witcher 3 v4 (2023) | 289 | 255 | 229 | 212 | 212 | 164.2 | |
| Dead Space Remake (2023) | 266 | 265 | 246 | 248 | 199.7 | 106.5 | |
| Hogwarts Legacy (2023) | 162.1 | 142.9 | 129.6 | 121.5 | 120.3 | 86 | |
| Returnal (2023) | 214 | 212 | 208 | 201 | 174 | 109 | |
| Atomic Heart (2023) | 316 | 251 | 234 | 223 | 181.6 | 110.9 | |
| Company of Heroes 3 (2023) | 383.1 | 364 | 344.8 | 330.8 | 302.8 | 205.7 | |
| Sons of the Forest (2023) | 133.3 | 126.3 | 122.3 | 120.7 | 118 | 114.2 | |
| Resident Evil 4 Remake (2023) | 287 | 303 | 294 | 213 | 188.9 | 121.8 | |
| The Last of Us (2023) | 169.6 | 163.2 | 163 | 162.8 | 136.9 | 118.1 | 77.4 |
| Dead Island 2 (2023) | 326 | 312 | 280 | 250 | 261 | 165.1 | |
| Star Wars Jedi Survivor (2023) | 170.6 | 166.3 | 160 | 155.4 | 150.3 | 80.4 | |
| Diablo 4 (2023) | 398 | 399 | 399 | 398 | 392 | 239 | 220 |
| F1 23 (2023) | 476 | 509 | 472 | 210 | 154 | 134 | 79.6 |
| Ratchet & Clank Rift Apart (2023) | 231 | 217 | 184.7 | 153.5 | 147.1 | 108.8 | |
| Atlas Fallen (2023) | 194.9 | 192.5 | 187 | 185.4 | 184.2 | 168.4 | |
| Immortals of Aveum (2023) | 155.6 | 138.2 | 124.4 | 97.3 | 126.1 | 62.6 | |
| Armored Core 6 (2023) | 119.7 | 119.6 | 119.8 | 119.5 | 119.5 | 119.3 | |
| Starfield (2023) | 138.9 | 139.2 | 130 | 124.5 | 78.1 | ||
| Lies of P (2023) | 330 | 327 | 303 | 286 | 264 | 237 | 166.7 |
| Baldur's Gate 3 (2023) | 323 | 299 | 274 | 265 | 203 | 189.4 | 112.6 |
| Counter-Strike 2 (2023) | 351 | 340 | 339 | 340 | 312 | 202 | |
| EA Sports FC 24 (2023) | 382 | 323 | 266 | 264 | 263 | 254 | |
| Assassin's Creed Mirage (2023) | 247 | 240 | 230 | 170 | 162 | 144 | 126 |
| Total War Pharaoh (2023) | 565.7 | 348.2 | 231.3 | 187.1 | 186.2 | 158.2 | |
| Lords of the Fallen (2023) | 181.7 | 174.2 | 155 | 116 | 88.6 | 88.6 | 53.2 |
| Alan Wake 2 (2023) | 152.4 | 149.3 | 144.4 | 126.7 | 58.7 | 72.2 | |
| EA Sports WRC (2023) | 255 | 170.6 | 157.8 | 152.6 | 147.4 | 139.6 | 121 |
| Call of Duty Modern Warfare 3 2023 (2023) | 330 | 306 | 265 | 254 | 199 | 129 | |
| Avatar Frontiers of Pandora (2023) | 251 | 234 | 209 | 170 | 124 | 113 | 69 |
| The Finals (2023) | 332 | 309 | 295 | 300 | 256 | 209 | 139.2 |
| Ready or Not (2023) | 336 | 356 | 336 | 323 | 263 | 243 | 132.4 |
Palit GeForce RTX 4090 GameRock OC Emissions
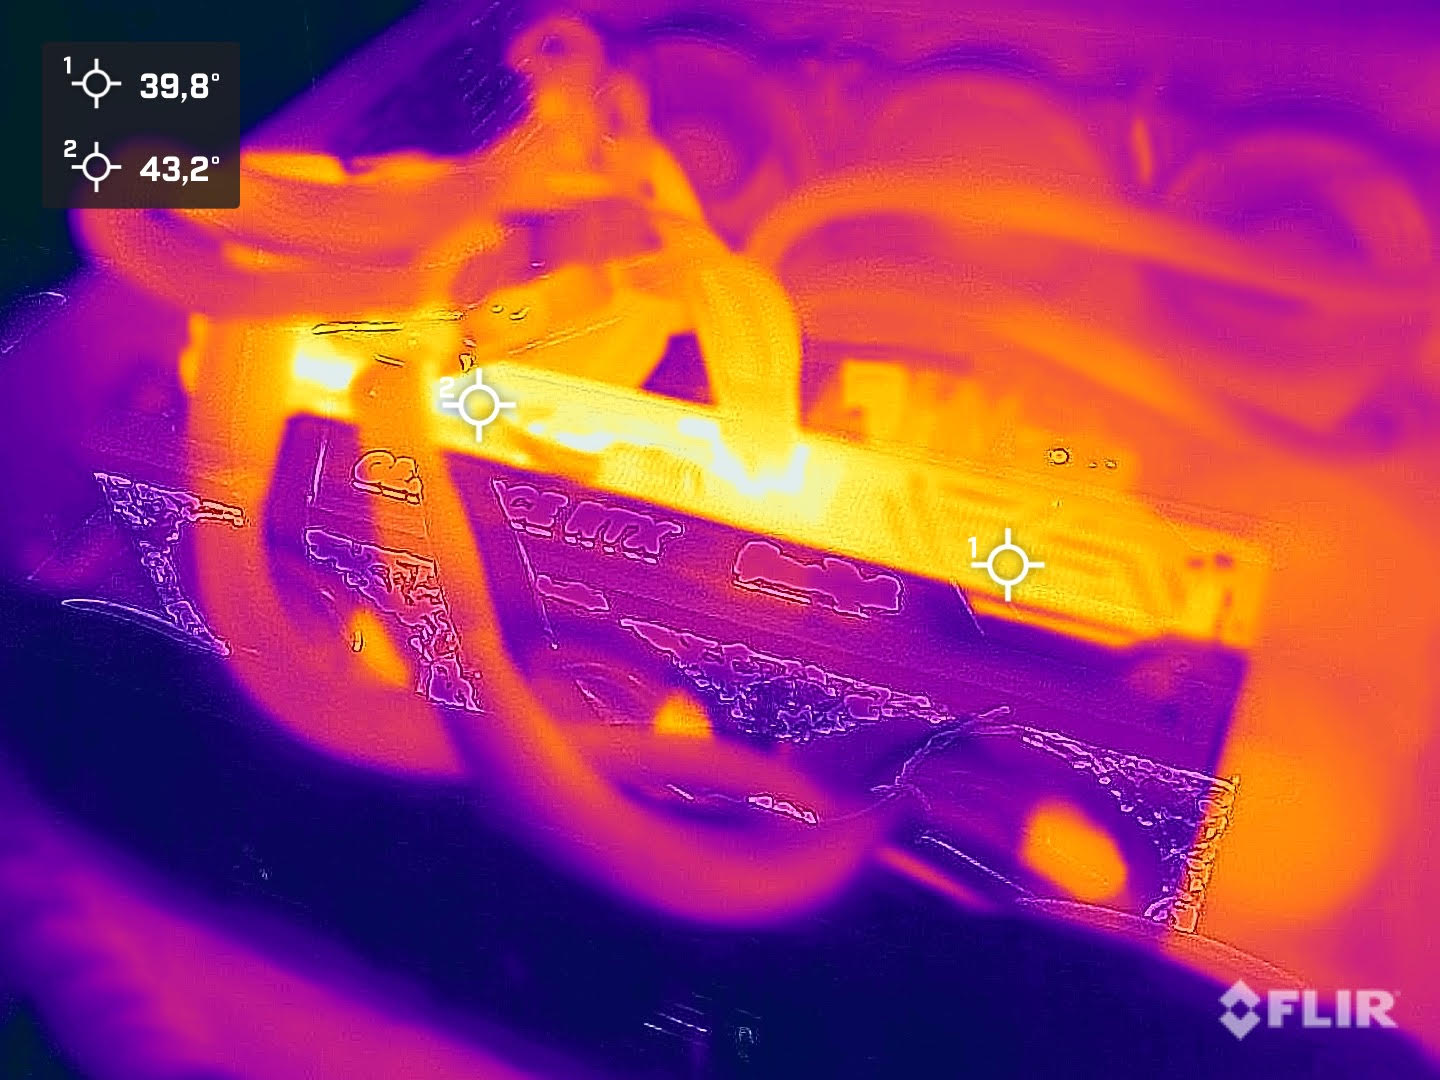
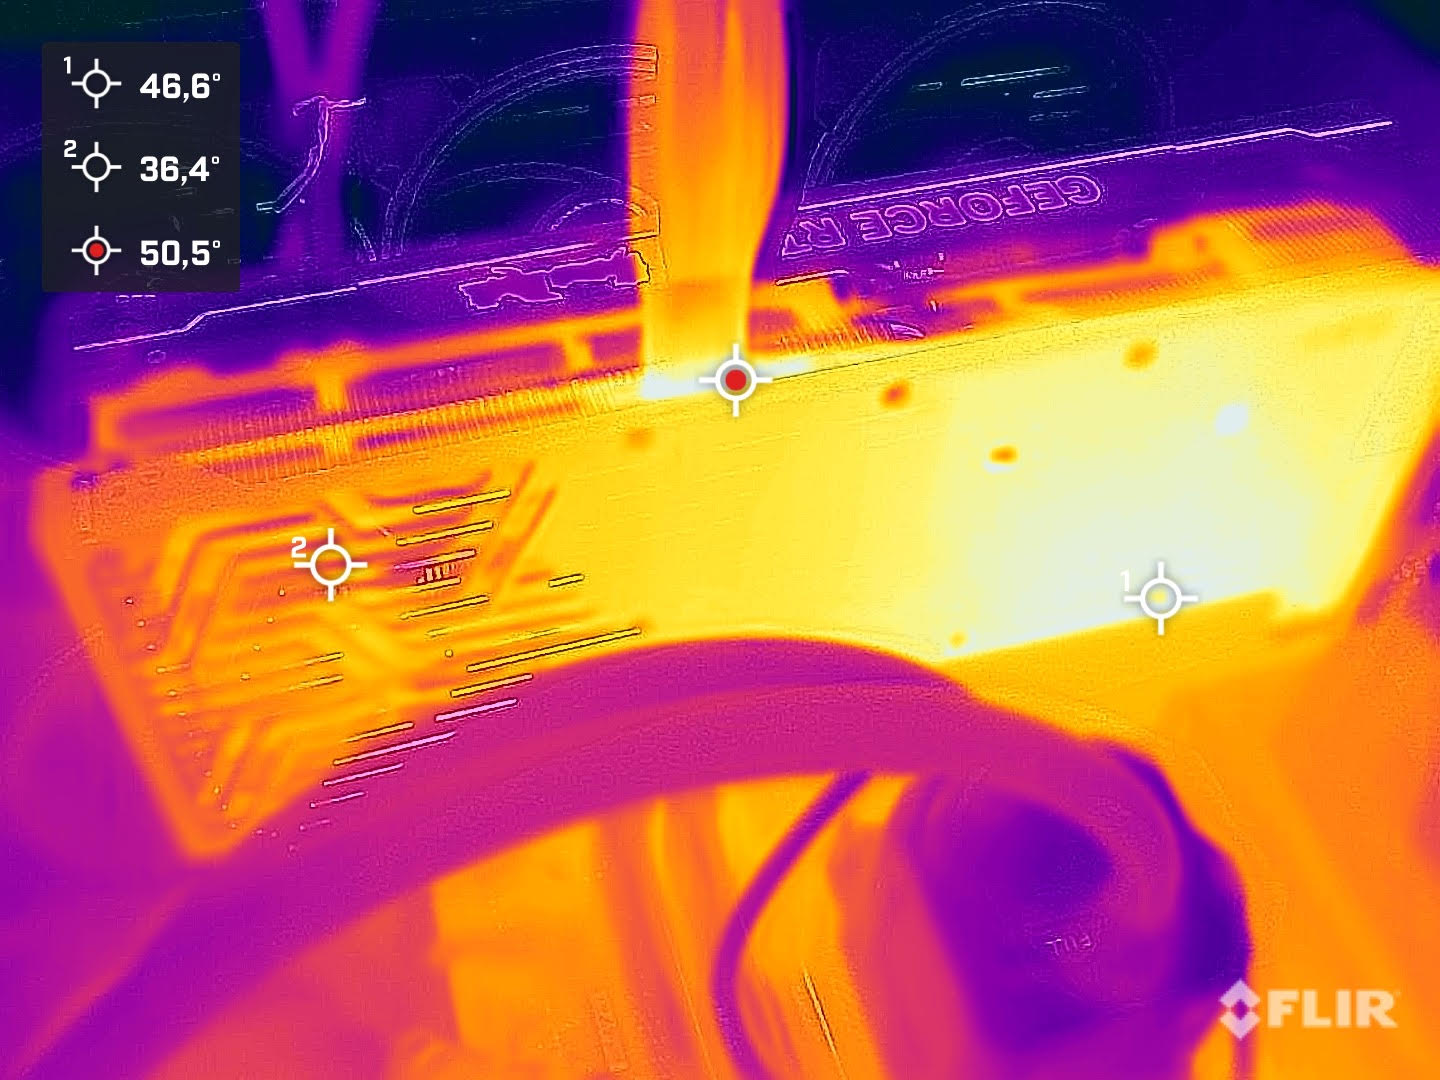
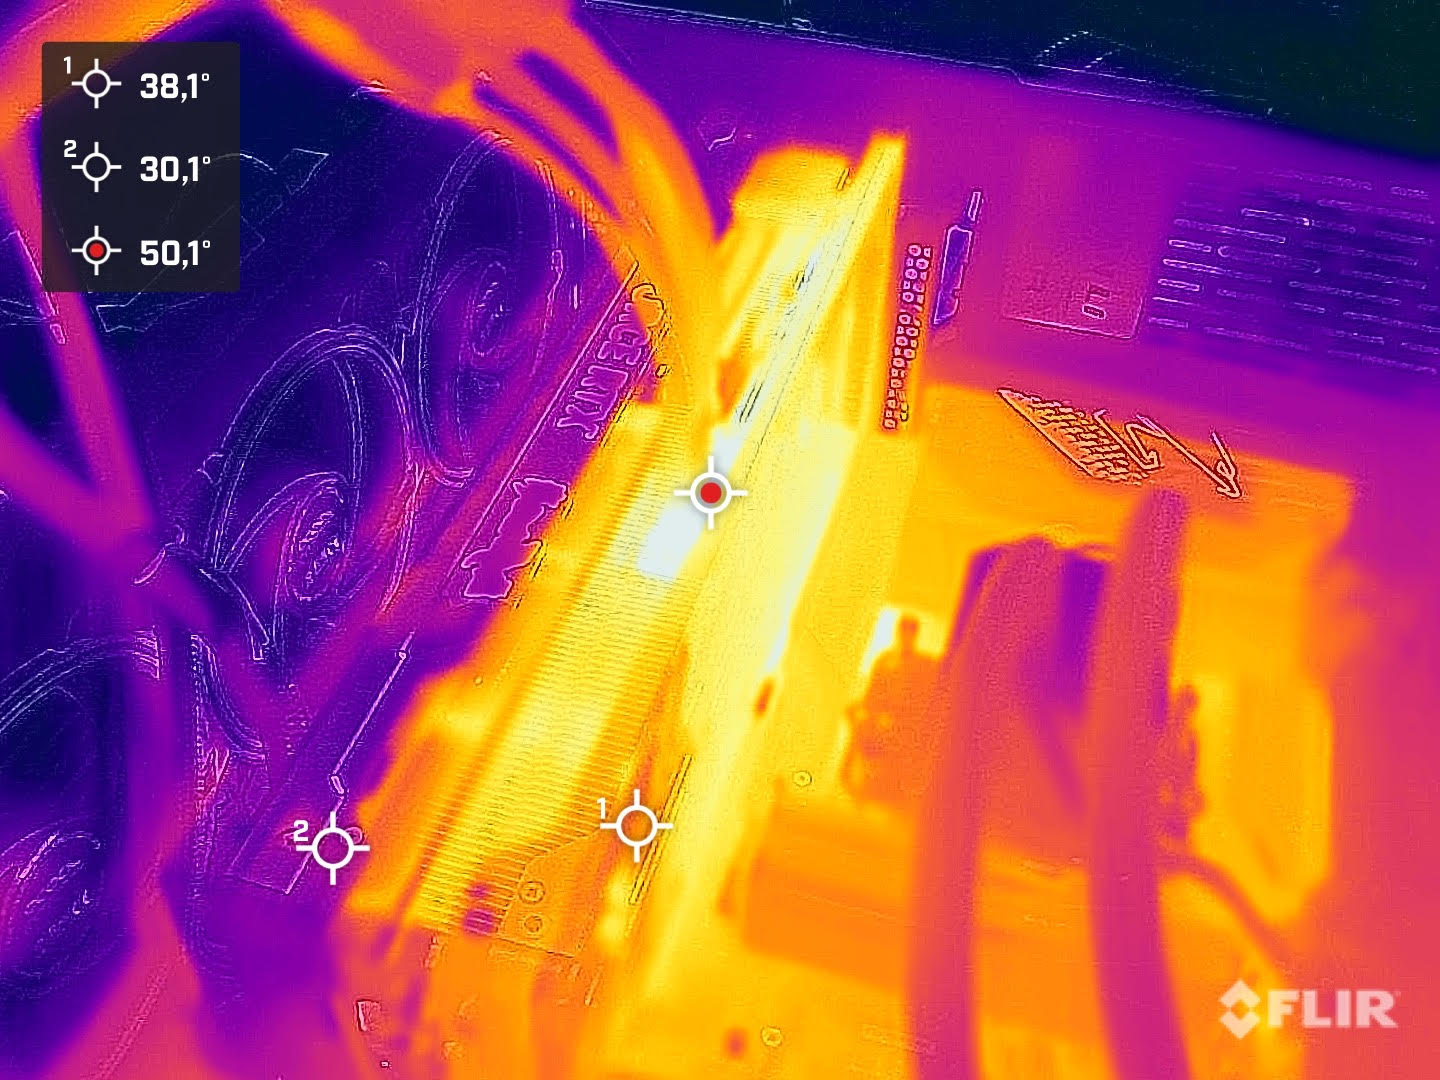
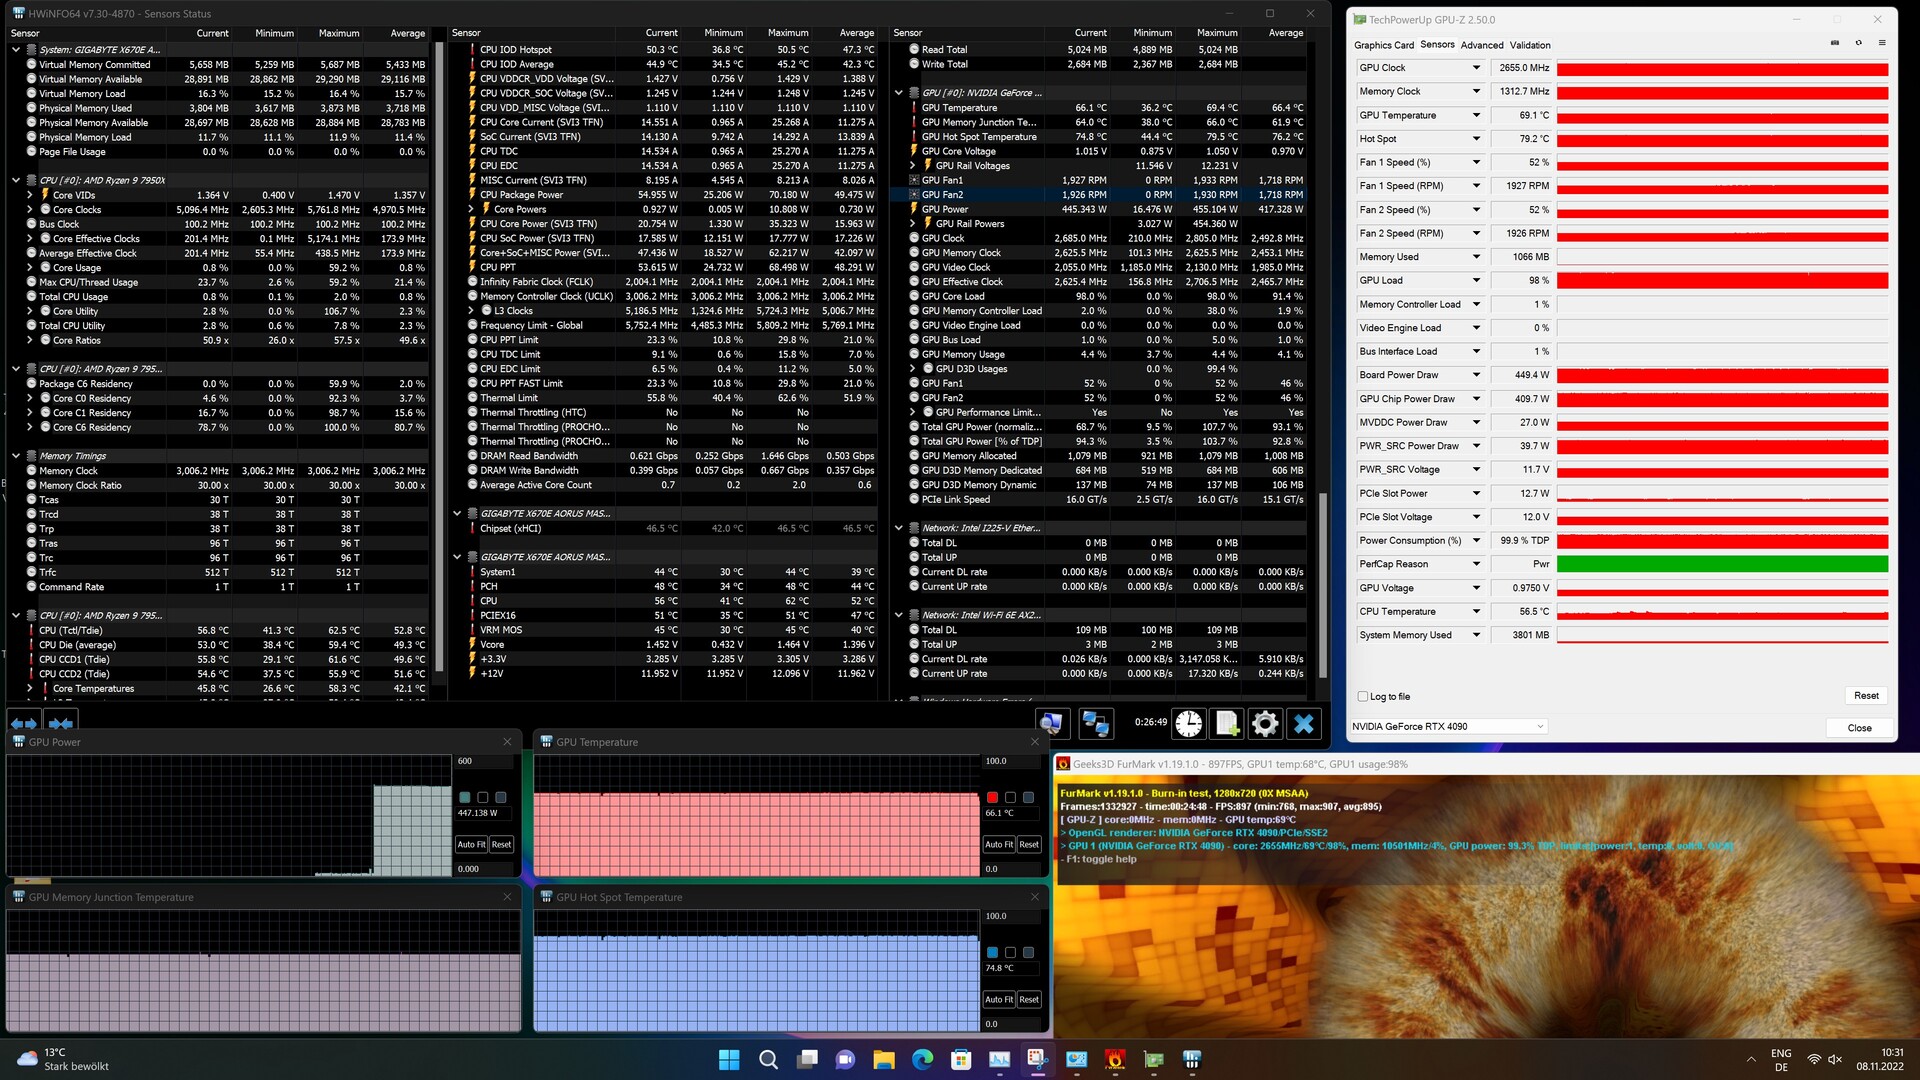
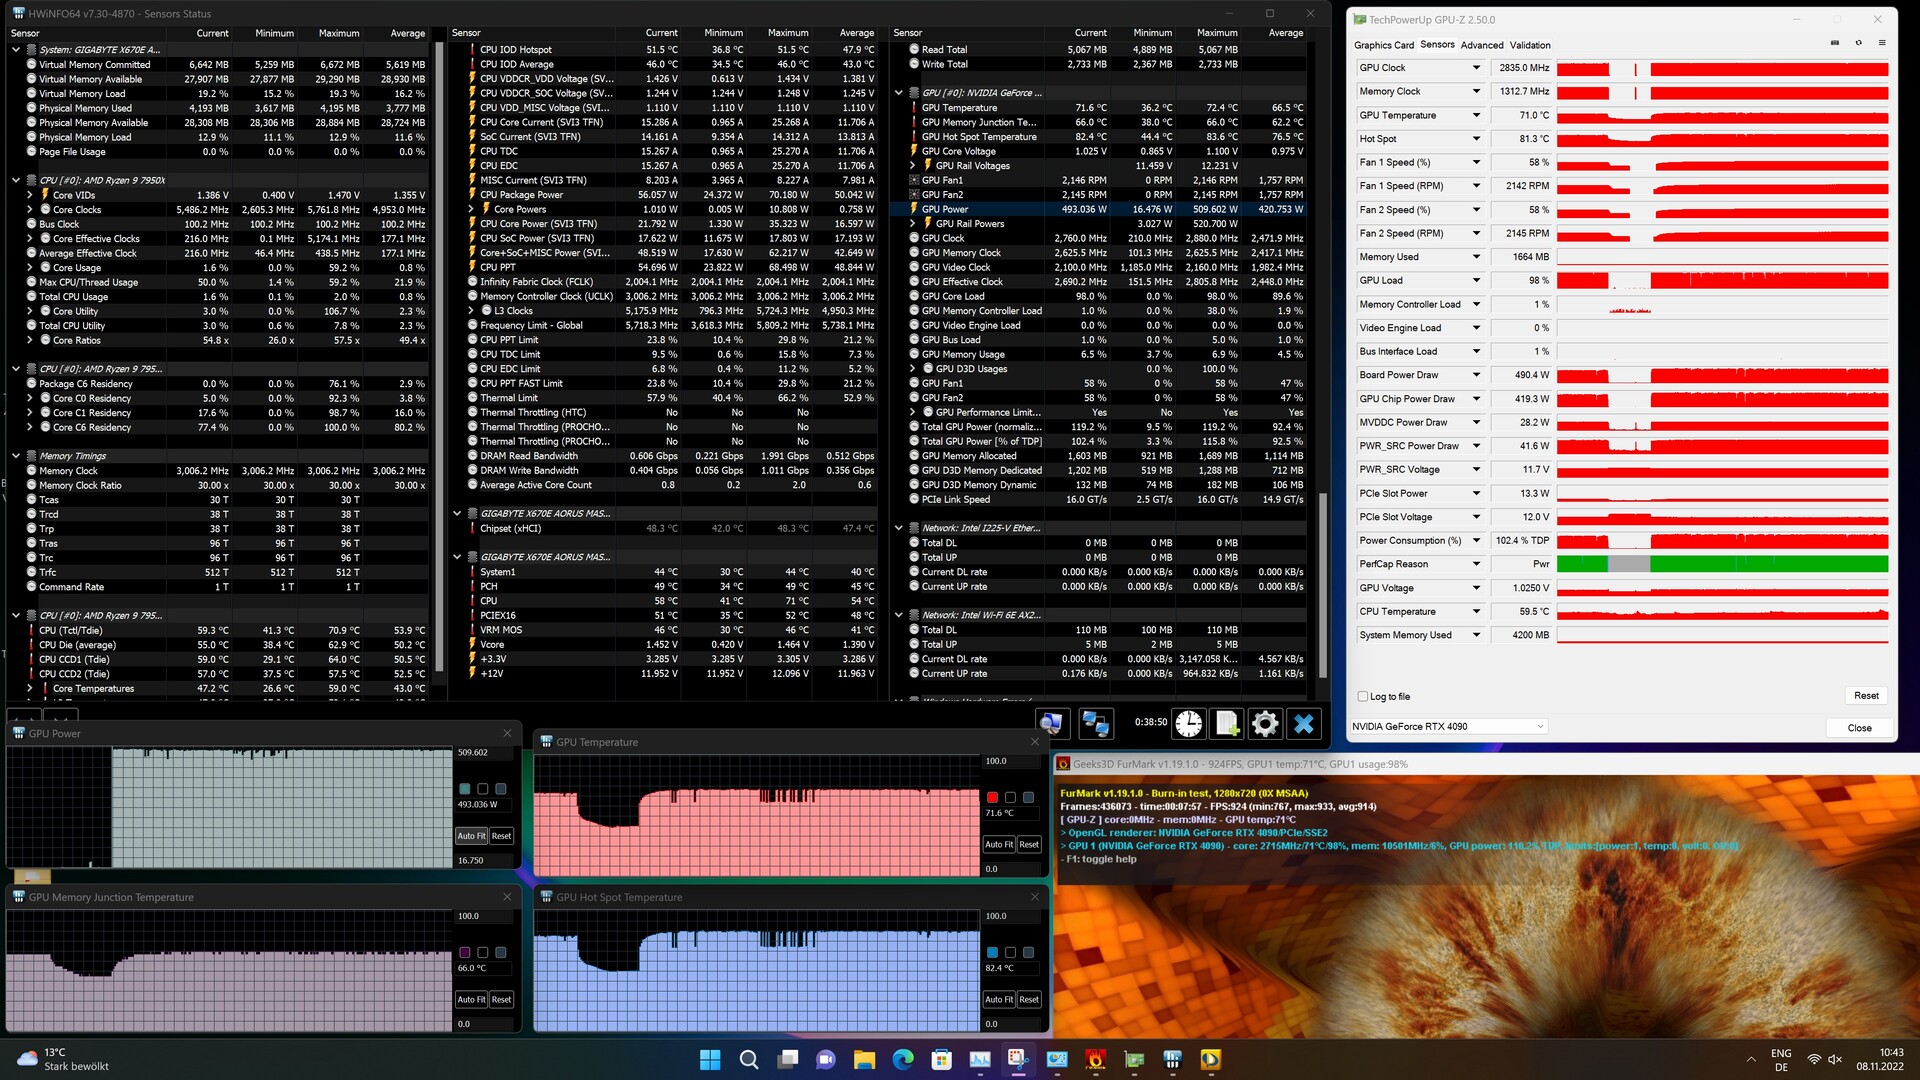
At 450 watts the Nvidia GeForce RTX 4090 is on the same level as the Nvidia GeForce RTX 3090 Ti. Nevertheless, the power consumption increases by exactly 100 watts compared to the Nvidia GeForce RTX 3090, a trend that has solidified in the last few years and we can only hope that the current limit has been reached. Anyone looking for the ultimate performance should pay little attention to the topic of power consumption. The 450 watts consumed by the Palit GeForce RTX 4090 GameRock OC during the stress test are dissipated successfully. At almost 70 °C the GPU chip stays relatively cool as well as the VRAM where we were unable to detect any temperature problems at maximum 66 °C. The power target and the CPU voltage can be increased slightly, whereby the graphics card reaches a maximum 509 watts under load. The chip temperature also increases a little as a result. The built-in fan does a good job and cools the graphics card in standard operation at approximately 2000 rpm. The graphics card can only just be heard from inside the case.
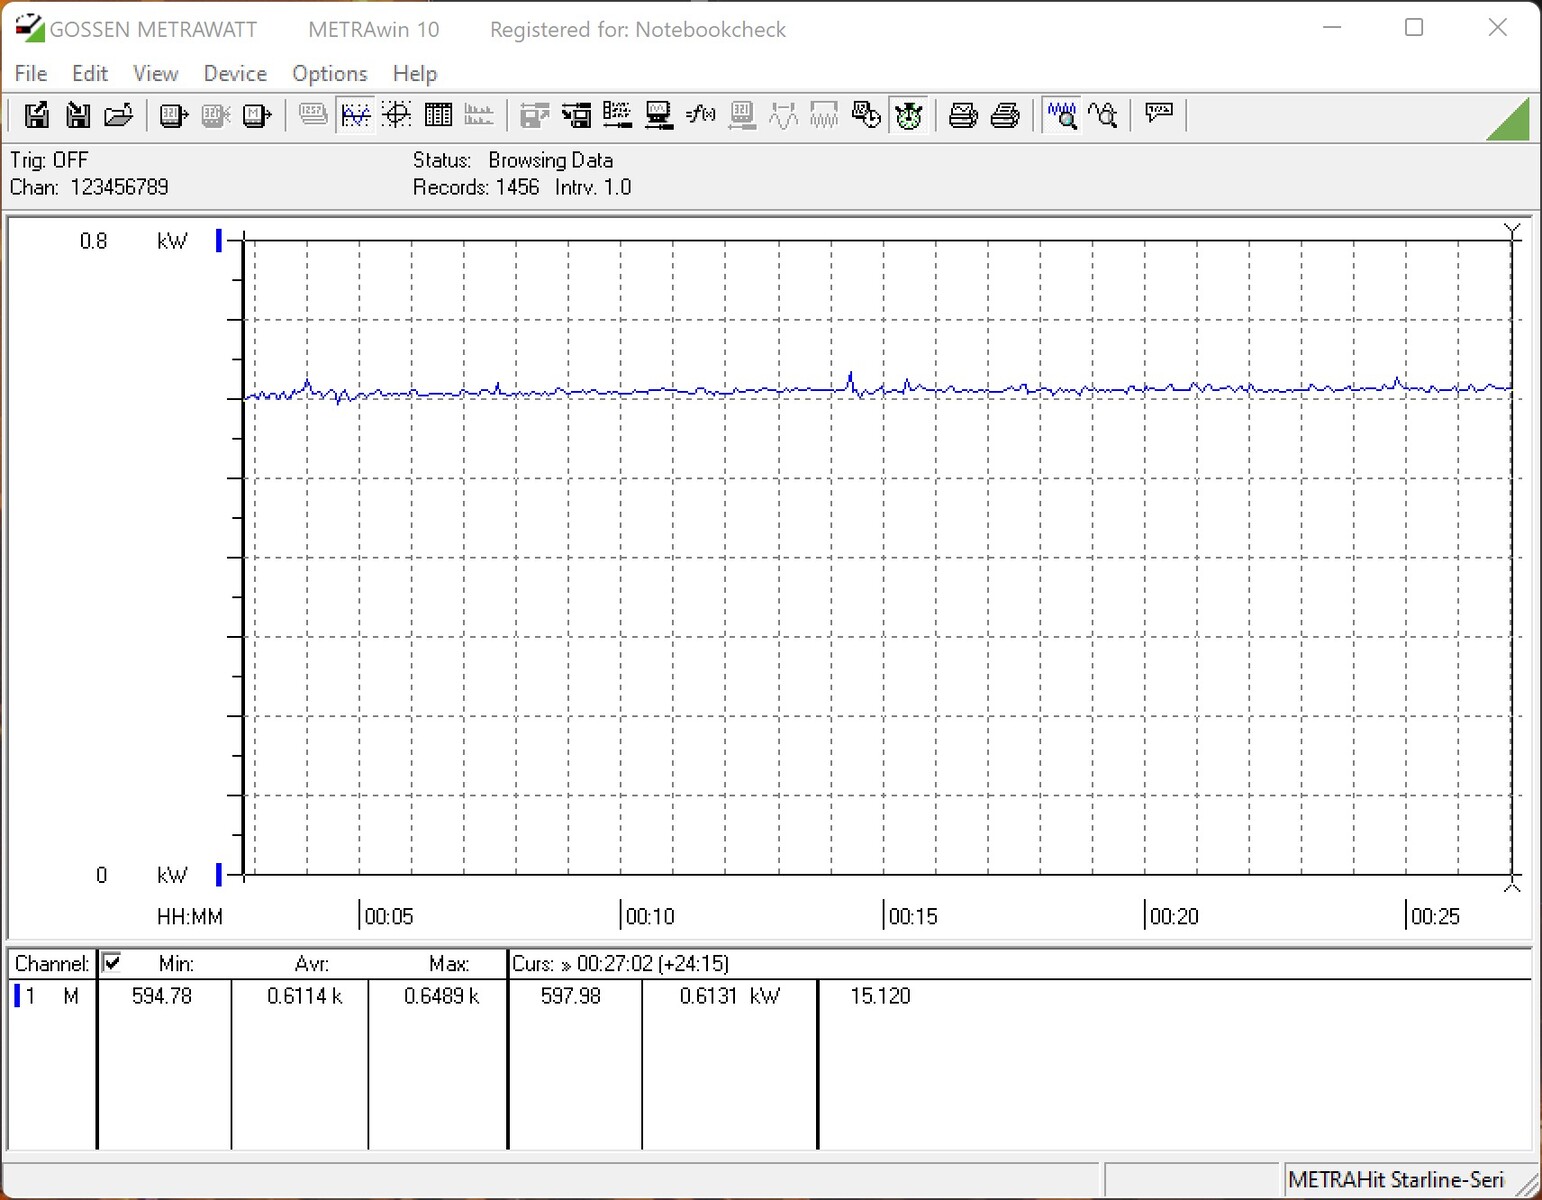
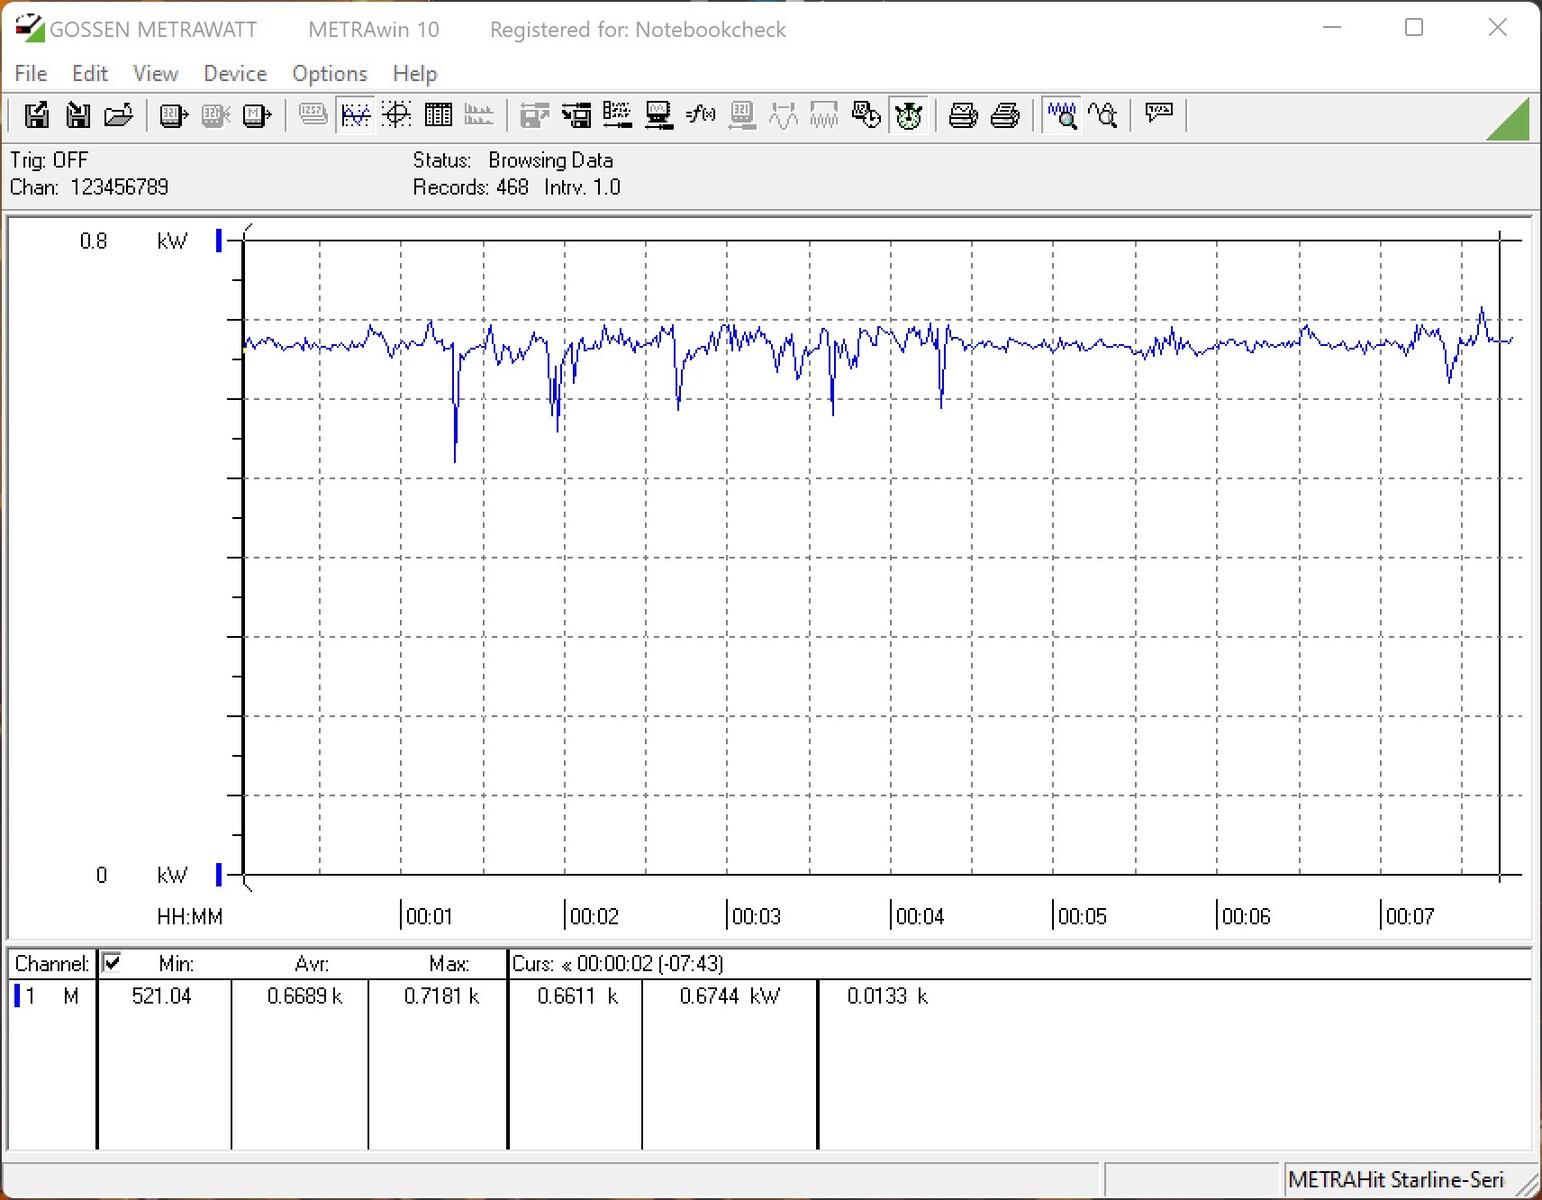
When it comes to gaming, the Palit GeForce RTX 4090 GameRock OC has no reason to hide. Here the AMD Radeon RX 6950 XT as well as the Nvidia GeForce RTX 3090 Ti require more energy. However, in this test we are close to the CPU's limits which means the GPU cannot achieve maximum performance. When comparing power consumption under the FurMark stress test, the tide turns against the Palit GeForce RTX 4090 GameRock OC. With an average of 611 watts, the power consumption of the new high end graphics cards is noticeably high. Therefore, a powerful power suppy should be used to operate the graphics card. Palit themselves recommend using a 1000 watt power supply, the likes of which we used during testing. In all tests and benchmarks there were no problems with the power supply.
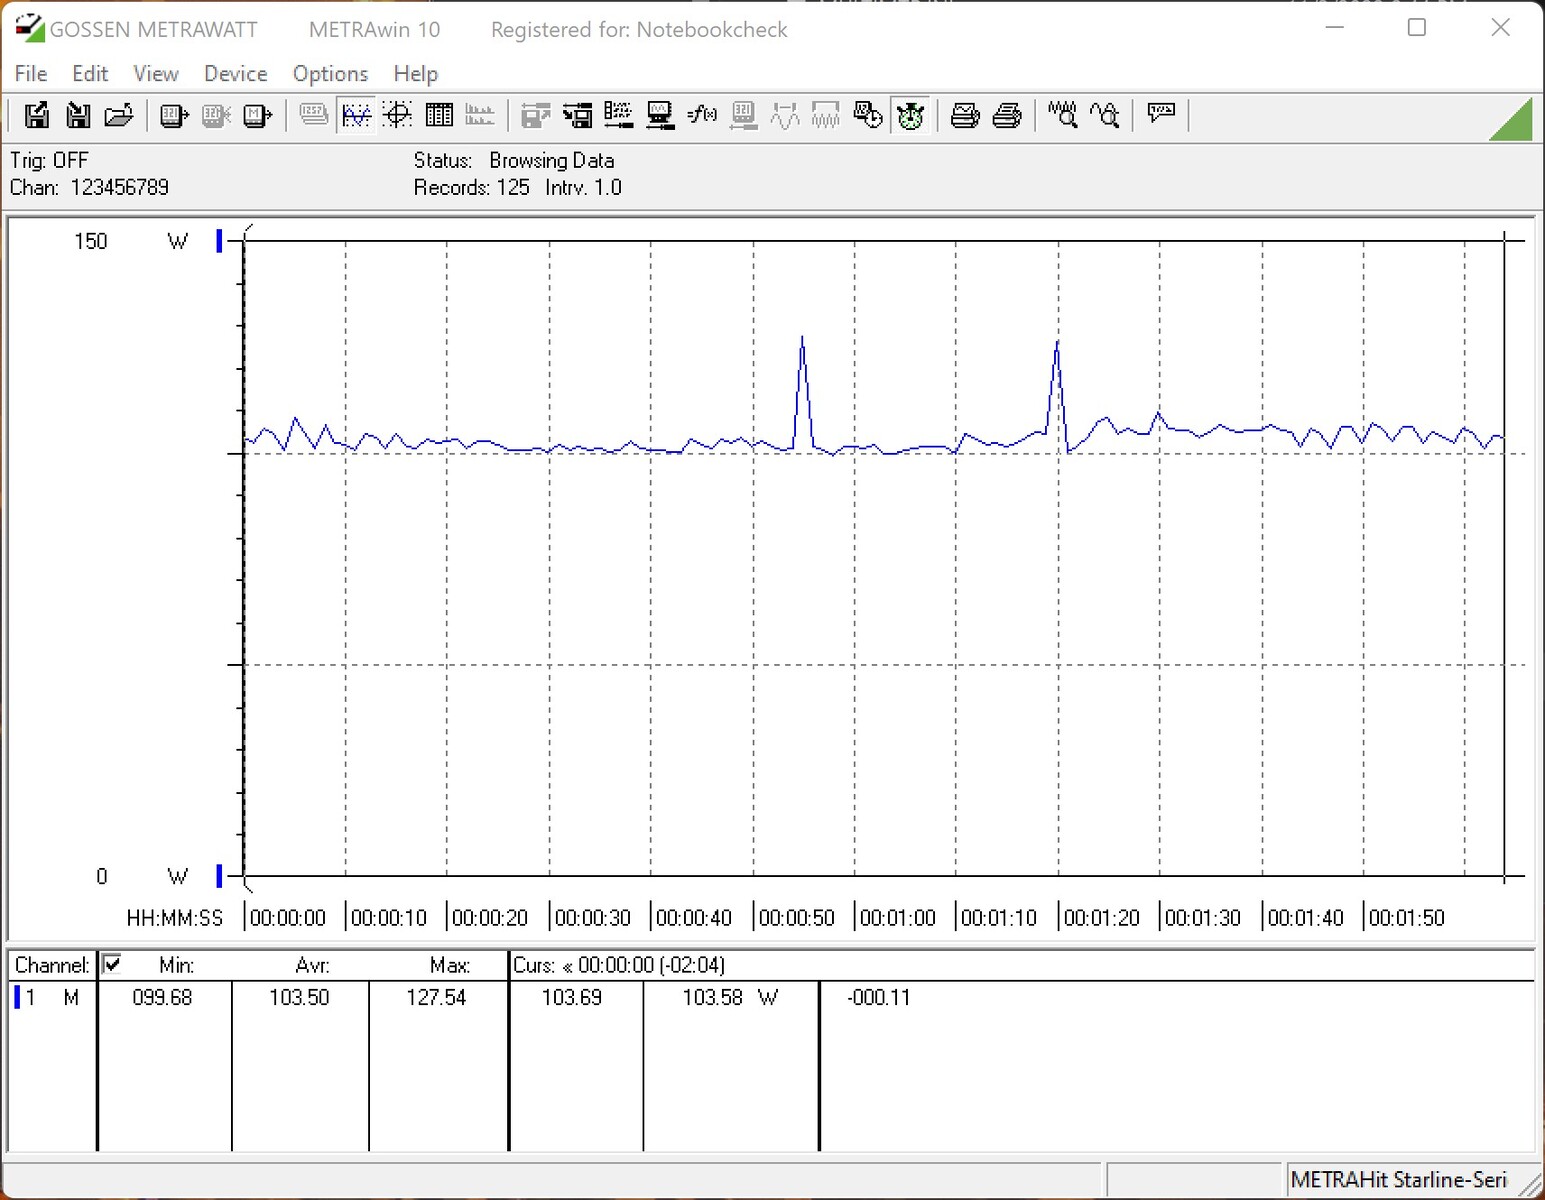
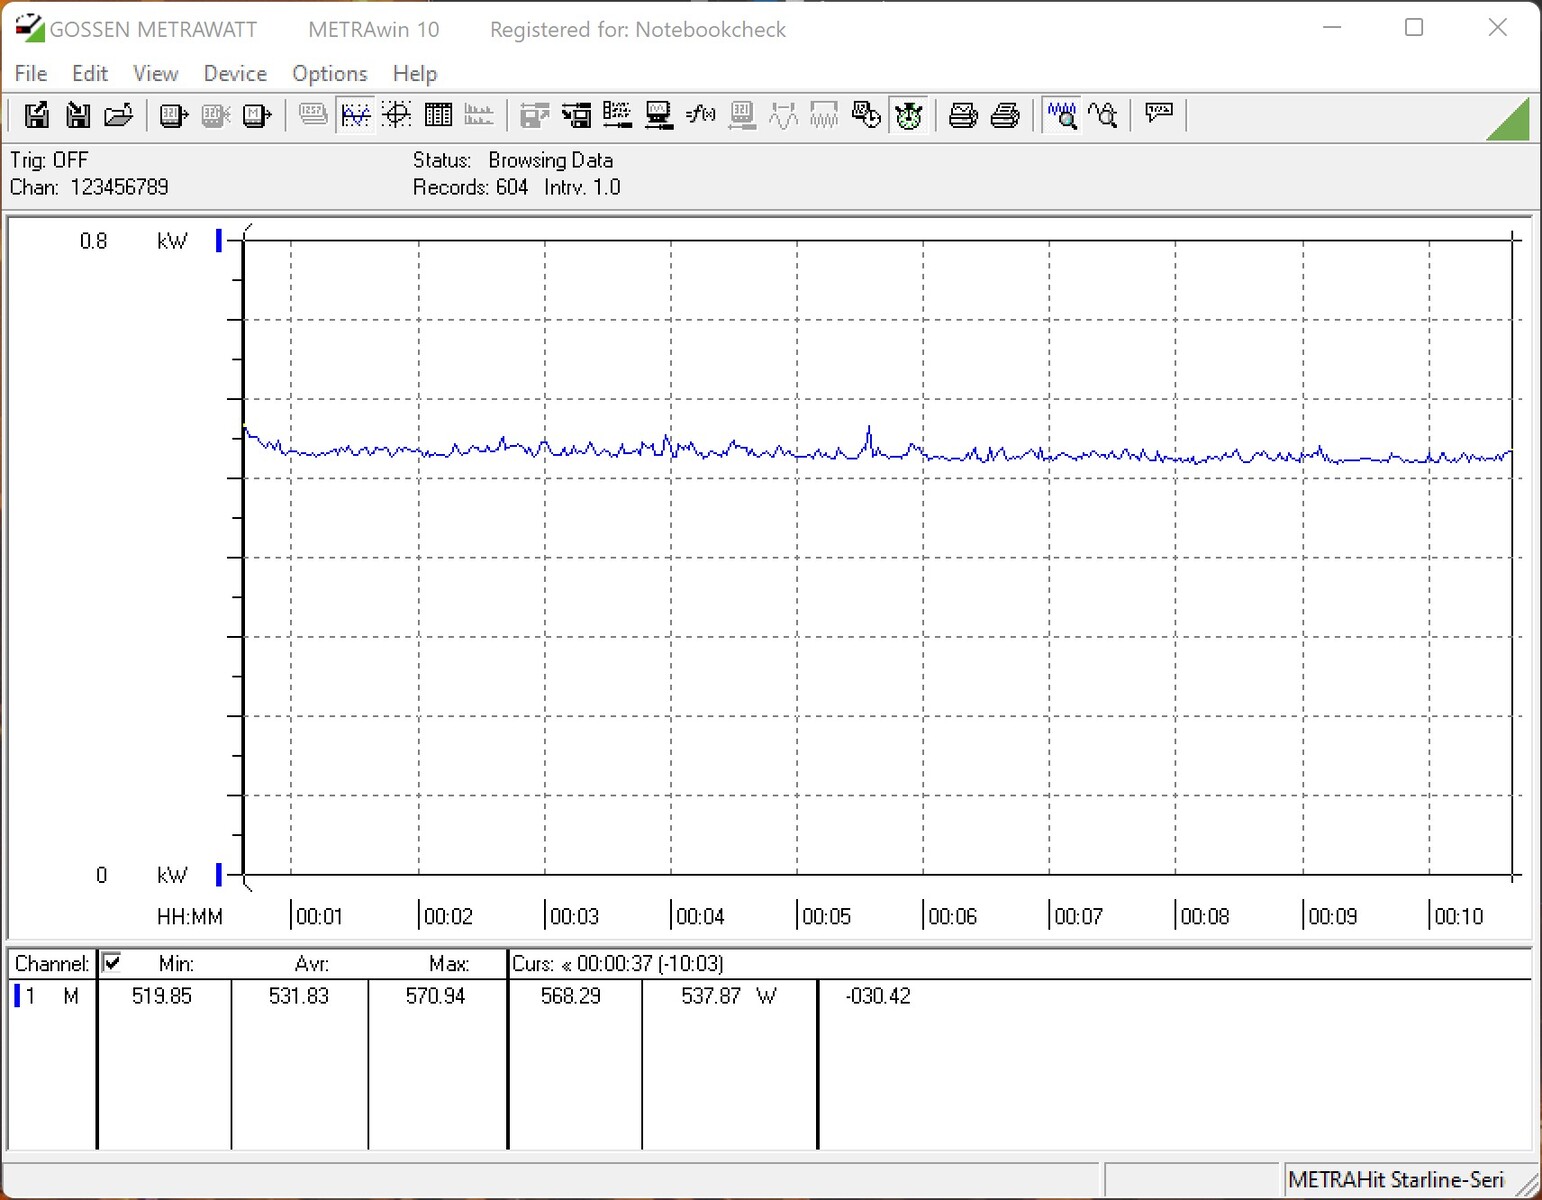
| Power Consumption / The Witcher 3 ultra (external Monitor) | |
| AMD Radeon RX 6950 XT, AMD Ryzen 9 5900X | |
| NVIDIA GeForce RTX 3090 Ti, AMD Ryzen 7 5800X3D (Idle: 102 W) | |
| NVIDIA GeForce RTX 3090, AMD Ryzen 9 7950X | |
| NVIDIA GeForce RTX 4090, AMD Ryzen 9 7950X | |
| NVIDIA GeForce RTX 3080 12 GB, AMD Ryzen 9 5900X | |
| AMD Radeon RX 6900 XT, AMD Ryzen 9 5950X (Idle: 99.15 W) | |
| Power Consumption / FurMark 1.19 GPU Stress Test (external Monitor) | |
| NVIDIA GeForce RTX 4090, AMD Ryzen 9 7950X | |
| AMD Radeon RX 6950 XT, AMD Ryzen 9 5900X | |
| NVIDIA GeForce RTX 3090, AMD Ryzen 9 7950X | |
| NVIDIA GeForce RTX 3080 12 GB, AMD Ryzen 9 5900X | |
| AMD Radeon RX 6900 XT, AMD Ryzen 9 5950X (Idle: 99.15 W) | |
* ... smaller is better
Pros
Cons
Verdict - Brute power without temperature problems
Nvidia's newest flagship, the GeForce RTX 4090, puts everything that has gone before in the shade - and then some. The leap in performance compared to the Nvidia GeForce RTX 3090 is huge. In some cases this almost means doubling frame rates. On the whole, however, the performance increase levels off at 50 to 70 percent which is still impressive. Likewise, AMD is also at a disadvantge with its latest Radeon RX 6950 XT. Introduced only a few days ago, the AMD Radeon RX 7900 XTX is trying its best to stand up to this.
The performance of the GeForce RTX 4090 GameRock OC used in our review is consistently excellent. With well-known features such as DLSS and raytracing, Nvidia has once more been able to considerably increase the performance with innovations only currently offered by the RTX 4000 series, and in doing so, entice potential buyers. Whether AMD can follow suit in this regard, remains to be seen. Nevertheless, the features promise a lot as more and more games are using the tech to improve frame rates without a loss in image quality. But even without DLSS the GeForce RTX 4090 offers enormous power for nearly all current games at 2160p on highest settings.
For anyone considering a purchase it is worth remembering that a very fast CPU is necessary. In addition, there's no point wasting the graphics card power for only 1080p or 1440p gaming. The graphics card will quickly get bored.
The Palit GeForce RTX 4090 GameRock OC draws attention to itself with the Midnight Kaleidoscope design. Thanks to Ada Lovelace, the design matches the performance and unrestricted 4K gaming is possible.
Opinions can be split when it comes to power consumption and the implemented 12VHPWR connector. On the one hand, the 450 watts are still within limits if we keep the Nvidia GeForce RTX 3090 Ti in mind. This sports the same TBP and cannot reach the Nvidia GeForce RTX 4090 performance by a long way. As a result, Nvidia is once more able to dramatically increase efficiency with the new Ada Lovelace architecture. The new power connector has been under fire lately. So far, we have been unable to detect any problems related to that connector. However, we will continue to monitor this and keep you up to date, should this fate befall us too. The Palit GeForce RTX 4090 GameRock OC design is a also a success in part due to its diamond-like surface. The package is nicely rounded off by subtle RGB lighting. Likewise, the built-in Palit cooler does everything right as the graphics card remains pleasantly quiet under load, in spite of the very high power draw.
Price and availability
The graphics cards remain difficult to get hold of. When models do become available to buy, they often come with a hefty surcharge on Nvidia's RRP of 1949 euros. Currently, our review sample is listed on Amazon for $2679. However, delivery time is 4 to 6 weeks. The non-OC model of the Palit GeForce RTX 4090 GameRock can currently be had on Amazon for $2369.
Price comparison

