Notebookcheck Logo

NVIDIA RTX A500 Laptop GPU vs Intel Arc A310 vs Intel Arc A550M

NVIDIA RTX A500 Laptop GPU

► remove from comparison NVIDIA RTX A500 Laptop GPU

The NVIDIA RTX A500 Laptop GPU or A500 Mobile is a professional graphics card for mobile workstations. It is based on the GA107 Ampere chip and offers a slower performance than the GeForce RTX 3050 Laptop GPU. It offers 2,048 CUDA, 16 Raytracing and 64 Tensor cores paired with a 64 Bit memory bus. It is available in different variants from 20 - 60 Watt (TGP) with different clock speeds (and performance). The GPU supports eDP 1.4b to connect the internal monitor and DisplayPort 1.4 and HDMI 2.1 for external connections.

There is no more Max-Q variant (formerly used for the low power variants) but every OEM can choose to implement Max-Q technologies (Dynamic Boost, WhisperMode).

The raw performance should be slower than the GeForce RTX 3050 for laptops at the same TGP level. Both GPUs depend heavily on good cooling and a high TGP for good performance. At a similar power consumption level the RTX A500 should be clearly faster than the old T500 and T550. 

The GA107 chip offers 2.560 FP32 ALUs of which half can also execute INT32 instructions (i.e. 1,280 INT32 ALUs). With Ampere all shaders could still execute FP32 or INT32 instructions. The raytracing and tensor cores on the chip were also improved according to Nvidia. The A500 can only use 2048 CUDA cores. The Ampere chips also include an improved 5th generation video encoder (NVENC for H.264 and H.265) and a 7th generation decoder (for various formats now including AV1).

The GA107 chip is manufactured by Samsung in 8nm (8N), which is not quite able to keep up with the 7nm node at TSMC (e.g. used by AMD and also for the professional GA100 Ampere chip).

Intel Arc A310

► remove from comparison Intel A310

The Intel Arc A310 is a dedicated entry-level graphics card from Intel for desktops. It is based on the ACM-G11 chip and offers 6 of the 8 Xe cores (96 ALUs), 6 of the 8 ray tracing units, 1.152 MB L1 cache and 4MB L2 cache. The memory interface is 64 bits wide and supports 4GB GDDR6 graphics memory with 15.5 Gbps. The TGP is between 40 and 75 watts depending on the model.

The A310 is similar to the mobile Arc A350Mexcept for the higher clock rates of the cores and memory.

The ACM-G11 chip is manufactured at TSMC in 6nm (N6 process) and offers 7.2 billion transistors and is 157 mm2 in size. It integrates two media engines for VP9, AVC, HEVC, AV1 8k60 12-bit HDR decoding and 8k 10-bit HDR encoding. The integrated 4 display pipes support 4x 4k120 HDR, HDMI 2.0B, DP 2.0 10G and Adaptive Sync.

Intel Arc A550M

► remove from comparison Intel A550M

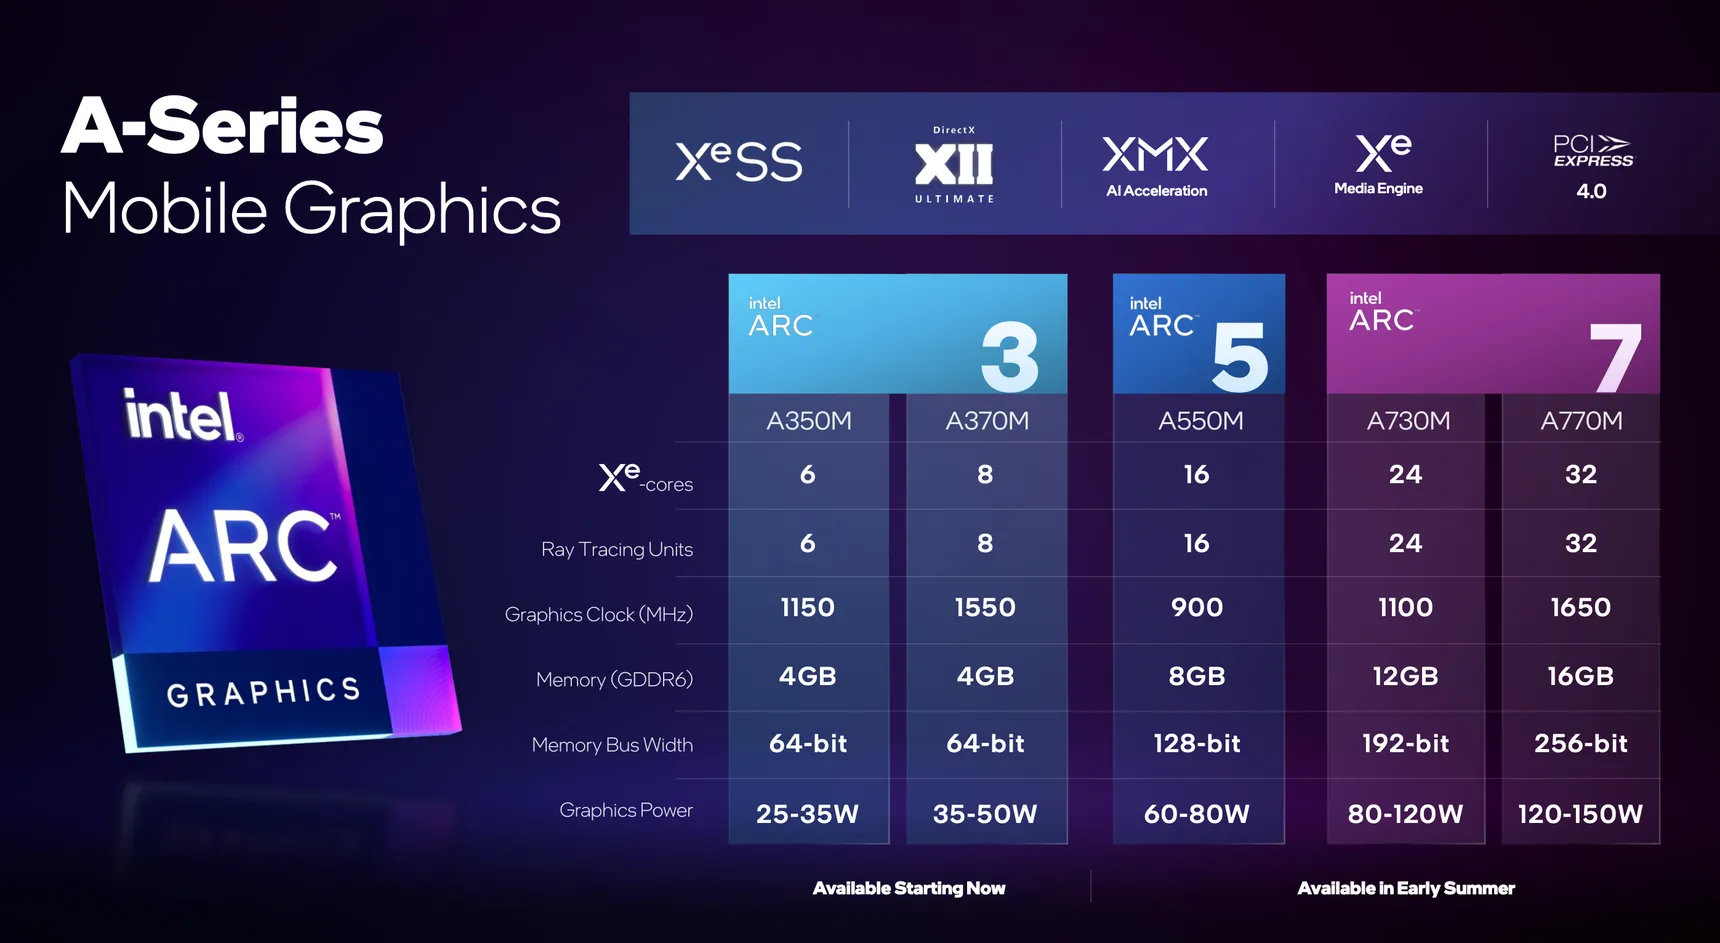
The Intel Arc A550M (device ID 5692) is a dedicated mobile lower- mid-range graphics card for laptops based on Xe HPG microarchitecture. It uses the ACM-G10 chip and offers 16 of the 32 Xe-cores (256 ALUs), 16 ray tracing units and a 128-bit memory bus for 8 GB GDDR6 graphics memory. The cores can clock from 300 MHz (low frequency mode) to 900 MHz (high frequency) or in short bursts 2050 MHz (short bursts / Turbo). The chip integrates 21.7 billion transistors, uses a BGA2660 package and the die measures 406 mm2.

The performance of the Arc A550M should be between the Radeon RX 6500M and 6600M and therefore well suited even for demanding games in medium to high detail settings and 1080p. The slower Arc A370M is based on the smaller ACM-G11 chip and should be significantly slower.

The chip also integrates two media engines for VP9, AVC, HEVC, and AV1 8k en- and decoding. The 4 display pipes support up to 4x 4k120 HDR via DMI 2.0B or DisplayPort 2.0 10G. 

The A550M is produced in 6nm at TSMC (N6 process) and supports dynamic power share (using Deep Link) with 12th gen Intel CPUs (Alder Lake).

NVIDIA RTX A500 Laptop GPUIntel Arc A310Intel Arc A550M
Arc Series
RTX A5500 Laptop GPU 7424 256 Bit @ 16000 MHz
RTX A4500 Laptop GPU 5888 @ 0.93 - 1.5 GHz256 Bit @ 16000 MHz
RTX A5000 Laptop GPU 6144 @ 1.22 - 1.77 GHz256 Bit @ 14000 MHz
RTX A4000 Laptop GPU 5120 @ 0.78 - 1.68 GHz256 Bit @ 12000 MHz
RTX A3000 Laptop GPU 4096 @ 1.08 - 1.56 GHz192 Bit @ 14000 MHz
RTX A2000 3328 @ 0.56 - 1.2 GHz192 Bit @ 12000 MHz
RTX A2000 Laptop GPU 2560 @ 0.89 - 1.69 GHz128 Bit @ 14000 MHz
RTX A1000 Laptop GPU 2048 128 Bit @ 14000 MHz
RTX A500 Laptop GPU 2048 64 Bit @ 14000 MHz
Arc B580 2560 @ 2.67 - 2.67 GHz192 Bit @ 19000 MHz
Arc A770 4096 @ 2.1 - 2.4 GHz256 Bit @ 16000 MHz
Arc A750 3584 @ 2.05 - 2.4 GHz256 Bit @ 16000 MHz
Arc A580 3072 @ 1.7 - 2 GHz256 Bit @ 16000 MHz
A770M 4096 @ 1.65 GHz256 Bit @ 16000 MHz
A730M 3072 @ 1.1 GHz192 Bit @ 14000 MHz
A570M 16 @ 0.9 - 1.3 GHz128 Bit @ 14000 MHz
A550M 16 @ 0.9 - 2.01 GHz128 Bit @ 14000 MHz
A530M 12 @ 0.9 - 1.3 GHz128 Bit @ 14000 MHz
A370M 8 @ 1.55 GHz64 Bit @ 14000 MHz
Arc A380 1024 @ 2 GHz96 Bit @ 15500 MHz
A310 6 @ 2 GHz64 Bit @ 15500 MHz
A350M 6 @ 1.15 GHz64 Bit @ 14000 MHz
CodenameGA107AlchemistAlchemist
ArchitectureAmpereXe HPGXe HPG
Pipelines2048 - unified6 - unified16 - unified
Raytracing Cores16616
Tensor / AI Cores64
Theoretical Performance7.3 TFLOPS FP32
Memory Speed14000 MHz15500 MHz14000 effective = 1750 MHz
Memory Bus Width64 Bit64 Bit128 Bit
Memory TypeGDDR6GDDR6GDDR6
Max. Amount of Memory4 GB4 GB8 GB
Shared Memorynonono
Memory Bandwidth112 GB/s124 GB/s224 GB/s
APIDirectX 12_2, Shader 6.7, OpenGL 4.6DirectX 12_2, OpenGL 4.6, Vulkan 1.3DirectX 12_2, Shader 6.6, OpenGL 4.6, OpenCL 3.0, Vulkan 1.3
Power Consumption60 Watt (20 - 60 Watt TGP)75 Watt (40 - 75 Watt TGP)80 Watt (60 - 80 Watt TGP)
technology8 nm6 nm6 nm
PCIe44 8x4 16x
Date of Announcement30.03.2022 01.09.2022 30.03.2022
Link to Manufacturer Pagenvdam.widen.netwww.intel.comark.intel.com
Core Speed2000 (Boost) MHz900 - 2005 (Boost) MHz
CacheL1: 1.1 MB, L2: 4 MBL1: 3 MB, L2: 16 MB
Transistors7.2 Billion21.7 Billion
Die Size 157 mm² 406 mm²
Displays4 Displays (max.), HDMI 2.0b, DisplayPort 2.0 10G Ready4 Displays (max.), HDMI 2.0b, DisplayPort 2.0 10G Ready
TMUs128
ROPs64

Benchmarks

Performance Rating - 3DMark 11 + Fire Strike + Time Spy - RTX A500 Laptop GPU
2.8 pt (9%)
Restrict / Search: Model: Max. age: years
Performance Rating - 3DMark 11 + Fire Strike + Time Spy - A310
3.2 pt (10%)
Restrict / Search: Model: Max. age: years
3DMark - 3DMark Steel Nomad
229 Points (2%)
3DMark - 3DMark Fire Strike Standard Score
min: 6899     avg: 6955     median: 6954.5 (10%)     max: 7010 Points
118%
A310 +
8192 Points (12%)
12900 Points (19%)
3DMark - 3DMark Fire Strike Standard Graphics
min: 7578     avg: 7598     median: 7597.5 (7%)     max: 7617 Points
111%
A310 +
8464 Points (8%)
14350 Points (13%)
3DMark - 3DMark Ice Storm Graphics
88367 Points (10%)
291%
1 A310 +
257130 Points (28%)
3DMark - 3DMark Time Spy Score
min: 3127     avg: 3273     median: 3273 (9%)     max: 3419 Points
114%
A310 +
3743 Points (10%)
6320 Points (17%)
3DMark - 3DMark Time Spy Graphics
min: 2873     avg: 2995     median: 2994.5 (6%)     max: 3116 Points
109%
A310 +
3269 Points (7%)
5830 Points (12%)
3DMark - 3DMark Cloud Gate Score
min: 27001     avg: 28765     median: 28764.5 (27%)     max: 30528 Points
156%
1 A310 +
44891 Points (42%)
3DMark - 3DMark Cloud Gate Graphics
min: 46927     avg: 48496     median: 48495.5 (12%)     max: 50064 Points
110%
1 A310 +
53244 Points (13%)
3DMark 11 - 3DM11 Performance Score
min: 11213     avg: 11289     median: 11288.5 (14%)     max: 11364 Points
115%
1 A310 +
13031 Points (16%)
3DMark 11 - 3DM11 Performance GPU
min: 10748     avg: 10818     median: 10818 (8%)     max: 10888 Points
110%
1 A310 +
11915 Points (9%)
3DMark Vantage
3DM Vant. Perf. total + NVIDIA RTX A500 Laptop GPU
3DMark Vantage - 3DM Vant. Perf. total
40923 Points (12%)
3DM Vant. Perf. total + Intel Arc A310
114%
1 A310 +
46839 Points (14%)
3DM Vant. Perf. GPU no PhysX + NVIDIA RTX A500 Laptop GPU
3DMark Vantage - 3DM Vant. Perf. GPU no PhysX
39319 Points (21%)
3DM Vant. Perf. GPU no PhysX + Intel Arc A310
100%
1 A310 +
39213 Points (21%)
3DMark 06 3DMark 06 - Standard 1280x1024 + NVIDIA RTX A500 Laptop GPU
3DMark 06
40862 Points (53%)
3DMark 06 - Standard 1280x1024 + Intel Arc A310
132%
1 A310 +
53771 Points (70%)
Blender - Blender 3.3 Classroom CUDA *
min: 142     avg: 146     median: 146 (22%)     max: 150 Seconds
Blender - Blender 3.3 Classroom OPTIX *
min: 88     avg: 91.5     median: 91.5 (34%)     max: 95 Seconds
SPECviewperf 12
specvp12 sw-03 + NVIDIA RTX A500 Laptop GPU
SPECviewperf 12 - specvp12 sw-03
126.4 fps (31%)
specvp12 snx-02 + NVIDIA RTX A500 Laptop GPU
SPECviewperf 12 - specvp12 snx-02
88.4 fps (13%)
specvp12 showcase-01 + NVIDIA RTX A500 Laptop GPU
SPECviewperf 12 - specvp12 showcase-01
31.8 fps (6%)
specvp12 maya-04 + NVIDIA RTX A500 Laptop GPU
SPECviewperf 12 - specvp12 maya-04
76.9 fps (21%)
specvp12 creo-01 + NVIDIA RTX A500 Laptop GPU
SPECviewperf 12 - specvp12 creo-01
88 fps (35%)
specvp12 catia-04 + NVIDIA RTX A500 Laptop GPU
SPECviewperf 12 - specvp12 catia-04
108.2 fps (18%)
SPECviewperf 13 specvp13 sw-04 + NVIDIA RTX A500 Laptop GPU
SPECviewperf 13 - specvp13 sw-04
min: 127.43     avg: 129.5     median: 129.5 (35%)     max: 131.64 fps
specvp13 snx-03 + NVIDIA RTX A500 Laptop GPU
SPECviewperf 13 - specvp13 snx-03
min: 145.61     avg: 153.2     median: 153.2 (17%)     max: 160.83 fps
specvp13 showcase-02 + NVIDIA RTX A500 Laptop GPU
SPECviewperf 13 - specvp13 showcase-02
min: 31.69     avg: 34.6     median: 34.6 (6%)     max: 37.51 fps
specvp13 medical-02 + NVIDIA RTX A500 Laptop GPU
SPECviewperf 13 - specvp13 medical-02
min: 73.93     avg: 78.3     median: 78.3 (13%)     max: 82.72 fps
specvp13 maya-05 + NVIDIA RTX A500 Laptop GPU
SPECviewperf 13 - specvp13 maya-05
min: 121.4     avg: 123.5     median: 123.5 (14%)     max: 125.67 fps
specvp13 energy-02 + NVIDIA RTX A500 Laptop GPU
SPECviewperf 13 - specvp13 energy-02
min: 20.53     avg: 21.4     median: 21.4 (7%)     max: 22.26 fps
specvp13 creo-02 + NVIDIA RTX A500 Laptop GPU
SPECviewperf 13 - specvp13 creo-02
min: 120.07     avg: 121.6     median: 121.6 (18%)     max: 123.09 fps
specvp13 catia-05 + NVIDIA RTX A500 Laptop GPU
SPECviewperf 13 - specvp13 catia-05
min: 146.08     avg: 154.4     median: 154.4 (17%)     max: 162.65 fps
specvp13 3dsmax-06 + NVIDIA RTX A500 Laptop GPU
SPECviewperf 13 - specvp13 3dsmax-06
min: 80.81     avg: 84     median: 84 (13%)     max: 87.19 fps
SPECviewperf 2020 specvp2020 solidworks-07 4k + NVIDIA RTX A500 Laptop GPU
SPECviewperf 2020 - specvp2020 solidworks-07 4k
10.8 fps (3%)
specvp2020 solidworks-07 1080p + NVIDIA RTX A500 Laptop GPU
SPECviewperf 2020 - specvp2020 solidworks-07 1080p
88.5 fps (15%)
specvp2020 solidworks-05 1080p + NVIDIA RTX A500 Laptop GPU
SPECviewperf 2020 - specvp2020 solidworks-05 1080p
79.9 fps (15%)
specvp2020 snx-04 1080p + NVIDIA RTX A500 Laptop GPU
SPECviewperf 2020 - specvp2020 snx-04 1080p
min: 139.98     avg: 148.5     median: 148.5 (16%)     max: 157.04 fps
specvp2020 medical-03 1080p + NVIDIA RTX A500 Laptop GPU
SPECviewperf 2020 - specvp2020 medical-03 1080p
min: 27.58     avg: 28.3     median: 28.3 (8%)     max: 28.96 fps
specvp2020 maya-06 1080p + NVIDIA RTX A500 Laptop GPU
SPECviewperf 2020 - specvp2020 maya-06 1080p
min: 143.05     avg: 143.6     median: 143.6 (15%)     max: 144.17 fps
specvp2020 energy-03 1080p + NVIDIA RTX A500 Laptop GPU
SPECviewperf 2020 - specvp2020 energy-03 1080p
min: 20.44     avg: 21.4     median: 21.4 (3%)     max: 22.29 fps
specvp2020 creo-03 1080p + NVIDIA RTX A500 Laptop GPU
SPECviewperf 2020 - specvp2020 creo-03 1080p
min: 50.44     avg: 61.4     median: 61.4 (21%)     max: 72.31 fps
specvp2020 catia-06 1080p + NVIDIA RTX A500 Laptop GPU
SPECviewperf 2020 - specvp2020 catia-06 1080p
min: 34.65     avg: 36.9     median: 36.9 (18%)     max: 39.09 fps
specvp2020 3dsmax-07 1080p + NVIDIA RTX A500 Laptop GPU
SPECviewperf 2020 - specvp2020 3dsmax-07 1080p
min: 32.99     avg: 35.4     median: 35.4 (9%)     max: 37.79 fps
specvp2020 snx-04 4k + NVIDIA RTX A500 Laptop GPU
SPECviewperf 2020 - specvp2020 snx-04 4k
98.2 fps (10%)
specvp2020 medical-03 4k + NVIDIA RTX A500 Laptop GPU
SPECviewperf 2020 - specvp2020 medical-03 4k
11.9 fps (8%)
specvp2020 maya-06 4k + NVIDIA RTX A500 Laptop GPU
SPECviewperf 2020 - specvp2020 maya-06 4k
66.7 fps (10%)
specvp2020 energy-03 4k + NVIDIA RTX A500 Laptop GPU
SPECviewperf 2020 - specvp2020 energy-03 4k
143.3 fps (31%)
specvp2020 creo-03 4k + NVIDIA RTX A500 Laptop GPU
SPECviewperf 2020 - specvp2020 creo-03 4k
37.6 fps (17%)
specvp2020 catia-06 4k + NVIDIA RTX A500 Laptop GPU
SPECviewperf 2020 - specvp2020 catia-06 4k
12.9 fps (8%)
specvp2020 3dsmax-07 4k + NVIDIA RTX A500 Laptop GPU
SPECviewperf 2020 - specvp2020 3dsmax-07 4k
17.1 fps (6%)
Cinebench R10 Cinebench R10 Shading (32bit) + NVIDIA RTX A500 Laptop GPU
Cinebench R10 - Cinebench R10 Shading (32bit)
6844 Points (5%)
Cinebench R11.5 Cinebench R11.5 OpenGL 64 Bit + NVIDIA RTX A500 Laptop GPU
Cinebench R11.5 - Cinebench R11.5 OpenGL 64 Bit
212.8 fps (70%)
Cinebench R15
Cinebench R15 OpenGL 64 Bit + NVIDIA RTX A500 Laptop GPU
Cinebench R15 - Cinebench R15 OpenGL 64 Bit
min: 232     avg: 247     median: 247 (14%)     max: 262 fps
Cinebench R15 OpenGL Ref. Match 64 Bit + NVIDIA RTX A500 Laptop GPU
Cinebench R15 - Cinebench R15 OpenGL Ref. Match 64 Bit
99.6 % (100%)
GFXBench - GFXBench 5.0 4K Aztec Ruins High Tier Offscreen
28.5 fps (11%)
126%
1 A310 +
35.9 fps (13%)
GFXBench - GFXBench 5.0 Aztec Ruins High Tier Offscreen
64.7 fps (12%)
124%
1 A310 +
80.5 fps (14%)
GFXBench - GFXBench 5.0 Aztec Ruins Normal Tier Offscreen
166.1 fps (12%)
120%
1 A310 +
199.7 fps (15%)
GFXBench - GFXBench Car Chase Offscreen
174.1 fps (16%)
GFXBench 3.1 - GFXBench Manhattan ES 3.1 Offscreen
232.7 fps (5%)
GFXBench 3.0 - GFXBench 3.0 Manhattan Offscreen
321.7 fps (13%)
GFXBench (DX / GLBenchmark) 2.7
GFXBench T-Rex HD Offscreen C24Z16 + NVIDIA RTX A500 Laptop GPU
GFXBench (DX / GLBenchmark) 2.7 - GFXBench T-Rex HD Offscreen C24Z16
554 fps (4%)
Basemark GPU 1.2 - Basemark GPU 1.2 Vulkan Official Medium Offscreen 1080
104.6 fps (3%)
Basemark GPU 1.2 - Basemark GPU 1.2 Vulkan Official High Offscreen 2160
3.6 fps (1%)
Geekbench 6.5 - Geekbench 6.5 GPU OpenCL
min: 40215     avg: 41313     median: 41313 (11%)     max: 42411 Points
Geekbench 6.5 - Geekbench 6.5 GPU Vulkan
min: 20666     avg: 30177     median: 30176.5 (8%)     max: 39687 Points
LuxMark v2.0 64Bit - LuxMark v2.0 Room GPU
1023 Samples/s (4%)
83%
1 A310 +
854 Samples/s (3%)
LuxMark v2.0 64Bit - LuxMark v2.0 Sala GPU
2268 Samples/s (4%)
123%
1 A310 +
2784 Samples/s (5%)
ComputeMark v2.1 - ComputeMark v2.1 Result
8197 Points (7%)
64%
1 A310 +
5254 Points (4%)
Power Consumption - Furmark Stress Test Power Consumption - external Monitor *
min: 49.1     avg: 51.7     median: 51.7 (7%)     max: 54.3 Watt
Power Consumption - The Witcher 3 Power Consumption - external Monitor *
54.5 Watt (8%)
Power Consumption - Witcher 3 Power Consumption *
56.5 Watt (12%)
Power Consumption - Power Efficiency - Witcher 3 ultra
0.6 fps per Watt (50%)
Power Consumption - Power Efficiency - Witcher 3 ultra external Monitor
0.6 fps per Watt (47%)
Power Consumption - Cyberpunk 2077 Power Consumption 150cd *
63.4 Watt (18%)
Power Consumption - Cyberpunk 2077 Power Consumption - external Monitor *
58.1 Watt (7%)
Emissions Witcher 3 Fan Noise + NVIDIA RTX A500 Laptop GPU
Emissions - Witcher 3 Fan Noise
46 dB(A) (66%)

Average Benchmarks NVIDIA RTX A500 Laptop GPU → 100% n=4

Average Benchmarks Intel Arc A310 → 113% n=4

Average Benchmarks Intel Arc A550M → 191% n=4

- Range of benchmark values for this graphics card
red legend - Average benchmark values for this graphics card
* Smaller numbers mean a higher performance
1 This benchmark is not used for the average calculation

Game Benchmarks

The following benchmarks stem from our benchmarks of review laptops. The performance depends on the used graphics memory, clock rate, processor, system settings, drivers, and operating systems. So the results don't have to be representative for all laptops with this GPU. For detailed information on the benchmark results, click on the fps number.

F1 24

F1 24

2024
low 1920x1080
100%
RTX A500 Laptop GPU:
82.4  fps
med. 1920x1080
100%
RTX A500 Laptop GPU:
71.9  fps
high 1920x1080
100%
RTX A500 Laptop GPU:
32.9  fps
ultra 1920x1080
100%
RTX A500 Laptop GPU:
11.7  fps
low 1920x1080
100%
RTX A500 Laptop GPU:
34.6  fps
med. 1920x1080
100%
RTX A500 Laptop GPU:
27.5  fps
high 1920x1080
100%
RTX A500 Laptop GPU:
19.1  fps
ultra 1920x1080
100%
RTX A500 Laptop GPU:
14.1  fps
low 1920x1080
100%
RTX A500 Laptop GPU:
80.1  fps
med. 1920x1080
100%
RTX A500 Laptop GPU:
68.6  fps
high 1920x1080
100%
RTX A500 Laptop GPU:
58.6  fps
ultra 1920x1080
100%
RTX A500 Laptop GPU:
43.8  fps
low 1920x1080
100%
RTX A500 Laptop GPU:
23.6  fps
high 1920x1080
100%
RTX A500 Laptop GPU:
14.5  fps
low 1920x1080
100%
RTX A500 Laptop GPU:
76.7  fps
81%
A310:
62.5  fps
med. 1920x1080
100%
RTX A500 Laptop GPU:
58.2  fps
92%
A310:
53.4  fps
high 1920x1080
100%
RTX A500 Laptop GPU:
49.3  fps
80%
A310:
39.6  fps
ultra 1920x1080
100%
RTX A500 Laptop GPU:
33.3  fps
93%
A310:
30.9  fps
low 1920x1080
A310:
0 (!)  fps
med. 1920x1080
A310:
0 (!)  fps
high 1920x1080
A310:
0 (!)  fps
ultra 1920x1080
A310:
0 (!)  fps
low 1920x1080
100%
RTX A500 Laptop GPU:
19.5  fps
115%
A310:
22.4  fps
med. 1920x1080
100%
RTX A500 Laptop GPU:
12.8  fps
152%
A310:
19.5  fps
high 1920x1080
100%
RTX A500 Laptop GPU:
12  fps
139%
A310:
16.7  fps
ultra 1920x1080
100%
RTX A500 Laptop GPU:
10.9  fps
150%
A310:
16.3  fps
low 1920x1080
100%
RTX A500 Laptop GPU:
24.4  fps
84%
A310:
20.4  fps
med. 1920x1080
100%
RTX A500 Laptop GPU:
18.7  fps
96%
A310:
18  fps
high 1920x1080
100%
RTX A500 Laptop GPU:
14.3  fps
97%
A310:
13.8  fps
ultra 1920x1080
100%
RTX A500 Laptop GPU:
8.3  fps
119%
A310:
9.9  fps
Palworld

Palworld

2024
low 1920x1080
A310:
38.3  fps
med. 1920x1080
A310:
33.2  fps
high 1920x1080
A310:
23.2  fps
ultra 1920x1080
A310:
20.9  fps
med. 1920x1080
A310:
260  fps
high 1920x1080
A310:
154.7  fps
ultra 1920x1080
A310:
141.6  fps
low 1920x1080
A310:
102.2  fps
med. 1920x1080
A310:
75.6  fps
high 1920x1080
A310:
58.3  fps
ultra 1920x1080
A310:
34.6  fps
low 1920x1080
A310:
75  fps
med. 1920x1080
A310:
53.1  fps
high 1920x1080
A310:
46.6  fps
ultra 1920x1080
A310:
34.6  fps
low 1920x1080
A310:
16  fps
med. 1920x1080
A310:
14  fps
high 1920x1080
A310:
11  fps
ultra 1920x1080
A310:
8.1  fps
low 1920x1080
A310:
34.3  fps
med. 1920x1080
A310:
27.3  fps
high 1920x1080
A310:
18.6  fps
ultra 1920x1080
A310:
16.8  fps
low 1920x1080
A310:
16.3  fps
med. 1920x1080
A310:
13.9  fps
high 1920x1080
A310:
12.3  fps
low 1920x1080
A310:
22.7  fps
med. 1920x1080
A310:
22.2  fps
high 1920x1080
A310:
18.4  fps
ultra 1920x1080
A310:
14  fps
low 1920x1080
A310:
111  fps
med. 1920x1080
A310:
73.6  fps
high 1920x1080
A310:
41.6  fps
ultra 1920x1080
A310:
32.3  fps
low 1920x1080
A310:
37  fps
med. 1920x1080
A310:
32  fps
high 1920x1080
A310:
25  fps
ultra 1920x1080
A310:
20  fps
low 1920x1080
A310:
153.5  fps
med. 1920x1080
A310:
106.3  fps
high 1920x1080
A310:
37.5  fps
ultra 1920x1080
A310:
27.7  fps
low 1920x1080
100%
RTX A500 Laptop GPU:
39.8 43.3 ~ 42 fps
98%
A310:
41  fps
med. 1920x1080
100%
RTX A500 Laptop GPU:
31.1 32.1 ~ 32 fps
97%
A310:
31.1  fps
high 1920x1080
100%
RTX A500 Laptop GPU:
23.6 25.1 ~ 24 fps
107%
A310:
25.7  fps
ultra 1920x1080
100%
RTX A500 Laptop GPU:
19.6 20.4 ~ 20 fps
119%
A310:
23.7  fps
QHD 2560x1440
100%
RTX A500 Laptop GPU:
10.4  fps
4K 3840x2160
100%
RTX A500 Laptop GPU:
4.3  fps
low 1920x1080
100%
RTX A500 Laptop GPU:
39.2 39.9 ~ 40 fps
102%
A310:
40.6  fps
med. 1920x1080
100%
RTX A500 Laptop GPU:
30.8 34.5 ~ 33 fps
97%
A310:
32  fps
high 1920x1080
100%
RTX A500 Laptop GPU:
26.2 31.2 ~ 29 fps
88%
A310:
25.5  fps
ultra 1920x1080
100%
RTX A500 Laptop GPU:
25.8 30.2 ~ 28 fps
89%
A310:
24.9  fps
QHD 2560x1440
100%
RTX A500 Laptop GPU:
17.8  fps
Lies of P

Lies of P

2023
low 1920x1080
A310:
49.3  fps
med. 1920x1080
A310:
42  fps
high 1920x1080
A310:
36  fps
ultra 1920x1080
A310:
30.3  fps
low 1920x1080
A310:
37  fps
med. 1920x1080
A310:
33  fps
high 1920x1080
A310:
27  fps
ultra 1920x1080
A310:
22  fps
Starfield

Starfield

2023
low 1920x1080
A310:
17.3  fps
med. 1920x1080
A310:
14.2  fps
high 1920x1080
A310:
13  fps
ultra 1920x1080
A310:
10.3  fps
low 1920x1080
A310:
56.3  fps
med. 1920x1080
A310:
43.8  fps
high 1920x1080
A310:
39  fps
ultra 1920x1080
A310:
26.9  fps
low 1920x1080
A310:
32.6  fps
med. 1920x1080
A310:
31.8  fps
high 1920x1080
A310:
26.7  fps
ultra 1920x1080
A310:
8.1  fps
low 1920x1080
A310:
30.3  fps
med. 1920x1080
A310:
24.6  fps
high 1920x1080
A310:
19.1  fps
ultra 1920x1080
A310:
16.1  fps
F1 23

F1 23

2023
low 1920x1080
100%
RTX A500 Laptop GPU:
57  fps
154%
A310:
88  fps
med. 1920x1080
100%
RTX A500 Laptop GPU:
56.3  fps
133%
A310:
75  fps
high 1920x1080
100%
RTX A500 Laptop GPU:
43.1  fps
97%
A310:
42  fps
ultra 1920x1080
100%
RTX A500 Laptop GPU:
10.9  fps
110%
A310:
12  fps
QHD 2560x1440
100%
RTX A500 Laptop GPU:
6.6  fps
low 1920x1080
A310:
42.4  fps
med. 1920x1080
A310:
30.1  fps
high 1920x1080
A310:
21.6  fps
ultra 1920x1080
A310:
9.5  fps
low 1920x1080
A310:
35.2  fps
med. 1920x1080
A310:
31.2  fps
high 1920x1080
A310:
25.4  fps
ultra 1920x1080
A310:
24.8  fps
low 1920x1080
A310:
29.9  fps
med. 1920x1080
A310:
18.9  fps
high 1920x1080
A310:
17.4  fps
ultra 1920x1080
A310:
17.1  fps
low 1920x1080
A310:
54.2  fps
med. 1920x1080
A310:
40.3  fps
high 1920x1080
A310:
27.4  fps
ultra 1920x1080
A310:
18.8  fps
Returnal

Returnal

2023
low 1920x1080
A310:
30  fps
med. 1920x1080
A310:
29  fps
high 1920x1080
A310:
26  fps
ultra 1920x1080
A310:
21  fps
low 1920x1080
100%
RTX A500 Laptop GPU:
23  fps
184%
A310:
42.3  fps
med. 1920x1080
100%
RTX A500 Laptop GPU:
19.6  fps
180%
A310:
35.2  fps
high 1920x1080
100%
RTX A500 Laptop GPU:
10.6  fps
203%
A310:
21.5  fps
ultra 1920x1080
100%
RTX A500 Laptop GPU:
5.4  fps
284%
A310:
15.4  fps
F1 22

F1 22

2022
low 1920x1080
100%
RTX A500 Laptop GPU:
92.5  fps
med. 1920x1080
100%
RTX A500 Laptop GPU:
85.2  fps
high 1920x1080
100%
RTX A500 Laptop GPU:
57.8  fps
ultra 1920x1080
100%
RTX A500 Laptop GPU:
16.9  fps
low 1920x1080
100%
RTX A500 Laptop GPU:
66.2  fps
med. 1920x1080
100%
RTX A500 Laptop GPU:
53.5  fps
high 1920x1080
100%
RTX A500 Laptop GPU:
36.2  fps
ultra 1920x1080
100%
RTX A500 Laptop GPU:
27.6  fps
Strange Brigade

Strange Brigade

2018
low 1280x720
100%
RTX A500 Laptop GPU:
168.9 183.5 ~ 176 fps
106%
A310:
187.3  fps
med. 1920x1080
100%
RTX A500 Laptop GPU:
74.9 76.5 ~ 76 fps
105%
A310:
79.7  fps
high 1920x1080
100%
RTX A500 Laptop GPU:
61.9 62.5 ~ 62 fps
105%
A310:
65.3  fps
ultra 1920x1080
100%
RTX A500 Laptop GPU:
53.6 54.5 ~ 54 fps
100%
A310:
53.8  fps
QHD 2560x1440
100%
RTX A500 Laptop GPU:
39.2  fps
Far Cry 5

Far Cry 5

2018
low 1280x720
100%
RTX A500 Laptop GPU:
81 83 ~ 82 fps
121%
A310:
99  fps
med. 1920x1080
100%
RTX A500 Laptop GPU:
51 57 ~ 54 fps
94%
A310:
51  fps
high 1920x1080
100%
RTX A500 Laptop GPU:
46 50 ~ 48 fps
98%
A310:
47  fps
ultra 1920x1080
100%
RTX A500 Laptop GPU:
44 44 ~ 44 fps
100%
A310:
44  fps
low 1280x720
100%
RTX A500 Laptop GPU:
113.3 117.7 ~ 116 fps
med. 1920x1080
100%
RTX A500 Laptop GPU:
89.2 98 ~ 94 fps
high 1920x1080
100%
RTX A500 Laptop GPU:
73.9 81.6 ~ 78 fps
low 1280x720
100%
RTX A500 Laptop GPU:
78.6 90.4 ~ 85 fps
med. 1920x1080
100%
RTX A500 Laptop GPU:
44.2 45.8 ~ 45 fps
93%
A310:
41.7  fps
high 1920x1080
100%
RTX A500 Laptop GPU:
31.4 32.9 ~ 32 fps
75%
A310:
24.1  fps
QHD 2560x1440
100%
RTX A500 Laptop GPU:
23.3  fps
low 1280x720
100%
RTX A500 Laptop GPU:
157.7 160.4 ~ 159 fps
med. 1366x768
100%
RTX A500 Laptop GPU:
130.5 131.1 ~ 131 fps
high 1920x1080
100%
RTX A500 Laptop GPU:
96.2 111.9 ~ 104 fps
ultra 1920x1080
100%
RTX A500 Laptop GPU:
91.6 104.8 ~ 98 fps
low 1024x768
100%
RTX A500 Laptop GPU:
134.6 174.5 ~ 155 fps
114%
A310:
176  fps
med. 1366x768
100%
RTX A500 Laptop GPU:
81.6 104.1 ~ 93 fps
116%
A310:
108  fps
high 1920x1080
100%
RTX A500 Laptop GPU:
53.4 56.8 ~ 55 fps
102%
A310:
56  fps
ultra 1920x1080
100%
RTX A500 Laptop GPU:
26.3 31.1 ~ 29 fps
100%
A310:
29  fps
GTA V

GTA V

2015
low 1024x768
100%
RTX A500 Laptop GPU:
173.3  fps
108%
A310:
187.7  fps
med. 1366x768
100%
RTX A500 Laptop GPU:
161.7  fps
116%
A310:
187.6  fps
high 1920x1080
100%
RTX A500 Laptop GPU:
89.7  fps
43%
A310:
38.3  fps
ultra 1920x1080
100%
RTX A500 Laptop GPU:
42.9  fps
39%
A310:
16.8  fps
QHD 2560x1440
100%
RTX A500 Laptop GPU:
29.8  fps

Average Gaming NVIDIA RTX A500 Laptop GPU → 100%

Average Gaming 30-70 fps → 100%

Average Gaming Intel Arc A310 → 112%

Average Gaming 30-70 fps → 102%

NVIDIA RTX A500 Laptop GPUIntel Arc A310Intel Arc A550M
lowmed.highultraQHD4Klowmed.highultraQHD4Klowmed.highultraQHD4K
F1 2482.471.932.911.7
Ghost of Tsushima34.627.519.114.1
Alone in the Dark80.168.658.643.8
Dragon's Dogma 223.614.5
Last Epoch76.758.249.333.362.553.439.630.9
Helldivers 219.512.81210.922.419.516.716.3
Enshrouded24.418.714.38.2820.41813.89.88
Cyberpunk 20774232242010.44.294131.125.723.7
Baldur's Gate 34033292817.840.63225.524.9
F1 235756.343.110.96.6388754212
Hogwarts Legacy2319.610.65.4342.335.221.515.4
F1 2292.585.257.816.9
Tiny Tina's Wonderlands66.253.536.227.6
Strange Brigade17676625439.2187.379.765.353.8
Far Cry 58254484499514744
X-Plane 11.111169478
Final Fantasy XV Benchmark85453223.341.724.1
Dota 2 Reborn15913110498
The Witcher 31559355291761085629
GTA V173.3161.789.742.929.8187.7187.638.316.8
NVIDIA RTX A500 Laptop GPUIntel Arc A310Intel Arc A550M
lowmed.highultraQHD4Klowmed.highultraQHD4Klowmed.highultraQHD4K
< 30 fps
< 60 fps
< 120 fps
≥ 120 fps
4
4
8
4
4
7
6
2
7
9
4
11
5
1
5
1

1


< 30 fps
< 60 fps
< 120 fps
≥ 120 fps
2
3
3
3
2
6
3
1
6
5
1
8
3


< 30 fps
< 60 fps
< 120 fps
≥ 120 fps


For more games that might be playable and a list of all games and graphics cards visit our Gaming List

v1.35
log 16. 02:27:22

#0 ran 0s before starting gpusingle class +0s ... 0s

#1 checking url part for id 11322 +0s ... 0s

#2 checking url part for id 12464 +0s ... 0s

#3 checking url part for id 11309 +0s ... 0s

#4 redirected to Ajax server, took 1765848442s time from redirect:0 +0s ... 0s

#5 did not recreate cache, as it is less than 5 days old! Created at Sun, 14 Dec 2025 14:23:09 +0100 +0s ... 0s

#6 composed specs +0.022s ... 0.022s

#7 did output specs +0s ... 0.022s

#8 start showIntegratedCPUs +0s ... 0.022s

#9 getting avg benchmarks for device 11322 +0.021s ... 0.043s

#10 got single benchmarks 11322 +0.007s ... 0.05s

#11 getting avg benchmarks for device 12464 +0.003s ... 0.054s

#12 got single benchmarks 12464 +0.003s ... 0.057s

#13 getting avg benchmarks for device 11309 +0s ... 0.057s

#14 got single benchmarks 11309 +0.002s ... 0.059s

#15 got avg benchmarks for devices +0s ... 0.059s

#16 min, max, avg, median took s +0.036s ... 0.096s

#17 before gaming benchmark output +0s ... 0.096s

#18 Got 249 rows for game benchmarks. +0.008s ... 0.103s

#19 composed SQL query for gamebenchmarks +0s ... 0.103s

#20 got data and put it in $dataArray +0.002s ... 0.105s

#21 benchmarks composed for output. +0.013s ... 0.119s

#22 calculated avg scores. +0s ... 0.119s

#23 return log +0s ... 0.119s

Please share our article, every link counts!
Mail Logo
Google Add as a preferred
source on Google
> Expert Reviews and News on Laptops, Smartphones and Tech Innovations > Benchmarks / Tech > Graphics Card Comparison - Head 2 Head
Redaktion, 2017-09- 8 (Update: 2023-07- 1)