NVIDIA Quadro RTX 3000 Max-Q vs NVIDIA T550 Laptop GPU vs NVIDIA T600 Laptop GPU
NVIDIA Quadro RTX 3000 Max-Q ► remove from comparison
The Nvidia Quadro RTX 3000 with Max-Q Design is a professional high-end graphics card for powerful laptops and mobile workstations. It is based on the same TU106 chip as the consumer GeForce RTX 2070 (mobile) but with reduced clock speeds, shader count and memory bandwidth. Compared to the normal mobile RTX3000 , the Max-Q variants are clocked lower and work in a more efficient state. Currently, we know of three variants with different clock speeds and power consumptions (60, 65 and 70 W).
Model Shader TGP (W) Base (MHz) Boost (MHz) Quadro RTX 4000 Desktop 2304 160 1005 1545 Quadro RTX 3000 Mobile 1920 80 945 1380 Quadro RTX 3000 Max-Q 1920 70 870 1380 Quadro RTX 4000 Max-Q 2304 65 765 1305 Quadro RTX 4000 Max-Q 2304 60 600 1215 GeForce RTX 2070 Mobile 2304 80 885 1185 GeForce RTX 2070 Mobile 2304 90 1080 1305
The Quadro GPUs offer certified drivers , which are optimized for stability and performance in professional applications (CAD, DCC, medical, prospection, and visualizing applications). The performance in these areas is therefore much better compared to corresponding consumer GPUs.
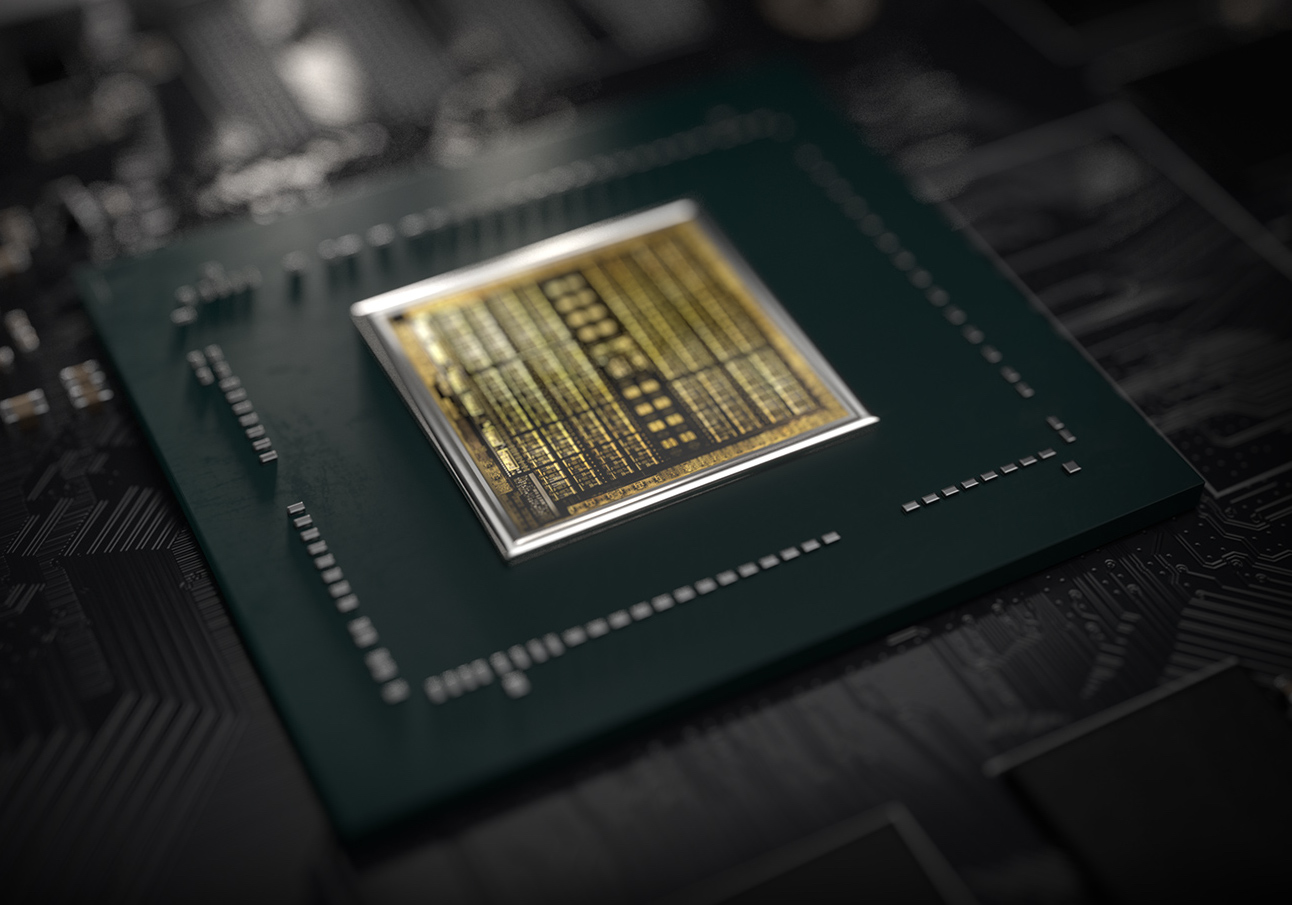
NVIDIA manufacturers the TU106 chip on a 12 nm FinFET process and includes features like Deep Learning Super Sampling (DLSS) and Real-Time Ray Tracing (RTRT), which should combine to create more realistic lighting effects than older GPUs based on the company's Pascal architecture (if the games support it). The Quadro RTX 3000 is also DisplayPort 1.4 ready, while there is also support for HDMI 2.0b, HDR, Simultaneous Multi-Projection (SMP) and H.265 video en/decoding (PlayReady 3.0).
Performance
In professional applications, the Quadro RTX 3000 Max-Q can be faster GeForce RTX 2070 Max-Q due to the optimized drivers and bigger VRAM. When gaming with the RTX 3000, the slower clock speeds and less frequently updated drivers should hinder the performance compared to the GeForce variant.
The still relatively high power consumption of the RTX3000 Max-Q makes the card most suited for big laptops. However, we should see thinner designs with the Max-Q variants than the regular RTX 3000.
NVIDIA T550 Laptop GPU ► remove from comparison
The Nvidia T550 Laptop GPU (formerly known as Quadro T550 Mobile) for laptops is a professional mobile graphics card that is based on the Turing architecture (TU117 chip). It is based on the consumer GeForce MX550 and features the same 1024 cores and a 64 Bit memory bus. The card offers 4 GB GDDR6 with a maximum bandwidth of 112 GB/s and no dedicated display outputs (iGPU display outputs used via Optimus). The chip is manufactured in 12nm FinFET at TSMC.
The professional GPUs offer certified drivers , which are optimized for stability and performance in professional applications (CAD, DCC, medical, prospection, and visualizing applications). The performance in these areas is therefore much better compared to corresponding consumer GPUs.
The Turing generation did not only introduce raytracing for the RTX cards, but also optimized the architecture of the cores and caches. According to Nvidia the CUDA cores offer now a concurrent execution of floating point and integer operations for increased performance in compute-heavy workloads of modern games. Furthermore, the caches were reworked (new unified memory architecture with twice the cache compared to Pascal). This leads to up to 50% more instructions per clock and a 40% more power efficient usage compared to Pascal. In contrary to the faster Quadro RTX cards, the T550 does not feature raytracing and Tensor cores.
NVIDIA T600 Laptop GPU ► remove from comparison
The Nvidia T600 Laptop GPU (or Quadro T600 for laptops) is a professional mobile graphics card that is based on the Turing architecture (TU117 chip). It is similar to the consumer GTX 1650 with 896 CUDA cores and a 128 Bit memory bus for GDDR6 graphics memory (10 Gbits). The chip is manufactured in 12nm FinFET at TSMC. The T600 was introduced as a refresh together with the T1200 and should be slightly slower than the older Quadro T1000 (2.6 versus 2.5 TFLOPS peak SP performance).
The Turing generation did not only introduce raytracing for the RTX cards, but also optimized the architecture of the cores and caches. According to Nvidia the CUDA cores offer now a concurrent execution of floating point and integer operations for increased performance in compute-heavy workloads of modern games.
Furthermore, the caches were reworked (new unified memory architecture with twice the cache compared to Pascal). This leads to up to 50% more instructions per clock and a 40% more power efficient usage compared to Pascal. In contrary to the faster Quadro RTX cards, the T600 do not feature raytracing and Tensor cores.
Currently Nvidia only specifies the TDP of 25 Watt (the older T1000 had a TGP of 40-50 Watt). Therefore, the T600 should be well suited for thin and light laptops.
NVIDIA Quadro RTX 3000 Max-Q NVIDIA T550 Laptop GPU NVIDIA T600 Laptop GPU Quadro Turing Series Codename N19E-Q1 MAX-Q TU117 Architecture Turing Turing Turing Pipelines 1920 - unified 1024 - unified 896 - unified Core Speed 600 - 870 - 1215 - 1380 (Boost) MHz 1065 - 1665 (Boost) MHz 1400 (Boost) MHz Memory Speed 14000 MHz 12000 effective = 1500 MHz 10000 MHz Memory Bus Width 192 Bit 64 Bit 128 Bit Memory Type GDDR6 GDDR5, GDDR6 GDDR6 Max. Amount of Memory 6 GB 4 GB 4 GB Shared Memory no no no API DirectX 12_1, OpenGL 4.6 DirectX 12_1, Shader 6.7, OpenGL 4.6 DirectX 12_1, OpenGL 4.6 Power Consumption 60 - 70 Watt 25 Watt (20 - 60 Watt TGP) 40 Watt Transistors 10.8 Billion technology 12 nm 12 nm 12 nm Features DLSS, Raytraycing, VR Ready, G-SYNC, Vulkan, Multi Monitor 2.5 TFLOPS SP max. performance, DisplayPort 1.4, HDMI 2.0b, PCIe 4.0 x8, 160 GB/s memory bandwidth Notebook Size large medium sized medium sized Date of Announcement 27.05.2019 27.05.2022 12.04.2021 Theoretical Performance 7.2 TFLOPS FP16, 3.7 TFLOPS FP32 Memory Bandwidth 112 GB/s Information Optimus only Link to Manufacturer Page nvdam.widen.net www.nvidia.com
Benchmarks Performance Rating - 3DMark 11 + Fire Strike + Time Spy - Quadro RTX 3000 Max-Q
6.2 pt (19%)
...
NVIDIA Quadro RTX 3000 Max-Q
...
max:
Performance Rating - 3DMark 11 + Fire Strike + Time Spy - T600 Laptop GPU
3.6 pt (11%)
...
...
max:
3DMark - 3DMark Time Spy Score
min: 5070 avg: 5388 median: 5357 (15%) max: 5737 Points
GPU TDP ? TDP 60 W 100% 99%
min: 2031 avg: 2187 median: 2066 (6%) max: 2465 Points
GPU TDP ? TDP 20 W TDP 30 W TDP 60 W 100% 38% 46% 99%
3075 Points (9%)
GPU TDP ? TDP 20 W TDP 25 W TDP 30 W TDP 60 W 100% 38% 57% 46% 99%
3DMark - 3DMark Time Spy Graphics
min: 4943 avg: 5132 median: 5048 (13%) max: 5405 Points
GPU TDP ? TDP 60 W 100% 98%
min: 1882 avg: 2021 median: 1928 (5%) max: 2252 Points
GPU TDP ? TDP 20 W TDP 30 W TDP 60 W 100% 37% 44% 98%
2766 Points (7%)
GPU TDP ? TDP 20 W TDP 25 W TDP 30 W TDP 60 W 100% 37% 53% 44% 98%
3DMark - 3DMark Cloud Gate Score
min: 32299 avg: 33282 median: 33281.5 (36%) max: 34264 Points
min: 17399 avg: 17614 median: 17614 (19%) max: 17829 Points
GPU TDP ? TDP 20 W 100% 53%
35278 Points (38%)
GPU TDP ? TDP 20 W TDP 25 W 94% 50% 100%
3DMark - 3DMark Cloud Gate Graphics
min: 54418 avg: 66284 median: 66284 (17%) max: 78150 Points
min: 32743 avg: 33219 median: 33218.5 (9%) max: 33694 Points
GPU TDP ? TDP 20 W 100% 50%
53941 Points (14%)
GPU TDP ? TDP 20 W TDP 25 W 100% 50% 81%
3DMark - 3DMark Fire Strike Standard Score
min: 12130 avg: 12705 median: 12642 (22%) max: 13342 Points
GPU TDP ? TDP 60 W 100% 99%
min: 4559 avg: 4786 median: 4581 (8%) max: 5218 Points
GPU TDP ? TDP 20 W TDP 30 W TDP 60 W 100% 36% 41% 99%
7475 Points (13%)
GPU TDP ? TDP 20 W TDP 25 W TDP 30 W TDP 60 W 100% 36% 59% 41% 99%
3DMark - 3DMark Fire Strike Standard Graphics
min: 13196 avg: 13714 median: 13617 (15%) max: 14328 Points
GPU TDP ? TDP 60 W 100% 99%
min: 4816 avg: 5100 median: 4890 (6%) max: 5593 Points
GPU TDP ? TDP 20 W TDP 30 W TDP 60 W 100% 35% 41% 99%
7928 Points (9%)
GPU TDP ? TDP 20 W TDP 25 W TDP 30 W TDP 60 W 100% 35% 58% 41% 99%
3DMark - 3DMark Ice Storm Graphics
86888 Points (10%)
75124 Points (9%)
GPU TDP ? TDP 25 W 100% 86%
3DMark - 3DMark Wild Life Extreme Unlimited
min: 3530 avg: 3590 median: 3589.5 (4%) max: 3649 Points
3DMark 11 - 3DM11 Performance Score
min: 14763 avg: 16774 median: 16577 (23%) max: 18981 Points
GPU TDP ? TDP 60 W 100% 98%
min: 7405 avg: 8160 median: 8160 (11%) max: 8915 Points
GPU TDP ? TDP 20 W TDP 30 W TDP 60 W 100% 44% 53% 98%
10973 Points (15%)
GPU TDP ? TDP 20 W TDP 25 W TDP 30 W TDP 60 W 100% 44% 65% 53% 98%
3DMark 11 - 3DM11 Performance GPU
min: 17074 avg: 18037 median: 17523 (15%) max: 19513 Points
GPU TDP ? TDP 60 W 100% 96%
min: 7432 avg: 8067 median: 8066.5 (7%) max: 8701 Points
GPU TDP ? TDP 20 W TDP 30 W TDP 60 W 100% 41% 48% 96%
10498 Points (9%)
GPU TDP ? TDP 20 W TDP 25 W TDP 30 W TDP 60 W 100% 41% 57% 48% 96%
3DMark Vantage + NVIDIA T550 Laptop GPU 3DMark Vantage - 3DM Vant. Perf. total
25155 Points (7%)
3DM Vant. Perf. total + NVIDIA T600 Laptop GPU
39112 Points (11%)
GPU TDP 20 W TDP 25 W 64% 100%
3DM Vant. Perf. GPU no PhysX + NVIDIA T550 Laptop GPU 3DMark Vantage - 3DM Vant. Perf. GPU no PhysX
24697 Points (14%)
3DM Vant. Perf. GPU no PhysX + NVIDIA T600 Laptop GPU
34680 Points (20%)
GPU TDP 20 W TDP 25 W 71% 100%
3DMark 06 3DMark 06 - Standard 1280x1024 + NVIDIA T550 Laptop GPU
31003 Points (41%)
3DMark 06 - Standard 1280x1024 + NVIDIA T600 Laptop GPU
43438 Points (57%)
GPU TDP 20 W TDP 25 W 71% 100%
Unigine Valley 1.0 - Unigine Valley 1.0 DX
68 fps (22%)
Blender - Blender 3.3 Classroom CUDA *
min: 278 avg: 282 median: 283 (42%) max: 285 Seconds
GPU TDP 20 W TDP 30 W 100% 102%
Blender - Blender 3.3 Classroom OPTIX *
min: 256 avg: 263.3 median: 265 (99%) max: 269 Seconds
GPU TDP 20 W TDP 30 W 100% 650%
SPECviewperf 12 + NVIDIA Quadro RTX 3000 Max-Q SPECviewperf 12 - specvp12 sw-03
min: 108.6 avg: 110.3 median: 110.3 (27%) max: 111.9 fps
specvp12 snx-02 + NVIDIA Quadro RTX 3000 Max-Q SPECviewperf 12 - specvp12 snx-02
min: 90.5 avg: 96.8 median: 96.8 (14%) max: 103 fps
specvp12 showcase-01 + NVIDIA Quadro RTX 3000 Max-Q SPECviewperf 12 - specvp12 showcase-01
min: 67.8 avg: 70.6 median: 70.6 (15%) max: 73.3 fps
specvp12 mediacal-01 + NVIDIA Quadro RTX 3000 Max-Q SPECviewperf 12 - specvp12 mediacal-01
min: 41.02 avg: 43.8 median: 43.8 (11%) max: 46.63 fps
specvp12 maya-04 + NVIDIA Quadro RTX 3000 Max-Q SPECviewperf 12 - specvp12 maya-04
min: 58.5 avg: 61.6 median: 61.6 (17%) max: 64.7 fps
specvp12 energy-01 + NVIDIA Quadro RTX 3000 Max-Q SPECviewperf 12 - specvp12 energy-01
min: 9.99 avg: 10.6 median: 10.6 (9%) max: 11.25 fps
specvp12 creo-01 + NVIDIA Quadro RTX 3000 Max-Q SPECviewperf 12 - specvp12 creo-01
min: 99.1 avg: 109.8 median: 109.8 (44%) max: 120.4 fps
specvp12 catia-04 + NVIDIA Quadro RTX 3000 Max-Q SPECviewperf 12 - specvp12 catia-04
min: 97.4 avg: 104.8 median: 104.8 (17%) max: 112.1 fps
SPECviewperf 13 specvp13 sw-04 + NVIDIA Quadro RTX 3000 Max-Q SPECviewperf 13 - specvp13 sw-04
min: 110.8 avg: 120.4 median: 123.7 (33%) max: 126.7 fps
GPU TDP ? TDP 60 W 93% 100%
specvp13 sw-04 + NVIDIA T550 Laptop GPU
min: 95 avg: 98.8 median: 95.8 (26%) max: 105.68 fps
GPU TDP ? TDP 20 W TDP 30 W TDP 60 W 93% 75% 83% 100%
specvp13 sw-04 + NVIDIA T600 Laptop GPU
106 fps (28%)
GPU TDP ? TDP 20 W TDP 25 W TDP 30 W TDP 60 W 93% 75% 84% 83% 100%
specvp13 snx-03 + NVIDIA Quadro RTX 3000 Max-Q SPECviewperf 13 - specvp13 snx-03
min: 179.4 avg: 192.4 median: 195.8 (22%) max: 202.1 fps
GPU TDP ? TDP 60 W 97% 100%
specvp13 snx-03 + NVIDIA T550 Laptop GPU
min: 95.8 avg: 101.7 median: 99.7 (11%) max: 109.67 fps
GPU TDP ? TDP 20 W TDP 30 W TDP 60 W 97% 50% 56% 100%
specvp13 snx-03 + NVIDIA T600 Laptop GPU
137 fps (15%)
GPU TDP ? TDP 20 W TDP 25 W TDP 30 W TDP 60 W 97% 50% 70% 56% 100%
specvp13 showcase-02 + NVIDIA Quadro RTX 3000 Max-Q SPECviewperf 13 - specvp13 showcase-02
min: 67.8 avg: 70.7 median: 71.5 (16%) max: 72.8 fps
GPU TDP ? TDP 60 W 98% 100%
specvp13 showcase-02 + NVIDIA T550 Laptop GPU
min: 24.8 avg: 26.1 median: 25.3 (6%) max: 28.06 fps
GPU TDP ? TDP 20 W TDP 30 W TDP 60 W 98% 35% 39% 100%
specvp13 showcase-02 + NVIDIA T600 Laptop GPU
41.4 fps (9%)
GPU TDP ? TDP 20 W TDP 25 W TDP 30 W TDP 60 W 98% 35% 58% 39% 100%
specvp13 medical-02 + NVIDIA Quadro RTX 3000 Max-Q SPECviewperf 13 - specvp13 medical-02
min: 67.1 avg: 70.2 median: 69.5 (15%) max: 73.9 fps
GPU TDP ? TDP 60 W 100% 99%
specvp13 medical-02 + NVIDIA T550 Laptop GPU
min: 34.5 avg: 37.2 median: 36.2 (8%) max: 40.74 fps
GPU TDP ? TDP 20 W TDP 30 W TDP 60 W 100% 50% 58% 99%
specvp13 medical-02 + NVIDIA T600 Laptop GPU
42.6 fps (9%)
GPU TDP ? TDP 20 W TDP 25 W TDP 30 W TDP 60 W 100% 50% 60% 58% 99%
specvp13 maya-05 + NVIDIA Quadro RTX 3000 Max-Q SPECviewperf 13 - specvp13 maya-05
min: 146.4 avg: 158.7 median: 160.8 (18%) max: 168.8 fps
GPU TDP ? TDP 60 W 98% 100%
specvp13 maya-05 + NVIDIA T550 Laptop GPU
min: 77.5 avg: 82 median: 80.9 (9%) max: 87.57 fps
GPU TDP ? TDP 20 W TDP 30 W TDP 60 W 98% 49% 54% 100%
specvp13 maya-05 + NVIDIA T600 Laptop GPU
110 fps (12%)
GPU TDP ? TDP 20 W TDP 25 W TDP 30 W TDP 60 W 98% 49% 68% 54% 100%
specvp13 energy-02 + NVIDIA Quadro RTX 3000 Max-Q SPECviewperf 13 - specvp13 energy-02
min: 25.94 avg: 27.2 median: 27.1 (9%) max: 28.6 fps
GPU TDP ? TDP 60 W 100% 99%
specvp13 energy-02 + NVIDIA T550 Laptop GPU
min: 11.7 avg: 12.4 median: 12 (4%) max: 13.37 fps
GPU TDP ? TDP 20 W TDP 30 W TDP 60 W 100% 43% 49% 99%
specvp13 energy-02 + NVIDIA T600 Laptop GPU
16.1 fps (5%)
GPU TDP ? TDP 20 W TDP 25 W TDP 30 W TDP 60 W 100% 43% 59% 49% 99%
specvp13 creo-02 + NVIDIA Quadro RTX 3000 Max-Q SPECviewperf 13 - specvp13 creo-02
min: 151.8 avg: 167 median: 168.3 (25%) max: 180.9 fps
GPU TDP ? TDP 60 W 99% 100%
specvp13 creo-02 + NVIDIA T550 Laptop GPU
min: 82.4 avg: 86.2 median: 85.5 (13%) max: 90.66 fps
GPU TDP ? TDP 20 W TDP 30 W TDP 60 W 99% 50% 54% 100%
specvp13 creo-02 + NVIDIA T600 Laptop GPU
110 fps (16%)
GPU TDP ? TDP 20 W TDP 25 W TDP 30 W TDP 60 W 99% 50% 65% 54% 100%
specvp13 catia-05 + NVIDIA Quadro RTX 3000 Max-Q SPECviewperf 13 - specvp13 catia-05
min: 166.9 avg: 186.8 median: 194.8 (22%) max: 198.6 fps
GPU TDP ? TDP 60 W 94% 100%
specvp13 catia-05 + NVIDIA T550 Laptop GPU
min: 104 avg: 110.4 median: 109 (12%) max: 118.22 fps
GPU TDP ? TDP 20 W TDP 30 W TDP 60 W 94% 55% 61% 100%
specvp13 catia-05 + NVIDIA T600 Laptop GPU
130 fps (14%)
GPU TDP ? TDP 20 W TDP 25 W TDP 30 W TDP 60 W 94% 55% 67% 61% 100%
specvp13 3dsmax-06 + NVIDIA Quadro RTX 3000 Max-Q SPECviewperf 13 - specvp13 3dsmax-06
min: 120.3 avg: 130.4 median: 134.6 (23%) max: 136.2 fps
GPU TDP ? TDP 60 W 95% 100%
specvp13 3dsmax-06 + NVIDIA T550 Laptop GPU
min: 61.6 avg: 63.7 median: 63 (11%) max: 66.38 fps
GPU TDP ? TDP 20 W TDP 30 W TDP 60 W 95% 46% 49% 100%
specvp13 3dsmax-06 + NVIDIA T600 Laptop GPU
89.8 fps (16%)
GPU TDP ? TDP 20 W TDP 25 W TDP 30 W TDP 60 W 95% 46% 67% 49% 100%
SPECviewperf 2020 specvp2020 solidworks-05 1080p + NVIDIA Quadro RTX 3000 Max-Q SPECviewperf 2020 - specvp2020 solidworks-05 1080p
93.8 fps (18%)
specvp2020 solidworks-05 1080p + NVIDIA T550 Laptop GPU
min: 46.3 avg: 54 median: 54.3 (11%) max: 61.38 fps
GPU TDP 20 W TDP 30 W TDP 60 W 54% 65% 100%
specvp2020 solidworks-05 1080p + NVIDIA T600 Laptop GPU
73.4 fps (14%)
GPU TDP 20 W TDP 25 W TDP 30 W TDP 60 W 54% 78% 65% 100%
specvp2020 snx-04 1080p + NVIDIA Quadro RTX 3000 Max-Q SPECviewperf 2020 - specvp2020 snx-04 1080p
184 fps (30%)
specvp2020 snx-04 1080p + NVIDIA T550 Laptop GPU
min: 84 avg: 99.4 median: 99.3 (16%) max: 114.82 fps
GPU TDP 20 W TDP 30 W TDP 60 W 50% 62% 100%
specvp2020 snx-04 1080p + NVIDIA T600 Laptop GPU
136 fps (22%)
GPU TDP 20 W TDP 25 W TDP 30 W TDP 60 W 50% 74% 62% 100%
specvp2020 medical-03 1080p + NVIDIA Quadro RTX 3000 Max-Q SPECviewperf 2020 - specvp2020 medical-03 1080p
33.9 fps (24%)
specvp2020 medical-03 1080p + NVIDIA T550 Laptop GPU
min: 13.5 avg: 15.6 median: 15.4 (11%) max: 17.87 fps
GPU TDP 20 W TDP 30 W TDP 60 W 43% 53% 100%
specvp2020 medical-03 1080p + NVIDIA T600 Laptop GPU
18.7 fps (13%)
GPU TDP 20 W TDP 25 W TDP 30 W TDP 60 W 43% 55% 53% 100%
specvp2020 maya-06 1080p + NVIDIA Quadro RTX 3000 Max-Q SPECviewperf 2020 - specvp2020 maya-06 1080p
177 fps (26%)
specvp2020 maya-06 1080p + NVIDIA T550 Laptop GPU
min: 86.9 avg: 98.2 median: 98.1 (14%) max: 109.68 fps
GPU TDP 20 W TDP 30 W TDP 60 W 52% 62% 100%
specvp2020 maya-06 1080p + NVIDIA T600 Laptop GPU
125 fps (18%)
GPU TDP 20 W TDP 25 W TDP 30 W TDP 60 W 52% 71% 62% 100%
specvp2020 energy-03 1080p + NVIDIA Quadro RTX 3000 Max-Q SPECviewperf 2020 - specvp2020 energy-03 1080p
29.3 fps (24%)
specvp2020 energy-03 1080p + NVIDIA T550 Laptop GPU
min: 10.6 avg: 12.1 median: 12 (10%) max: 13.56 fps
GPU TDP 20 W TDP 30 W TDP 60 W 39% 46% 100%
specvp2020 energy-03 1080p + NVIDIA T600 Laptop GPU
16 fps (13%)
GPU TDP 20 W TDP 25 W TDP 30 W TDP 60 W 39% 55% 46% 100%
specvp2020 creo-03 1080p + NVIDIA Quadro RTX 3000 Max-Q SPECviewperf 2020 - specvp2020 creo-03 1080p
101 fps (50%)
specvp2020 creo-03 1080p + NVIDIA T550 Laptop GPU
min: 44.5 avg: 46.2 median: 45.7 (23%) max: 48.5 fps
GPU TDP 20 W TDP 30 W TDP 60 W 46% 45% 100%
specvp2020 creo-03 1080p + NVIDIA T600 Laptop GPU
67.3 fps (33%)
GPU TDP 20 W TDP 25 W TDP 30 W TDP 60 W 46% 67% 45% 100%
specvp2020 catia-06 1080p + NVIDIA Quadro RTX 3000 Max-Q SPECviewperf 2020 - specvp2020 catia-06 1080p
56.4 fps (36%)
specvp2020 catia-06 1080p + NVIDIA T550 Laptop GPU
min: 22.4 avg: 25.6 median: 24.9 (16%) max: 29.58 fps
GPU TDP 20 W TDP 30 W TDP 60 W 42% 52% 100%
specvp2020 catia-06 1080p + NVIDIA T600 Laptop GPU
33.1 fps (21%)
GPU TDP 20 W TDP 25 W TDP 30 W TDP 60 W 42% 59% 52% 100%
specvp2020 3dsmax-07 1080p + NVIDIA Quadro RTX 3000 Max-Q SPECviewperf 2020 - specvp2020 3dsmax-07 1080p
65.5 fps (30%)
specvp2020 3dsmax-07 1080p + NVIDIA T550 Laptop GPU
min: 28.3 avg: 30 median: 29.6 (13%) max: 32.03 fps
GPU TDP 20 W TDP 30 W TDP 60 W 44% 49% 100%
specvp2020 3dsmax-07 1080p + NVIDIA T600 Laptop GPU
40.9 fps (19%)
GPU TDP 20 W TDP 25 W TDP 30 W TDP 60 W 44% 62% 49% 100%
Cinebench R10 Cinebench R10 Shading (32bit) + NVIDIA Quadro RTX 3000 Max-Q Cinebench R10 - Cinebench R10 Shading (32bit)
6821 Points (5%)
Cinebench R11.5 Cinebench R11.5 OpenGL 64 Bit + NVIDIA Quadro RTX 3000 Max-Q Cinebench R11.5 - Cinebench R11.5 OpenGL 64 Bit
116.6 fps (40%)
Cinebench R11.5 OpenGL 64 Bit + NVIDIA T600 Laptop GPU
162.3 fps (56%)
GPU TDP ? TDP 25 W 72% 100%
Cinebench R15 + NVIDIA Quadro RTX 3000 Max-Q Cinebench R15 - Cinebench R15 OpenGL 64 Bit
min: 201 avg: 211.7 median: 202 (12%) max: 232 fps
GPU TDP ? TDP 60 W 100% 93%
Cinebench R15 OpenGL 64 Bit + NVIDIA T550 Laptop GPU
min: 184.9 avg: 193 median: 189.2 (11%) max: 205 fps
GPU TDP ? TDP 20 W TDP 30 W TDP 60 W 100% 86% 94% 93%
Cinebench R15 OpenGL 64 Bit + NVIDIA T600 Laptop GPU
268 fps (16%)
GPU TDP ? TDP 20 W TDP 25 W TDP 30 W TDP 60 W 81% 70% 100% 76% 75%
Cinebench R15 OpenGL Ref. Match 64 Bit + NVIDIA Quadro RTX 3000 Max-Q Cinebench R15 - Cinebench R15 OpenGL Ref. Match 64 Bit
99.6 % (100%)
GPU TDP ? TDP 60 W 100% 100%
Cinebench R15 OpenGL Ref. Match 64 Bit + NVIDIA T550 Laptop GPU
99.6 % (100%)
GPU TDP ? TDP 20 W TDP 30 W TDP 60 W 100% 100% 100% 100%
Cinebench R15 OpenGL Ref. Match 64 Bit + NVIDIA T600 Laptop GPU
99.6 % (100%)
GPU TDP ? TDP 20 W TDP 25 W TDP 30 W TDP 60 W 100% 100% 100% 100% 100%
GFXBench - GFXBench 5.0 Aztec Ruins High Tier Offscreen
102.9 fps (19%)
19 fps (3%)
GPU TDP ? TDP 20 W 100% 18%
62.7 fps (11%)
GPU TDP ? TDP 20 W TDP 25 W 100% 18% 61%
GFXBench - GFXBench 5.0 Aztec Ruins Normal Tier Offscreen
243.8 fps (18%)
43.5 fps (3%)
GPU TDP ? TDP 20 W 100% 18%
162.2 fps (12%)
GPU TDP ? TDP 20 W TDP 25 W 100% 18% 67%
GFXBench - GFXBench Car Chase Offscreen
234 fps (26%)
118.3 fps (13%)
GPU TDP ? TDP 20 W 100% 51%
156.5 fps (18%)
GPU TDP ? TDP 20 W TDP 25 W 100% 51% 67%
GFXBench 3.1 - GFXBench Manhattan ES 3.1 Offscreen
172.6 fps (4%)
GFXBench 3.0 - GFXBench 3.0 Manhattan Offscreen
229.9 fps (13%)
GFXBench (DX / GLBenchmark) 2.7 + NVIDIA T550 Laptop GPU GFXBench (DX / GLBenchmark) 2.7 - GFXBench T-Rex HD Offscreen C24Z16
449.9 fps (4%)
GFXBench T-Rex HD Offscreen C24Z16 + NVIDIA T600 Laptop GPU
585 fps (5%)
GPU TDP 20 W TDP 25 W 77% 100%
LuxMark v2.0 64Bit - LuxMark v2.0 Room GPU
2153 Samples/s (10%)
1166 Samples/s (5%)
GPU TDP ? TDP 25 W 100% 54%
LuxMark v2.0 64Bit - LuxMark v2.0 Sala GPU
4392 Samples/s (8%)
2200 Samples/s (4%)
GPU TDP ? TDP 25 W 100% 50%
ComputeMark v2.1 - ComputeMark v2.1 Result
10064 Points (11%)
5190 Points (6%)
GPU TDP ? TDP 20 W 100% 52%
5694 Points (6%)
GPU TDP ? TDP 20 W TDP 25 W 100% 52% 57%
Power Consumption - Furmark Stress Test Power Consumption - external Monitor *
102 Watt (14%)
min: 34.2 avg: 34.7 median: 34.7 (5%) max: 35.1 Watt
GPU TDP 20 W TDP 60 W 111% 100%
54.7 Watt (8%)
GPU TDP 20 W TDP 25 W TDP 60 W 111% 108% 100%
Power Consumption - The Witcher 3 Power Consumption - external Monitor *
109.6 Watt (15%)
min: 41.2 avg: 41.3 median: 41.3 (6%) max: 41.4 Watt
GPU TDP 20 W TDP 60 W 111% 100%
60.6 Watt (8%)
GPU TDP 20 W TDP 25 W TDP 60 W 111% 108% 100%
Power Consumption - Witcher 3 Power Consumption *
min: 106 avg: 113.8 median: 115.4 (25%) max: 120 Watt
GPU TDP ? TDP 60 W 103% 100%
min: 42.9 avg: 44.1 median: 44.1 (10%) max: 45.3 Watt
GPU TDP ? TDP 20 W TDP 60 W 103% 123% 100%
62.3 Watt (14%)
GPU TDP ? TDP 20 W TDP 25 W TDP 60 W 103% 123% 117% 100%
Power Consumption - Witcher 3 ultra Power Efficiency
min: 0.4342 avg: 0.5 median: 0.5 (45%) max: 0.4957 fps per Watt
GPU TDP ? TDP 60 W 100% 91%
min: 0.4393 avg: 0.4 median: 0.4 (44%) max: 0.4569 fps per Watt
GPU TDP ? TDP 20 W TDP 60 W 100% 94% 91%
0.4 fps per Watt (44%)
GPU TDP ? TDP 20 W TDP 25 W TDP 60 W 100% 94% 93% 91%
Power Consumption - Witcher 3 ultra Power Efficiency - external Monitor
0.5 fps per Watt (39%)
min: 0.4734 avg: 0.5 median: 0.5 (40%) max: 0.483 fps per Watt
GPU TDP 20 W TDP 60 W 100% 99%
0.5 fps per Watt (38%)
GPU TDP 20 W TDP 25 W TDP 60 W 100% 95% 99%
Emissions Witcher 3 Fan Noise + NVIDIA Quadro RTX 3000 Max-Q Emissions - Witcher 3 Fan Noise
min: 31.6 avg: 43.5 median: 46.3 (74%) max: 52.5 dB(A)
GPU TDP ? TDP 60 W 91% 100%
Witcher 3 Fan Noise + NVIDIA T550 Laptop GPU
min: 38.2 avg: 40.4 median: 40.5 (65%) max: 42.5 dB(A)
GPU TDP ? TDP 20 W TDP 30 W TDP 60 W 91% 85% 92% 100%
Witcher 3 Fan Noise + NVIDIA T600 Laptop GPU
46.6 dB(A) (75%)
GPU TDP ? TDP 20 W TDP 25 W TDP 30 W TDP 60 W 90% 84% 100% 91% 99%
Clock Speed - GPU Clock Speed Furmark
600 MHz (24%)
Average Benchmarks NVIDIA Quadro RTX 3000 Max-Q → 100% n=31 Average Benchmarks NVIDIA T550 Laptop GPU → 49% n=31 Average Benchmarks NVIDIA T600 Laptop GPU → 69% n=31
- Range of benchmark values for this graphics card
- Average benchmark values for this graphics card
* Smaller numbers mean a higher performance
1 This benchmark is not used for the average calculation
Game Benchmarks The following benchmarks stem from our benchmarks of review laptops. The performance depends on the used graphics memory, clock rate, processor, system settings, drivers, and operating systems. So the results don't have to be representative for all laptops with this GPU. For detailed information on the benchmark results, click on the fps number.
T600 Laptop GPU:
104.1 fps
T600 Laptop GPU:
175.4 fps
T600 Laptop GPU:
113.6 fps
100%
Quadro RTX 3000 Max-Q:
178 fps
100%
Quadro RTX 3000 Max-Q:
100 fps
100%
Quadro RTX 3000 Max-Q:
86 fps
100%
Quadro RTX 3000 Max-Q:
78 fps
100%
Quadro RTX 3000 Max-Q:
27 fps
100%
Quadro RTX 3000 Max-Q:
93 fps
100%
Quadro RTX 3000 Max-Q:
52 fps
100%
Quadro RTX 3000 Max-Q:
43 fps
100%
Quadro RTX 3000 Max-Q:
36 fps
100%
Quadro RTX 3000 Max-Q:
10 fps
100%
Quadro RTX 3000 Max-Q:
105 fps
69%
T600 Laptop GPU:
72 fps
100%
Quadro RTX 3000 Max-Q:
71 fps
63%
T600 Laptop GPU:
45 fps
100%
Quadro RTX 3000 Max-Q:
63 fps
57%
T600 Laptop GPU:
36 fps
100%
Quadro RTX 3000 Max-Q:
58 fps
53%
T600 Laptop GPU:
31 fps
100%
Quadro RTX 3000 Max-Q:
24 fps
100%
Quadro RTX 3000 Max-Q:
131 fps
100%
Quadro RTX 3000 Max-Q:
88 fps
100%
Quadro RTX 3000 Max-Q:
66 fps
100%
Quadro RTX 3000 Max-Q:
59 fps
100%
Quadro RTX 3000 Max-Q:
18 fps
100%
Quadro RTX 3000 Max-Q:
90 fps
100%
Quadro RTX 3000 Max-Q:
60 fps
100%
Quadro RTX 3000 Max-Q:
50 fps
100%
Quadro RTX 3000 Max-Q:
44 fps
100%
Quadro RTX 3000 Max-Q:
19 fps
100%
Quadro RTX 3000 Max-Q:
133 fps
100%
Quadro RTX 3000 Max-Q:
71 fps
100%
Quadro RTX 3000 Max-Q:
58 fps
100%
Quadro RTX 3000 Max-Q:
47 fps
100%
Quadro RTX 3000 Max-Q:
37 fps
100%
Quadro RTX 3000 Max-Q:
23 fps
100%
Quadro RTX 3000 Max-Q:
110 fps
100%
Quadro RTX 3000 Max-Q:
70 fps
100%
Quadro RTX 3000 Max-Q:
61 fps
100%
Quadro RTX 3000 Max-Q:
33 fps
100%
Quadro RTX 3000 Max-Q:
12 fps
100%
Quadro RTX 3000 Max-Q:
118 fps
100%
Quadro RTX 3000 Max-Q:
76 fps
100%
Quadro RTX 3000 Max-Q:
65 fps
100%
Quadro RTX 3000 Max-Q:
56 fps
100%
Quadro RTX 3000 Max-Q:
41 fps
100%
Quadro RTX 3000 Max-Q:
23 fps
100%
Quadro RTX 3000 Max-Q:
98 fps
100%
Quadro RTX 3000 Max-Q:
85 fps
100%
Quadro RTX 3000 Max-Q:
79 fps
100%
Quadro RTX 3000 Max-Q:
76 fps
100%
Quadro RTX 3000 Max-Q:
54 fps
100%
Quadro RTX 3000 Max-Q:
29 fps
100%
Quadro RTX 3000 Max-Q:
178.3 fps
100%
Quadro RTX 3000 Max-Q:
119.2 fps
100%
Quadro RTX 3000 Max-Q:
104.4 fps
100%
Quadro RTX 3000 Max-Q:
102.6 fps
100%
Quadro RTX 3000 Max-Q:
67.5 fps
100%
Quadro RTX 3000 Max-Q:
31.6 fps
100%
Quadro RTX 3000 Max-Q:
76.8 fps
100%
Quadro RTX 3000 Max-Q:
71.8 fps
100%
Quadro RTX 3000 Max-Q:
66.3 fps
100%
Quadro RTX 3000 Max-Q:
46.8 fps
100%
Quadro RTX 3000 Max-Q:
24.1 fps
100%
Quadro RTX 3000 Max-Q:
82 fps
100%
Quadro RTX 3000 Max-Q:
74.7 fps
100%
Quadro RTX 3000 Max-Q:
66.7 fps
100%
Quadro RTX 3000 Max-Q:
61.9 fps
100%
Quadro RTX 3000 Max-Q:
47.5 fps
100%
Quadro RTX 3000 Max-Q:
25.9 fps
100%
Quadro RTX 3000 Max-Q:
142.5 fps
100%
Quadro RTX 3000 Max-Q:
93.8 fps
100%
Quadro RTX 3000 Max-Q:
81 fps
100%
Quadro RTX 3000 Max-Q:
54.3 fps
100%
Quadro RTX 3000 Max-Q:
34 fps
100%
Quadro RTX 3000 Max-Q:
17.5 fps
100%
Quadro RTX 3000 Max-Q:
93 fps
100%
Quadro RTX 3000 Max-Q:
72.4 fps
100%
Quadro RTX 3000 Max-Q:
66.3 fps
100%
Quadro RTX 3000 Max-Q:
51.4 fps
100%
Quadro RTX 3000 Max-Q:
46.6 fps
100%
Quadro RTX 3000 Max-Q:
21.2 fps
100%
Quadro RTX 3000 Max-Q:
75 fps
100%
Quadro RTX 3000 Max-Q:
65 fps
100%
Quadro RTX 3000 Max-Q:
59 fps
100%
Quadro RTX 3000 Max-Q:
45 fps
100%
Quadro RTX 3000 Max-Q:
32 fps
100%
Quadro RTX 3000 Max-Q:
16 fps
100%
Quadro RTX 3000 Max-Q:
114 fps
100%
Quadro RTX 3000 Max-Q:
86 fps
100%
Quadro RTX 3000 Max-Q:
68 fps
100%
Quadro RTX 3000 Max-Q:
50 fps
100%
Quadro RTX 3000 Max-Q:
34 fps
100%
Quadro RTX 3000 Max-Q:
17 fps
100%
Quadro RTX 3000 Max-Q:
203 fps
100%
Quadro RTX 3000 Max-Q:
128 fps
100%
Quadro RTX 3000 Max-Q:
101 fps
100%
Quadro RTX 3000 Max-Q:
64 fps
100%
Quadro RTX 3000 Max-Q:
47.2 fps
100%
Quadro RTX 3000 Max-Q:
66.3 fps
100%
Quadro RTX 3000 Max-Q:
63.2 fps
100%
Quadro RTX 3000 Max-Q:
57.5 fps
100%
Quadro RTX 3000 Max-Q:
55.9 fps
100%
Quadro RTX 3000 Max-Q:
44.8 fps
100%
Quadro RTX 3000 Max-Q:
24.3 fps
100%
Quadro RTX 3000 Max-Q:
86 fps
114%
T600 Laptop GPU:
98 fps
100%
Quadro RTX 3000 Max-Q:
76 fps
70%
T600 Laptop GPU:
53 fps
100%
Quadro RTX 3000 Max-Q:
71 fps
59%
T600 Laptop GPU:
42 fps
100%
Quadro RTX 3000 Max-Q:
65 fps
55%
T600 Laptop GPU:
36 fps
100%
Quadro RTX 3000 Max-Q:
43 fps
100%
Quadro RTX 3000 Max-Q:
21 fps
T600 Laptop GPU:
190.4 fps
100%
Quadro RTX 3000 Max-Q:
143 fps
52%
T550 Laptop GPU:
75 fps
73%
T600 Laptop GPU:
105 fps
100%
Quadro RTX 3000 Max-Q:
87 fps
47%
T550 Laptop GPU:
41 fps
61%
T600 Laptop GPU:
53 fps
100%
Quadro RTX 3000 Max-Q:
79 fps
48%
T550 Laptop GPU:
38 fps
62%
T600 Laptop GPU:
49 fps
100%
Quadro RTX 3000 Max-Q:
75 fps
47%
T550 Laptop GPU:
35 fps
60%
T600 Laptop GPU:
45 fps
100%
Quadro RTX 3000 Max-Q:
26 fps
100%
Quadro RTX 3000 Max-Q:
106 107 117 ~ 110 fps
98%
T600 Laptop GPU:
107.9 fps
100%
Quadro RTX 3000 Max-Q:
92 93.9 106 ~ 97 fps
95%
T600 Laptop GPU:
92.4 fps
95%
T600 Laptop GPU:
77 fps
100%
Quadro RTX 3000 Max-Q:
149 fps
58%
T600 Laptop GPU:
86 fps
100%
Quadro RTX 3000 Max-Q:
79.1 fps
55%
T600 Laptop GPU:
43.9 fps
100%
Quadro RTX 3000 Max-Q:
59.5 fps
52%
T600 Laptop GPU:
31 fps
100%
Quadro RTX 3000 Max-Q:
43.8 fps
100%
Quadro RTX 3000 Max-Q:
25.9 fps
100%
Quadro RTX 3000 Max-Q:
195 fps
100%
Quadro RTX 3000 Max-Q:
139 fps
100%
Quadro RTX 3000 Max-Q:
96.7 fps
100%
Quadro RTX 3000 Max-Q:
80.8 fps
100%
Quadro RTX 3000 Max-Q:
34 fps
100%
Quadro RTX 3000 Max-Q:
131 145 156 ~ 144 fps
104%
T600 Laptop GPU:
149.4 fps
100%
Quadro RTX 3000 Max-Q:
120 133 141 ~ 131 fps
97%
T600 Laptop GPU:
127.6 fps
100%
Quadro RTX 3000 Max-Q:
115 126 137 ~ 126 fps
92%
T600 Laptop GPU:
115.8 fps
100%
Quadro RTX 3000 Max-Q:
109 120 125 ~ 118 fps
91%
T600 Laptop GPU:
107.1 fps
59%
T600 Laptop GPU:
158.6 fps
42%
T550 Laptop GPU:
73 75 78 ~ 75 fps
52%
T600 Laptop GPU:
92.7 fps
41%
T550 Laptop GPU:
39 40 43 ~ 41 fps
52%
T600 Laptop GPU:
52.2 fps
52%
T600 Laptop GPU:
27.6 fps
100%
Quadro RTX 3000 Max-Q:
155 fps
92%
T600 Laptop GPU:
142.6 fps
100%
Quadro RTX 3000 Max-Q:
150 fps
92%
T600 Laptop GPU:
137.6 fps
100%
Quadro RTX 3000 Max-Q:
111.8 fps
74%
T600 Laptop GPU:
82.3 fps
100%
Quadro RTX 3000 Max-Q:
58.5 fps
75%
T600 Laptop GPU:
44.1 fps
100%
Quadro RTX 3000 Max-Q:
49.4 fps
100%
Quadro RTX 3000 Max-Q:
65 fps
Average Gaming NVIDIA Quadro RTX 3000 Max-Q → 100% Average Gaming 30-70 fps → 100%
Average Gaming NVIDIA T550 Laptop GPU → 57% Average Gaming 30-70 fps → 50%
Average Gaming NVIDIA T600 Laptop GPU → 73% Average Gaming 30-70 fps → 60%
 Deutsch
 English
 Español
 Français
 Italiano
 Nederlands
 Polski
 Português
 Русский
 Türkçe
 Svenska
 Chinese
 Magyar