Notebookcheck Logo

Intel HD Graphics 510 vs AMD Radeon R2 (Stoney Ridge) vs AMD Radeon R7 (Bristol Ridge)

Intel HD Graphics 510

► remove from comparison Intel HD Graphics 510

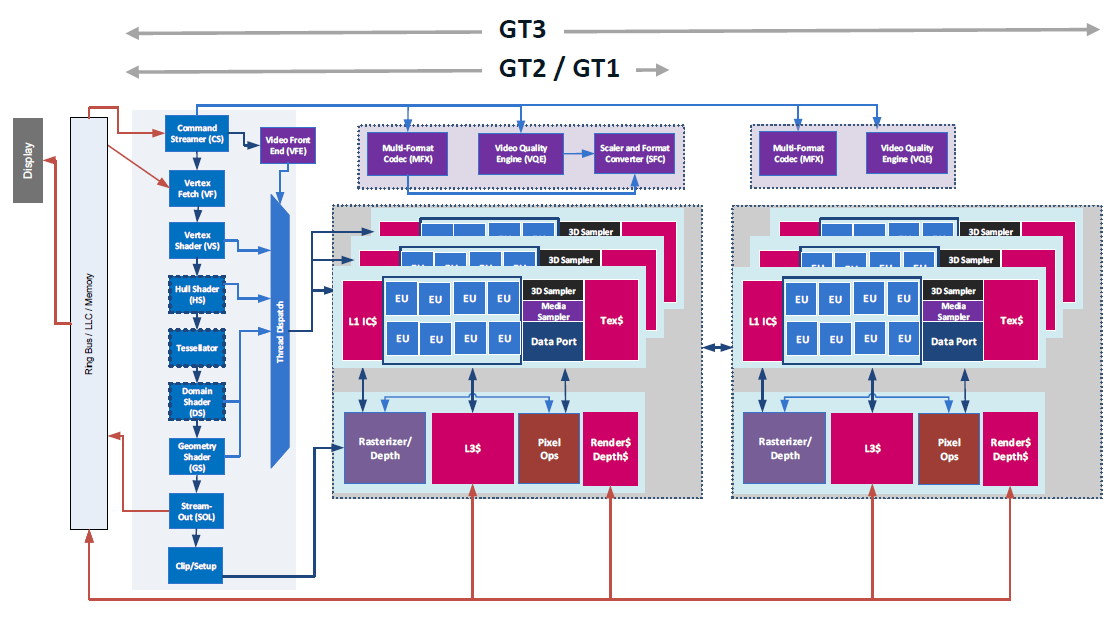
The Intel HD Graphics 510 (GT1) is an integrated graphics unit, which can be found in low-end ULV (Ultra Low Voltage) processors of the Skylake generation. This "GT1" version of the Skylake GPU offers 12 Execution Units (EUs) clocked at up to 950 MHz (depending on the CPU model). Due to its lack of dedicated graphics memory or eDRAM cache, the HD 510 has to access the main memory (2x 64bit DDR3L-1600 / DDR4-2133).

Performance

Depending on various factors like memory configuration, the HD Graphics 510 should perform sligthly below the older HD Graphics 4400 and will handle modern games (as of 2015) only in lowest settings (if it does at all).

Features

The revised video engine now decodes H.265/HEVC completely in hardware and thereby much more efficiently than before. Displays can be connected via DP 1.2 / eDP 1.3 (max. 3840 x 2160 @ 60 Hz), whereas HDMI is limited to the older version 1.4a (max. 3840 x 2160 @ 30 Hz). However, HDMI 2.0 can be added using a DisplayPort converter. Up to three displays can be controlled simultaneously.

Power Consumption

The HD Graphics 510 can be found in mobile processors specified at 15 W TDP and is therefore suited for compact laptops and ultrabooks.

AMD Radeon R2 (Stoney Ridge)

► remove from comparison AMD Radeon R2 (Stoney Ridge)

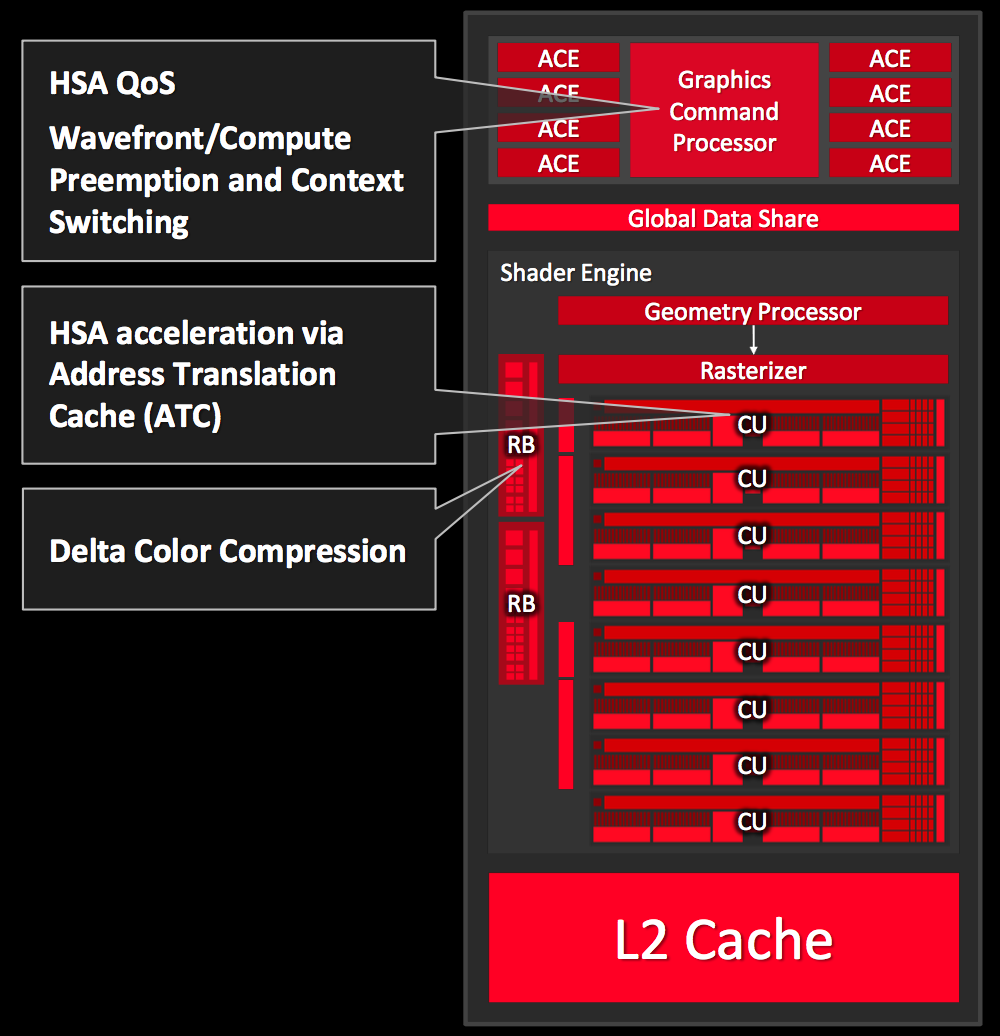
The AMD Radeon R2 (Stoney Ridge) is an integrated graphics adapter of the weakest mobile dual-core Stoney Ridge APUs. At its launch, it is being used in the AMD E2-9010 and probably has 128 shaders running at up to 600 MHz. The performance can vary heavily depending on the configured TDP and the system memory.

Architecture and Features

The Radeon R4 is equipped with two cores from the third GCN generation (often called GCN 1.2 or 2.0 by the press). This means it is very similar to the Tonga desktop chip and supports DirectX 12 (FL 12_0), but the graphics cores can also be accessed via Mantle, OpenGL, and OpenCL. The GPU supports the HSA 1.0 standard as well and can therefore use the connection with the CPU cores very efficiently. The technical specifications are identical to the Carrizo predecessor. 

The video unit includes the UVD 6 (Unified Video Decoder), which can decode HEVC/H.265 and 4K with support from the hardware. More details are available in our dedicated Stoney Ridge article

Power Consumption

Depending on the model and configured TDP (cTDP), the 28 nm chip is specified with 10 up to 15 Watts. This means it can also be used for thin and light notebooks.

AMD Radeon R7 (Bristol Ridge)

► remove from comparison AMD Radeon R7 (Bristol Ridge)

The AMD Radeon R7 (Bristol Ridge) is an integrated graphics card for the fastest mobile AMD Carrizo APUs. At its launch, the R7 is available on the top model FX9830P with 512 GCN shader units and a core clock of 900 MHz. The technical specifications do not differ from the AMD Radeon R7 in Carrizo, but the clock is up to 100 MHz higher. Depending on the cooling and the configurable TDP (12-45 Watts), the performance can differ quite a lot. The performance also depends on the memory (best performance with dual-channel DDR4).

Architecture and Features

According to AMD, the Radeon R7 consists of eight cores based on the third GCN generation (often called GCN 1.2 or 2.0 in the press). It is therefore very similar to the Tonga desktop chip and supports DirectX 12 (FL 12_0). Furthermore, its shaders can be used with Mantle, OpenGL and OpenCL. HSA 1.0 is supported for running code on both CPU and GPU cores simultaneously.

Compared to the Kaveri generation (Kaveri R7 with GCN 1.1), the new color compression in particular results in better memory utilization and improves the gaming performance by 5-7 %. 

The improved video decoder of Carrizo/Bristol Ridge now includes UVD 6 (Unified Video Decoder), which can decode HVEC / H.265 up to 4K in hardware. Furthermore, the VCE (Video Codec Engine) has been improved for faster transcoding of H.264. More information on architecture and features of the Bristol Ridge architecture can be found in our launch article.

Performance

Depending on the configurable TDP of the Bristol Ridge chips between 12 up to 45 Watts, there can be significant differences in games. Overall, the results are slightly better compared to the Carrizo Radeon R7 due to the higher clocks for comparable model. You can still use the Kaveri R7 benchmarks to check the gaming performance.

Power Consumption

Depending on the configurable TDP (cTDP), the 28 nm chip is specified at 12-45 Watts. It can therefore be used for thin and light notebooks as well as medium-sized devices or All-in-Ones (AiO).

Intel HD Graphics 510AMD Radeon R2 (Stoney Ridge)AMD Radeon R7 (Bristol Ridge)
Radeon R (Stoney / Bristol Ridge) Series
Iris Pro Graphics P580 72 @ 0.35 - 1.1 GHzeDRAM + 64/128 Bit
Iris Pro Graphics 580 72 @ 0.35 - 1.05 GHzeDRAM + 64/128 Bit
Iris Graphics 550 48 @ 0.3 - 1.1 GHzeDRAM + 64/128 Bit
Iris Graphics 540 48 @ 0.3 - 1.05 GHzeDRAM + 64/128 Bit
HD Graphics 530 24 @ 0.35 - 1.15 GHz64/128 Bit
HD Graphics 520 24 @ 0.3 - 1.05 GHz64/128 Bit
HD Graphics 515 24 @ 0.3 - 1 GHz64/128 Bit
UHD Graphics 610 12 @ 0.3 - 0.95 GHz64/128 Bit
HD Graphics 610 12 @ 0.3 - 0.95 GHz64/128 Bit
HD Graphics 510 12 @ 0.3 - 0.95 GHz64/128 Bit
UHD Graphics 605 18 @ 0.3 - 0.75 GHz64/128 Bit
HD Graphics 505 18 @ 0.3 - 0.75 GHz64/128 Bit
UHD Graphics 600 12 @ 0.3 - 0.7 GHz64/128 Bit
HD Graphics 500 12 @ 0.3 - 0.7 GHz64/128 Bit
Radeon R7 (Bristol Ridge) 512 @ 0.9 GHz64/128 Bit
Radeon R5 (Bristol Ridge) 384 @ 0.8 GHz64/128 Bit
Radeon R5 (Stoney Ridge) 192 @ 0.8 GHz64 Bit
Radeon R4 (Stoney Ridge) 192 @ 0.6 GHz64 Bit
Radeon R2 (Stoney Ridge) 128 @ 0.6 GHz64 Bit
Radeon R7 (Bristol Ridge) 512 @ 0.9 GHz64/128 Bit
Radeon R5 (Bristol Ridge) 384 @ 0.8 GHz64/128 Bit
Radeon R5 (Stoney Ridge) 192 @ 0.8 GHz64 Bit
Radeon R4 (Stoney Ridge) 192 @ 0.6 GHz64 Bit
Radeon R2 (Stoney Ridge) 128 @ 0.6 GHz64 Bit
CodenameSkylake GT1Stoney RidgeBristol Ridge
ArchitectureGen. 9 SkylakeGCN 1.2/2.0GCN 1.2
Pipelines12 - unified128 - unified512 - unified
Core Speed300 - 950 (Boost) MHz600 (Boost) MHz900 (Boost) MHz
Memory Bus Width64/128 Bit64 Bit64/128 Bit
Memory TypeDDR3/DDR4
Shared Memoryyesyesyes
APIDirectX 12_1, OpenGL 4.4DirectX 12 (FL 12_0), OpenGL 4.4DirectX 12 (FL 12_0), OpenGL 4.4
technology14 nm28 nm28 nm
FeaturesQuickSyncUVD 6, VCEUVD 6, VCE
Date of Announcement01.09.2015 01.06.2016 01.06.2016
Power Consumption15 Watt12-45 Watt
Transistors3.1 Billion2.4 Billion
Notebook Sizemedium sized
CPU in HD Graphics 510GPU Base SpeedGPU Boost / Turbo
Intel Core i5-6198DU2 x 2300 MHz, 15 W300 MHz1000 MHz
Intel Pentium 4405U2 x 2100 MHz, 15 W300 MHz950 MHz
min. - max.300 MHz950 - 1000 MHz
CPU in Radeon R2 (Stoney Ridge)GPU Base SpeedGPU Boost / Turbo
AMD A4-91202 x 2200 MHz, 15 W? MHz655 MHz
AMD E2-90102 x 2000 MHz, 15 W? MHz600 MHz
AMD E2-90002 x 1800 MHz, 10 W? MHz600 MHz
min. - max.? MHz600 - 655 MHz
CPU in Radeon R7 (Bristol Ridge)GPU Base SpeedGPU Boost / Turbo
AMD FX-9830P4 x 3000 MHz, 45 W? MHz900 MHz
AMD PRO A12-9830B4 x 3000 MHz, 45 W? MHz900 MHz
AMD FX-9800P4 x 2700 MHz, 15 W? MHz758 MHz
min. - max.? MHz758 - 900 MHz

Benchmarks

Performance Rating - 3DMark 11 + Fire Strike + Time Spy - HD Graphics 510
0.2 pt (1%)
Restrict / Search: Model: Max. age: years
Performance Rating - 3DMark 11 + Fire Strike + Time Spy - Radeon R2 (Stoney Ridge)
0.2 pt (1%)
Restrict / Search: Model: Max. age: years
Performance Rating - 3DMark 11 + Fire Strike + Time Spy - Radeon R7 (Bristol Ridge)
0.4 pt (1%)
Restrict / Search: Model: Max. age: years
3DMark - 3DMark Time Spy Score
min: 338     avg: 364.7     median: 358 (1%)     max: 398 Points
3DMark - 3DMark Time Spy Graphics
min: 325     avg: 343.7     median: 347 (1%)     max: 359 Points
3DMark - 3DMark Ice Storm Unlimited Graphics
43274 Points (4%)
min: 37423     avg: 38047     median: 38046.5 (4%)     max: 38670 Points
min: 34845     avg: 49654     median: 52245.5 (5%)     max: 59281 Points
3DMark - 3DMark Ice Storm Extreme Graphics
26846 Points (3%)
min: 32062     avg: 34971     median: 32389 (4%)     max: 40461 Points
3DMark - 3DMark Cloud Gate Score
4721 Points (4%)
min: 1998     avg: 2093     median: 2092.5 (2%)     max: 2187 Points
min: 3162     avg: 4026     median: 3942 (4%)     max: 5173 Points
3DMark - 3DMark Cloud Gate Graphics
5664 Points (1%)
min: 3009     avg: 3322     median: 3321.5 (1%)     max: 3634 Points
min: 3477     avg: 5531     median: 5311 (1%)     max: 8107 Points
3DMark - 3DMark Fire Strike Standard Score
570 Points (1%)
min: 449     avg: 463     median: 463 (1%)     max: 477 Points
min: 667     avg: 938     median: 866 (1%)     max: 1230 Points
3DMark - 3DMark Fire Strike Standard Graphics
621 Points (1%)
min: 503     avg: 512     median: 511.5 (0%)     max: 520 Points
min: 750     avg: 1081     median: 1013 (1%)     max: 1466 Points
3DMark - 3DMark Ice Storm Graphics
62653 Points (7%)
min: 44545     avg: 48082     median: 46007 (5%)     max: 53693 Points
3DMark 11 - 3DM11 Performance Score
985 Points (1%)
min: 761     avg: 775     median: 774.5 (1%)     max: 788 Points
min: 1737     avg: 1859     median: 1794 (2%)     max: 2130 Points
3DMark 11 - 3DM11 Performance GPU
847 Points (1%)
min: 714     avg: 731     median: 730.5 (1%)     max: 747 Points
min: 1820     avg: 1913     median: 1852 (1%)     max: 2210 Points
3DMark Vantage
3DM Vant. Perf. total + Intel HD Graphics 510
3DMark Vantage - 3DM Vant. Perf. total
3798 Points (1%)
3DM Vant. Perf. total + AMD Radeon R2 (Stoney Ridge)
3DM Vant. Perf. total + AMD Radeon R7 (Bristol Ridge)
5568 Points (2%)
3DM Vant. Perf. GPU no PhysX + Intel HD Graphics 510
3DMark Vantage - 3DM Vant. Perf. GPU no PhysX
3125 Points (2%)
3DM Vant. Perf. GPU no PhysX + AMD Radeon R2 (Stoney Ridge)
3DM Vant. Perf. GPU no PhysX + AMD Radeon R7 (Bristol Ridge)
5111 Points (3%)
3DMark 05 - 3DMark 05 - Standard
6853 Points (8%)
3DMark 06 3DMark 06 - Standard 1280x1024 + Intel HD Graphics 510
3DMark 06
7253 Points (9%)
3DMark 06 - Standard 1280x1024 + AMD Radeon R2 (Stoney Ridge)
3809 Points (5%)
3DMark 06 - Standard 1280x1024 + AMD Radeon R7 (Bristol Ridge)
min: 5635     avg: 6645     median: 6644.5 (9%)     max: 7654 Points
Unigine Valley 1.0 - Unigine Valley 1.0 DX
2.8 fps (1%)
3.5 fps (1%)
Unigine Heaven 3.0 - Unigine Heaven 3.0 DX 11
9.3 fps (3%)
13.9 fps (5%)
Unigine Heaven 3.0 - Unigine Heaven 3.0 OpenGL
10.8 fps (5%)
Unigine Heaven 2.1 - Heaven 2.1 high
13.5 fps (3%)
19.5 fps (4%)
Cinebench R10 Cinebench R10 Shading (32bit) + Intel HD Graphics 510
Cinebench R10 - Cinebench R10 Shading (32bit)
7348 Points (5%)
Cinebench R10 Shading (32bit) + AMD Radeon R2 (Stoney Ridge)
min: 3471     avg: 3619     median: 3619 (3%)     max: 3767 Points
Cinebench R10 Shading (32bit) + AMD Radeon R7 (Bristol Ridge)
min: 4680     avg: 4943     median: 4845 (3%)     max: 5403 Points
Cinebench R11.5 Cinebench R11.5 OpenGL 64 Bit + Intel HD Graphics 510
Cinebench R11.5 - Cinebench R11.5 OpenGL 64 Bit
17.2 fps (6%)
Cinebench R11.5 OpenGL 64 Bit + AMD Radeon R2 (Stoney Ridge)
min: 13.85     avg: 14.7     median: 14.7 (5%)     max: 15.5 fps
Cinebench R11.5 OpenGL 64 Bit + AMD Radeon R7 (Bristol Ridge)
min: 18.06     avg: 20.1     median: 18.3 (6%)     max: 25.65 fps
Cinebench R15
Cinebench R15 OpenGL 64 Bit + Intel HD Graphics 510
Cinebench R15 - Cinebench R15 OpenGL 64 Bit
28 fps (2%)
Cinebench R15 OpenGL 64 Bit + AMD Radeon R2 (Stoney Ridge)
min: 14.4     avg: 15.1     median: 15.1 (1%)     max: 15.74 fps
Cinebench R15 OpenGL 64 Bit + AMD Radeon R7 (Bristol Ridge)
min: 22.88     avg: 25.1     median: 23.2 (1%)     max: 31.43 fps
Cinebench R15 OpenGL Ref. Match 64 Bit + AMD Radeon R2 (Stoney Ridge)
Cinebench R15 - Cinebench R15 OpenGL Ref. Match 64 Bit
98 % (98%)
Cinebench R15 OpenGL Ref. Match 64 Bit + AMD Radeon R7 (Bristol Ridge)
GFXBench - GFXBench Car Chase Offscreen
35.9 fps (3%)
23.8 fps (2%)
GFXBench 3.1 - GFXBench Manhattan ES 3.1 Offscreen
51.7 fps (1%)
24.3 fps (1%)
GFXBench 3.0 - GFXBench 3.0 Manhattan Offscreen
64.6 fps (3%)
25.9 fps (1%)
GFXBench (DX / GLBenchmark) 2.7
GFXBench T-Rex HD Offscreen C24Z16 + Intel HD Graphics 510
GFXBench (DX / GLBenchmark) 2.7 - GFXBench T-Rex HD Offscreen C24Z16
121.9 fps (1%)
GFXBench T-Rex HD Offscreen C24Z16 + AMD Radeon R2 (Stoney Ridge)
GFXBench T-Rex HD Offscreen C24Z16 + AMD Radeon R7 (Bristol Ridge)
90 fps (1%)
LuxMark v2.0 64Bit - LuxMark v2.0 Room GPU
167 Samples/s (1%)
min: 175     avg: 178.5     median: 178.5 (1%)     max: 182 Samples/s
LuxMark v2.0 64Bit - LuxMark v2.0 Sala GPU
302 Samples/s (1%)
min: 358     avg: 362.5     median: 362.5 (1%)     max: 367 Samples/s
ComputeMark v2.1 - ComputeMark v2.1 Result
500 Points (0%)
min: 1093     avg: 1346     median: 1450 (1%)     max: 1495 Points
Power Consumption - The Witcher 3 Power Consumption - external Monitor *
29.1 Watt (4%)
Clock Speed - GPU Clock Witcher 3 ultra
472 MHz (19%)

Average Benchmarks Intel HD Graphics 510 → 100% n=24

Average Benchmarks AMD Radeon R2 (Stoney Ridge) → 60% n=24

Average Benchmarks AMD Radeon R7 (Bristol Ridge) → 121% n=24

- Range of benchmark values for this graphics card
red legend - Average benchmark values for this graphics card
* Smaller numbers mean a higher performance
1 This benchmark is not used for the average calculation

Game Benchmarks

The following benchmarks stem from our benchmarks of review laptops. The performance depends on the used graphics memory, clock rate, processor, system settings, drivers, and operating systems. So the results don't have to be representative for all laptops with this GPU. For detailed information on the benchmark results, click on the fps number.

low 1280x720
Radeon R7 (Bristol Ridge):
13.1  fps
low 1280x720
Radeon R7 (Bristol Ridge):
13.8  fps
low 1280x720
Radeon R2 (Stoney Ridge):
19.7  fps
Radeon R7 (Bristol Ridge):
46.2  fps
med. 1366x768
Radeon R2 (Stoney Ridge):
18.5  fps
high 1920x1080
Radeon R7 (Bristol Ridge):
34  fps
Dirt 4

Dirt 4

2017
low 1280x720
Radeon R7 (Bristol Ridge):
40.9  fps
low 1280x720
Radeon R2 (Stoney Ridge):
30.8  fps
Radeon R7 (Bristol Ridge):
57  fps
med. 1920x1080
Radeon R7 (Bristol Ridge):
33.2  fps
high 1920x1080
Radeon R7 (Bristol Ridge):
18.1  fps
Prey

Prey

2017
low 1280x720
Radeon R2 (Stoney Ridge):
9.4  fps
low 1280x720
Radeon R7 (Bristol Ridge):
11.9  fps
med. 1920x1080
Radeon R7 (Bristol Ridge):
5.3  fps
For Honor

For Honor

2017
low 1280x720
Radeon R7 (Bristol Ridge):
20.6  fps
med. 1920x1080
Radeon R7 (Bristol Ridge):
7.1  fps
low 1280x720
100%
HD Graphics 510:
18.3  fps
186%
Radeon R7 (Bristol Ridge):
31.9 36.7 ~ 34 fps
med. 1920x1080
Radeon R7 (Bristol Ridge):
12.2  fps
low 1280x720
Radeon R7 (Bristol Ridge):
11  fps
med. 1366x768
Radeon R7 (Bristol Ridge):
8.8  fps
low 1280x720
100%
HD Graphics 510:
19.9  fps
171%
Radeon R7 (Bristol Ridge):
34  fps
med. 1366x768
100%
HD Graphics 510:
15.4  fps
197%
Radeon R7 (Bristol Ridge):
30.3  fps
high 1920x1080
Radeon R7 (Bristol Ridge):
10.5  fps
low 1280x720
100%
HD Graphics 510:
70.6  fps
62%
Radeon R2 (Stoney Ridge):
43.5  fps
90%
Radeon R7 (Bristol Ridge):
63.2  fps
med. 1366x768
100%
HD Graphics 510:
41.3  fps
64%
Radeon R2 (Stoney Ridge):
26.4  fps
115%
Radeon R7 (Bristol Ridge):
47.5  fps
high 1920x1080
Radeon R7 (Bristol Ridge):
22  fps
low 1280x720
Radeon R7 (Bristol Ridge):
23.3  fps
med. 1366x768
Radeon R7 (Bristol Ridge):
16.7  fps
high 1920x1080
Radeon R7 (Bristol Ridge):
8.3  fps
low 1024x768
100%
HD Graphics 510:
24.5  fps
88%
Radeon R2 (Stoney Ridge):
21.6  fps
124%
Radeon R7 (Bristol Ridge):
30.5  fps
med. 1366x768
100%
HD Graphics 510:
9.4  fps
90%
Radeon R2 (Stoney Ridge):
8.5  fps
155%
Radeon R7 (Bristol Ridge):
14.6  fps
high 1920x1080
Radeon R7 (Bristol Ridge):
7.6  fps
low 1280x720
Radeon R7 (Bristol Ridge):
10 15.5 ~ 13 fps
med. 1366x768
Radeon R7 (Bristol Ridge):
7 11.6 ~ 9 fps
high 1920x1080
Radeon R7 (Bristol Ridge):
6.4  fps
low 1280x720
Radeon R7 (Bristol Ridge):
16.9  fps
med. 1366x768
Radeon R7 (Bristol Ridge):
11.7  fps
Overwatch

Overwatch

2016
low 1280x720
Radeon R2 (Stoney Ridge):
17.5  fps
med. 1366x768
Radeon R2 (Stoney Ridge):
15  fps
low 1280x768
Radeon R7 (Bristol Ridge):
8  fps
low 1280x720
100%
HD Graphics 510:
13.4  fps
130%
Radeon R7 (Bristol Ridge):
17.4  fps
med. 1366x768
100%
HD Graphics 510:
7.7  fps
138%
Radeon R7 (Bristol Ridge):
10.6  fps
low 1280x720
Radeon R7 (Bristol Ridge):
15  fps
med. 1920x1080
Radeon R7 (Bristol Ridge):
9  fps
high 1920x1080
Radeon R7 (Bristol Ridge):
8  fps
XCOM 2

XCOM 2

2016
low 1280x720
Radeon R7 (Bristol Ridge):
18.4  fps
med. 1920x1080
Radeon R7 (Bristol Ridge):
6.9  fps
high 1920x1080
Radeon R7 (Bristol Ridge):
4.9  fps
low 1024x768
100%
HD Graphics 510:
11.1  fps
189%
Radeon R7 (Bristol Ridge):
18 20.6 21.6 22.5 ~ 21 fps
med. 1366x768
100%
HD Graphics 510:
7  fps
186%
Radeon R7 (Bristol Ridge):
11 12.4 13.2 14.2 ~ 13 fps
high 1920x1080
Radeon R7 (Bristol Ridge):
6.2 7 7.1 ~ 7 fps
low 1024x768
100%
HD Graphics 510:
25  fps
82%
Radeon R2 (Stoney Ridge):
20.4  fps
188%
Radeon R7 (Bristol Ridge):
47.1  fps
med. 1366x768
100%
HD Graphics 510:
15.9  fps
87%
Radeon R2 (Stoney Ridge):
13.8  fps
131%
Radeon R7 (Bristol Ridge):
20.8  fps
high 1920x1080
Radeon R7 (Bristol Ridge):
14.7  fps
low 1024x768
Radeon R7 (Bristol Ridge):
16  fps
med. 1366x768
Radeon R7 (Bristol Ridge):
13.2  fps
low 1024x768
Radeon R7 (Bristol Ridge):
22.9  fps
med. 1366x768
Radeon R7 (Bristol Ridge):
21.2  fps
high 1920x1080
Radeon R7 (Bristol Ridge):
10.5  fps
Anno 2205

Anno 2205

2015
low 1024x768
100%
HD Graphics 510:
19.9  fps
131%
Radeon R7 (Bristol Ridge):
26.1  fps
med. 1366x768
100%
HD Graphics 510:
11  fps
131%
Radeon R7 (Bristol Ridge):
14.4  fps
high 1920x1080
Radeon R7 (Bristol Ridge):
6.7  fps
low 1366x768
100%
HD Graphics 510:
48.7  fps
52%
Radeon R2 (Stoney Ridge):
25.5  fps
97%
Radeon R7 (Bristol Ridge):
47.1  fps
med. 1366x768
100%
HD Graphics 510:
29.2  fps
70%
Radeon R2 (Stoney Ridge):
20.3  fps
121%
Radeon R7 (Bristol Ridge):
35.4  fps
high 1920x1080
Radeon R7 (Bristol Ridge):
20.9  fps
low 1024x768
100%
HD Graphics 510:
38.9  fps
61%
Radeon R2 (Stoney Ridge):
23.6  fps
117%
Radeon R7 (Bristol Ridge):
45.5  fps
med. 1366x768
100%
HD Graphics 510:
25.2  fps
73%
Radeon R2 (Stoney Ridge):
18.5  fps
144%
Radeon R7 (Bristol Ridge):
36.4  fps
high 1920x1080
Radeon R7 (Bristol Ridge):
14.3  fps
low 1280x720
100%
HD Graphics 510:
66.2  fps
43%
Radeon R2 (Stoney Ridge):
28.7  fps
72%
Radeon R7 (Bristol Ridge):
47.9  fps
med. 1366x768
100%
HD Graphics 510:
41.8  fps
44%
Radeon R2 (Stoney Ridge):
18.4  fps
high 1920x1080
Radeon R7 (Bristol Ridge):
16  fps
ultra 1920x1080
Radeon R7 (Bristol Ridge):
13.9  fps
low 1280x720
Radeon R7 (Bristol Ridge):
9 12 ~ 11 fps
med. 1366x768
Radeon R7 (Bristol Ridge):
3 11 ~ 7 fps
low 1024x768
Radeon R7 (Bristol Ridge):
11.9 14 ~ 13 fps
med. 1366x768
Radeon R7 (Bristol Ridge):
7.6 9.2 ~ 8 fps
low 1024x768
100%
HD Graphics 510:
110.4  fps
23%
Radeon R2 (Stoney Ridge):
25.1  fps
72%
Radeon R7 (Bristol Ridge):
79  fps
med. 1366x768
100%
HD Graphics 510:
19.3  fps
67%
Radeon R2 (Stoney Ridge):
13  fps
141%
Radeon R7 (Bristol Ridge):
27.3  fps
high 1920x1080
Radeon R7 (Bristol Ridge):
15.2  fps
GTA V

GTA V

2015
low 1024x768
100%
HD Graphics 510:
30.9  fps
134%
Radeon R7 (Bristol Ridge):
41.5  fps
med. 1366x768
100%
HD Graphics 510:
26.8  fps
142%
Radeon R7 (Bristol Ridge):
38.1  fps
high 1920x1080
Radeon R7 (Bristol Ridge):
10  fps
low 1024x768
100%
HD Graphics 510:
31.5  fps
21%
Radeon R2 (Stoney Ridge):
6.7  fps
120%
Radeon R7 (Bristol Ridge):
37.7  fps
med. 1366x768
100%
HD Graphics 510:
22.2  fps
22%
Radeon R2 (Stoney Ridge):
4.9  fps
145%
Radeon R7 (Bristol Ridge):
32.1  fps
high 1920x1080
Radeon R7 (Bristol Ridge):
12.9  fps
low 1024x768
Radeon R2 (Stoney Ridge):
11.2  fps
Radeon R7 (Bristol Ridge):
29.9  fps
med. 1366x768
Radeon R2 (Stoney Ridge):
8.7  fps
Radeon R7 (Bristol Ridge):
27.3  fps
high 1920x1080
Radeon R7 (Bristol Ridge):
16.7  fps
low 1024x768
Radeon R7 (Bristol Ridge):
16  fps
F1 2014

F1 2014

2014
low 1024x768
100%
HD Graphics 510:
72  fps
39%
Radeon R2 (Stoney Ridge):
28  fps
86%
Radeon R7 (Bristol Ridge):
62  fps
med. 1366x768
100%
HD Graphics 510:
47  fps
38%
Radeon R2 (Stoney Ridge):
18  fps
87%
Radeon R7 (Bristol Ridge):
41  fps
high 1920x1080
Radeon R7 (Bristol Ridge):
31  fps
low 1024x768
Radeon R2 (Stoney Ridge):
17.8  fps
Radeon R7 (Bristol Ridge):
32  fps
med. 1366x768
Radeon R2 (Stoney Ridge):
10.3  fps
Radeon R7 (Bristol Ridge):
20  fps
low 1280x720
Radeon R7 (Bristol Ridge):
21.7  fps
med. 1344x756
Radeon R7 (Bristol Ridge):
14.7  fps
Sims 4

Sims 4

2014
low 1024x768
100%
HD Graphics 510:
173.7  fps
47%
Radeon R2 (Stoney Ridge):
82.1  fps
70%
Radeon R7 (Bristol Ridge):
122.3  fps
med. 1366x768
100%
HD Graphics 510:
32.2  fps
64%
Radeon R2 (Stoney Ridge):
20.7  fps
139%
Radeon R7 (Bristol Ridge):
44.8  fps
high 1920x1080
Radeon R7 (Bristol Ridge):
23.2  fps
low 1024x768
Radeon R2 (Stoney Ridge):
14.1  fps
med. 1366x768
Radeon R2 (Stoney Ridge):
8.7  fps
low 1024x768
100%
HD Graphics 510:
135.5  fps
34%
Radeon R2 (Stoney Ridge):
46  fps
67%
Radeon R7 (Bristol Ridge):
91.3  fps
med. 1366x768
100%
HD Graphics 510:
32.8  fps
52%
Radeon R2 (Stoney Ridge):
16.9  fps
124%
Radeon R7 (Bristol Ridge):
40.6  fps
high 1920x1080
Radeon R7 (Bristol Ridge):
21.6  fps
Thief

Thief

2014
low 1024x768
Radeon R7 (Bristol Ridge):
13 15.3 ~ 14 fps
med. 1366x768
Radeon R7 (Bristol Ridge):
10 12.6 ~ 11 fps
high 1366x768
Radeon R7 (Bristol Ridge):
8 12.3 ~ 10 fps
low 1024x768
100%
HD Graphics 510:
33.4  fps
102%
Radeon R7 (Bristol Ridge):
28.7 29 32.5 44.1 ~ 34 fps
med. 1366x768
100%
HD Graphics 510:
22.5  fps
102%
Radeon R7 (Bristol Ridge):
20.1 20.7 22.8 29.6 ~ 23 fps
high 1366x768
100%
HD Graphics 510:
15.9  fps
94%
Radeon R7 (Bristol Ridge):
12.6 13.7 15.2 20.4 ~ 15 fps
ultra 1920x1080
Radeon R7 (Bristol Ridge):
5.1 5.6 7.7 ~ 6 fps
low 1024x768
Radeon R7 (Bristol Ridge):
48  fps
med. 1366x768
Radeon R7 (Bristol Ridge):
29  fps
high 1366x768
Radeon R7 (Bristol Ridge):
15  fps
low 1024x768
Radeon R7 (Bristol Ridge):
11  fps
med. 1366x768
Radeon R7 (Bristol Ridge):
11  fps
high 1366x768
Radeon R7 (Bristol Ridge):
6  fps
GRID 2

GRID 2

2013
low 1024x768
Radeon R2 (Stoney Ridge):
39.5  fps
med. 1366x768
Radeon R2 (Stoney Ridge):
20.7  fps
high 1366x768
Radeon R2 (Stoney Ridge):
12.6  fps
low 1024x768
Radeon R7 (Bristol Ridge):
16  fps
med. 1366x768
Radeon R7 (Bristol Ridge):
12  fps
low 1280x720
100%
HD Graphics 510:
39  fps
87%
Radeon R2 (Stoney Ridge):
32.1 36.8 ~ 34 fps
131%
Radeon R7 (Bristol Ridge):
43 45.4 46.2 46.8 60.9 62 ~ 51 fps
med. 1366x768
100%
HD Graphics 510:
20.1  fps
85%
Radeon R2 (Stoney Ridge):
16.4 18.1 ~ 17 fps
149%
Radeon R7 (Bristol Ridge):
26 26.9 27.9 27.9 35.8 37.8 ~ 30 fps
high 1366x768
100%
HD Graphics 510:
17.7  fps
79%
Radeon R2 (Stoney Ridge):
13.8 14.2 ~ 14 fps
147%
Radeon R7 (Bristol Ridge):
22.5 22.7 23 30.3 32.6 ~ 26 fps
ultra 1920x1080
Radeon R7 (Bristol Ridge):
7.8 7.8 10.7 10.9 ~ 9 fps
low 1024x768
100%
HD Graphics 510:
52.7  fps
68%
Radeon R2 (Stoney Ridge):
35.7  fps
123%
Radeon R7 (Bristol Ridge):
54.9 74.1 ~ 65 fps
med. 1366x768
100%
HD Graphics 510:
23.9  fps
66%
Radeon R2 (Stoney Ridge):
15.7  fps
138%
Radeon R7 (Bristol Ridge):
29.8 36.9 ~ 33 fps
high 1366x768
100%
HD Graphics 510:
16.2  fps
69%
Radeon R2 (Stoney Ridge):
11.1  fps
154%
Radeon R7 (Bristol Ridge):
20.9 28.1 ~ 25 fps
ultra 1920x1080
Radeon R7 (Bristol Ridge):
10.7 12.7 ~ 12 fps
low 1024x768
Radeon R2 (Stoney Ridge):
43.5  fps
med. 1366x768
Radeon R2 (Stoney Ridge):
20.8  fps
high 1366x768
Radeon R2 (Stoney Ridge):
16.5  fps
low 1024x768
Radeon R2 (Stoney Ridge):
26.9  fps
med. 1366x768
Radeon R2 (Stoney Ridge):
21.7  fps
high 1366x768
Radeon R2 (Stoney Ridge):
20  fps
low 1024x768
Radeon R2 (Stoney Ridge):
28.5  fps
Radeon R7 (Bristol Ridge):
70  fps
med. 1366x768
Radeon R2 (Stoney Ridge):
17.8  fps
Radeon R7 (Bristol Ridge):
54.6  fps
high 1366x768
Radeon R2 (Stoney Ridge):
15.9  fps
Radeon R7 (Bristol Ridge):
45.5  fps
ultra 1920x1080
Radeon R7 (Bristol Ridge):
41.3  fps
Anno 2070

Anno 2070

2011
low 1024x768
Radeon R2 (Stoney Ridge):
48.8  fps
med. 1366x768
Radeon R2 (Stoney Ridge):
22.3  fps
high 1366x768
Radeon R2 (Stoney Ridge):
13.9  fps
low 1280x720
Radeon R2 (Stoney Ridge):
24.7  fps
Radeon R7 (Bristol Ridge):
28  fps
med. 1366x768
Radeon R2 (Stoney Ridge):
16.3  fps
Radeon R7 (Bristol Ridge):
19  fps
high 1366x768
Radeon R2 (Stoney Ridge):
10.8  fps
Radeon R7 (Bristol Ridge):
13  fps
low 1024x768
Radeon R7 (Bristol Ridge):
36  fps
med. 1366x768
Radeon R7 (Bristol Ridge):
29  fps
high 1366x768
Radeon R7 (Bristol Ridge):
15  fps
low 1024x768
Radeon R2 (Stoney Ridge):
41  fps
high 1366x768
Radeon R2 (Stoney Ridge):
20.3  fps
Dirt 3

Dirt 3

2011
low 800x600
Radeon R2 (Stoney Ridge):
55.7  fps
med. 1024x768
Radeon R2 (Stoney Ridge):
28.1  fps
high 1360x768
Radeon R2 (Stoney Ridge):
22.1  fps
low 1024x768
Radeon R2 (Stoney Ridge):
59.6  fps
med. 1360x768
Radeon R2 (Stoney Ridge):
17.8  fps
high 1360x768
Radeon R2 (Stoney Ridge):
14.1  fps
World of Warcraft

World of Warcraft

2005
low 800x600
Radeon R2 (Stoney Ridge):
65.2  fps
med. 1024x768
Radeon R2 (Stoney Ridge):
33.2  fps

Average Gaming Intel HD Graphics 510 → 100%

Average Gaming 30-70 fps → 100%

Average Gaming AMD Radeon R2 (Stoney Ridge) → 60%

Average Gaming 30-70 fps → 63%

Average Gaming AMD Radeon R7 (Bristol Ridge) → 129%

Average Gaming 30-70 fps → 129%

Intel HD Graphics 510AMD Radeon R2 (Stoney Ridge)AMD Radeon R7 (Bristol Ridge)
lowmed.highultraQHD4Klowmed.highultraQHD4Klowmed.highultraQHD4K
Ark Survival Evolved13.1
Playerunknown's Battlegrounds (PUBG)13.8
Team Fortress 219.718.546.234
Dirt 440.9
Rocket League30.85733.218.1
Ghost Recon Wildlands11.95.3
For Honor20.67.1
Resident Evil 718.33412.2
Dishonored 2118.8
Titanfall 219.915.43430.310.5
Farming Simulator 1770.641.343.526.463.247.522
Battlefield 123.316.78.3
Civilization 624.59.421.68.530.514.67.6
Deus Ex Mankind Divided1396.4
Mirror's Edge Catalyst16.911.7
Ashes of the Singularity8
The Division13.47.717.410.6
Far Cry Primal1598
XCOM 218.46.94.9
Rise of the Tomb Raider11.1721137
Rainbow Six Siege2515.920.413.847.120.814.7
Just Cause 31613.2
Star Wars Battlefront22.921.210.5
Anno 220519.91126.114.46.7
World of Warships48.729.225.520.347.135.420.9
Metal Gear Solid V38.925.223.618.545.536.414.3
Dota 2 Reborn66.241.828.718.447.91613.9
Batman: Arkham Knight117
The Witcher 3138
Dirt Rally110.419.325.1137927.315.2
GTA V30.926.841.538.110
Battlefield Hardline31.522.26.74.937.732.112.9
Dragon Age: Inquisition11.28.729.927.316.7
Call of Duty: Advanced Warfare16
F1 201472472818624131
Alien: Isolation17.810.33220
Middle-earth: Shadow of Mordor21.714.7
Sims 4173.732.282.120.7122.344.823.2
GRID: Autosport135.532.84616.991.340.621.6
Thief141110
Battlefield 433.422.515.93423156
Batman: Arkham Origins482915
Company of Heroes 211116
Metro: Last Light1612
BioShock Infinite3920.117.73417145130269
Tomb Raider52.723.916.235.715.711.165332512
Diablo III28.517.815.97054.645.541.3
The Elder Scrolls V: Skyrim24.716.310.8281913
Batman: Arkham City362915
Intel HD Graphics 510AMD Radeon R2 (Stoney Ridge)AMD Radeon R7 (Bristol Ridge)
lowmed.highultraQHD4Klowmed.highultraQHD4Klowmed.highultraQHD4K
< 30 fps
< 60 fps
< 120 fps
≥ 120 fps
7
7
4
2
14
5

3


< 30 fps
< 60 fps
< 120 fps
≥ 120 fps
13
5
1
18


4


< 30 fps
< 60 fps
< 120 fps
≥ 120 fps
25
17
6
1
29
13

29
3

4
1


For more games that might be playable and a list of all games and graphics cards visit our Gaming List

v1.33
log 18. 21:34:35

#0 ran 0s before starting gpusingle class +0s ... 0s

#1 checking url part for id 6475 +0s ... 0s

#2 checking url part for id 7446 +0s ... 0s

#3 checking url part for id 7442 +0s ... 0s

#4 redirected to Ajax server, took 1752867275s time from redirect:0 +0s ... 0s

#5 did not recreate cache, as it is less than 5 days old! Created at Thu, 17 Jul 2025 15:21:38 +0200 +0s ... 0s

#6 composed specs +0.019s ... 0.019s

#7 did output specs +0s ... 0.019s

#8 start showIntegratedCPUs +0s ... 0.019s

#9 getting avg benchmarks for device 6475 +0.021s ... 0.04s

#10 got single benchmarks 6475 +0.006s ... 0.046s

#11 getting avg benchmarks for device 7446 +0.003s ... 0.049s

#12 got single benchmarks 7446 +0.006s ... 0.054s

#13 getting avg benchmarks for device 7442 +0.003s ... 0.058s

#14 got single benchmarks 7442 +0.007s ... 0.065s

#15 got avg benchmarks for devices +0s ... 0.065s

#16 min, max, avg, median took s +0.034s ... 0.099s

#17 before gaming benchmark output +0s ... 0.099s

#18 Got 291 rows for game benchmarks. +0.008s ... 0.107s

#19 composed SQL query for gamebenchmarks +0s ... 0.107s

#20 got data and put it in $dataArray +0.002s ... 0.109s

#21 benchmarks composed for output. +0.019s ... 0.128s

#22 calculated avg scores. +0s ... 0.128s

#23 return log +0.001s ... 0.129s

Please share our article, every link counts!
Mail Logo
> Expert Reviews and News on Laptops, Smartphones and Tech Innovations > Benchmarks / Tech > Graphics Card Comparison - Head 2 Head
Redaktion, 2017-09- 8 (Update: 2023-07- 1)