AMD Radeon R7 (Bristol Ridge) vs Intel HD Graphics (Broadwell)
AMD Radeon R7 (Bristol Ridge) ► remove from comparison
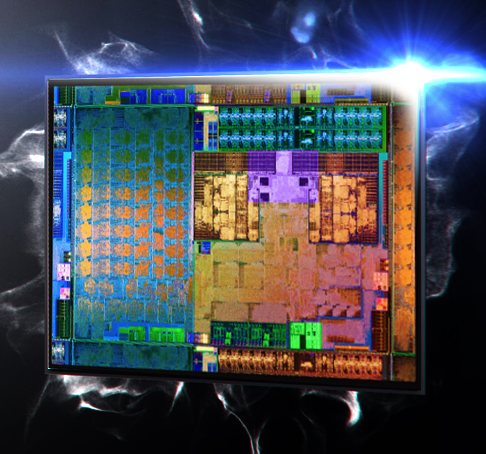
The AMD Radeon R7 (Bristol Ridge) is an integrated graphics card for the fastest mobile AMD Carrizo APUs. At its launch, the R7 is available on the top model FX9830P with 512 GCN shader units and a core clock of 900 MHz. The technical specifications do not differ from the AMD Radeon R7 in Carrizo, but the clock is up to 100 MHz higher. Depending on the cooling and the configurable TDP (12-45 Watts), the performance can differ quite a lot. The performance also depends on the memory (best performance with dual-channel DDR4).
Architecture and Features
According to AMD, the Radeon R7 consists of eight cores based on the third GCN generation (often called GCN 1.2 or 2.0 in the press). It is therefore very similar to the Tonga desktop chip and supports DirectX 12 (FL 12_0). Furthermore, its shaders can be used with Mantle, OpenGL and OpenCL. HSA 1.0 is supported for running code on both CPU and GPU cores simultaneously.
Compared to the Kaveri generation (Kaveri R7 with GCN 1.1), the new color compression in particular results in better memory utilization and improves the gaming performance by 5-7 %.
The improved video decoder of Carrizo/Bristol Ridge now includes UVD 6 (Unified Video Decoder), which can decode HVEC / H.265 up to 4K in hardware. Furthermore, the VCE (Video Codec Engine) has been improved for faster transcoding of H.264. More information on architecture and features of the Bristol Ridge architecture can be found in our launch article.
Performance
Depending on the configurable TDP of the Bristol Ridge chips between 12 up to 45 Watts, there can be significant differences in games. Overall, the results are slightly better compared to the Carrizo Radeon R7 due to the higher clocks for comparable model. You can still use the Kaveri R7 benchmarks to check the gaming performance.
Power Consumption
Depending on the configurable TDP (cTDP), the 28 nm chip is specified at 12-45 Watts. It can therefore be used for thin and light notebooks as well as medium-sized devices or All-in-Ones (AiO).
Intel HD Graphics (Broadwell) ► remove from comparison
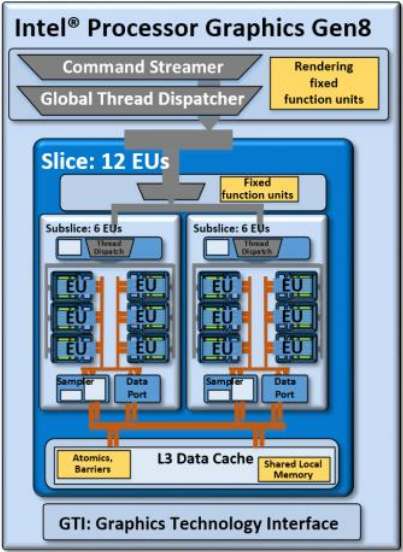
The Intel HD Graphics (Broadwell) (GT1) is an integrated Broadwell graphics card revealed in Q1 2015. It can be found in several low-end CPUs such as the Pentium 3805U or Celeron 3755U . The so-called GT1 GPU offers 12 EUs (Execution Units) and therefore somewhat more shader power than the previous HD Graphics (Haswell) . The clock range may depend on the specific model it is built into.
Architecture and Features
Broadwell features a GPU based on the Intel Gen8 architecture, which has been optimized in various aspects compared to the previous Gen7.5 (Haswell). In case of the GT1 version, the shader arrays called "subslice" have been reorganized and now offer 6 Execution Units (EUs) each. Two subslices form a "slice" for a total of 12 EUs. Combined with other improvements such as larger L1 caches and an optimized frontend, the integrated GPU has become faster and more efficient than its predecessor.
The HD Graphics (Broadwell) represents the low-end version of the Broadwell GPU family and consists of one slice with 12 EUs. Beyond that, there is also a mid-range variant (GT2, 24 EUs) as well as higher-end models (GT3/GT3e + eDRAM, 48 EUs).
All Broadwell GPUs support OpenCL 2.0 and DirectX 12 (FL 11_1). The video engine can now decode H.265 using both fixed function hardware as well as available GPU shaders. Up to three displays can be connected via DP 1.2/eDP 1.3 (max. 3840 x 2160 @ 60 Hz) or HDMI 1.4a (max. 3840 x 2160 @ 24 Hz). HDMI 2.0, however, is not supported.
Performance
Even though the HD Graphics (Broadwell) is clocked a bit lower, the performance should be clearly above the HD Graphics (Haswell) and similar to the HD Graphics 4000 . Nevertheless, only a few games as of 2014/2015 will run fluently at (very) low settings, e.g. Dota 2 or Sims 4.
Power Consumption
Utilizing a new 14 nm process, the HD Graphics (Broadwell) can be found in ULV models (15 W) as well as regular dual core CPUs (37 W, not yet presented). The TDP is flexible and can be further reduced, which has a significant impact on performance.
AMD Radeon R7 (Bristol Ridge) Intel HD Graphics (Broadwell) HD Graphics Series Codename Bristol Ridge Broadwell GT1 Architecture GCN 1.2 Gen. 8 Broadwell Pipelines 512 - unified 12 - unified Core Speed 900 (Boost) MHz 100 - 850 (Boost) MHz Memory Bus Width 64/128 Bit 64/128 Bit Shared Memory yes yes API DirectX 12 (FL 12_0), OpenGL 4.4 DirectX 12 (FL 11_1), OpenGL 4.3 Power Consumption 12-45 Watt Transistors 2.4 Billion technology 28 nm 14 nm Features UVD 6, VCE QuickSync Notebook Size medium sized Date of Announcement 01.06.2016 05.01.2015
CPU in Radeon R7 (Bristol Ridge) GPU Base Speed GPU Boost / Turbo AMD FX-9830P 4 x 3000 MHz, 25-45 W ? MHz 900 MHz AMD PRO A12-9830B 4 x 3000 MHz, 25-45 W ? MHz 900 MHz AMD FX-9800P 4 x 2700 MHz, 15 W ? MHz 758 MHz » show 3 more AMD PRO A12-9800B 4 x 2700 MHz, 15 W ? MHz 758 MHz AMD A12-9720P 4 x 2700 MHz, 15 W ? MHz 758 MHz AMD A12-9700P 4 x 2500 MHz, 15 W ? MHz 758 MHz min. - max. ? MHz 758 - 900 MHz
CPU in HD Graphics (Broadwell) GPU Base Speed GPU Boost / Turbo Intel Pentium 3825U 2 x 1900 MHz, 15 W 100 MHz 850 MHz Intel Celeron 3765U 2 x 1900 MHz, 15 W 300 MHz 850 MHz Intel Pentium 3805U 2 x 1900 MHz, 15 W 100 MHz 800 MHz » show 3 more Intel Celeron 3755U 2 x 1700 MHz, 15 W 100 MHz 800 MHz Intel Celeron 3215U 2 x 1700 MHz, 15 W 300 MHz 850 MHz Intel Celeron 3205U 2 x 1500 MHz, 15 W 100 MHz 800 MHz min. - max. 100 - ? MHz 758 - 900 MHz
Benchmarks Performance Rating - 3DMark 11 + Fire Strike + Time Spy - Radeon R7 (Bristol Ridge)
0.5 pt (1%)
...
AMD Radeon R7 (Bristol Ridge)
...
max:
Performance Rating - 3DMark 11 + Fire Strike + Time Spy - HD Graphics (Broadwell)
0.2 pt (1%)
...
Intel HD Graphics (Broadwell)
...
max:
3DMark - 3DMark Time Spy Score
min: 338 avg: 364.7 median: 358 (1%) max: 398 Points
3DMark - 3DMark Time Spy Graphics
min: 325 avg: 343.7 median: 347 (1%) max: 359 Points
3DMark - 3DMark Ice Storm Unlimited Graphics
min: 34845 avg: 49654 median: 52245.5 (6%) max: 59281 Points
3DMark - 3DMark Ice Storm Extreme Graphics
min: 32062 avg: 34971 median: 32389 (4%) max: 40461 Points
3DMark - 3DMark Cloud Gate Score
min: 3162 avg: 4026 median: 3942 (4%) max: 5173 Points
3398 Points (4%)
3DMark - 3DMark Cloud Gate Graphics
min: 3477 avg: 5531 median: 5311 (1%) max: 8107 Points
4015 Points (1%)
3DMark - 3DMark Fire Strike Standard Score
min: 667 avg: 938 median: 866 (2%) max: 1230 Points
428 Points (1%)
3DMark - 3DMark Fire Strike Standard Graphics
min: 750 avg: 1081 median: 1013 (1%) max: 1466 Points
463 Points (1%)
3DMark - 3DMark Ice Storm Graphics
min: 44545 avg: 48082 median: 46007 (6%) max: 53693 Points
45539 Points (5%)
3DMark 11 - 3DM11 Performance Score
min: 1737 avg: 1859 median: 1794 (2%) max: 2130 Points
729 Points (1%)
3DMark 11 - 3DM11 Performance GPU
min: 1820 avg: 1913 median: 1852 (2%) max: 2210 Points
641 Points (1%)
3DMark Vantage + AMD Radeon R7 (Bristol Ridge) 3DMark Vantage - 3DM Vant. Perf. total
5568 Points (2%)
3DM Vant. Perf. total + Intel HD Graphics (Broadwell)
2651 Points (1%)
3DM Vant. Perf. GPU no PhysX + AMD Radeon R7 (Bristol Ridge) 3DMark Vantage - 3DM Vant. Perf. GPU no PhysX
5111 Points (3%)
3DM Vant. Perf. GPU no PhysX + Intel HD Graphics (Broadwell)
2196 Points (1%)
3DMark 06 3DMark 06 - Standard 1280x1024 + AMD Radeon R7 (Bristol Ridge)
min: 5635 avg: 6645 median: 6644.5 (9%) max: 7654 Points
3DMark 06 - Standard 1280x1024 + Intel HD Graphics (Broadwell)
5077 Points (7%)
Unigine Valley 1.0 - Unigine Valley 1.0 DX
3.5 fps (1%)
Unigine Heaven 3.0 - Unigine Heaven 3.0 DX 11
13.9 fps (5%)
Unigine Heaven 2.1 - Heaven 2.1 high
19.5 fps (4%)
10.9 fps (2%)
Cinebench R10 Cinebench R10 Shading (32bit) + AMD Radeon R7 (Bristol Ridge) Cinebench R10 - Cinebench R10 Shading (32bit)
min: 4680 avg: 4943 median: 4845 (3%) max: 5403 Points
Cinebench R10 Shading (32bit) + Intel HD Graphics (Broadwell)
4886 Points (3%)
Cinebench R11.5 Cinebench R11.5 OpenGL 64 Bit + AMD Radeon R7 (Bristol Ridge) Cinebench R11.5 - Cinebench R11.5 OpenGL 64 Bit
min: 18.06 avg: 20.1 median: 18.3 (6%) max: 25.65 fps
Cinebench R11.5 OpenGL 64 Bit + Intel HD Graphics (Broadwell)
12.8 fps (4%)
Cinebench R15 + AMD Radeon R7 (Bristol Ridge) Cinebench R15 - Cinebench R15 OpenGL 64 Bit
min: 22.88 avg: 25.1 median: 23.2 (1%) max: 31.43 fps
Cinebench R15 OpenGL 64 Bit + Intel HD Graphics (Broadwell)
17.8 fps (1%)
Cinebench R15 OpenGL Ref. Match 64 Bit + AMD Radeon R7 (Bristol Ridge) Cinebench R15 - Cinebench R15 OpenGL Ref. Match 64 Bit
98 % (98%)
Cinebench R15 OpenGL Ref. Match 64 Bit + Intel HD Graphics (Broadwell)
98 % (98%)
GFXBench - GFXBench Car Chase Offscreen
23.8 fps (3%)
GFXBench 3.1 - GFXBench Manhattan ES 3.1 Offscreen
24.3 fps (1%)
17.4 fps (0%)
GFXBench 3.0 - GFXBench 3.0 Manhattan Offscreen
25.9 fps (2%)
21.5 fps (1%)
GFXBench (DX / GLBenchmark) 2.7 + AMD Radeon R7 (Bristol Ridge) GFXBench (DX / GLBenchmark) 2.7 - GFXBench T-Rex HD Offscreen C24Z16
90 fps (1%)
GFXBench T-Rex HD Offscreen C24Z16 + Intel HD Graphics (Broadwell) 47.1 fps (0%)
LuxMark v2.0 64Bit - LuxMark v2.0 Room GPU
min: 175 avg: 178.5 median: 178.5 (1%) max: 182 Samples/s
86 Samples/s (0%)
LuxMark v2.0 64Bit - LuxMark v2.0 Sala GPU
min: 358 avg: 362.5 median: 362.5 (1%) max: 367 Samples/s
182 Samples/s (0%)
ComputeMark v2.1 - ComputeMark v2.1 Result
min: 1093 avg: 1346 median: 1450 (2%) max: 1495 Points
374 Points (0%)
Power Consumption - The Witcher 3 Power Consumption - external Monitor *
29.1 Watt (4%)
Clock Speed - GPU Clock Witcher 3 ultra
472 MHz (19%)
Average Benchmarks AMD Radeon R7 (Bristol Ridge) → 100% n=21 Average Benchmarks Intel HD Graphics (Broadwell) → 63% n=21
- Range of benchmark values for this graphics card
- Average benchmark values for this graphics card
* Smaller numbers mean a higher performance
1 This benchmark is not used for the average calculation
Game Benchmarks The following benchmarks stem from our benchmarks of review laptops. The performance depends on the used graphics memory, clock rate, processor, system settings, drivers, and operating systems. So the results don't have to be representative for all laptops with this GPU. For detailed information on the benchmark results, click on the fps number.
100%
Radeon R7 (Bristol Ridge):
13.1 [X] Acer Aspire E15 E5-553G-15FM AMD A12-9700P 2.5GHz
Radeon R7 (Bristol Ridge)
min:
8 fps, max:
16 fps
fps
100%
Radeon R7 (Bristol Ridge):
13.8 [X] Acer Aspire E15 E5-553G-15FM AMD A12-9700P 2.5GHz
Radeon R7 (Bristol Ridge)
min:
10 fps, max:
19 fps
fps
100%
Radeon R7 (Bristol Ridge):
46.2 [X] Acer Aspire E15 E5-553G-15FM AMD A12-9700P 2.5GHz
Radeon R7 (Bristol Ridge)
min:
41 fps
fps
100%
Radeon R7 (Bristol Ridge):
34 [X] Acer Aspire E15 E5-553G-15FM AMD A12-9700P 2.5GHz
Radeon R7 (Bristol Ridge)
min:
30 fps
fps
100%
Radeon R7 (Bristol Ridge):
40.9 [X] Acer Aspire E15 E5-553G-15FM AMD A12-9700P 2.5GHz
Radeon R7 (Bristol Ridge)
min:
37 fps, max:
45 fps
fps
100%
Radeon R7 (Bristol Ridge):
57 [X] Acer Aspire E15 E5-553G-15FM AMD A12-9700P 2.5GHz
Radeon R7 (Bristol Ridge)
min:
16 fps, max:
71 fps
fps
100%
Radeon R7 (Bristol Ridge):
33.2 [X] Acer Aspire E15 E5-553G-15FM AMD A12-9700P 2.5GHz
Radeon R7 (Bristol Ridge)
min:
15 fps, max:
45 fps
fps
100%
Radeon R7 (Bristol Ridge):
18.1 [X] Acer Aspire E15 E5-553G-15FM AMD A12-9700P 2.5GHz
Radeon R7 (Bristol Ridge)
min:
8 fps, max:
25 fps
fps
100%
Radeon R7 (Bristol Ridge):
11.9 fps
100%
Radeon R7 (Bristol Ridge):
5.3 fps
100%
Radeon R7 (Bristol Ridge):
20.6 fps
100%
Radeon R7 (Bristol Ridge):
7.1 fps
100%
Radeon R7 (Bristol Ridge):
31.9 36.7 [X] Acer Aspire E15 E5-553G-15FM AMD A12-9700P 2.5GHz
Radeon R7 (Bristol Ridge)
min:
31 fps, max:
42 fps
~ 34 fps
100%
Radeon R7 (Bristol Ridge):
12.2 fps
100%
Radeon R7 (Bristol Ridge):
11 fps
100%
Radeon R7 (Bristol Ridge):
8.8 fps
100%
Radeon R7 (Bristol Ridge):
34 fps
100%
Radeon R7 (Bristol Ridge):
30.3 fps
100%
Radeon R7 (Bristol Ridge):
10.5 fps
100%
Radeon R7 (Bristol Ridge):
63.2 fps
100%
Radeon R7 (Bristol Ridge):
47.5 fps
100%
Radeon R7 (Bristol Ridge):
22 fps
100%
Radeon R7 (Bristol Ridge):
23.3 fps
100%
Radeon R7 (Bristol Ridge):
16.7 fps
100%
Radeon R7 (Bristol Ridge):
8.3 fps
100%
Radeon R7 (Bristol Ridge):
30.5 fps
100%
Radeon R7 (Bristol Ridge):
14.6 fps
100%
Radeon R7 (Bristol Ridge):
7.6 fps
100%
Radeon R7 (Bristol Ridge):
10 15.5 ~ 13 fps
100%
Radeon R7 (Bristol Ridge):
7 11.6 ~ 9 fps
100%
Radeon R7 (Bristol Ridge):
6.4 fps
100%
Radeon R7 (Bristol Ridge):
16.9 fps
100%
Radeon R7 (Bristol Ridge):
11.7 fps
100%
Radeon R7 (Bristol Ridge):
8 fps
100%
Radeon R7 (Bristol Ridge):
17.4 fps
100%
Radeon R7 (Bristol Ridge):
10.6 fps
100%
Radeon R7 (Bristol Ridge):
15 fps
100%
Radeon R7 (Bristol Ridge):
9 fps
100%
Radeon R7 (Bristol Ridge):
8 fps
100%
Radeon R7 (Bristol Ridge):
18.4 fps
100%
Radeon R7 (Bristol Ridge):
6.9 fps
100%
Radeon R7 (Bristol Ridge):
4.9 fps
100%
Radeon R7 (Bristol Ridge):
6.2 7 7.1 ~ 7 fps
100%
Radeon R7 (Bristol Ridge):
47.1 fps
100%
Radeon R7 (Bristol Ridge):
20.8 fps
100%
Radeon R7 (Bristol Ridge):
14.7 fps
100%
Radeon R7 (Bristol Ridge):
16 fps
100%
Radeon R7 (Bristol Ridge):
13.2 fps
100%
Radeon R7 (Bristol Ridge):
22.9 fps
67%
HD Graphics (Broadwell):
15.3 fps
100%
Radeon R7 (Bristol Ridge):
21.2 fps
40%
HD Graphics (Broadwell):
8.5 fps
100%
Radeon R7 (Bristol Ridge):
10.5 fps
100%
Radeon R7 (Bristol Ridge):
26.1 fps
100%
Radeon R7 (Bristol Ridge):
14.4 fps
100%
Radeon R7 (Bristol Ridge):
6.7 fps
HD Graphics (Broadwell):
38.1 fps
HD Graphics (Broadwell):
20.6 fps
100%
Radeon R7 (Bristol Ridge):
47.1 fps
62%
HD Graphics (Broadwell):
29 fps
100%
Radeon R7 (Bristol Ridge):
35.4 fps
59%
HD Graphics (Broadwell):
20.8 fps
100%
Radeon R7 (Bristol Ridge):
20.9 fps
100%
Radeon R7 (Bristol Ridge):
45.5 fps
100%
Radeon R7 (Bristol Ridge):
36.4 fps
100%
Radeon R7 (Bristol Ridge):
14.3 fps
100%
Radeon R7 (Bristol Ridge):
47.9 [X] Acer Aspire E15 E5-553G-15FM AMD A12-9700P 2.5GHz
Radeon R7 (Bristol Ridge)
min:
38 fps
fps
100%
Radeon R7 (Bristol Ridge):
16 [X] Acer Aspire E15 E5-553G-15FM AMD A12-9700P 2.5GHz
Radeon R7 (Bristol Ridge)
min:
14 fps
fps
100%
Radeon R7 (Bristol Ridge):
13.9 [X] Acer Aspire E15 E5-553G-15FM AMD A12-9700P 2.5GHz
Radeon R7 (Bristol Ridge)
min:
11 fps
fps
100%
Radeon R7 (Bristol Ridge):
9 12 ~ 11 fps
100%
Radeon R7 (Bristol Ridge):
3 11 ~ 7 fps
100%
Radeon R7 (Bristol Ridge):
11.9 14 ~ 13 fps
100%
Radeon R7 (Bristol Ridge):
7.6 9.2 ~ 8 fps
100%
Radeon R7 (Bristol Ridge):
79 fps
63%
HD Graphics (Broadwell):
50 fps
100%
Radeon R7 (Bristol Ridge):
27.3 fps
49%
HD Graphics (Broadwell):
13.5 fps
100%
Radeon R7 (Bristol Ridge):
15.2 fps
100%
Radeon R7 (Bristol Ridge):
41.5 fps
100%
Radeon R7 (Bristol Ridge):
38.1 fps
100%
Radeon R7 (Bristol Ridge):
10 fps
100%
Radeon R7 (Bristol Ridge):
37.7 fps
63%
HD Graphics (Broadwell):
23.9 fps
100%
Radeon R7 (Bristol Ridge):
32.1 fps
51%
HD Graphics (Broadwell):
16.4 fps
100%
Radeon R7 (Bristol Ridge):
12.9 fps
100%
Radeon R7 (Bristol Ridge):
29.9 fps
46%
HD Graphics (Broadwell):
13.9 fps
100%
Radeon R7 (Bristol Ridge):
27.3 fps
34%
HD Graphics (Broadwell):
9.4 fps
100%
Radeon R7 (Bristol Ridge):
16.7 fps
100%
Radeon R7 (Bristol Ridge):
16 fps
100%
Radeon R7 (Bristol Ridge):
62 fps
55%
HD Graphics (Broadwell):
34 fps
100%
Radeon R7 (Bristol Ridge):
41 fps
59%
HD Graphics (Broadwell):
24 fps
100%
Radeon R7 (Bristol Ridge):
31 fps
100%
Radeon R7 (Bristol Ridge):
32 fps
100%
Radeon R7 (Bristol Ridge):
20 fps
100%
Radeon R7 (Bristol Ridge):
21.7 fps
100%
Radeon R7 (Bristol Ridge):
14.7 fps
100%
Radeon R7 (Bristol Ridge):
122.3 fps
93%
HD Graphics (Broadwell):
113.6 fps
100%
Radeon R7 (Bristol Ridge):
44.8 fps
59%
HD Graphics (Broadwell):
26.3 fps
100%
Radeon R7 (Bristol Ridge):
23.2 fps
100%
Radeon R7 (Bristol Ridge):
91.3 fps
63%
HD Graphics (Broadwell):
57.6 fps
100%
Radeon R7 (Bristol Ridge):
40.6 fps
56%
HD Graphics (Broadwell):
22.6 fps
100%
Radeon R7 (Bristol Ridge):
21.6 fps
100%
Radeon R7 (Bristol Ridge):
13 15.3 ~ 14 fps
100%
Radeon R7 (Bristol Ridge):
10 12.6 ~ 11 fps
100%
Radeon R7 (Bristol Ridge):
8 12.3 ~ 10 fps
100%
Radeon R7 (Bristol Ridge):
5.1 5.6 7.7 ~ 6 fps
100%
Radeon R7 (Bristol Ridge):
48 fps
100%
Radeon R7 (Bristol Ridge):
29 fps
100%
Radeon R7 (Bristol Ridge):
15 fps
100%
Radeon R7 (Bristol Ridge):
11 fps
100%
Radeon R7 (Bristol Ridge):
11 fps
100%
Radeon R7 (Bristol Ridge):
6 fps
100%
Radeon R7 (Bristol Ridge):
16 fps
86%
HD Graphics (Broadwell):
13.7 fps
100%
Radeon R7 (Bristol Ridge):
12 fps
89%
HD Graphics (Broadwell):
10.7 fps
HD Graphics (Broadwell):
7 fps
50%
HD Graphics (Broadwell):
25.3 fps
47%
HD Graphics (Broadwell):
14.1 fps
45%
HD Graphics (Broadwell):
11.7 fps
100%
Radeon R7 (Bristol Ridge):
54.9 74.1 ~ 65 fps
53%
HD Graphics (Broadwell):
34.7 fps
100%
Radeon R7 (Bristol Ridge):
29.8 36.9 ~ 33 fps
54%
HD Graphics (Broadwell):
17.7 fps
100%
Radeon R7 (Bristol Ridge):
20.9 28.1 ~ 25 fps
47%
HD Graphics (Broadwell):
11.7 fps
100%
Radeon R7 (Bristol Ridge):
10.7 12.7 ~ 12 fps
HD Graphics (Broadwell):
15.6 fps
HD Graphics (Broadwell):
11.4 fps
HD Graphics (Broadwell):
5.3 fps
HD Graphics (Broadwell):
43.7 fps
HD Graphics (Broadwell):
31.5 fps
HD Graphics (Broadwell):
23.9 fps
100%
Radeon R7 (Bristol Ridge):
70 fps
55%
HD Graphics (Broadwell):
38.4 fps
100%
Radeon R7 (Bristol Ridge):
54.6 fps
46%
HD Graphics (Broadwell):
24.9 fps
100%
Radeon R7 (Bristol Ridge):
45.5 fps
43%
HD Graphics (Broadwell):
19.7 fps
100%
Radeon R7 (Bristol Ridge):
41.3 fps
100%
Radeon R7 (Bristol Ridge):
28 fps
100%
Radeon R7 (Bristol Ridge):
19 fps
100%
Radeon R7 (Bristol Ridge):
13 fps
100%
Radeon R7 (Bristol Ridge):
36 fps
100%
Radeon R7 (Bristol Ridge):
29 fps
100%
Radeon R7 (Bristol Ridge):
15 fps
Average Gaming AMD Radeon R7 (Bristol Ridge) → 100% Average Gaming 30-70 fps → 100%
Average Gaming Intel HD Graphics (Broadwell) → 57% Average Gaming 30-70 fps → 58%
Intel HD Graphics (Broadwell) low med. high ultra QHD 4K Star Wars Battlefront 15.3 8.5 FIFA 16 38.1 20.6 World of Warships 29 20.8 Dirt Rally 50 13.5 Battlefield Hardline 23.9 16.4 Dragon Age: Inquisition 13.9 9.4 F1 2014 34 24 Sims 4 113.6 26.3 GRID: Autosport 57.6 22.6 Metro: Last Light 13.7 10.7 7 BioShock Infinite 25.3 14.1 11.7 Tomb Raider 34.7 17.7 11.7 Hitman: Absolution 15.6 11.4 5.3 Counter-Strike: GO 43.7 31.5 23.9 Diablo III 38.4 24.9 19.7 < 30 fps < 60 fps < 120 fps ≥ 120 fps 7 7 1 13 1 7
For more games that might be playable and a list of all games and graphics cards visit our Gaming List
v1.27
log 16. 16:23:08
#0 checking url part for id 7442 +0s ... 0s
#1 checking url part for id 5979 +0s ... 0s
#2 not redirecting to Ajax server +0s ... 0s
#3 did not recreate cache, as it is less than 5 days old! Created at Sun, 16 Jun 2024 05:38:48 +0200 +0.001s ... 0.001s
#4 composed specs +0.093s ... 0.094s
#5 did output specs +0s ... 0.094s
#6 start showIntegratedCPUs +0s ... 0.094s
#7 getting avg benchmarks for device 7442 +0.042s ... 0.136s
#8 got single benchmarks 7442 +0.018s ... 0.155s
#9 getting avg benchmarks for device 5979 +0.015s ... 0.17s
#10 got single benchmarks 5979 +0.013s ... 0.184s
#11 got avg benchmarks for devices +0s ... 0.184s
#12 min, max, avg, median took s +0.252s ... 0.435s
#13 before gaming benchmark output +0s ... 0.435s
#14 Got 214 rows for game benchmarks. +0.016s ... 0.452s
#15 composed SQL query for gamebenchmarks +0s ... 0.452s
#16 got data and put it in $dataArray +0.036s ... 0.488s
#17 benchmarks composed for output. +0.116s ... 0.604s
#18 calculated avg scores. +0s ... 0.604s
#19 return log +0.043s ... 0.647s
Please share our article, every link counts!
Redaktion, 2017-09- 8 (Update: 2023-07- 1)
 Deutsch
 English
 Español
 Français
 Italiano
 Nederlands
 Polski
 Português
 Русский
 Türkçe
 Svenska
 Chinese
 Magyar