NVIDIA Quadro P2000 vs NVIDIA T600 vs NVIDIA T500 Laptop GPU
NVIDIA Quadro P2000 ► remove from comparison
The Nvidia Quadro P2000 is a mobile mid-range workstation graphics card for notebooks. Similar to the consumer GeForce GTX 1050 Ti (Laptop) , it is based on the GP107 chip with 768 shaders. The graphics card is designed for the Kaby Lake / Coffee Lake generation.
The Quadro GPUs offer certified drivers , which are optimized for stability and performance in professional applications (CAD, DCC, medical, prospection, and visualizing applications). The performance in these areas is therefore much better compared to corresponding consumer GPUs.
Performance
The theoretical performance should be similar with the GeForce GTX 1050 Ti (if the clocks did not take a massive hit).
NVIDIA T600 ► remove from comparison
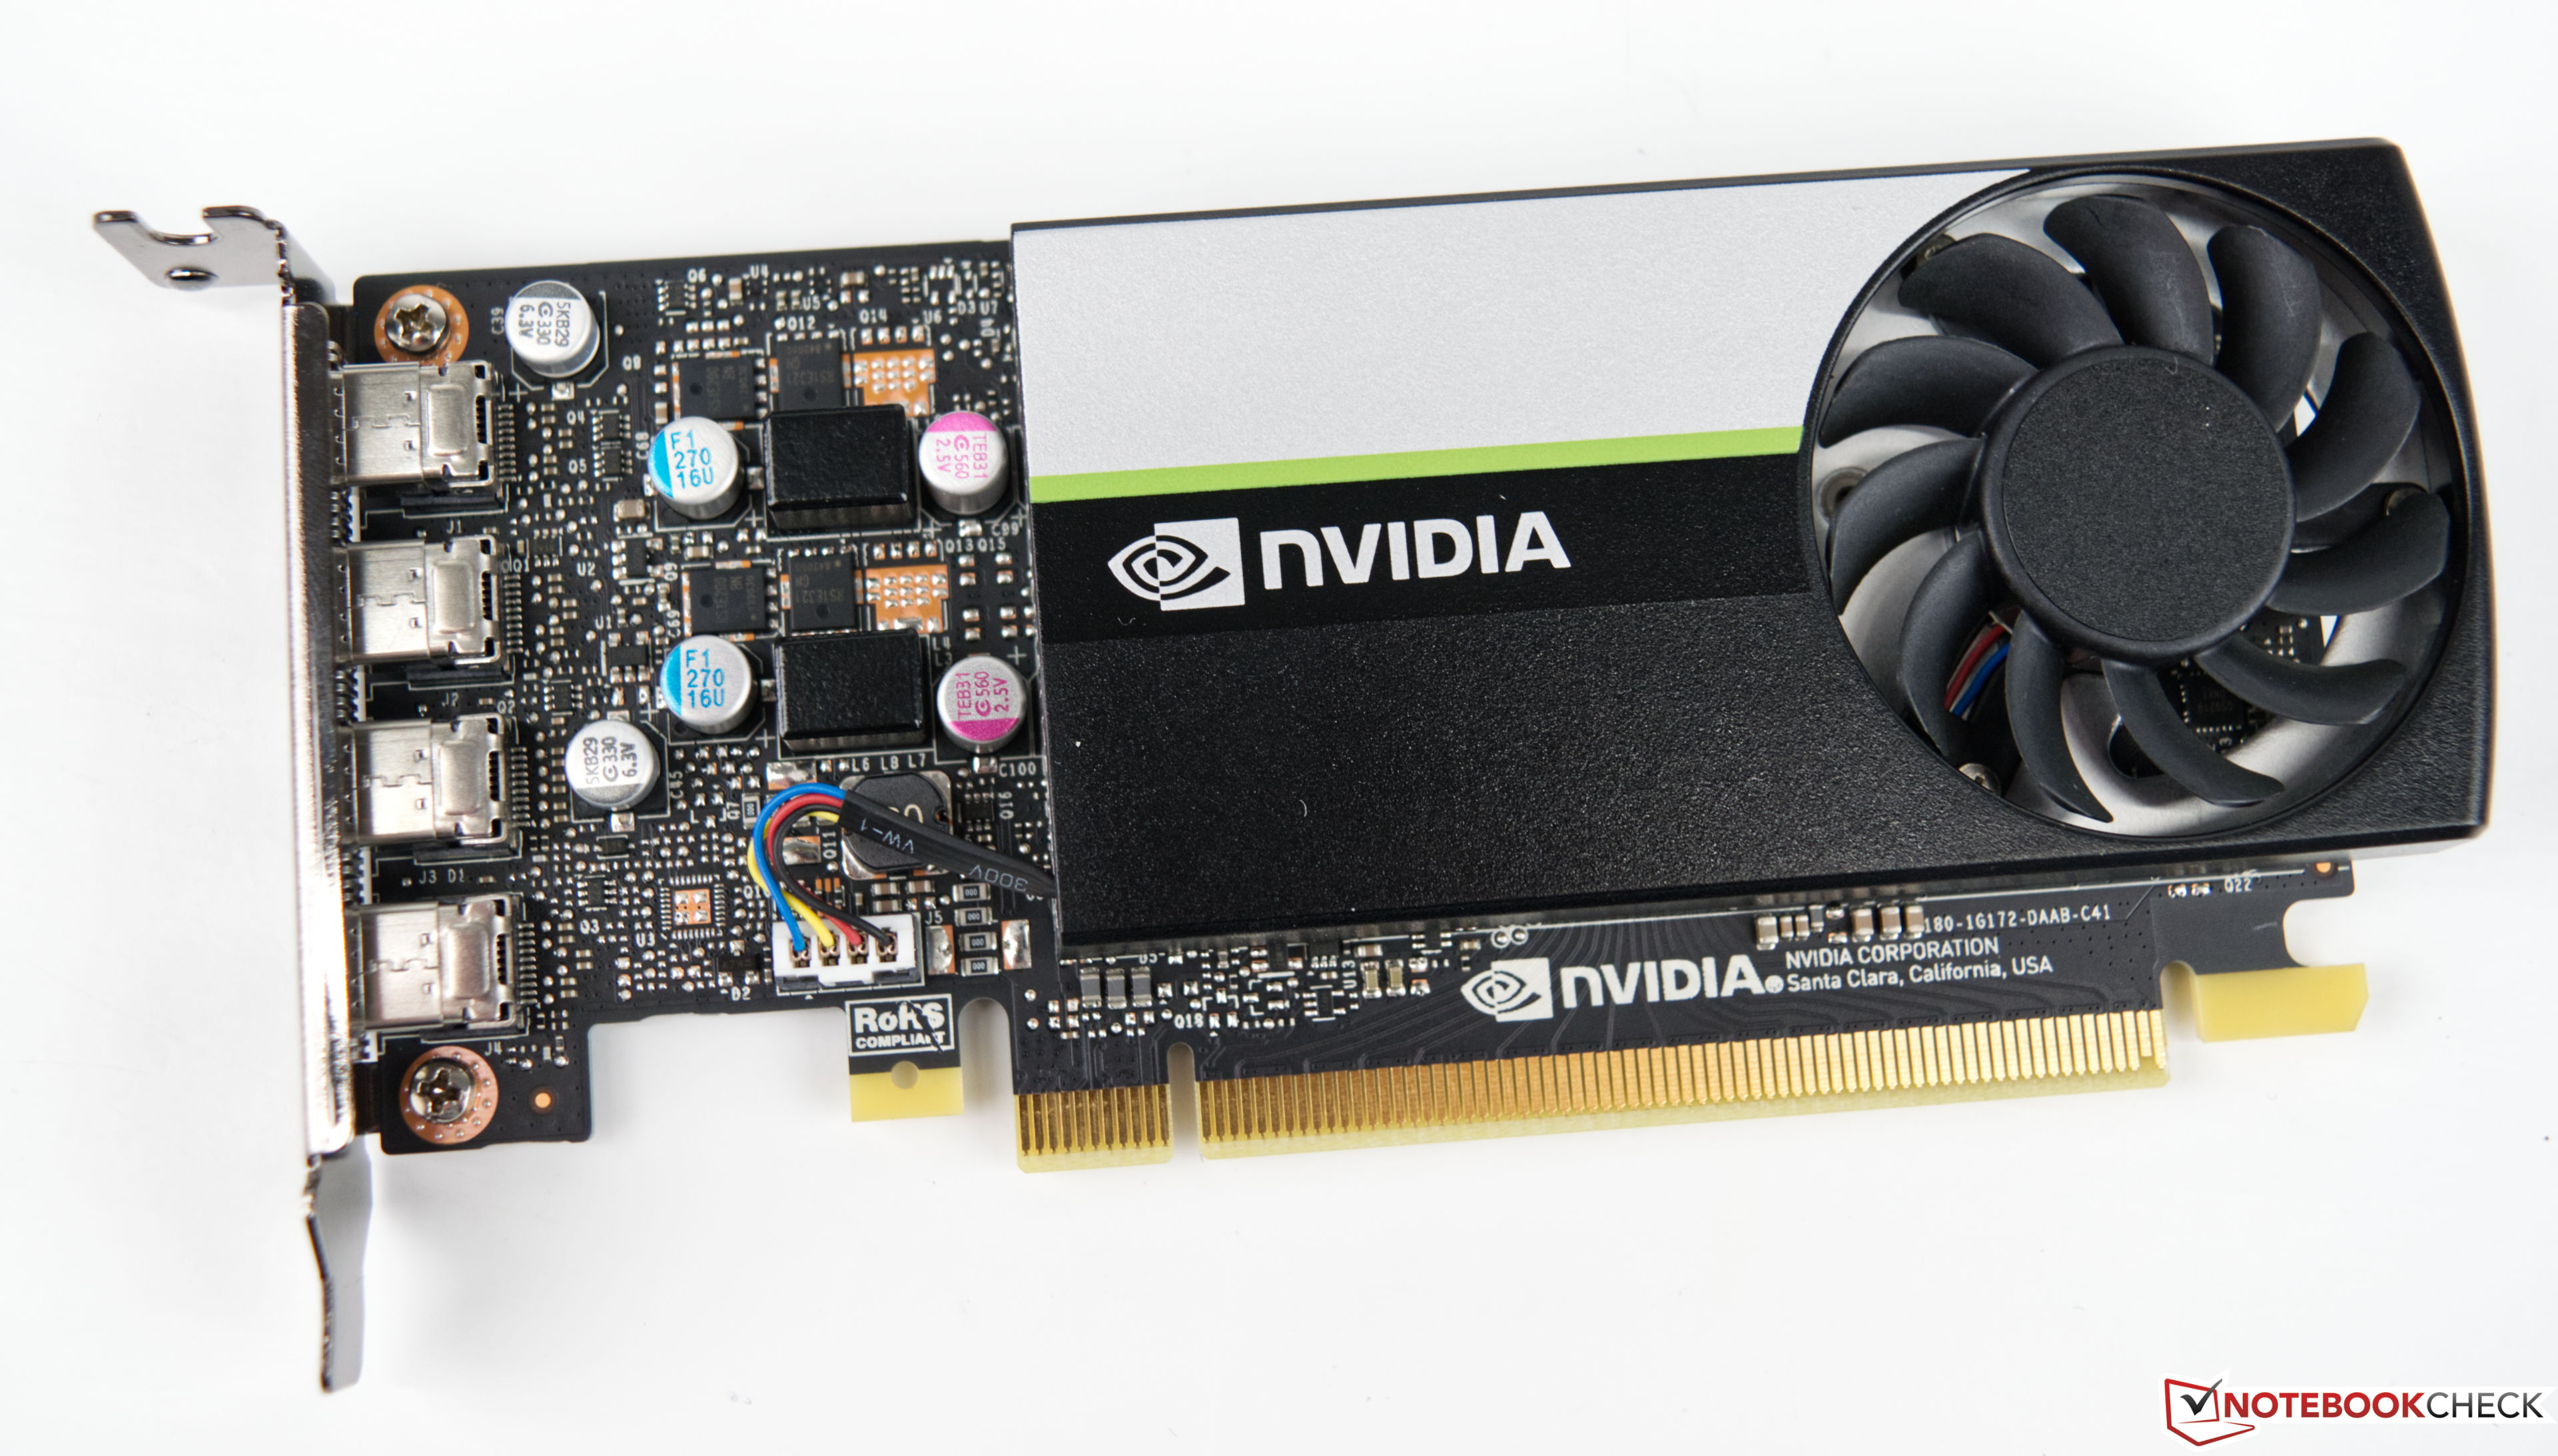
The Nvidia T600 Desktop GPU is a professional graphics card for workstations that is based on the Turing architecture (TU117 chip). The desktop version only offers 640 of the 1024 cores and therefore also less than the T600 mobile (896 CUDA cores). The card offers 4 GB GDDR6 graphics memory connected with a 128 bit bus (up to 160 GB/s bandwidth). The T600 supports certified drivers (former Quadro line) for professional applications like CAD, 3D modelling, DCC, medicine, or visualization applications.
The maximum power consumption of the card is rated at 40W.
NVIDIA T500 Laptop GPU ► remove from comparison
The Nvidia T500 Mobile (formerly known as Quadro T500) for laptops is a professional mobile graphics card that is based on the Turing architecture (TU117 chip). It is based on the consumer GeForce MX450 and features the same 896 cores and a 64 Bit memory bus. Currently it is available with 2 or 4 GB graphics RAM (GDDR5 or GDDR6). The TDP ranges between 18 - 25 Watt depending on the variant. As the MX450, the T500 also supports PCIe 4.0. The chip is manufactured in 12nm FinFET at TSMC.
The Turing generation did not only introduce raytracing for the RTX cards, but also optimized the architecture of the cores and caches. According to Nvidia the CUDA cores offer now a concurrent execution of floating point and integer operations for increased performance in compute-heavy workloads of modern games. Furthermore, the caches were reworked (new unified memory architecture with twice the cache compared to Pascal). This leads to up to 50% more instructions per clock and a 40% more power efficient usage compared to Pascal. In contrary to the faster Quadro RTX cards, the T500 does not feature raytracing and Tensor cores.
NVIDIA Quadro P2000 NVIDIA T600 NVIDIA T500 Laptop GPU Quadro Turing Series Codename GP107GL Architecture Pascal Turing Turing Pipelines 768 - unified 640 - unified 896 - unified Core Speed 1215 - 1468 (Boost) MHz 735 - 1335 (Boost) MHz 1365 - 1695 (Boost) MHz Memory Speed 6008 MHz 10000 effective = 1250 MHz 10000 MHz Memory Bus Width 128 Bit 128 Bit 64 Bit Memory Type GDDR5 GDDR6 GDDR5, GDDR6 Max. Amount of Memory 4 GB 4 GB 4 GB Shared Memory no no no API DirectX 12_1, Shader 5.0, OpenGL 4.5 DirectX 12_1, Shader 6.6, OpenGL 4.6, OpenCL 3.0, Vulkan 1.3 DirectX 12_1, OpenGL 4.6 technology 14 nm 12 nm 12 nm Features Optimus,
PhysX, 3D Vision Pro, nView, Optimus Notebook Size medium sized medium sized Date of Announcement 05.07.2017 12.04.2021 27.05.2019 TMUs 40 ROPs 32 Memory Bandwidth 160 GB/s Power Consumption 40 Watt 25 Watt Transistors 4.7 Billion Die Size 200 mm² PCIe 3.0 x16 Displays 4 Displays (max.), DisplayPort 4x mini-DisplayPort 1.4a
Benchmarks Performance Rating - 3DMark 11 + Fire Strike + Time Spy - Quadro P2000
3.1 pt (9%)
...
...
max:
Performance Rating - 3DMark 11 + Fire Strike + Time Spy - T600
3 pt (9%)
...
...
max:
Performance Rating - 3DMark 11 + Fire Strike + Time Spy - T500 Laptop GPU
1.9 pt (6%)
...
...
max:
3DMark - 3DMark Time Spy Score
2259 Points (7%)
2496 Points (7%)
min: 1627 avg: 1953 median: 1958 (6%) max: 2270 Points
GPU TDP ? TDP 18 W TDP 22 W TDP 25 W 100% 69% 89% 78%
3DMark - 3DMark Time Spy Graphics
2046 Points (5%)
2195 Points (6%)
min: 1554 avg: 1814 median: 1787.5 (5%) max: 2127 Points
GPU TDP ? TDP 18 W TDP 22 W TDP 25 W 100% 73% 91% 77%
3DMark - 3DMark Ice Storm Unlimited Graphics
350317 Points (40%)
304731 Points (35%)
3DMark - 3DMark Ice Storm Extreme Graphics
75457 Points (10%)
152912 Points (20%)
3DMark - 3DMark Cloud Gate Score
min: 23632 avg: 24335 median: 24335 (26%) max: 25038 Points
31922 Points (34%)
min: 15562 avg: 15975 median: 15851 (17%) max: 16513 Points
GPU TDP ? TDP 22 W TDP 25 W 100% 66% 69%
3DMark - 3DMark Cloud Gate Graphics
min: 42598 avg: 43566 median: 43565.5 (11%) max: 44533 Points
40917 Points (11%)
min: 22719 avg: 24657 median: 23453 (6%) max: 27800 Points
GPU TDP ? TDP 22 W TDP 25 W 100% 60% 58%
3DMark - 3DMark Fire Strike Standard Score
min: 6116 avg: 6160 median: 6160 (11%) max: 6204 Points
6284 Points (11%)
min: 3406 avg: 4047 median: 3973.5 (7%) max: 4833 Points
GPU TDP ? TDP 18 W TDP 22 W TDP 25 W 100% 58% 74% 61%
3DMark - 3DMark Fire Strike Standard Graphics
min: 6741 avg: 6847 median: 6847 (8%) max: 6953 Points
6552 Points (7%)
min: 3696 avg: 4322 median: 4224.5 (5%) max: 5141 Points
GPU TDP ? TDP 18 W TDP 22 W TDP 25 W 100% 58% 73% 60%
3DMark - 3DMark Ice Storm Graphics
51884 Points (6%)
182459 Points (22%)
80696 Points (10%)
GPU TDP ? TDP 22 W 100% 69%
3DMark 11 - 3DM11 Performance Score
min: 8660 avg: 8699 median: 8699 (12%) max: 8738 Points
9497 Points (13%)
min: 6293 avg: 7692 median: 8132 (11%) max: 8212 Points
GPU TDP ? TDP 18 W TDP 22 W TDP 25 W 100% 72% 92% 94%
3DMark 11 - 3DM11 Performance GPU
min: 8201 avg: 8387 median: 8387 (7%) max: 8573 Points
8694 Points (7%)
min: 6767 avg: 7808 median: 7995.5 (7%) max: 8475 Points
GPU TDP ? TDP 18 W TDP 22 W TDP 25 W 100% 80% 95% 93%
3DMark Vantage + NVIDIA Quadro P2000 3DMark Vantage - 3DM Vant. Perf. total
32964 Points (10%)
3DM Vant. Perf. total + NVIDIA T600 344838 Points (100%)
3DM Vant. Perf. GPU no PhysX + NVIDIA Quadro P2000 3DMark Vantage - 3DM Vant. Perf. GPU no PhysX
31451 Points (18%)
3DM Vant. Perf. GPU no PhysX + NVIDIA T600
30400 Points (17%)
3DMark 05 - 3DMark 05 - Standard
46380 Points (51%)
3DMark 06 3DMark 06 - Standard 1280x1024 + NVIDIA Quadro P2000
33795 Points (44%)
3DMark 06 - Standard 1280x1024 + NVIDIA T600
43997 Points (57%)
3DMark 06 - Standard 1280x1024 + NVIDIA T500 Laptop GPU
31133 Points (41%)
GPU TDP ? TDP 22 W 100% 80%
Unigine Valley 1.0 - Unigine Valley 1.0 DX
34.6 fps (11%)
32.7 fps (11%)
Unigine Heaven 2.1 - Heaven 2.1 high
86.1 fps (16%)
SPECviewperf 12 + NVIDIA Quadro P2000 SPECviewperf 12 - specvp12 sw-03
min: 103.8 avg: 103.9 median: 103.9 (26%) max: 104 fps
specvp12 sw-03 + NVIDIA T600
115 fps (29%)
specvp12 snx-02 + NVIDIA Quadro P2000 SPECviewperf 12 - specvp12 snx-02
min: 65.8 avg: 66.7 median: 66.7 (10%) max: 67.6 fps
specvp12 snx-02 + NVIDIA T600
68.6 fps (10%)
specvp12 showcase-01 + NVIDIA Quadro P2000 SPECviewperf 12 - specvp12 showcase-01
min: 30.42 avg: 30.6 median: 30.6 (7%) max: 30.73 fps
specvp12 showcase-01 + NVIDIA T600
35.3 fps (8%)
specvp12 mediacal-01 + NVIDIA Quadro P2000 SPECviewperf 12 - specvp12 mediacal-01
min: 22.84 avg: 23 median: 23 (6%) max: 23.11 fps
specvp12 mediacal-01 + NVIDIA T600
19.5 fps (5%)
specvp12 maya-04 + NVIDIA Quadro P2000 SPECviewperf 12 - specvp12 maya-04
min: 59.2 avg: 59.8 median: 59.8 (16%) max: 60.3 fps
specvp12 maya-04 + NVIDIA T600
67.4 fps (18%)
specvp12 energy-01 + NVIDIA Quadro P2000 SPECviewperf 12 - specvp12 energy-01
min: 5.27 avg: 5.4 median: 5.4 (5%) max: 5.62 fps
specvp12 energy-01 + NVIDIA T600
5 fps (4%)
specvp12 creo-01 + NVIDIA Quadro P2000 SPECviewperf 12 - specvp12 creo-01
min: 65 avg: 65.1 median: 65.1 (26%) max: 65.2 fps
specvp12 creo-01 + NVIDIA T600
78.5 fps (31%)
specvp12 catia-04 + NVIDIA Quadro P2000 SPECviewperf 12 - specvp12 catia-04
min: 69.6 avg: 70.2 median: 70.2 (12%) max: 70.8 fps
specvp12 catia-04 + NVIDIA T600
76.9 fps (13%)
specvp12 3dsmax-05 + NVIDIA Quadro P2000 SPECviewperf 12 - specvp12 3dsmax-05
71.9 fps (13%)
specvp12 3dsmax-05 + NVIDIA T600
80 fps (14%)
SPECviewperf 13 specvp13 sw-04 + NVIDIA Quadro P2000 SPECviewperf 13 - specvp13 sw-04
96.1 fps (26%)
specvp13 sw-04 + NVIDIA T600
114 fps (31%)
specvp13 sw-04 + NVIDIA T500 Laptop GPU
min: 64.9 avg: 80.7 median: 82.1 (22%) max: 93.6 fps
GPU TDP ? TDP 18 W TDP 22 W TDP 25 W 100% 79% 83% 64%
specvp13 snx-03 + NVIDIA Quadro P2000 SPECviewperf 13 - specvp13 snx-03
121.9 fps (14%)
specvp13 snx-03 + NVIDIA T600
122 fps (14%)
specvp13 snx-03 + NVIDIA T500 Laptop GPU
min: 71.2 avg: 79.2 median: 77.5 (9%) max: 90.8 fps
GPU TDP ? TDP 18 W TDP 22 W TDP 25 W 100% 64% 74% 65%
specvp13 showcase-02 + NVIDIA Quadro P2000 SPECviewperf 13 - specvp13 showcase-02
30.3 fps (7%)
specvp13 showcase-02 + NVIDIA T600
34.9 fps (8%)
specvp13 showcase-02 + NVIDIA T500 Laptop GPU
min: 16.01 avg: 18.9 median: 16.9 (4%) max: 23.87 fps
GPU TDP ? TDP 18 W TDP 22 W 100% 57% 54%
specvp13 medical-02 + NVIDIA Quadro P2000 SPECviewperf 13 - specvp13 medical-02
18.5 fps (4%)
specvp13 medical-02 + NVIDIA T600
35.7 fps (7%)
specvp13 medical-02 + NVIDIA T500 Laptop GPU
min: 24.84 avg: 29.6 median: 28.7 (6%) max: 36.14 fps
GPU TDP ? TDP 18 W TDP 22 W TDP 25 W 97% 85% 100% 80%
specvp13 maya-05 + NVIDIA Quadro P2000 SPECviewperf 13 - specvp13 maya-05
89.3 fps (10%)
specvp13 maya-05 + NVIDIA T600
99.8 fps (11%)
specvp13 maya-05 + NVIDIA T500 Laptop GPU
min: 48.47 avg: 53.5 median: 51.9 (6%) max: 62 fps
GPU TDP ? TDP 18 W TDP 22 W TDP 25 W 100% 60% 64% 58%
specvp13 energy-02 + NVIDIA Quadro P2000 SPECviewperf 13 - specvp13 energy-02
5.3 fps (2%)
specvp13 energy-02 + NVIDIA T600
12.6 fps (4%)
specvp13 energy-02 + NVIDIA T500 Laptop GPU
min: 8.57 avg: 9.6 median: 8.7 (3%) max: 12.41 fps
GPU TDP ? TDP 18 W TDP 22 W TDP 25 W 100% 85% 87% 85%
specvp13 creo-02 + NVIDIA Quadro P2000 SPECviewperf 13 - specvp13 creo-02
82.1 fps (12%)
specvp13 creo-02 + NVIDIA T600
98 fps (14%)
specvp13 creo-02 + NVIDIA T500 Laptop GPU
min: 55.8 avg: 62.1 median: 59.2 (9%) max: 74.3 fps
GPU TDP ? TDP 18 W TDP 22 W TDP 25 W 100% 67% 72% 66%
specvp13 catia-05 + NVIDIA Quadro P2000 SPECviewperf 13 - specvp13 catia-05
104 fps (12%)
specvp13 catia-05 + NVIDIA T500 Laptop GPU
min: 81.9 avg: 88.6 median: 88.3 (10%) max: 95.8 fps
GPU TDP ? TDP 18 W TDP 22 W TDP 25 W 100% 84% 93% 82%
specvp13 3dsmax-06 + NVIDIA Quadro P2000 SPECviewperf 13 - specvp13 3dsmax-06
71.7 fps (12%)
specvp13 3dsmax-06 + NVIDIA T600
79.9 fps (14%)
specvp13 3dsmax-06 + NVIDIA T500 Laptop GPU
min: 45.15 avg: 51 median: 50.4 (9%) max: 57.9 fps
GPU TDP ? TDP 18 W TDP 22 W TDP 25 W 100% 69% 75% 65%
SPECviewperf 2020 specvp2020 solidworks-05 4k + NVIDIA T600 SPECviewperf 2020 - specvp2020 solidworks-05 4k
16.9 fps (5%)
specvp2020 snx-04 4k + NVIDIA T600 SPECviewperf 2020 - specvp2020 snx-04 4k
75.6 fps (8%)
specvp2020 medical-03 4k + NVIDIA T600 SPECviewperf 2020 - specvp2020 medical-03 4k
4.5 fps (4%)
specvp2020 maya-06 4k + NVIDIA T600 SPECviewperf 2020 - specvp2020 maya-06 4k
46.1 fps (8%)
specvp2020 energy-03 4k + NVIDIA T600 SPECviewperf 2020 - specvp2020 energy-03 4k
6.7 fps (1%)
specvp2020 creo-03 4k + NVIDIA T600 SPECviewperf 2020 - specvp2020 creo-03 4k
32.3 fps (15%)
specvp2020 catia-06 4k + NVIDIA T600 SPECviewperf 2020 - specvp2020 catia-06 4k
13.8 fps (9%)
specvp2020 3dsmax-07 4k + NVIDIA T600 SPECviewperf 2020 - specvp2020 3dsmax-07 4k
19.4 fps (8%)
specvp2020 solidworks-05 1080p + NVIDIA T500 Laptop GPU SPECviewperf 2020 - specvp2020 solidworks-05 1080p
min: 37.82 avg: 40.2 median: 39.1 (8%) max: 43.59 fps
GPU TDP ? TDP 18 W TDP 25 W 100% 90% 87%
specvp2020 snx-04 1080p + NVIDIA T500 Laptop GPU SPECviewperf 2020 - specvp2020 snx-04 1080p
min: 66.2 avg: 76 median: 68.8 (11%) max: 93.1 fps
GPU TDP ? TDP 18 W TDP 25 W 100% 74% 71%
specvp2020 medical-03 1080p + NVIDIA T500 Laptop GPU SPECviewperf 2020 - specvp2020 medical-03 1080p
min: 10.73 avg: 12.1 median: 11 (8%) max: 14.74 fps
GPU TDP ? TDP 18 W TDP 25 W 100% 74% 73%
specvp2020 maya-06 1080p + NVIDIA T500 Laptop GPU SPECviewperf 2020 - specvp2020 maya-06 1080p
min: 59 avg: 65.5 median: 59.3 (9%) max: 78.1 fps
GPU TDP ? TDP 18 W TDP 25 W 100% 76% 76%
specvp2020 energy-03 1080p + NVIDIA T500 Laptop GPU SPECviewperf 2020 - specvp2020 energy-03 1080p
min: 8.62 avg: 9.7 median: 8.7 (7%) max: 11.96 fps
GPU TDP ? TDP 18 W TDP 25 W 100% 72% 72%
specvp2020 creo-03 1080p + NVIDIA T500 Laptop GPU SPECviewperf 2020 - specvp2020 creo-03 1080p
min: 29.28 avg: 34.7 median: 32.7 (16%) max: 41.95 fps
GPU TDP ? TDP 18 W TDP 25 W 100% 70% 78%
specvp2020 catia-06 1080p + NVIDIA T500 Laptop GPU SPECviewperf 2020 - specvp2020 catia-06 1080p
min: 16.48 avg: 19.2 median: 18 (12%) max: 23.22 fps
GPU TDP ? TDP 18 W TDP 25 W 100% 77% 71%
specvp2020 3dsmax-07 1080p + NVIDIA T500 Laptop GPU SPECviewperf 2020 - specvp2020 3dsmax-07 1080p
min: 19.56 avg: 23.3 median: 21.6 (10%) max: 28.9 fps
GPU TDP ? TDP 18 W TDP 25 W 100% 75% 68%
Cinebench R10 Cinebench R10 Shading (32bit) + NVIDIA Quadro P2000 Cinebench R10 - Cinebench R10 Shading (32bit)
6782 Points (5%)
Cinebench R10 Shading (32bit) + NVIDIA T600
6830 Points (5%)
Cinebench R11.5 Cinebench R11.5 OpenGL 64 Bit + NVIDIA Quadro P2000 Cinebench R11.5 - Cinebench R11.5 OpenGL 64 Bit
133.3 fps (46%)
Cinebench R11.5 OpenGL 64 Bit + NVIDIA T600
104.1 fps (36%)
Cinebench R11.5 OpenGL 64 Bit + NVIDIA T500 Laptop GPU
156.6 fps (54%)
GPU TDP ? TDP 22 W 76% 100%
Cinebench R15 + NVIDIA Quadro P2000 Cinebench R15 - Cinebench R15 OpenGL 64 Bit
min: 165.5 avg: 180.9 median: 180.9 (11%) max: 196.2 fps
Cinebench R15 OpenGL 64 Bit + NVIDIA T600
227.1 fps (13%)
Cinebench R15 OpenGL 64 Bit + NVIDIA T500 Laptop GPU
min: 134 avg: 168.8 median: 173 (10%) max: 195 fps
GPU TDP ? TDP 18 W TDP 22 W TDP 25 W 100% 68% 98% 78%
Cinebench R15 OpenGL Ref. Match 64 Bit + NVIDIA Quadro P2000 Cinebench R15 - Cinebench R15 OpenGL Ref. Match 64 Bit
99.6 % (100%)
Cinebench R15 OpenGL Ref. Match 64 Bit + NVIDIA T600
99.6 % (100%)
Cinebench R15 OpenGL Ref. Match 64 Bit + NVIDIA T500 Laptop GPU
99.6 % (100%)
GPU TDP ? TDP 18 W TDP 22 W TDP 25 W 100% 100% 100% 100%
GFXBench - GFXBench Car Chase Offscreen
119 fps (13%)
GFXBench 3.1 - GFXBench Manhattan ES 3.1 Offscreen
183 fps (4%)
GFXBench 3.0 - GFXBench 3.0 Manhattan Offscreen
236 fps (14%)
GFXBench (DX / GLBenchmark) 2.7 + NVIDIA T500 Laptop GPU GFXBench (DX / GLBenchmark) 2.7 - GFXBench T-Rex HD Offscreen C24Z16
503 fps (4%)
LuxMark v2.0 64Bit - LuxMark v2.0 Room GPU
min: 870 avg: 1075 median: 1075 (5%) max: 1280 Samples/s
1121 Samples/s (5%)
653 Samples/s (3%)
GPU TDP ? TDP 22 W 100% 60%
LuxMark v2.0 64Bit - LuxMark v2.0 Sala GPU
min: 2636 avg: 2692 median: 2691.5 (5%) max: 2747 Samples/s
2049 Samples/s (4%)
1976 Samples/s (3%)
GPU TDP ? TDP 22 W 100% 80%
ComputeMark v2.1 - ComputeMark v2.1 Result
min: 4723 avg: 4859 median: 4858.5 (5%) max: 4994 Points
4825 Points (5%)
4734 Points (5%)
GPU TDP ? TDP 22 W 100% 98%
Power Consumption - Furmark Stress Test Power Consumption - external Monitor *
76.7 Watt (11%)
min: 45.1 avg: 47.1 median: 47.1 (7%) max: 49 Watt
GPU TDP ? TDP 18 W 100% 103%
Power Consumption - The Witcher 3 Power Consumption - external Monitor *
83.5 Watt (12%)
min: 36.6 avg: 43.7 median: 43.7 (6%) max: 50.8 Watt
GPU TDP ? TDP 18 W 100% 105%
Power Consumption - Witcher 3 Power Consumption *
76.5 Watt (17%)
min: 37.1 avg: 49.9 median: 53 (12%) max: 59.6 Watt
GPU TDP ? TDP 18 W TDP 22 W 100% 107% 101%
Power Consumption - Witcher 3 ultra Power Efficiency
0.3 fps per Watt (34%)
min: 0.3674 avg: 0.4 median: 0.4 (42%) max: 0.4555 fps per Watt
GPU TDP ? TDP 18 W TDP 22 W 84% 100% 81%
Power Consumption - Witcher 3 ultra Power Efficiency - external Monitor
0.3 fps per Watt (27%)
min: 0.439 avg: 0.5 median: 0.5 (37%) max: 0.4617 fps per Watt
GPU TDP ? TDP 18 W 83% 100%
Emissions Witcher 3 Fan Noise + NVIDIA Quadro P2000 Emissions - Witcher 3 Fan Noise
46.5 dB(A) (74%)
Witcher 3 Fan Noise + NVIDIA T500 Laptop GPU
min: 36.1 avg: 38.1 median: 38.1 (61%) max: 40.1 dB(A)
GPU TDP ? TDP 22 W 100% 97%
Average Benchmarks NVIDIA Quadro P2000 → 100% n=24 Average Benchmarks NVIDIA T600 → 126% n=24 Average Benchmarks NVIDIA T500 Laptop GPU → 89% n=24
- Range of benchmark values for this graphics card
- Average benchmark values for this graphics card
* Smaller numbers mean a higher performance
1 This benchmark is not used for the average calculation
Game Benchmarks The following benchmarks stem from our benchmarks of review laptops. The performance depends on the used graphics memory, clock rate, processor, system settings, drivers, and operating systems. So the results don't have to be representative for all laptops with this GPU. For detailed information on the benchmark results, click on the fps number.
T500 Laptop GPU:
10.9 15 ~ 13 fps
T500 Laptop GPU:
108 113 ~ 111 fps
100%
Quadro P2000:
139 fps
58%
T500 Laptop GPU:
31 72 ~ 52 fps
64%
T500 Laptop GPU:
25 34 ~ 30 fps
68%
T500 Laptop GPU:
22 33 ~ 28 fps
77%
T500 Laptop GPU:
21 32 ~ 27 fps
100%
Quadro P2000:
104 fps
57%
T500 Laptop GPU:
5.7 fps
100%
Quadro P2000:
201 fps
100%
Quadro P2000:
144 fps
100%
Quadro P2000:
115 fps
100%
Quadro P2000:
169 fps
100%
Quadro P2000:
101 fps
100%
Quadro P2000:
201 fps
100%
Quadro P2000:
105 fps
100%
Quadro P2000:
249 fps
100%
Quadro P2000:
164 fps
100%
Quadro P2000:
110 fps
100%
Quadro P2000:
125 fps
100%
Quadro P2000:
244 fps
100%
Quadro P2000:
119 fps
100%
Quadro P2000:
350 fps
100%
Quadro P2000:
288 fps
100%
Quadro P2000:
162 fps
100%
Quadro P2000:
114 fps
100%
Quadro P2000:
116 fps
100%
Quadro P2000:
112 fps
100%
Quadro P2000:
101 fps
100%
Quadro P2000:
130.2 fps
100%
Quadro P2000:
115.4 fps
100%
Quadro P2000:
102.4 fps
100%
Quadro P2000:
97.5 fps
100%
Quadro P2000:
109 fps
100%
Quadro P2000:
71 76.1 ~ 74 fps
100%
Quadro P2000:
33 43.2 ~ 38 fps
100%
Quadro P2000:
24.3 26 ~ 25 fps
T500 Laptop GPU:
133 148 ~ 141 fps
T500 Laptop GPU:
19 23.2 ~ 21 fps
100%
Quadro P2000:
133 fps
100%
Quadro P2000:
317 fps
100%
Quadro P2000:
213 fps
100%
Quadro P2000:
184 fps
Average Gaming NVIDIA Quadro P2000 → 100% Average Gaming 30-70 fps → 100%
Average Gaming NVIDIA T600 → 117% Average Gaming 30-70 fps → 107%
Average Gaming NVIDIA T500 Laptop GPU → 76% Average Gaming 30-70 fps → 73%
NVIDIA T600 low med. high ultra QHD 4K Far Cry 6 93.5 44.6 21.3 6.33 F1 2021 171.9 78.8 63.7 40.2 29.1 15.7 F1 2020 150.4 73.1 55.5 38.6 27 14.5 Borderlands 3 107.6 42 26.7 19.9 13.4 5.54 Metro Exodus 74.6 34 24 19.4 14.8 8.47 Strange Brigade 174.4 64.9 51.4 44.8 31.9 17.9 Far Cry 5 95 46 42 39 26 12 X-Plane 11.11 132.8 107 95.9 40.8 Final Fantasy XV Benchmark 70.7 34.9 25.1 17.8 9.98 Dota 2 Reborn 162.8 148.6 120.7 110.5 39.6 The Witcher 3 139.1 82.8 47.5 27.2 16.1 GTA V 181.5 175.6 80.3 38.2 26.6 25 < 30 fps < 60 fps < 120 fps ≥ 120 fps 5 7 5 5 2 4 4 3 1 4 5 1 7 1 9 2
NVIDIA T500 Laptop GPU low med. high ultra QHD 4K Cyberpunk 2077 1.0 31 17 13 10.1 Immortals Fenyx Rising 65 35 29 24 Star Wars Squadrons 54.7 47.2 42.4 F1 2020 100 59.8 44 29.3 Strange Brigade 111 34 29 25 17.9 9.6 Far Cry 5 52 30 28 27 X-Plane 11.11 70 63 55 29.4 Final Fantasy XV Benchmark 50 24 17 12.4 5.73 Dota 2 Reborn 128 118 90 79 27.7 The Witcher 3 96 52 29 20 GTA V 141 97 42 21 13.2 14 < 30 fps < 60 fps < 120 fps ≥ 120 fps 3 5 2 2 6 3 6 4 1 7 1 1 3 5
For more games that might be playable and a list of all games and graphics cards visit our Gaming List
v1.26
log 29. 11:09:02
#0 checking url part for id 8886 +0s ... 0s
#1 checking url part for id 11373 +0s ... 0s
#2 checking url part for id 10605 +0s ... 0s
#3 not redirecting to Ajax server +0s ... 0s
#4 did not recreate cache, as it is less than 5 days old! Created at Tue, 28 May 2024 05:35:22 +0200 +0.001s ... 0.001s
#5 composed specs +0.127s ... 0.128s
#6 did output specs +0s ... 0.128s
#7 start showIntegratedCPUs +0s ... 0.128s
#8 getting avg benchmarks for device 8886 +0.053s ... 0.181s
#9 got single benchmarks 8886 +0.019s ... 0.201s
#10 getting avg benchmarks for device 11373 +0.012s ... 0.212s
#11 got single benchmarks 11373 +0.009s ... 0.222s
#12 getting avg benchmarks for device 10605 +0.015s ... 0.237s
#13 got single benchmarks 10605 +0.02s ... 0.256s
#14 got avg benchmarks for devices +0s ... 0.256s
#15 min, max, avg, median took s +0.539s ... 0.796s
#16 before gaming benchmark output +0s ... 0.796s
#17 Got 310 rows for game benchmarks. +0.062s ... 0.858s
#18 composed SQL query for gamebenchmarks +0s ... 0.858s
#19 got data and put it in $dataArray +0.034s ... 0.892s
#20 benchmarks composed for output. +0.099s ... 0.99s
#21 calculated avg scores. +0s ... 0.99s
#22 return log +0.003s ... 0.993s
Please share our article, every link counts!
Redaktion, 2017-09- 8 (Update: 2023-07- 1)
 Deutsch
 English
 Español
 Français
 Italiano
 Nederlands
 Polski
 Português
 Русский
 Türkçe
 Svenska
 Chinese
 Magyar