Intel Iris Pro Graphics 6200 vs NVIDIA GeForce GTX 1070 Max-Q
Intel Iris Pro Graphics 6200 ► remove from comparison
The Intel Iris Pro Graphics 6200 (GT3e) is an integrated graphics card and the fastest GPU of the Broadwell generation. It is built into several high-end CPUs specified at 47 W TDP. The so-called GT3e GPU offers a fast eDRAM cache as well as 48 EUs (Execution Units) and therefore somewhat more shader power than the previous Iris Pro Graphics 5200 . The clock range depends on the model it is built into (up to 1150 MHz with Turbo Boost).
Architecture and Features
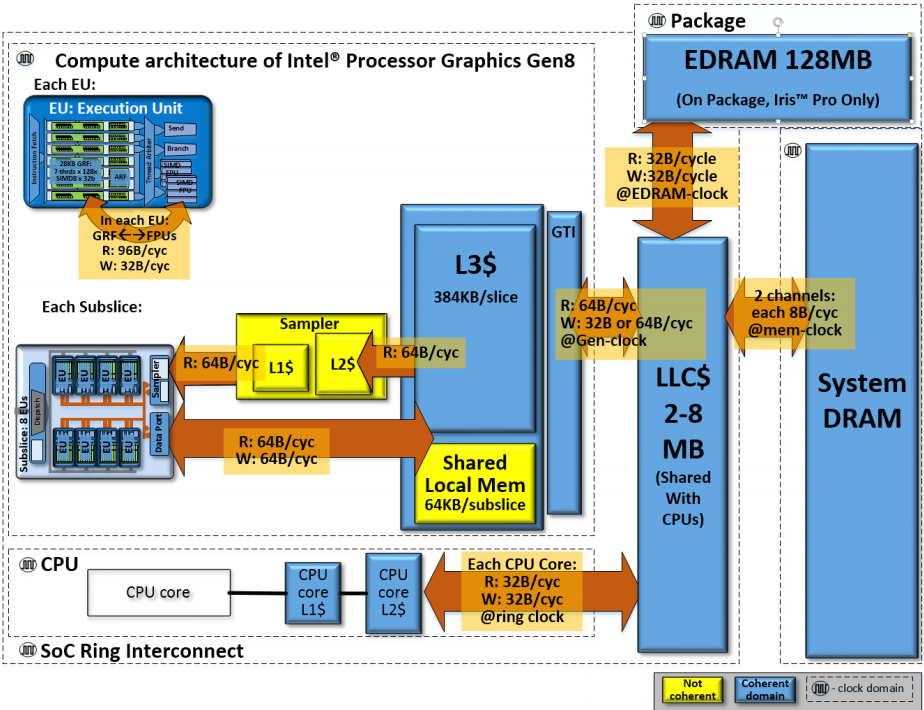
Broadwell features a GPU based on the Intel Gen8 architecture, which has been optimized in various aspects compared to the previous Gen7.5 (Haswell). Inter alia, the shader arrays called "subslice" have been reorganized and now offer 8 Execution Units (EUs) each. Three subslices form a "slice" for a total of 24 EUs. Combined with other improvements such as larger L1 caches and an optimized frontend, the integrated GPU has become faster and more efficient than its predecessor.
The Iris Pro Graphics 6200 represents the high-end "GT3e" version of the Broadwell GPU family and consists of two slices with 48 EUs in total. In addition, there is also a fast eDRAM cache (128 MB), which can be found only on the Iris Pro.
All Broadwell GPUs support OpenCL 2.0 and DirectX 12 (FL 11_1) . The video engine can now decode H.265 using both fixed function hardware as well as available GPU shaders. Up to three displays can be connected via DP 1.2/eDP 1.3 (max. 3840 x 2160 @ 60 Hz) or HDMI 1.4a (max. 3840 x 2160 @ 24 Hz). HDMI 2.0, however, is not supported.
Performance
Depending on the benchmark, the Iris Pro Graphics 6200 performs similar to a dedicated GeForce GT 750M or GeForce 940M . Many games of 2014/2015 can be played fluently in WXGA resolution (1366 x 768) and medium detail settings. However, very demanding games such as The Witcher 3 will require lower resolutions and/or details.
Power Consumption
Utilizing a new 14 nm FinFET process, the Iris Pro Graphics 6200 is specified at 47 W TDP (entire chip including CPU, GPU and memory controller) and therefore suited for medium-sized notebooks. The TDP is flexible and can be further reduced (37 W), which has a significant impact on performance.
NVIDIA GeForce GTX 1070 Max-Q ► remove from comparison
The Nvidia GeForce GTX 1070 with the Max-Q design is a mobile high-end GPU from the Pascal series. It is designed for thin and light laptops and about 10-15% slower than a regular GTX 1070 for laptops based on the cooling capabilities. The base frequency (1101-1215 MHz) is also much lower than on the regular GTX 1070 (1433 MHz, at least -10%) and the Boost (1265-1379 MHz) is also much lower compared to 1645 MHz (at least -6%) for the regular GTX 1070. The memory clock, however, is identical.
The clock is not the only difference compared to the regular GTX 1070 though. The drivers for the Max-Q version were optimized for efficiency (and not performance; only for Max-Q models), there are optimized voltage converters for 1V operation, high-end cooling methods, and a 40 dB limit for the fan noise (with clock adjustments to ensure this at all times).
Features
The GP104 chip is manufactured in 16nm FinFET process at TSMC and offers a range of new features. DisplayPort 1.4 (ready), HDMI 2.0b, HDR, Simultaneous Multi-Projection (SMP), improved H.265 video en- and decoders (for PlayReady 3.0) are only some of the improvements. See our detailed Pascal architecture article for more details.
The power consumption of the Max-Q design is notably lower than the normal GTX 1070 for laptops and ranges between 80 and 90 Watt (TGP) according to Nvidia.
Intel Iris Pro Graphics 6200 NVIDIA GeForce GTX 1070 Max-Q GeForce GTX 1000 Series Codename Broadwell GT3e N17E-G2 Max-Q Architecture Gen. 8 Broadwell Pascal Pipelines 48 - unified 2048 - unified Core Speed 300 - 1150 (Boost) MHz 1101 - 1215 - 1265 - 1379 (Boost) MHz Memory Bus Width eDRAM + 64/128 Bit 256 Bit Shared Memory yes no API DirectX 12 (FL 11_1), OpenGL 4.3 DirectX 12_1, OpenGL 4.5 technology 14 nm 16 nm Features QuickSync Multi-Projection, VR Ready, G-SYNC, Vulkan, Multi Monitor Notebook Size medium sized large Date of Announcement 02.06.2015 30.05.2017 Memory Speed 8000 MHz Memory Type GDDR5 Max. Amount of Memory 8 GB Transistors 7.2 Billion
Benchmarks Performance Rating - 3DMark 11 + Fire Strike + Time Spy - GeForce GTX 1070 Max-Q
6.7 pt (20%)
...
NVIDIA GeForce GTX 1070 Max-Q
...
max:
3DMark - 3DMark Time Spy Score
min: 4396 avg: 4641 median: 4616 (13%) max: 4856 Points
3DMark - 3DMark Time Spy Graphics
min: 4548 avg: 4687 median: 4708 (12%) max: 4795 Points
3DMark - 3DMark Ice Storm Unlimited Graphics
min: 328292 avg: 351332 median: 334256 (38%) max: 398350 Points
3DMark - 3DMark Ice Storm Extreme Graphics
100535 Points (13%)
min: 91895 avg: 209959 median: 215087 (28%) max: 312206 Points
3DMark - 3DMark Cloud Gate Score
min: 12893 avg: 13059 median: 13058.5 (14%) max: 13224 Points
min: 24117 avg: 29752 median: 28582.5 (31%) max: 35886 Points
3DMark - 3DMark Cloud Gate Graphics
min: 15361 avg: 15388 median: 15387.5 (4%) max: 15414 Points
min: 73739 avg: 97317 median: 99551.5 (26%) max: 107807 Points
3DMark - 3DMark Fire Strike Standard Score
min: 1662 avg: 1685 median: 1685 (3%) max: 1708 Points
min: 11857 avg: 12627 median: 12598.5 (22%) max: 14119 Points
3DMark - 3DMark Fire Strike Standard Graphics
min: 1704 avg: 1737 median: 1736.5 (2%) max: 1769 Points
min: 14146 avg: 14910 median: 14678.5 (17%) max: 16165 Points
3DMark - 3DMark Ice Storm Graphics
min: 92053 avg: 245427 median: 241124 (29%) max: 357428 Points
3DMark 11 - 3DM11 Performance Score
3094 Points (4%)
min: 13513 avg: 15401 median: 15409 (21%) max: 17408 Points
3DMark 11 - 3DM11 Performance GPU
2766 Points (2%)
min: 17680 avg: 19016 median: 18688 (16%) max: 20829 Points
3DMark Vantage + NVIDIA GeForce GTX 1070 Max-Q 3DMark Vantage - 3DM Vant. Perf. total
44090 Points (13%)
3DM Vant. Perf. GPU no PhysX + NVIDIA GeForce GTX 1070 Max-Q 3DMark Vantage - 3DM Vant. Perf. GPU no PhysX
47227 Points (27%)
3DMark 06 3DMark 06 - Standard 1280x1024 + NVIDIA GeForce GTX 1070 Max-Q
min: 26805 avg: 30843 median: 30648.5 (40%) max: 35269 Points
SPECviewperf 11 + NVIDIA GeForce GTX 1070 Max-Q SPECviewperf 11 - specvp11 snx-01
11.8 fps (7%)
specvp11 tcvis-02 + NVIDIA GeForce GTX 1070 Max-Q SPECviewperf 11 - specvp11 tcvis-02
3.4 fps (2%)
specvp11 sw-02 + NVIDIA GeForce GTX 1070 Max-Q SPECviewperf 11 - specvp11 sw-02
19.9 fps (15%)
specvp11 proe-05 + NVIDIA GeForce GTX 1070 Max-Q SPECviewperf 11 - specvp11 proe-05
2.9 fps (3%)
specvp11 maya-03 + NVIDIA GeForce GTX 1070 Max-Q SPECviewperf 11 - specvp11 maya-03
18.6 fps (14%)
specvp11 lightwave-01 + NVIDIA GeForce GTX 1070 Max-Q SPECviewperf 11 - specvp11 lightwave-01
21 fps (23%)
specvp11 ensight-04 + NVIDIA GeForce GTX 1070 Max-Q SPECviewperf 11 - specvp11 ensight-04
160.3 fps (77%)
specvp11 catia-03 + NVIDIA GeForce GTX 1070 Max-Q SPECviewperf 11 - specvp11 catia-03
20.3 fps (11%)
SPECviewperf 12 + NVIDIA GeForce GTX 1070 Max-Q SPECviewperf 12 - specvp12 sw-03
min: 44.79 avg: 47.9 median: 47.8 (12%) max: 50.9 fps
specvp12 snx-02 + NVIDIA GeForce GTX 1070 Max-Q SPECviewperf 12 - specvp12 snx-02
min: 6.72 avg: 6.8 median: 6.8 (1%) max: 6.96 fps
specvp12 showcase-01 + NVIDIA GeForce GTX 1070 Max-Q SPECviewperf 12 - specvp12 showcase-01
min: 71.6 avg: 75.2 median: 75.2 (16%) max: 78.8 fps
specvp12 mediacal-01 + NVIDIA GeForce GTX 1070 Max-Q SPECviewperf 12 - specvp12 mediacal-01
min: 32.67 avg: 34.4 median: 34.4 (9%) max: 36.03 fps
specvp12 maya-04 + NVIDIA GeForce GTX 1070 Max-Q SPECviewperf 12 - specvp12 maya-04
min: 83.4 avg: 92.4 median: 92.4 (25%) max: 101.4 fps
specvp12 energy-01 + NVIDIA GeForce GTX 1070 Max-Q SPECviewperf 12 - specvp12 energy-01
6.9 fps (6%)
specvp12 creo-01 + NVIDIA GeForce GTX 1070 Max-Q SPECviewperf 12 - specvp12 creo-01
min: 45.05 avg: 45.2 median: 45.2 (18%) max: 45.43 fps
specvp12 catia-04 + NVIDIA GeForce GTX 1070 Max-Q SPECviewperf 12 - specvp12 catia-04
min: 62.7 avg: 63.3 median: 63.3 (10%) max: 63.9 fps
specvp12 3dsmax-05 + NVIDIA GeForce GTX 1070 Max-Q SPECviewperf 12 - specvp12 3dsmax-05
97.4 fps (17%)
Cinebench R10 Cinebench R10 Shading (32bit) + NVIDIA GeForce GTX 1070 Max-Q Cinebench R10 - Cinebench R10 Shading (32bit)
min: 6820 avg: 9726 median: 10777 (8%) max: 11810 Points
Cinebench R11.5 Cinebench R11.5 OpenGL 64 Bit + NVIDIA GeForce GTX 1070 Max-Q Cinebench R11.5 - Cinebench R11.5 OpenGL 64 Bit
min: 62.7 avg: 68.5 median: 67.2 (23%) max: 76.3 fps
Cinebench R15 + NVIDIA GeForce GTX 1070 Max-Q Cinebench R15 - Cinebench R15 OpenGL 64 Bit
min: 95.9 avg: 104.6 median: 102.1 (6%) max: 118.5 fps
Cinebench R15 OpenGL Ref. Match 64 Bit + NVIDIA GeForce GTX 1070 Max-Q Cinebench R15 - Cinebench R15 OpenGL Ref. Match 64 Bit
99.6 % (100%)
GFXBench 3.0 - GFXBench 3.0 Manhattan Offscreen
459 fps (27%)
LuxMark v2.0 64Bit - LuxMark v2.0 Room GPU
min: 2460 avg: 2523 median: 2523 (11%) max: 2586 Samples/s
LuxMark v2.0 64Bit - LuxMark v2.0 Sala GPU
min: 4877 avg: 4938 median: 4937.5 (9%) max: 4998 Samples/s
ComputeMark v2.1 - ComputeMark v2.1 Result
min: 10798 avg: 10998 median: 10917 (12%) max: 11390 Points
Power Consumption - Witcher 3 Power Consumption *
min: 120 avg: 136.2 median: 134.2 (29%) max: 154 Watt
Power Consumption - Witcher 3 ultra Power Efficiency
min: 0.3221 avg: 0.4 median: 0.4 (38%) max: 0.4389 fps per Watt
Emissions Witcher 3 Fan Noise + NVIDIA GeForce GTX 1070 Max-Q Emissions - Witcher 3 Fan Noise
min: 41.7 avg: 46.1 median: 45 (72%) max: 55 dB(A)
Clock Speed - GPU Clock Witcher 3 ultra
min: 1228 avg: 1344 median: 1342 (53%) max: 1480 MHz
Average Benchmarks Intel Iris Pro Graphics 6200 → 100% n=7 Average Benchmarks NVIDIA GeForce GTX 1070 Max-Q → 549% n=7
- Range of benchmark values for this graphics card
- Average benchmark values for this graphics card
* Smaller numbers mean a higher performance
1 This benchmark is not used for the average calculation
Game Benchmarks The following benchmarks stem from our benchmarks of review laptops. The performance depends on the used graphics memory, clock rate, processor, system settings, drivers, and operating systems. So the results don't have to be representative for all laptops with this GPU. For detailed information on the benchmark results, click on the fps number.
GeForce GTX 1070 Max-Q:
126.1 fps
GeForce GTX 1070 Max-Q:
86.1 fps
GeForce GTX 1070 Max-Q:
78.8 fps
GeForce GTX 1070 Max-Q:
75.7 fps
GeForce GTX 1070 Max-Q:
169.2 fps
GeForce GTX 1070 Max-Q:
83.9 fps
GeForce GTX 1070 Max-Q:
68.3 fps
GeForce GTX 1070 Max-Q:
59.7 fps
GeForce GTX 1070 Max-Q:
140.7 fps
GeForce GTX 1070 Max-Q:
80.6 fps
GeForce GTX 1070 Max-Q:
70 91.7 ~ 81 fps
GeForce GTX 1070 Max-Q:
64.7 85.2 ~ 75 fps
GeForce GTX 1070 Max-Q:
214.4 fps
GeForce GTX 1070 Max-Q:
167.6 fps
GeForce GTX 1070 Max-Q:
110.4 fps
GeForce GTX 1070 Max-Q:
89.6 fps
GeForce GTX 1070 Max-Q:
60 fps
GeForce GTX 1070 Max-Q:
60 fps
GeForce GTX 1070 Max-Q:
92 fps
GeForce GTX 1070 Max-Q:
80.5 fps
GeForce GTX 1070 Max-Q:
68.1 74.8 ~ 71 fps
GeForce GTX 1070 Max-Q:
66.3 68.8 ~ 68 fps
GeForce GTX 1070 Max-Q:
169.8 fps
GeForce GTX 1070 Max-Q:
105 fps
GeForce GTX 1070 Max-Q:
91.4 98.9 ~ 95 fps
GeForce GTX 1070 Max-Q:
84.7 93.3 ~ 89 fps
GeForce GTX 1070 Max-Q:
64 fps
GeForce GTX 1070 Max-Q:
62 fps
GeForce GTX 1070 Max-Q:
52 61 ~ 57 fps
GeForce GTX 1070 Max-Q:
39 44 ~ 42 fps
GeForce GTX 1070 Max-Q:
21 fps
GeForce GTX 1070 Max-Q:
127 fps
GeForce GTX 1070 Max-Q:
101 fps
GeForce GTX 1070 Max-Q:
95 99 ~ 97 fps
GeForce GTX 1070 Max-Q:
78 80 ~ 79 fps
GeForce GTX 1070 Max-Q:
43 fps
GeForce GTX 1070 Max-Q:
199 fps
GeForce GTX 1070 Max-Q:
194 fps
GeForce GTX 1070 Max-Q:
91 130 ~ 111 fps
GeForce GTX 1070 Max-Q:
65 78 ~ 72 fps
GeForce GTX 1070 Max-Q:
62 67 72 ~ 67 fps
GeForce GTX 1070 Max-Q:
58 58 61 ~ 59 fps
GeForce GTX 1070 Max-Q:
20 fps
GeForce GTX 1070 Max-Q:
163 fps
GeForce GTX 1070 Max-Q:
130 fps
GeForce GTX 1070 Max-Q:
70 76 76 ~ 74 fps
GeForce GTX 1070 Max-Q:
59 fps
GeForce GTX 1070 Max-Q:
156.5 fps
GeForce GTX 1070 Max-Q:
88.4 fps
GeForce GTX 1070 Max-Q:
74.8 80.4 ~ 78 fps
GeForce GTX 1070 Max-Q:
56.9 60.3 ~ 59 fps
GeForce GTX 1070 Max-Q:
60 60 ~ 60 fps
GeForce GTX 1070 Max-Q:
60 60 ~ 60 fps
GeForce GTX 1070 Max-Q:
103 fps
GeForce GTX 1070 Max-Q:
81 fps
GeForce GTX 1070 Max-Q:
76 77 79 83 ~ 79 fps
GeForce GTX 1070 Max-Q:
72 74 75 78 ~ 75 fps
GeForce GTX 1070 Max-Q:
27 fps
GeForce GTX 1070 Max-Q:
109 fps
GeForce GTX 1070 Max-Q:
96.5 fps
GeForce GTX 1070 Max-Q:
81.1 fps
GeForce GTX 1070 Max-Q:
112.4 fps
GeForce GTX 1070 Max-Q:
95.9 fps
GeForce GTX 1070 Max-Q:
163.3 fps
GeForce GTX 1070 Max-Q:
133.5 fps
GeForce GTX 1070 Max-Q:
86 94 101 ~ 94 fps
GeForce GTX 1070 Max-Q:
63 70 ~ 67 fps
GeForce GTX 1070 Max-Q:
53 64 ~ 59 fps
GeForce GTX 1070 Max-Q:
52 62 71 71 ~ 64 fps
GeForce GTX 1070 Max-Q:
44 53 61 61 ~ 55 fps
GeForce GTX 1070 Max-Q:
26 fps
GeForce GTX 1070 Max-Q:
152.6 fps
GeForce GTX 1070 Max-Q:
137.4 fps
GeForce GTX 1070 Max-Q:
130.8 fps
GeForce GTX 1070 Max-Q:
111 fps
GeForce GTX 1070 Max-Q:
88.5 fps
GeForce GTX 1070 Max-Q:
53.3 fps
GeForce GTX 1070 Max-Q:
91 132 ~ 112 fps
GeForce GTX 1070 Max-Q:
82 114 ~ 98 fps
GeForce GTX 1070 Max-Q:
74 90 91 ~ 85 fps
GeForce GTX 1070 Max-Q:
62 69 71 ~ 67 fps
GeForce GTX 1070 Max-Q:
158.3 fps
GeForce GTX 1070 Max-Q:
62.7 fps
GeForce GTX 1070 Max-Q:
45.7 fps
GeForce GTX 1070 Max-Q:
31.9 fps
GeForce GTX 1070 Max-Q:
112 125 ~ 119 fps
GeForce GTX 1070 Max-Q:
79 80 81 ~ 80 fps
GeForce GTX 1070 Max-Q:
36 fps
GeForce GTX 1070 Max-Q:
109 [X] MSI GS63VR 7RG Intel Core i7-7700HQ 2.8GHz
GeForce GTX 1070 Max-Q
min:
66 fps
fps
GeForce GTX 1070 Max-Q:
93.7 [X] MSI GS63VR 7RG Intel Core i7-7700HQ 2.8GHz
GeForce GTX 1070 Max-Q
min:
54 fps
fps
GeForce GTX 1070 Max-Q:
86.3 [X] MSI GS63VR 7RG Intel Core i7-7700HQ 2.8GHz
GeForce GTX 1070 Max-Q
min:
56 fps
116 120 ~ 107 fps
GeForce GTX 1070 Max-Q:
68.2 [X] MSI GS63VR 7RG Intel Core i7-7700HQ 2.8GHz
GeForce GTX 1070 Max-Q
min:
51 fps
78.7 84.6 ~ 77 fps
GeForce GTX 1070 Max-Q:
22.4 [X] MSI GS63VR 7RG Intel Core i7-7700HQ 2.8GHz
GeForce GTX 1070 Max-Q
min:
17 fps
fps
GeForce GTX 1070 Max-Q:
128.4 fps
GeForce GTX 1070 Max-Q:
126.3 fps
GeForce GTX 1070 Max-Q:
122 fps
GeForce GTX 1070 Max-Q:
120.8 fps
GeForce GTX 1070 Max-Q:
115.4 121 [X] MSI GS63VR 7RG Intel Core i7-7700HQ 2.8GHz
GeForce GTX 1070 Max-Q
~ 118 fps
GeForce GTX 1070 Max-Q:
71.8 72.8 76.9 [X] MSI GS63VR 7RG Intel Core i7-7700HQ 2.8GHz
GeForce GTX 1070 Max-Q
82.7 ~ 76 fps
GeForce GTX 1070 Max-Q:
40.5 fps
GeForce GTX 1070 Max-Q:
196 196 208 [X] MSI GS63VR 7RG Intel Core i7-7700HQ 2.8GHz
GeForce GTX 1070 Max-Q
~ 200 fps
GeForce GTX 1070 Max-Q:
83.8 [X] MSI GS63VR 7RG Intel Core i7-7700HQ 2.8GHz
GeForce GTX 1070 Max-Q
fps
GeForce GTX 1070 Max-Q:
137 [X] MSI GS63VR 7RG Intel Core i7-7700HQ 2.8GHz
GeForce GTX 1070 Max-Q
fps
GeForce GTX 1070 Max-Q:
130 [X] MSI GS63VR 7RG Intel Core i7-7700HQ 2.8GHz
GeForce GTX 1070 Max-Q
132 138.7 140.8 ~ 135 fps
GeForce GTX 1070 Max-Q:
46.9 [X] MSI GS63VR 7RG Intel Core i7-7700HQ 2.8GHz
GeForce GTX 1070 Max-Q
48.1 ~ 48 fps
GeForce GTX 1070 Max-Q:
167.3 fps
GeForce GTX 1070 Max-Q:
106.4 fps
GeForce GTX 1070 Max-Q:
100.9 fps
GeForce GTX 1070 Max-Q:
89.9 fps
GeForce GTX 1070 Max-Q:
150.1 fps
GeForce GTX 1070 Max-Q:
110.8 fps
GeForce GTX 1070 Max-Q:
77.6 fps
GeForce GTX 1070 Max-Q:
68.5 fps
GeForce GTX 1070 Max-Q:
148.4 fps
GeForce GTX 1070 Max-Q:
86 fps
GeForce GTX 1070 Max-Q:
75.7 78.6 79.7 [X] MSI GS63VR 7RG Intel Core i7-7700HQ 2.8GHz
GeForce GTX 1070 Max-Q
~ 78 fps
GeForce GTX 1070 Max-Q:
42.8 43.7 45.4 [X] MSI GS63VR 7RG Intel Core i7-7700HQ 2.8GHz
GeForce GTX 1070 Max-Q
~ 44 fps
GeForce GTX 1070 Max-Q:
29 [X] MSI GS63VR 7RG Intel Core i7-7700HQ 2.8GHz
GeForce GTX 1070 Max-Q
fps
GeForce GTX 1070 Max-Q:
203.9 fps
GeForce GTX 1070 Max-Q:
128.6 fps
GeForce GTX 1070 Max-Q:
121 122.7 127 [X] MSI GS63VR 7RG Intel Core i7-7700HQ 2.8GHz
GeForce GTX 1070 Max-Q
~ 124 fps
GeForce GTX 1070 Max-Q:
93.4 [X] MSI GS63VR 7RG Intel Core i7-7700HQ 2.8GHz
GeForce GTX 1070 Max-Q
94.2 96 ~ 95 fps
GeForce GTX 1070 Max-Q:
39.1 [X] MSI GS63VR 7RG Intel Core i7-7700HQ 2.8GHz
GeForce GTX 1070 Max-Q
fps
GeForce GTX 1070 Max-Q:
135 138 [X] MSI GS63VR 7RG Intel Core i7-7700HQ 2.8GHz
GeForce GTX 1070 Max-Q
142 ~ 138 fps
GeForce GTX 1070 Max-Q:
116 [X] MSI GS63VR 7RG Intel Core i7-7700HQ 2.8GHz
GeForce GTX 1070 Max-Q
116 117 ~ 116 fps
GeForce GTX 1070 Max-Q:
38.6 [X] MSI GS63VR 7RG Intel Core i7-7700HQ 2.8GHz
GeForce GTX 1070 Max-Q
fps
GeForce GTX 1070 Max-Q:
68.8 [X] SCHENKER Key 15 Coffee Lake Intel Core i7-8750H 2.2GHz
GeForce GTX 1070 Max-Q
71.1 [X] MSI GS63VR 7RG Intel Core i7-7700HQ 2.8GHz
GeForce GTX 1070 Max-Q
~ 70 fps
GeForce GTX 1070 Max-Q:
51.5 [X] SCHENKER Key 15 Coffee Lake Intel Core i7-8750H 2.2GHz
GeForce GTX 1070 Max-Q
55.3 [X] MSI GS63VR 7RG Intel Core i7-7700HQ 2.8GHz
GeForce GTX 1070 Max-Q
~ 53 fps
GeForce GTX 1070 Max-Q:
28 [X] MSI GS63VR 7RG Intel Core i7-7700HQ 2.8GHz
GeForce GTX 1070 Max-Q
fps
GeForce GTX 1070 Max-Q:
79.5 [X] SCHENKER Key 15 Coffee Lake Intel Core i7-8750H 2.2GHz
GeForce GTX 1070 Max-Q
81.2 [X] MSI GS63VR 7RG Intel Core i7-7700HQ 2.8GHz
GeForce GTX 1070 Max-Q
~ 80 fps
GeForce GTX 1070 Max-Q:
68 [X] SCHENKER Key 15 Coffee Lake Intel Core i7-8750H 2.2GHz
GeForce GTX 1070 Max-Q
73.4 [X] MSI GS63VR 7RG Intel Core i7-7700HQ 2.8GHz
GeForce GTX 1070 Max-Q
~ 71 fps
GeForce GTX 1070 Max-Q:
115 [X] MSI GS63VR 7RG Intel Core i7-7700HQ 2.8GHz
GeForce GTX 1070 Max-Q
fps
GeForce GTX 1070 Max-Q:
106 [X] MSI GS63VR 7RG Intel Core i7-7700HQ 2.8GHz
GeForce GTX 1070 Max-Q
fps
GeForce GTX 1070 Max-Q:
52.4 [X] MSI GS63VR 7RG Intel Core i7-7700HQ 2.8GHz
GeForce GTX 1070 Max-Q
fps
GeForce GTX 1070 Max-Q:
118 [X] MSI GS63VR 7RG Intel Core i7-7700HQ 2.8GHz
GeForce GTX 1070 Max-Q
fps
GeForce GTX 1070 Max-Q:
104 [X] MSI GS63VR 7RG Intel Core i7-7700HQ 2.8GHz
GeForce GTX 1070 Max-Q
fps
GeForce GTX 1070 Max-Q:
37.4 [X] MSI GS63VR 7RG Intel Core i7-7700HQ 2.8GHz
GeForce GTX 1070 Max-Q
fps
GeForce GTX 1070 Max-Q:
123.2 fps
GeForce GTX 1070 Max-Q:
105.5 fps
GeForce GTX 1070 Max-Q:
91.5 106 [X] SCHENKER Key 15 Coffee Lake Intel Core i7-8750H 2.2GHz
GeForce GTX 1070 Max-Q
108 [X] MSI GS63VR 7RG Intel Core i7-7700HQ 2.8GHz
GeForce GTX 1070 Max-Q
~ 102 fps
GeForce GTX 1070 Max-Q:
90.7 96.4 [X] SCHENKER Key 15 Coffee Lake Intel Core i7-8750H 2.2GHz
GeForce GTX 1070 Max-Q
96.6 [X] MSI GS63VR 7RG Intel Core i7-7700HQ 2.8GHz
GeForce GTX 1070 Max-Q
~ 95 fps
GeForce GTX 1070 Max-Q:
38.9 [X] MSI GS63VR 7RG Intel Core i7-7700HQ 2.8GHz
GeForce GTX 1070 Max-Q
39.1 ~ 39 fps
GeForce GTX 1070 Max-Q:
51.6 51.8 [X] Smart7 Deimos GX15E G1 Intel Core i7-7700HQ 2.8GHz
GeForce GTX 1070 Max-Q
55.1 56 ~ 54 fps
GeForce GTX 1070 Max-Q:
20.6 fps
GeForce GTX 1070 Max-Q:
215 [X] MSI GS63VR 7RG Intel Core i7-7700HQ 2.8GHz
GeForce GTX 1070 Max-Q
fps
GeForce GTX 1070 Max-Q:
212 [X] MSI GS63VR 7RG Intel Core i7-7700HQ 2.8GHz
GeForce GTX 1070 Max-Q
fps
GeForce GTX 1070 Max-Q:
144 [X] MSI GS63VR 7RG Intel Core i7-7700HQ 2.8GHz
GeForce GTX 1070 Max-Q
fps
GeForce GTX 1070 Max-Q:
68.1 [X] SCHENKER Key 15 Coffee Lake Intel Core i7-8750H 2.2GHz
GeForce GTX 1070 Max-Q
73.9 [X] MSI GS63VR 7RG Intel Core i7-7700HQ 2.8GHz
GeForce GTX 1070 Max-Q
~ 71 fps
GeForce GTX 1070 Max-Q:
37.9 [X] SCHENKER Key 15 Coffee Lake Intel Core i7-8750H 2.2GHz
GeForce GTX 1070 Max-Q
40.4 [X] MSI GS63VR 7RG Intel Core i7-7700HQ 2.8GHz
GeForce GTX 1070 Max-Q
~ 39 fps
GeForce GTX 1070 Max-Q:
24.5 [X] MSI GS63VR 7RG Intel Core i7-7700HQ 2.8GHz
GeForce GTX 1070 Max-Q
fps
GeForce GTX 1070 Max-Q:
86.4 [X] SCHENKER Key 15 Coffee Lake Intel Core i7-8750H 2.2GHz
GeForce GTX 1070 Max-Q
87.3 [X] MSI GS63VR 7RG Intel Core i7-7700HQ 2.8GHz
GeForce GTX 1070 Max-Q
~ 87 fps
GeForce GTX 1070 Max-Q:
78.6 [X] SCHENKER Key 15 Coffee Lake Intel Core i7-8750H 2.2GHz
GeForce GTX 1070 Max-Q
80.2 [X] MSI GS63VR 7RG Intel Core i7-7700HQ 2.8GHz
GeForce GTX 1070 Max-Q
~ 79 fps
GeForce GTX 1070 Max-Q:
31.5 [X] MSI GS63VR 7RG Intel Core i7-7700HQ 2.8GHz
GeForce GTX 1070 Max-Q
fps
GeForce GTX 1070 Max-Q:
70.1 fps
GeForce GTX 1070 Max-Q:
115 [X] MSI GS63VR 7RG Intel Core i7-7700HQ 2.8GHz
GeForce GTX 1070 Max-Q
115 [X] SCHENKER Key 15 Coffee Lake Intel Core i7-8750H 2.2GHz
GeForce GTX 1070 Max-Q
~ 115 fps
GeForce GTX 1070 Max-Q:
106 [X] SCHENKER Key 15 Coffee Lake Intel Core i7-8750H 2.2GHz
GeForce GTX 1070 Max-Q
112 [X] MSI GS63VR 7RG Intel Core i7-7700HQ 2.8GHz
GeForce GTX 1070 Max-Q
~ 109 fps
GeForce GTX 1070 Max-Q:
44.4 [X] MSI GS63VR 7RG Intel Core i7-7700HQ 2.8GHz
GeForce GTX 1070 Max-Q
fps
GeForce GTX 1070 Max-Q:
83.9 [X] SCHENKER Key 15 Coffee Lake Intel Core i7-8750H 2.2GHz
GeForce GTX 1070 Max-Q
88.6 [X] MSI GS63VR 7RG Intel Core i7-7700HQ 2.8GHz
GeForce GTX 1070 Max-Q
~ 86 fps
GeForce GTX 1070 Max-Q:
65.3 [X] SCHENKER Key 15 Coffee Lake Intel Core i7-8750H 2.2GHz
GeForce GTX 1070 Max-Q
72 [X] MSI GS63VR 7RG Intel Core i7-7700HQ 2.8GHz
GeForce GTX 1070 Max-Q
~ 69 fps
GeForce GTX 1070 Max-Q:
33.6 [X] MSI GS63VR 7RG Intel Core i7-7700HQ 2.8GHz
GeForce GTX 1070 Max-Q
fps
GeForce GTX 1070 Max-Q:
92 [X] MSI GS63VR 7RG Intel Core i7-7700HQ 2.8GHz
GeForce GTX 1070 Max-Q
fps
GeForce GTX 1070 Max-Q:
76 [X] MSI GS63VR 7RG Intel Core i7-7700HQ 2.8GHz
GeForce GTX 1070 Max-Q
fps
GeForce GTX 1070 Max-Q:
34 [X] MSI GS63VR 7RG Intel Core i7-7700HQ 2.8GHz
GeForce GTX 1070 Max-Q
fps
GeForce GTX 1070 Max-Q:
85.7 97.7 97.8 100 [X] MSI GS63VR 7RG Intel Core i7-7700HQ 2.8GHz
GeForce GTX 1070 Max-Q
102.8 ~ 97 fps
GeForce GTX 1070 Max-Q:
32.1 33.6 36 [X] MSI GS63VR 7RG Intel Core i7-7700HQ 2.8GHz
GeForce GTX 1070 Max-Q
~ 34 fps
GeForce GTX 1070 Max-Q:
161 [X] SCHENKER Key 15 Coffee Lake Intel Core i7-8750H 2.2GHz
GeForce GTX 1070 Max-Q
168 [X] MSI GS63VR 7RG Intel Core i7-7700HQ 2.8GHz
GeForce GTX 1070 Max-Q
~ 165 fps
GeForce GTX 1070 Max-Q:
143 [X] SCHENKER Key 15 Coffee Lake Intel Core i7-8750H 2.2GHz
GeForce GTX 1070 Max-Q
144 [X] MSI GS63VR 7RG Intel Core i7-7700HQ 2.8GHz
GeForce GTX 1070 Max-Q
~ 144 fps
GeForce GTX 1070 Max-Q:
54.4 [X] MSI GS63VR 7RG Intel Core i7-7700HQ 2.8GHz
GeForce GTX 1070 Max-Q
fps
GeForce GTX 1070 Max-Q:
136 [X] MSI GS63VR 7RG Intel Core i7-7700HQ 2.8GHz
GeForce GTX 1070 Max-Q
fps
GeForce GTX 1070 Max-Q:
121 [X] MSI GS63VR 7RG Intel Core i7-7700HQ 2.8GHz
GeForce GTX 1070 Max-Q
fps
GeForce GTX 1070 Max-Q:
44.7 [X] MSI GS63VR 7RG Intel Core i7-7700HQ 2.8GHz
GeForce GTX 1070 Max-Q
fps
GeForce GTX 1070 Max-Q:
78.8 [X] MSI GS63VR 7RG Intel Core i7-7700HQ 2.8GHz
GeForce GTX 1070 Max-Q
fps
GeForce GTX 1070 Max-Q:
43.6 [X] MSI GS63VR 7RG Intel Core i7-7700HQ 2.8GHz
GeForce GTX 1070 Max-Q
fps
GeForce GTX 1070 Max-Q:
33.4 [X] MSI GS63VR 7RG Intel Core i7-7700HQ 2.8GHz
GeForce GTX 1070 Max-Q
fps
GeForce GTX 1070 Max-Q:
34.3 fps
GeForce GTX 1070 Max-Q:
205.4 fps
GeForce GTX 1070 Max-Q:
169.8 fps
GeForce GTX 1070 Max-Q:
146.3 fps
GeForce GTX 1070 Max-Q:
140.7 fps
GeForce GTX 1070 Max-Q:
60 fps
GeForce GTX 1070 Max-Q:
60 60 60 ~ 60 fps
GeForce GTX 1070 Max-Q:
59 fps
GeForce GTX 1070 Max-Q:
126.9 fps
GeForce GTX 1070 Max-Q:
118.2 fps
GeForce GTX 1070 Max-Q:
111.7 fps
GeForce GTX 1070 Max-Q:
109.7 fps
GeForce GTX 1070 Max-Q:
94 [X] Smart7 Deimos GX15E G1 Intel Core i7-7700HQ 2.8GHz
GeForce GTX 1070 Max-Q
106 111 112 [X] MSI GS63VR 7RG Intel Core i7-7700HQ 2.8GHz
GeForce GTX 1070 Max-Q
~ 106 fps
GeForce GTX 1070 Max-Q:
56 64 [X] Smart7 Deimos GX15E G1 Intel Core i7-7700HQ 2.8GHz
GeForce GTX 1070 Max-Q
73 [X] MSI GS63VR 7RG Intel Core i7-7700HQ 2.8GHz
GeForce GTX 1070 Max-Q
73 79 ~ 69 fps
GeForce GTX 1070 Max-Q:
37 40 [X] MSI GS63VR 7RG Intel Core i7-7700HQ 2.8GHz
GeForce GTX 1070 Max-Q
~ 39 fps
GeForce GTX 1070 Max-Q:
71.2 [X] Smart7 Deimos GX15E G1 Intel Core i7-7700HQ 2.8GHz
GeForce GTX 1070 Max-Q
89.9 [X] SCHENKER Key 15 Coffee Lake Intel Core i7-8750H 2.2GHz
GeForce GTX 1070 Max-Q
90.3 90.4 91.3 [X] SCHENKER Key 15 Coffee Lake Intel Core i7-8750H 2.2GHz
GeForce GTX 1070 Max-Q
91.6 92.8 93.2 94.5 95.5 96 97 97.1 [X] MSI GS63VR 7RG Intel Core i7-7700HQ 2.8GHz
GeForce GTX 1070 Max-Q
97.7 98.2 99.4 100 [X] Asus Zephyrus S GX531GS Turbo Mode Intel Core i7-8750H 2.2GHz
GeForce GTX 1070 Max-Q
101.6 ~ 94 fps
GeForce GTX 1070 Max-Q:
46 48.9 49.2 49.6 49.8 [X] SCHENKER Key 15 Coffee Lake Intel Core i7-8750H 2.2GHz
GeForce GTX 1070 Max-Q
50.2 50.2 [X] SCHENKER Key 15 Coffee Lake Intel Core i7-8750H 2.2GHz
GeForce GTX 1070 Max-Q
50.7 [X] Smart7 Deimos GX15E G1 Intel Core i7-7700HQ 2.8GHz
GeForce GTX 1070 Max-Q
51 51.3 51.5 52.4 52.4 52.7 53.5 53.7 [X] MSI GS63VR 7RG Intel Core i7-7700HQ 2.8GHz
GeForce GTX 1070 Max-Q
54.2 55.3 [X] Asus Zephyrus S GX531GS Turbo Mode Intel Core i7-8750H 2.2GHz
GeForce GTX 1070 Max-Q
55.3 ~ 51 fps
GeForce GTX 1070 Max-Q:
27.7 35.4 [X] MSI GS63VR 7RG Intel Core i7-7700HQ 2.8GHz
GeForce GTX 1070 Max-Q
~ 32 fps
GeForce GTX 1070 Max-Q:
166.7 fps
GeForce GTX 1070 Max-Q:
159.8 fps
GeForce GTX 1070 Max-Q:
145.9 fps
GeForce GTX 1070 Max-Q:
64.6 fps
GeForce GTX 1070 Max-Q:
70.8 [X] Smart7 Deimos GX15E G1 Intel Core i7-7700HQ 2.8GHz
GeForce GTX 1070 Max-Q
fps
GeForce GTX 1070 Max-Q:
68.3 [X] Smart7 Deimos GX15E G1 Intel Core i7-7700HQ 2.8GHz
GeForce GTX 1070 Max-Q
93.3 95.1 98.8 ~ 89 fps
GeForce GTX 1070 Max-Q:
170.4 [X] Smart7 Deimos GX15E G1 Intel Core i7-7700HQ 2.8GHz
GeForce GTX 1070 Max-Q
fps
GeForce GTX 1070 Max-Q:
72.8 [X] Smart7 Deimos GX15E G1 Intel Core i7-7700HQ 2.8GHz
GeForce GTX 1070 Max-Q
fps
GeForce GTX 1070 Max-Q:
62.2 70 ~ 66 fps
For more games that might be playable and a list of all games and graphics cards visit our Gaming List
v1.26
log 19. 11:04:27
#0 checking url part for id 5947 +0s ... 0s
#1 checking url part for id 8008 +0s ... 0s
#2 not redirecting to Ajax server +0s ... 0s
#3 did not recreate cache, as it is less than 5 days old! Created at Sun, 19 May 2024 05:37:06 +0200 +0.001s ... 0.001s
#4 composed specs +0.088s ... 0.089s
#5 did output specs +0s ... 0.089s
#6 start showIntegratedCPUs +0s ... 0.089s
#7 getting avg benchmarks for device 5947 +0.026s ... 0.116s
#8 got single benchmarks 5947 +0.01s ... 0.125s
#9 getting avg benchmarks for device 8008 +0.017s ... 0.142s
#10 got single benchmarks 8008 +0.04s ... 0.182s
#11 got avg benchmarks for devices +0s ... 0.182s
#12 min, max, avg, median took s +0.188s ... 0.37s
#13 before gaming benchmark output +0s ... 0.37s
#14 Got 490 rows for game benchmarks. +0.042s ... 0.411s
#15 composed SQL query for gamebenchmarks +0s ... 0.411s
#16 got data and put it in $dataArray +0.049s ... 0.461s
#17 benchmarks composed for output. +0.161s ... 0.622s
#18 calculated avg scores. +0s ... 0.622s
#19 return log +0.068s ... 0.69s
Please share our article, every link counts!
Redaktion, 2017-09- 8 (Update: 2023-07- 1)
 Deutsch
 English
 Español
 Français
 Italiano
 Nederlands
 Polski
 Português
 Русский
 Türkçe
 Svenska
 Chinese
 Magyar