Apple MacBook Pro 16 2019 Laptop Review: A convincing Core i9-9880H and Radeon Pro 5500M powered multimedia laptop
Apple has bid goodbye to the fourth-generation MacBook Pro 15, after years of criticism about its butterfly keyboard. The company has replaced it with the MacBook Pro 16, a laptop that not only includes a larger display than its predecessor but also reverts to a conventional scissor-switch keyboard. Hopefully, the reliability issues of the fourth-generation MacBook Pro 15 should not afflict the MacBook Pro 16 too.
We have chosen to test the top-spec model, which comes with an Intel Core i9-9880H processor and an AMD Radeon Pro 5500M GPU that has 4 GB of GDDR6 VRAM. The machine also has 16 GB of dual-channel DDR4-2666 RAM and a 1 TB SSD. We would like to point out that our test device is a retail unit, rather than a press one with which Apple has provided us. While we purchased the device in Austria, Apple sells the configuration for US$2,799 in the US. We used the same device for our initial impressions article that we published last month too.
Rating | Date | Model | Weight | Height | Size | Resolution | Price |
|---|---|---|---|---|---|---|---|
| 89.7 % v7 (old) | 12 / 2019 | Apple MacBook Pro 16 2019 i9 5500M i9-9880H, Radeon Pro 5500M | 2 kg | 16.2 mm | 16.00" | 3072x1920 | |
| 87.1 % v7 (old) | 02 / 2020 | Lenovo ThinkPad X1 Extreme 2019 20QV000WGE i7-9750H, GeForce GTX 1650 Mobile | 1.7 kg | 18.7 mm | 15.60" | 3840x2160 | |
| 87.8 % v7 (old) | 08 / 2019 | Dell XPS 15 7590 9980HK GTX 1650 i9-9980HK, GeForce GTX 1650 Mobile | 2 kg | 17 mm | 15.60" | 3840x2160 | |
| 89.4 % v7 (old) | 01 / 2020 | Apple MacBook Pro 15 2019 i9 Vega 20 i9-9980HK, Radeon Pro Vega 20 | 1.8 kg | 15.5 mm | 15.40" | 2880x1800 | |
| 87.8 % v6 (old) | 06 / 2018 | Asus ZenBook Pro 15 UX580GE i9-8950HK, GeForce GTX 1050 Ti Mobile | 1.9 kg | 18.9 mm | 15.60" | 3840x2160 | |
| 85 % v7 (old) | 06 / 2019 | MSI P65 Creator 9SF-657 i9-9880H, GeForce RTX 2070 Max-Q | 1.9 kg | 18 mm | 15.60" | 3840x2160 |
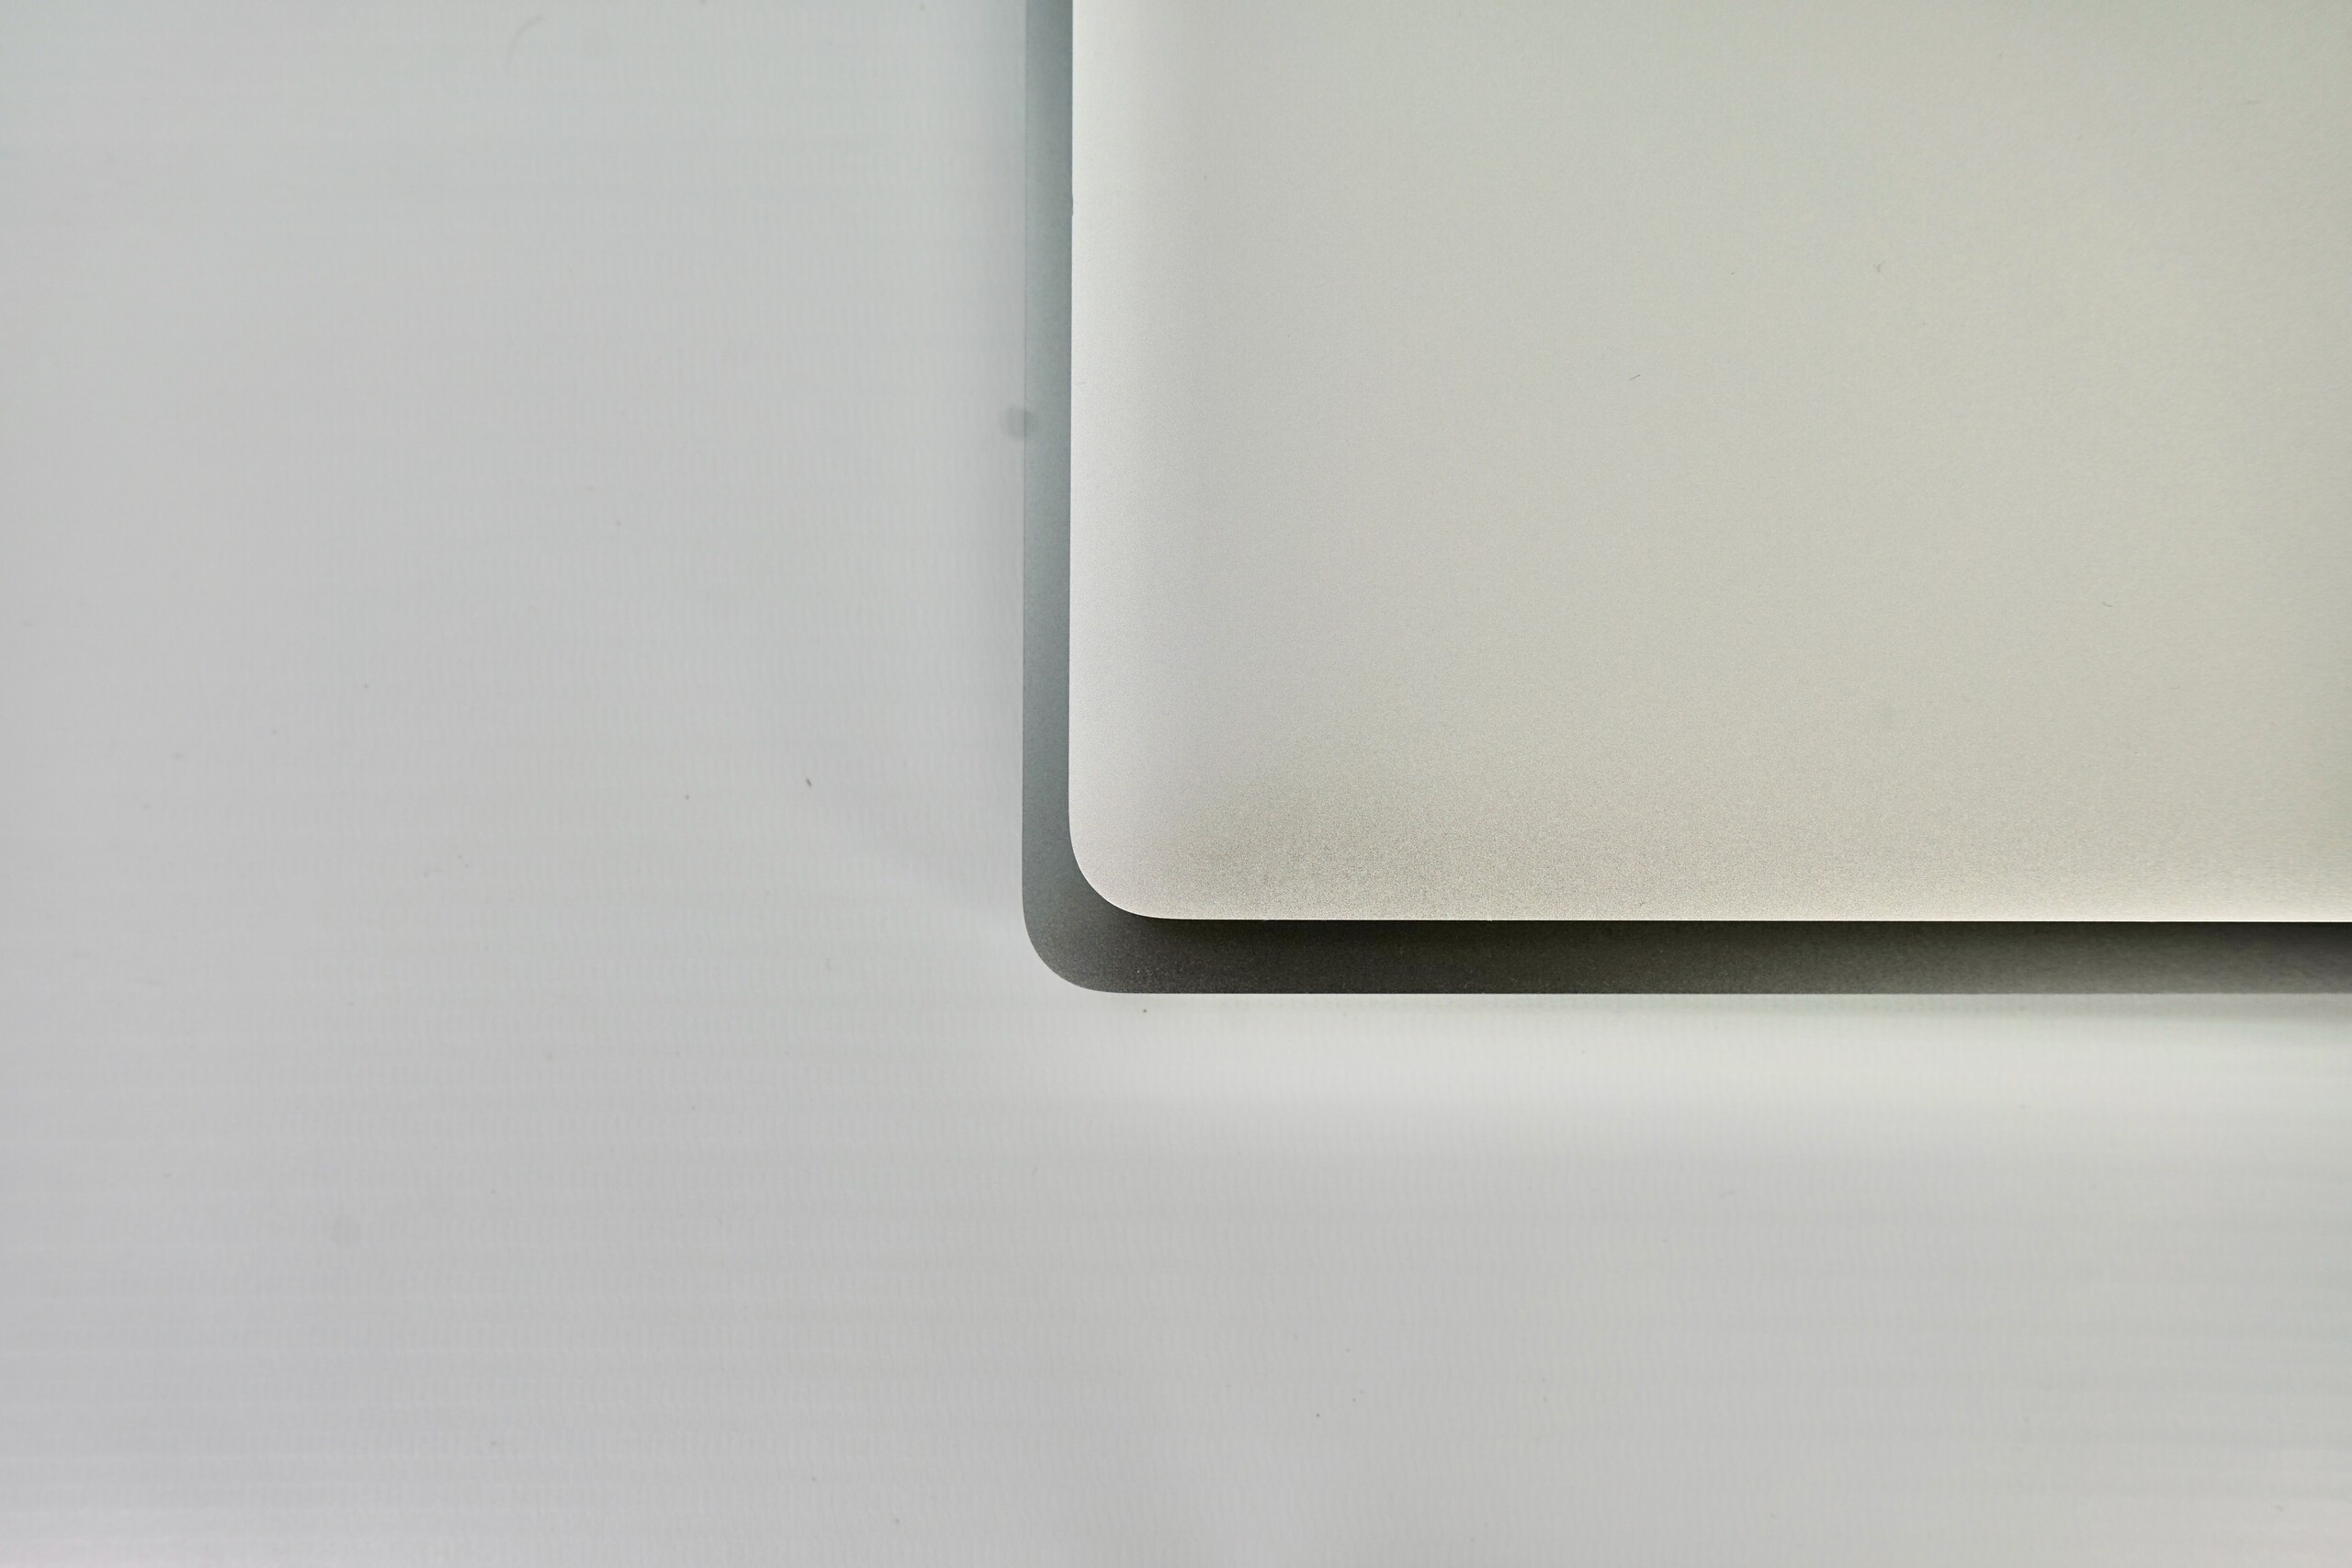
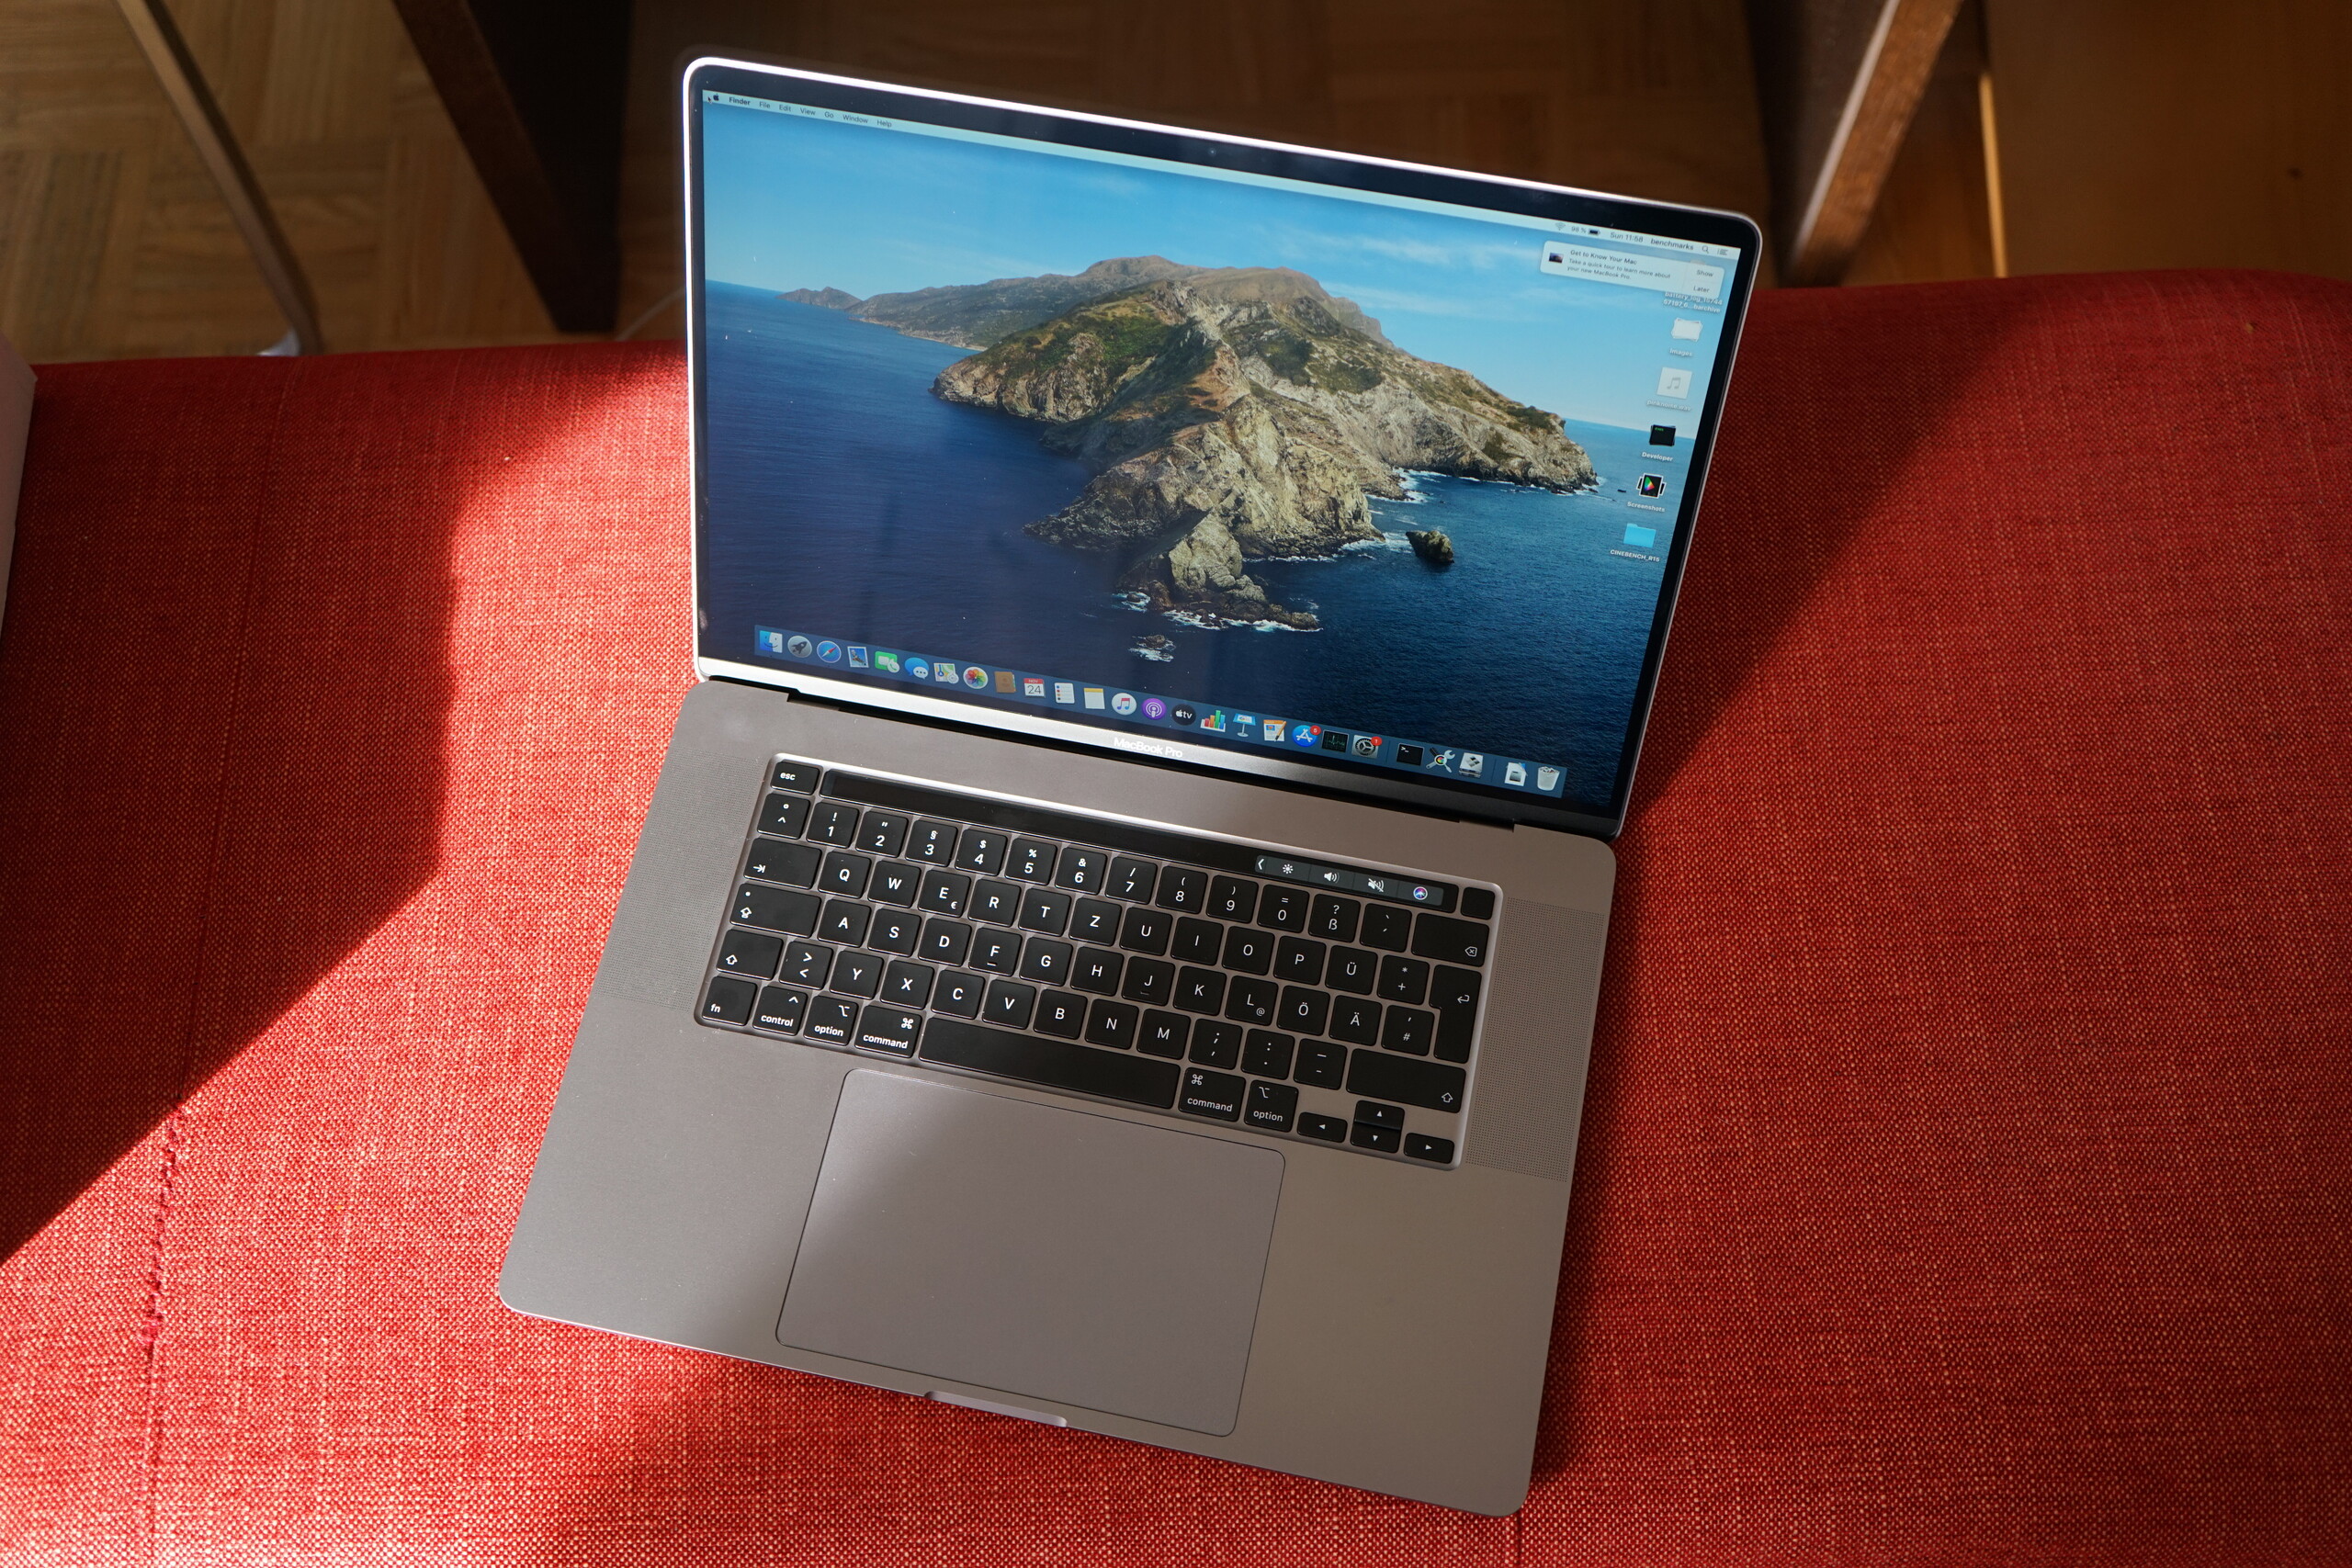
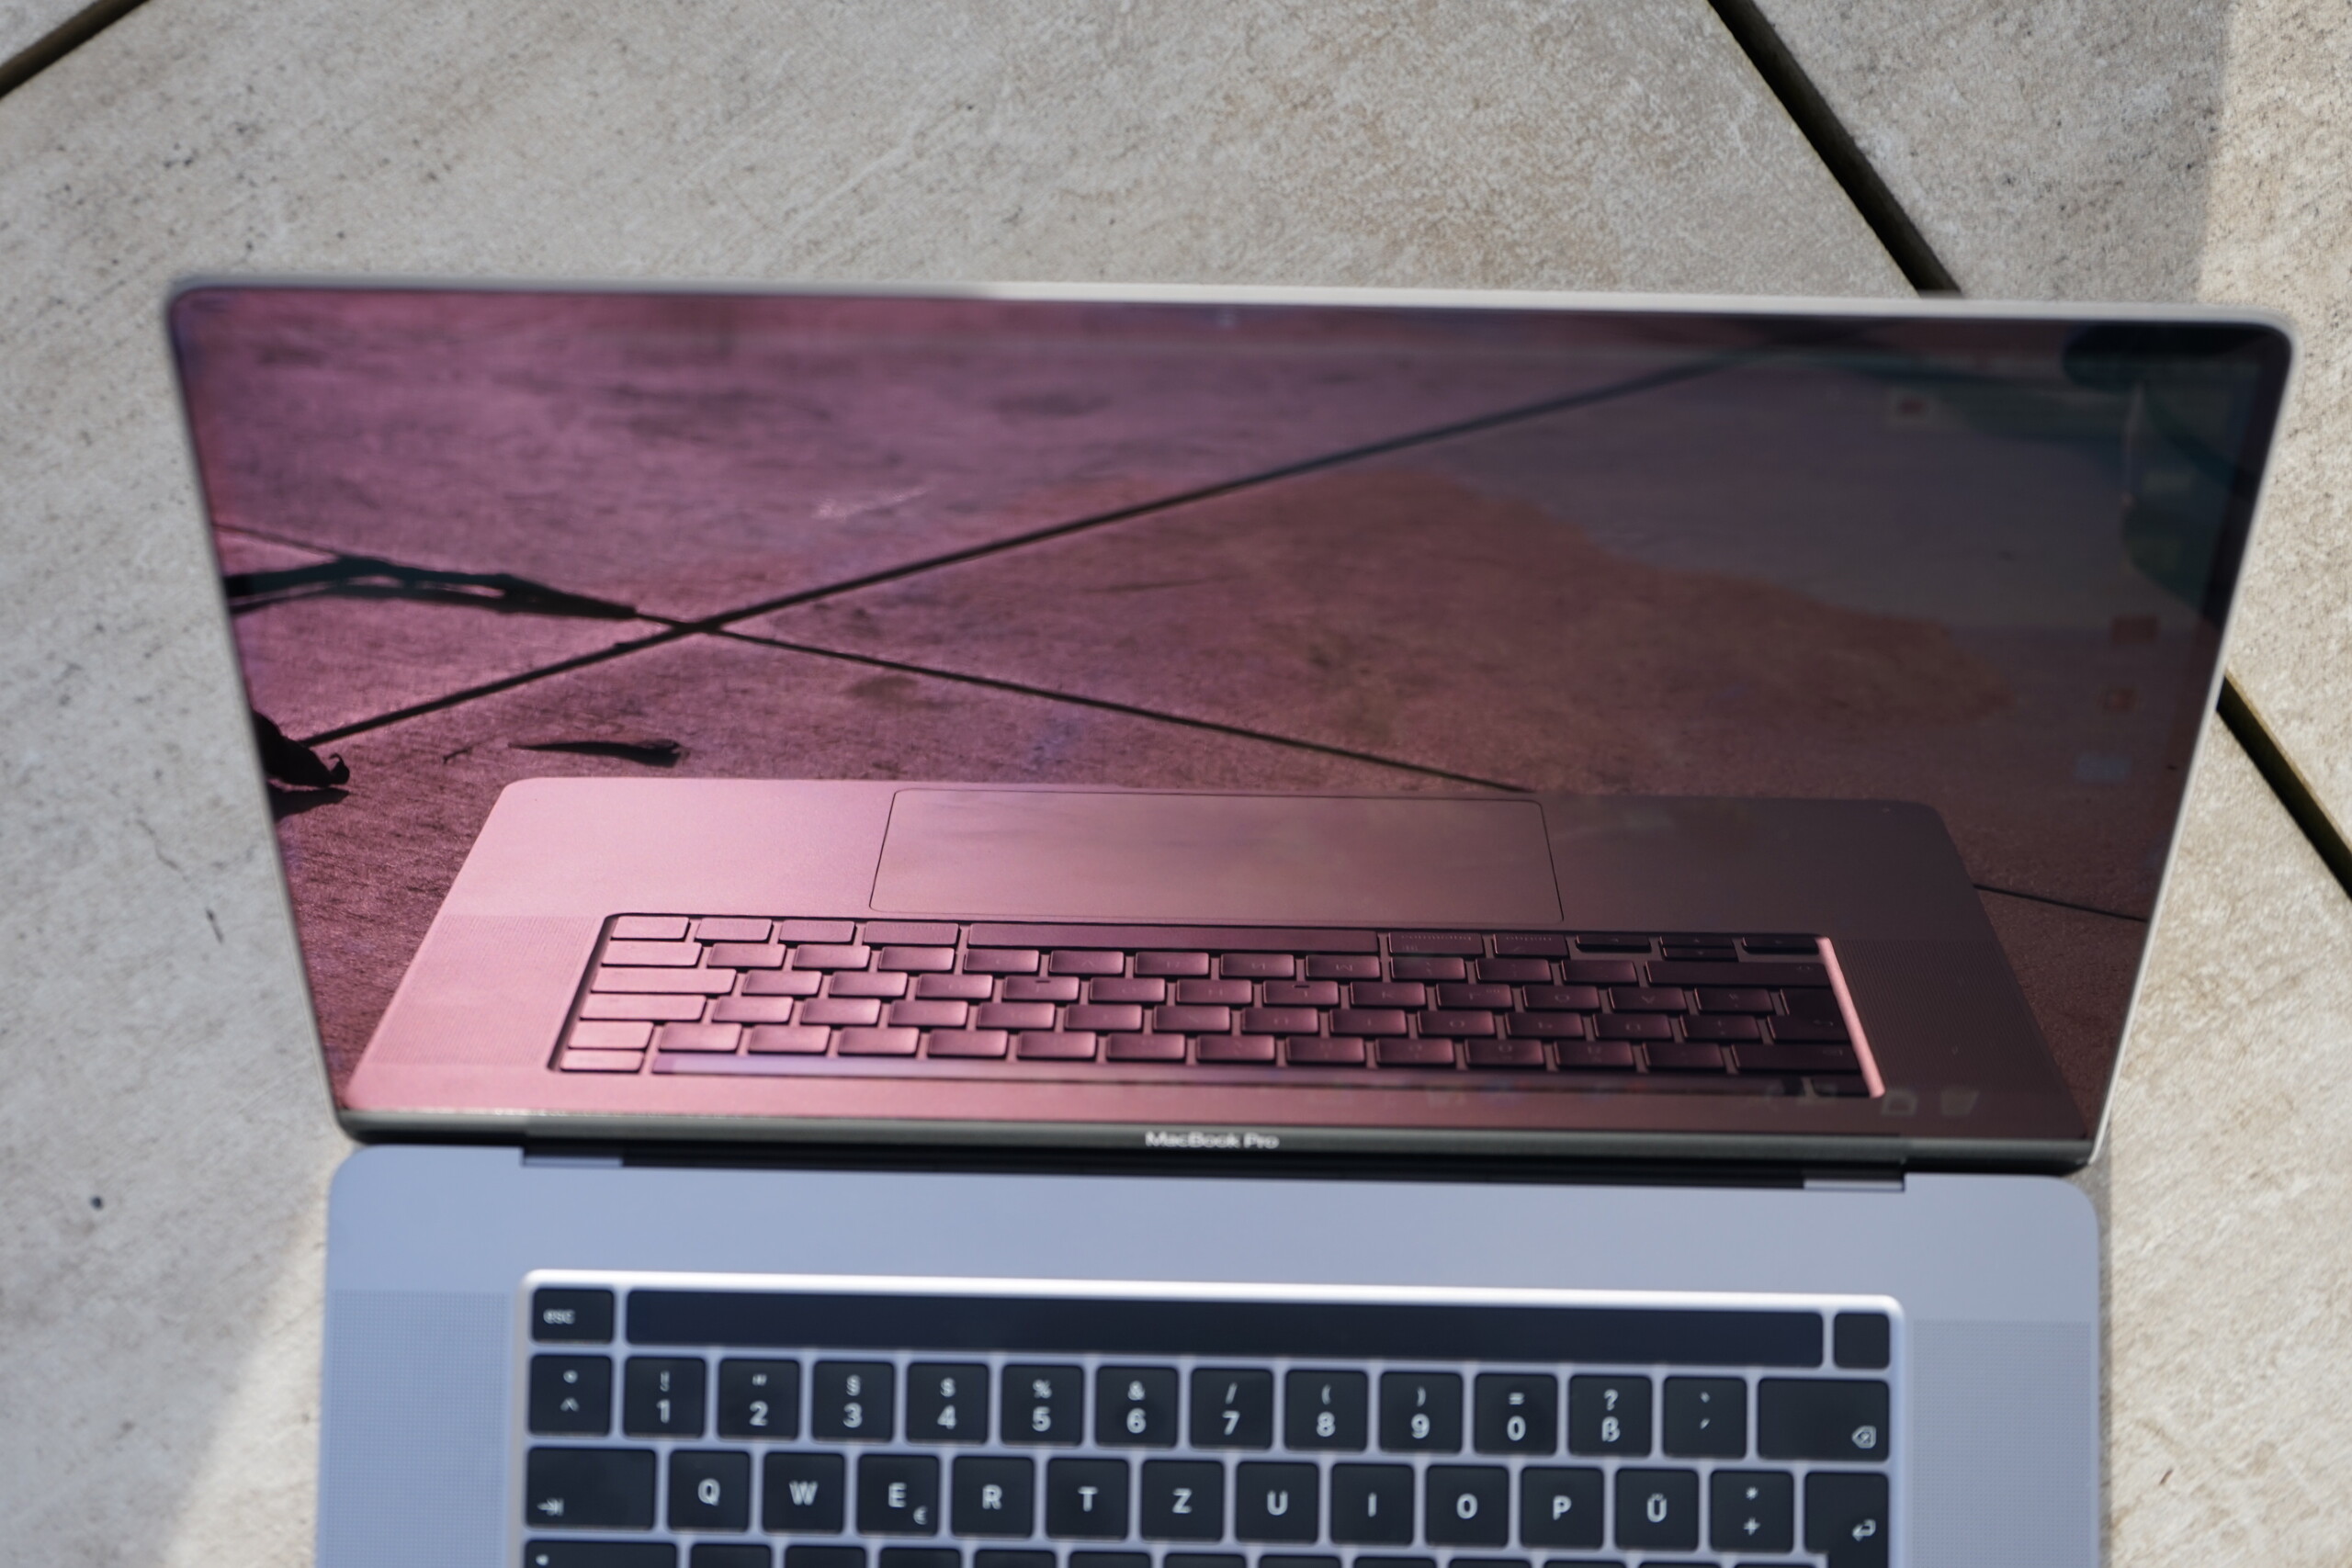
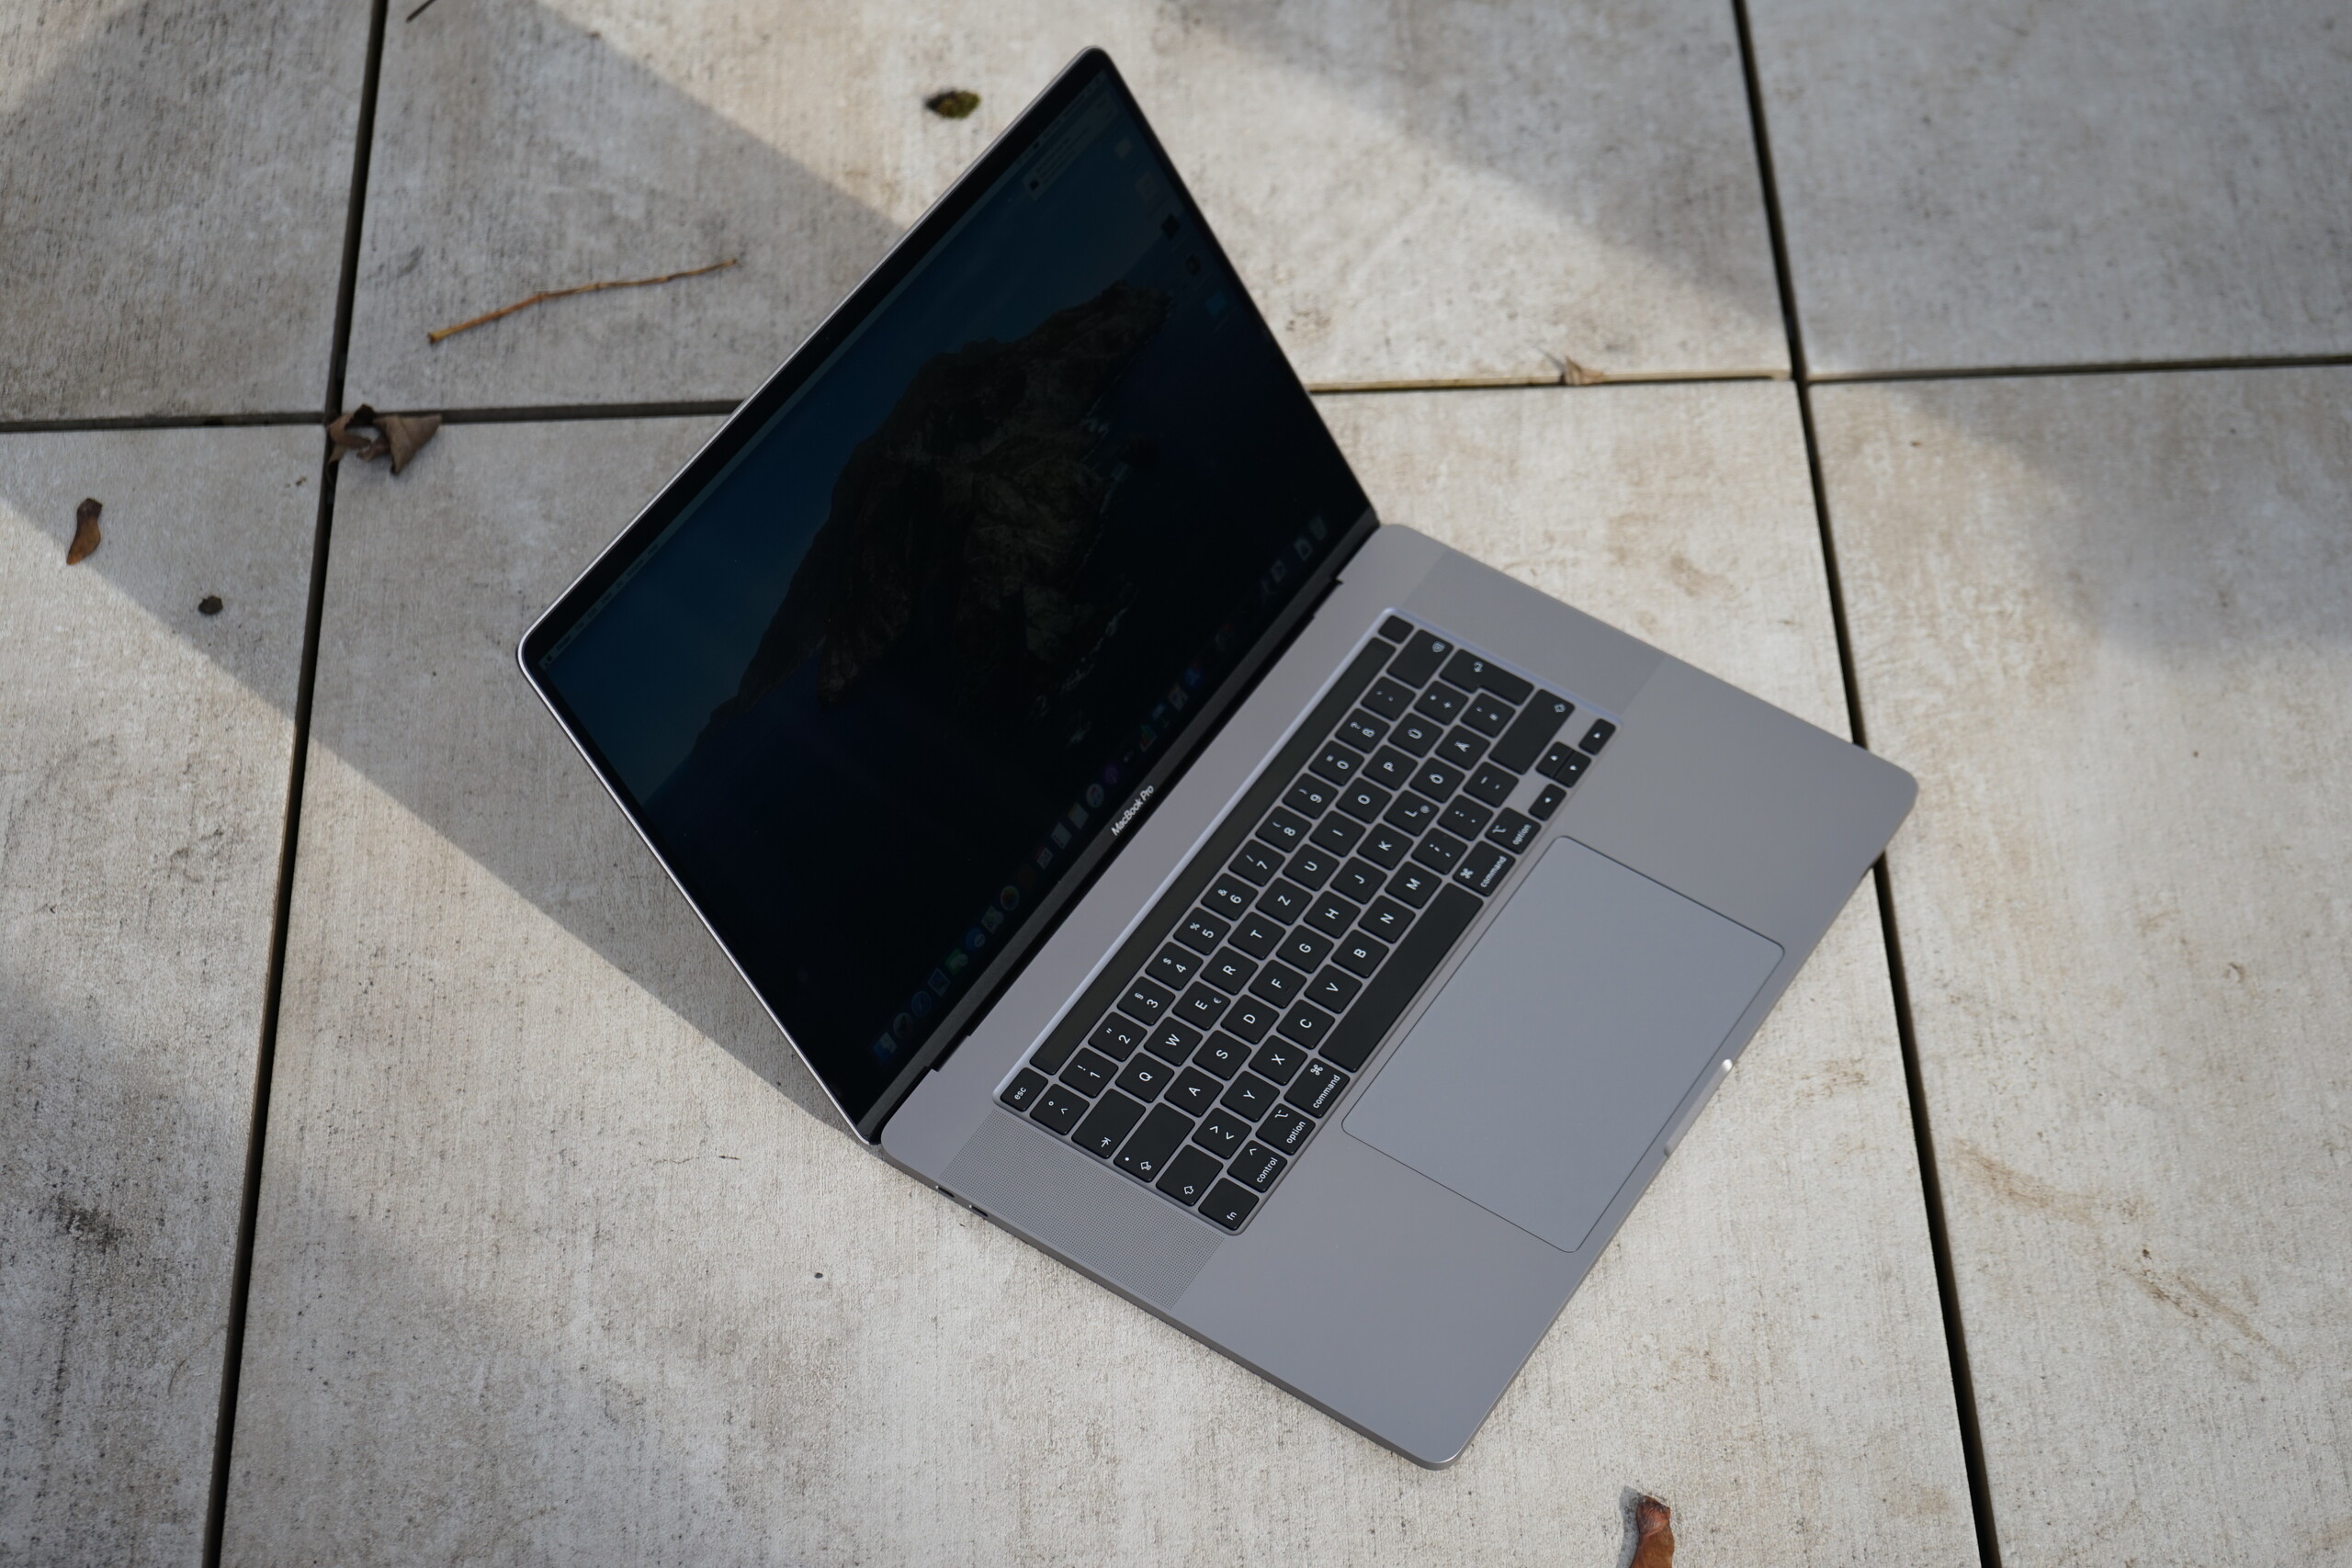
Case - A sumptuous and slightly thicker design
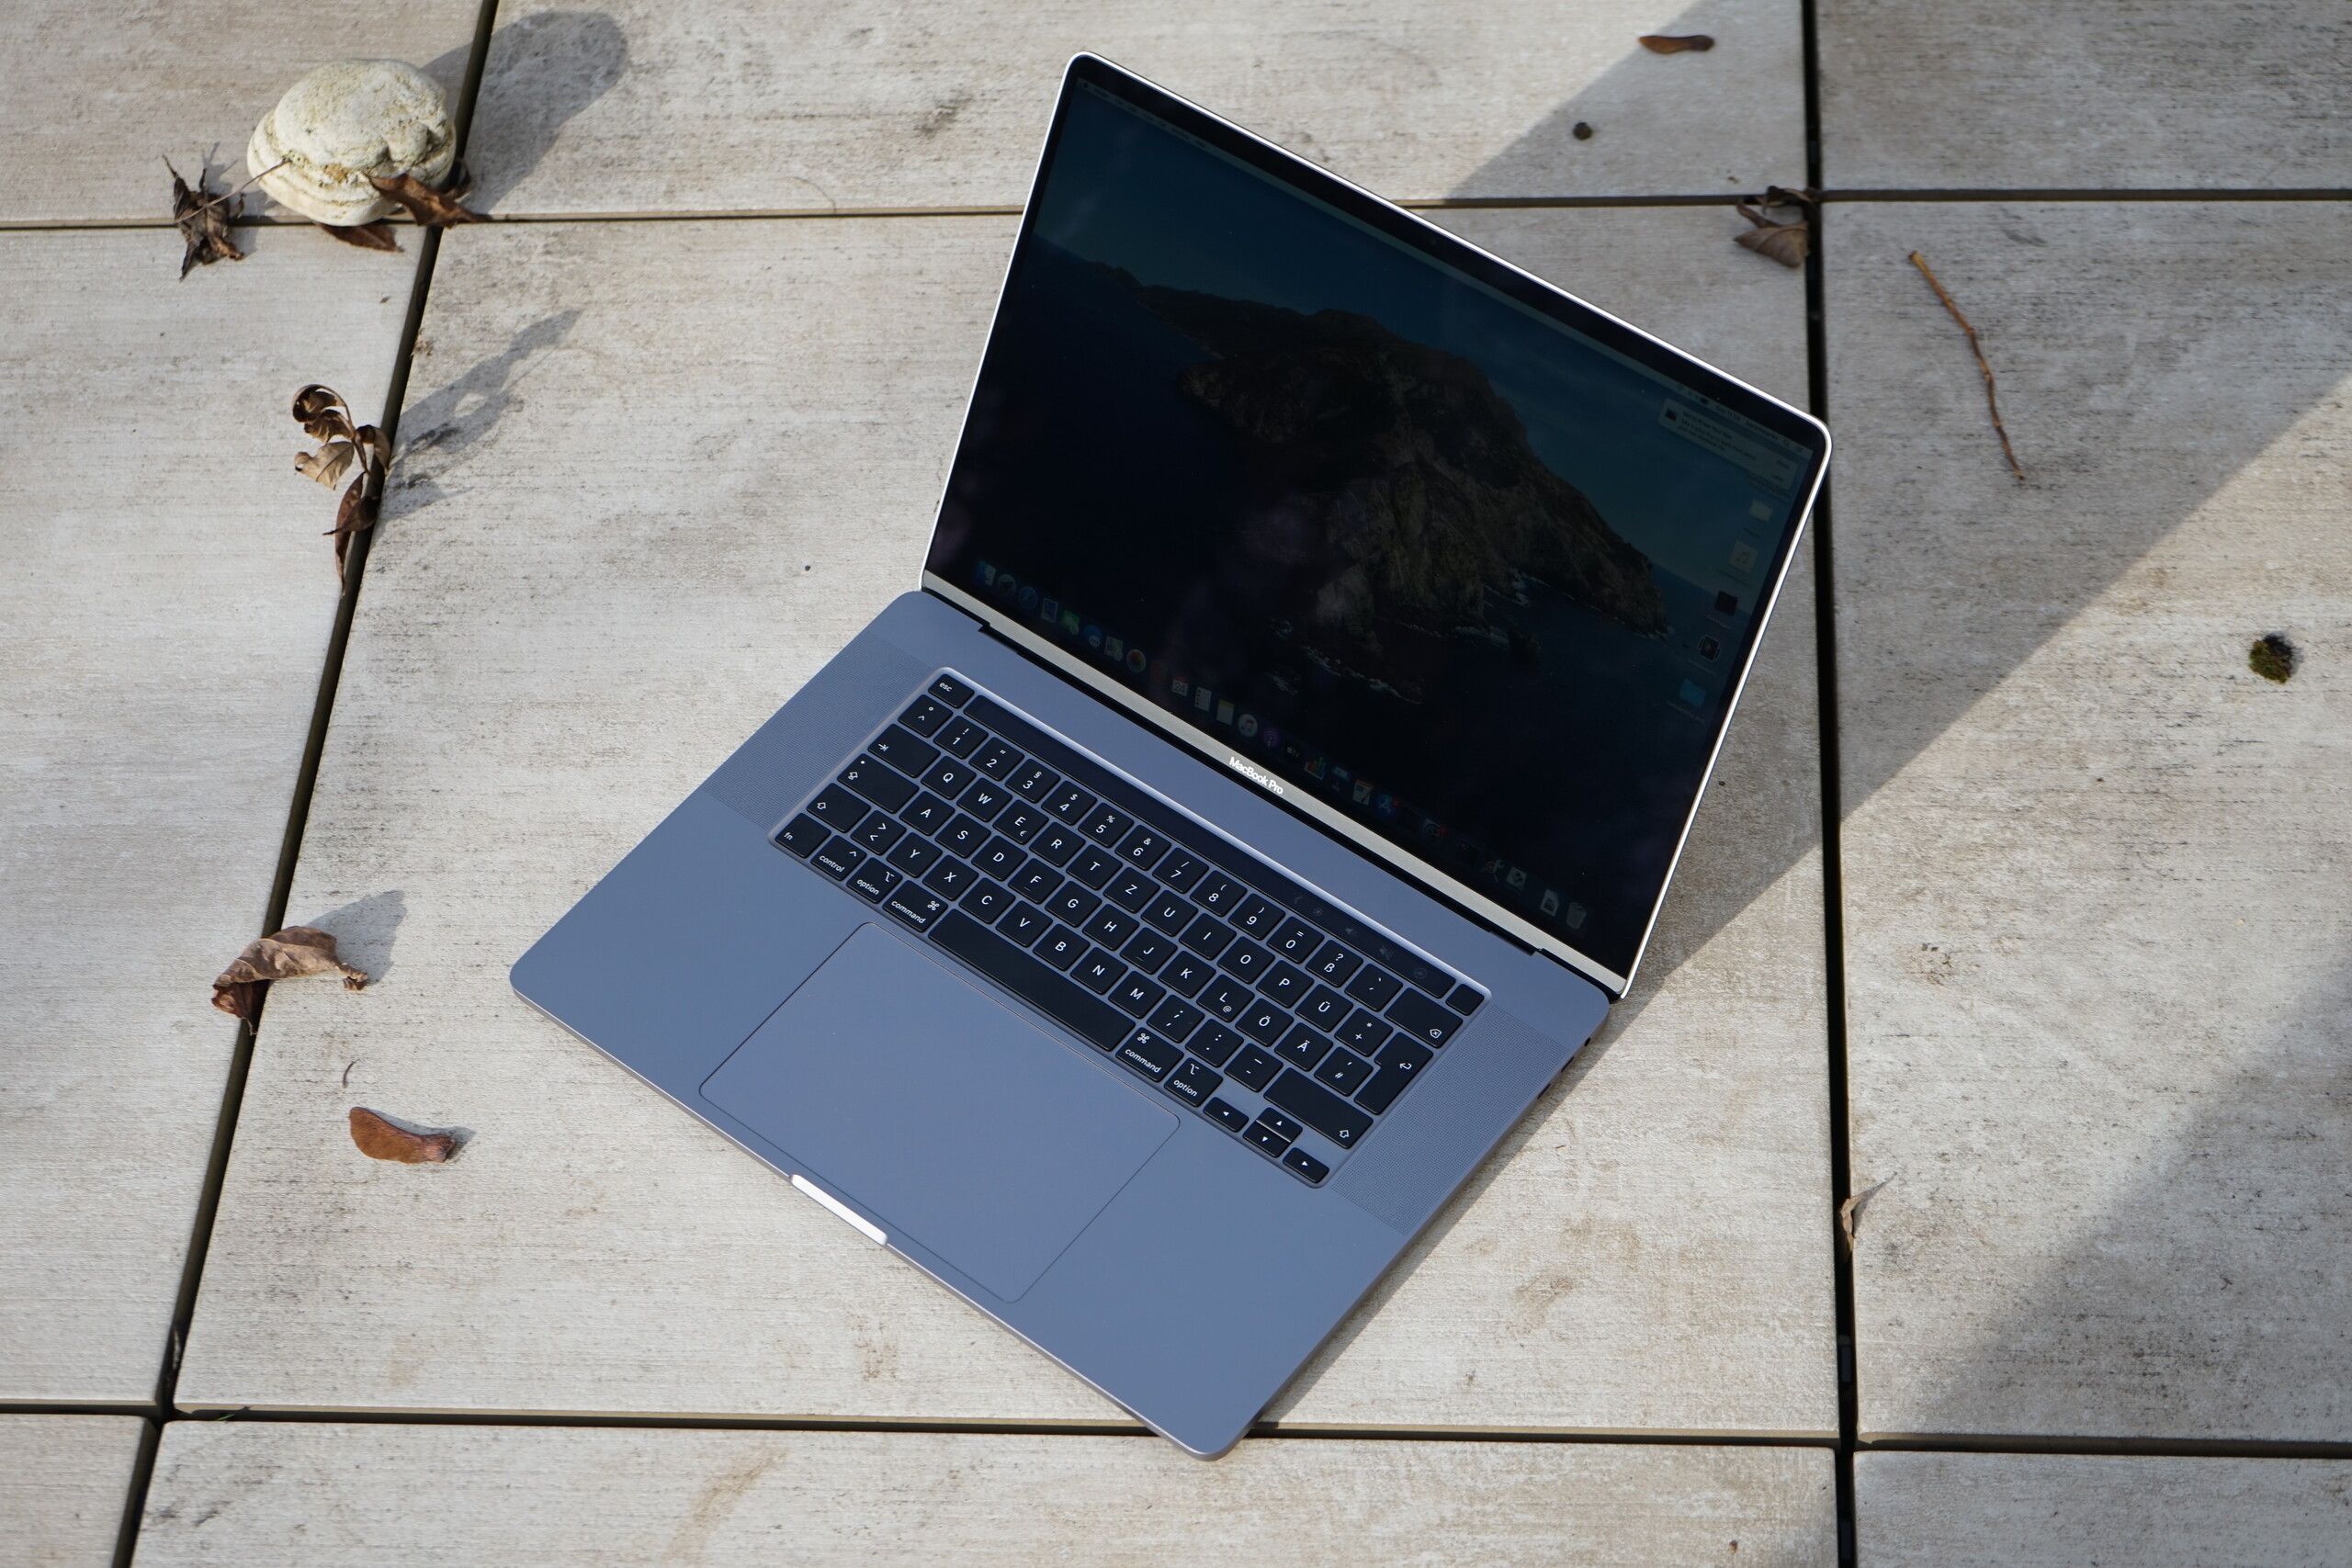
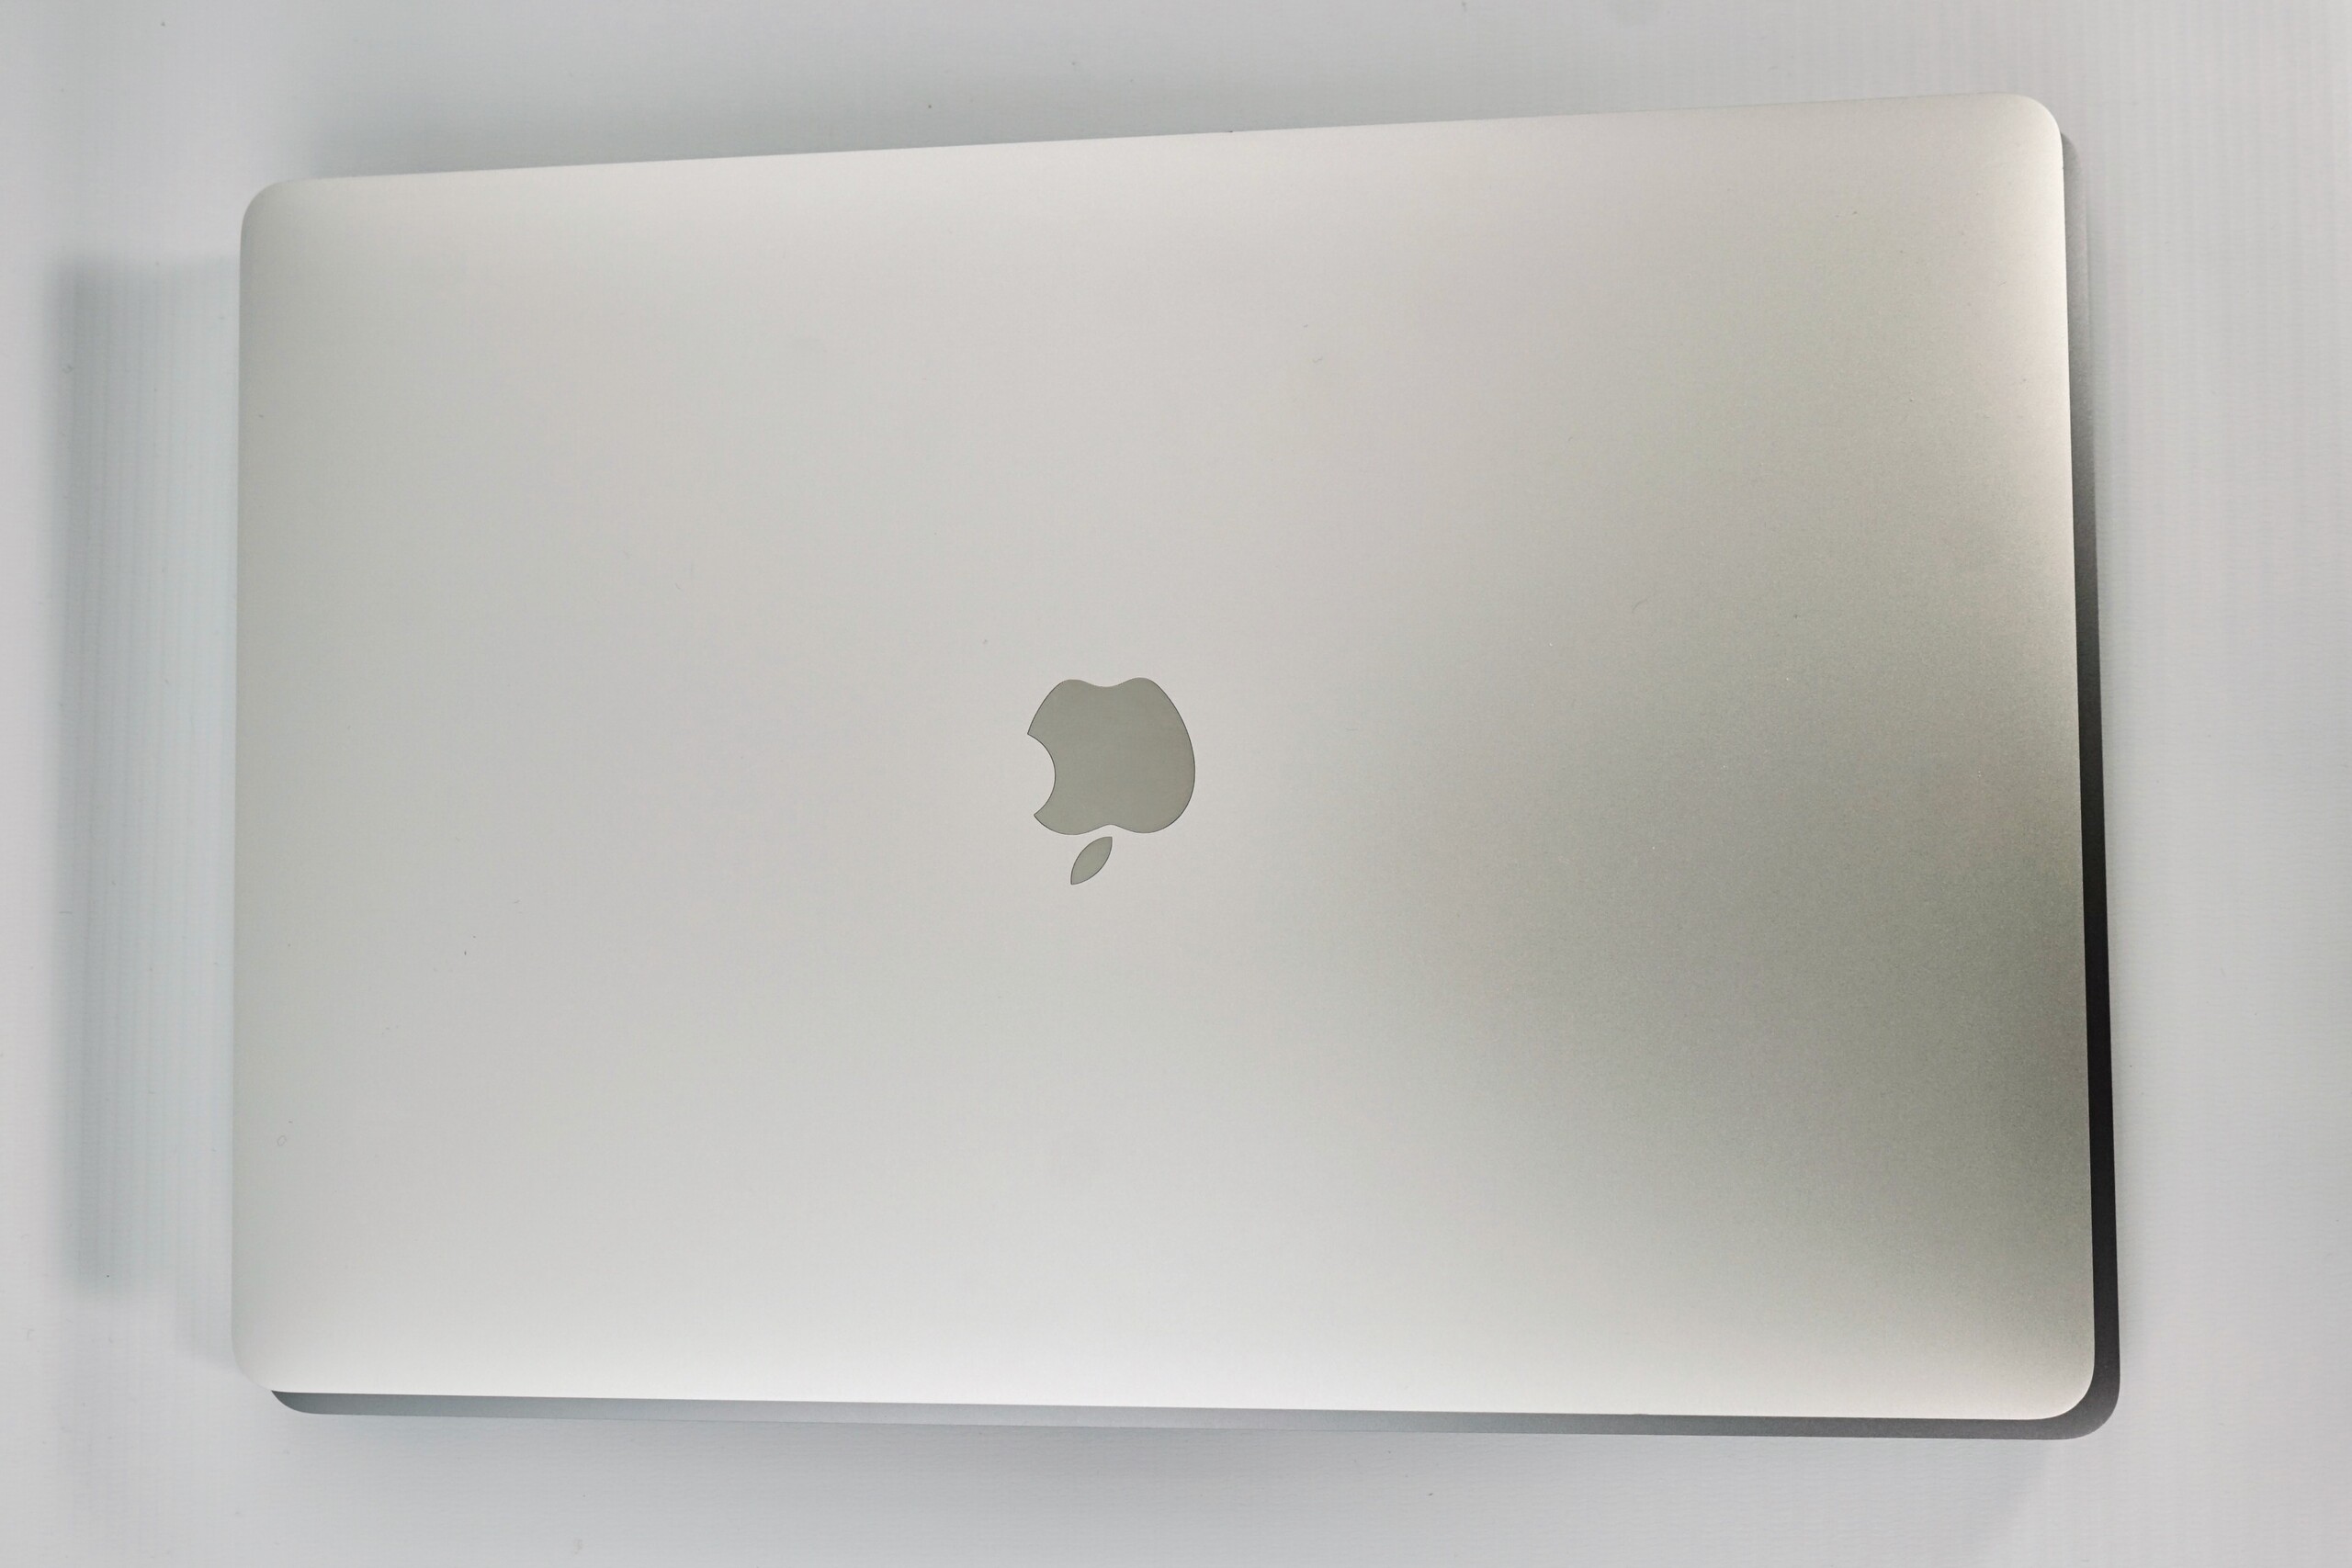
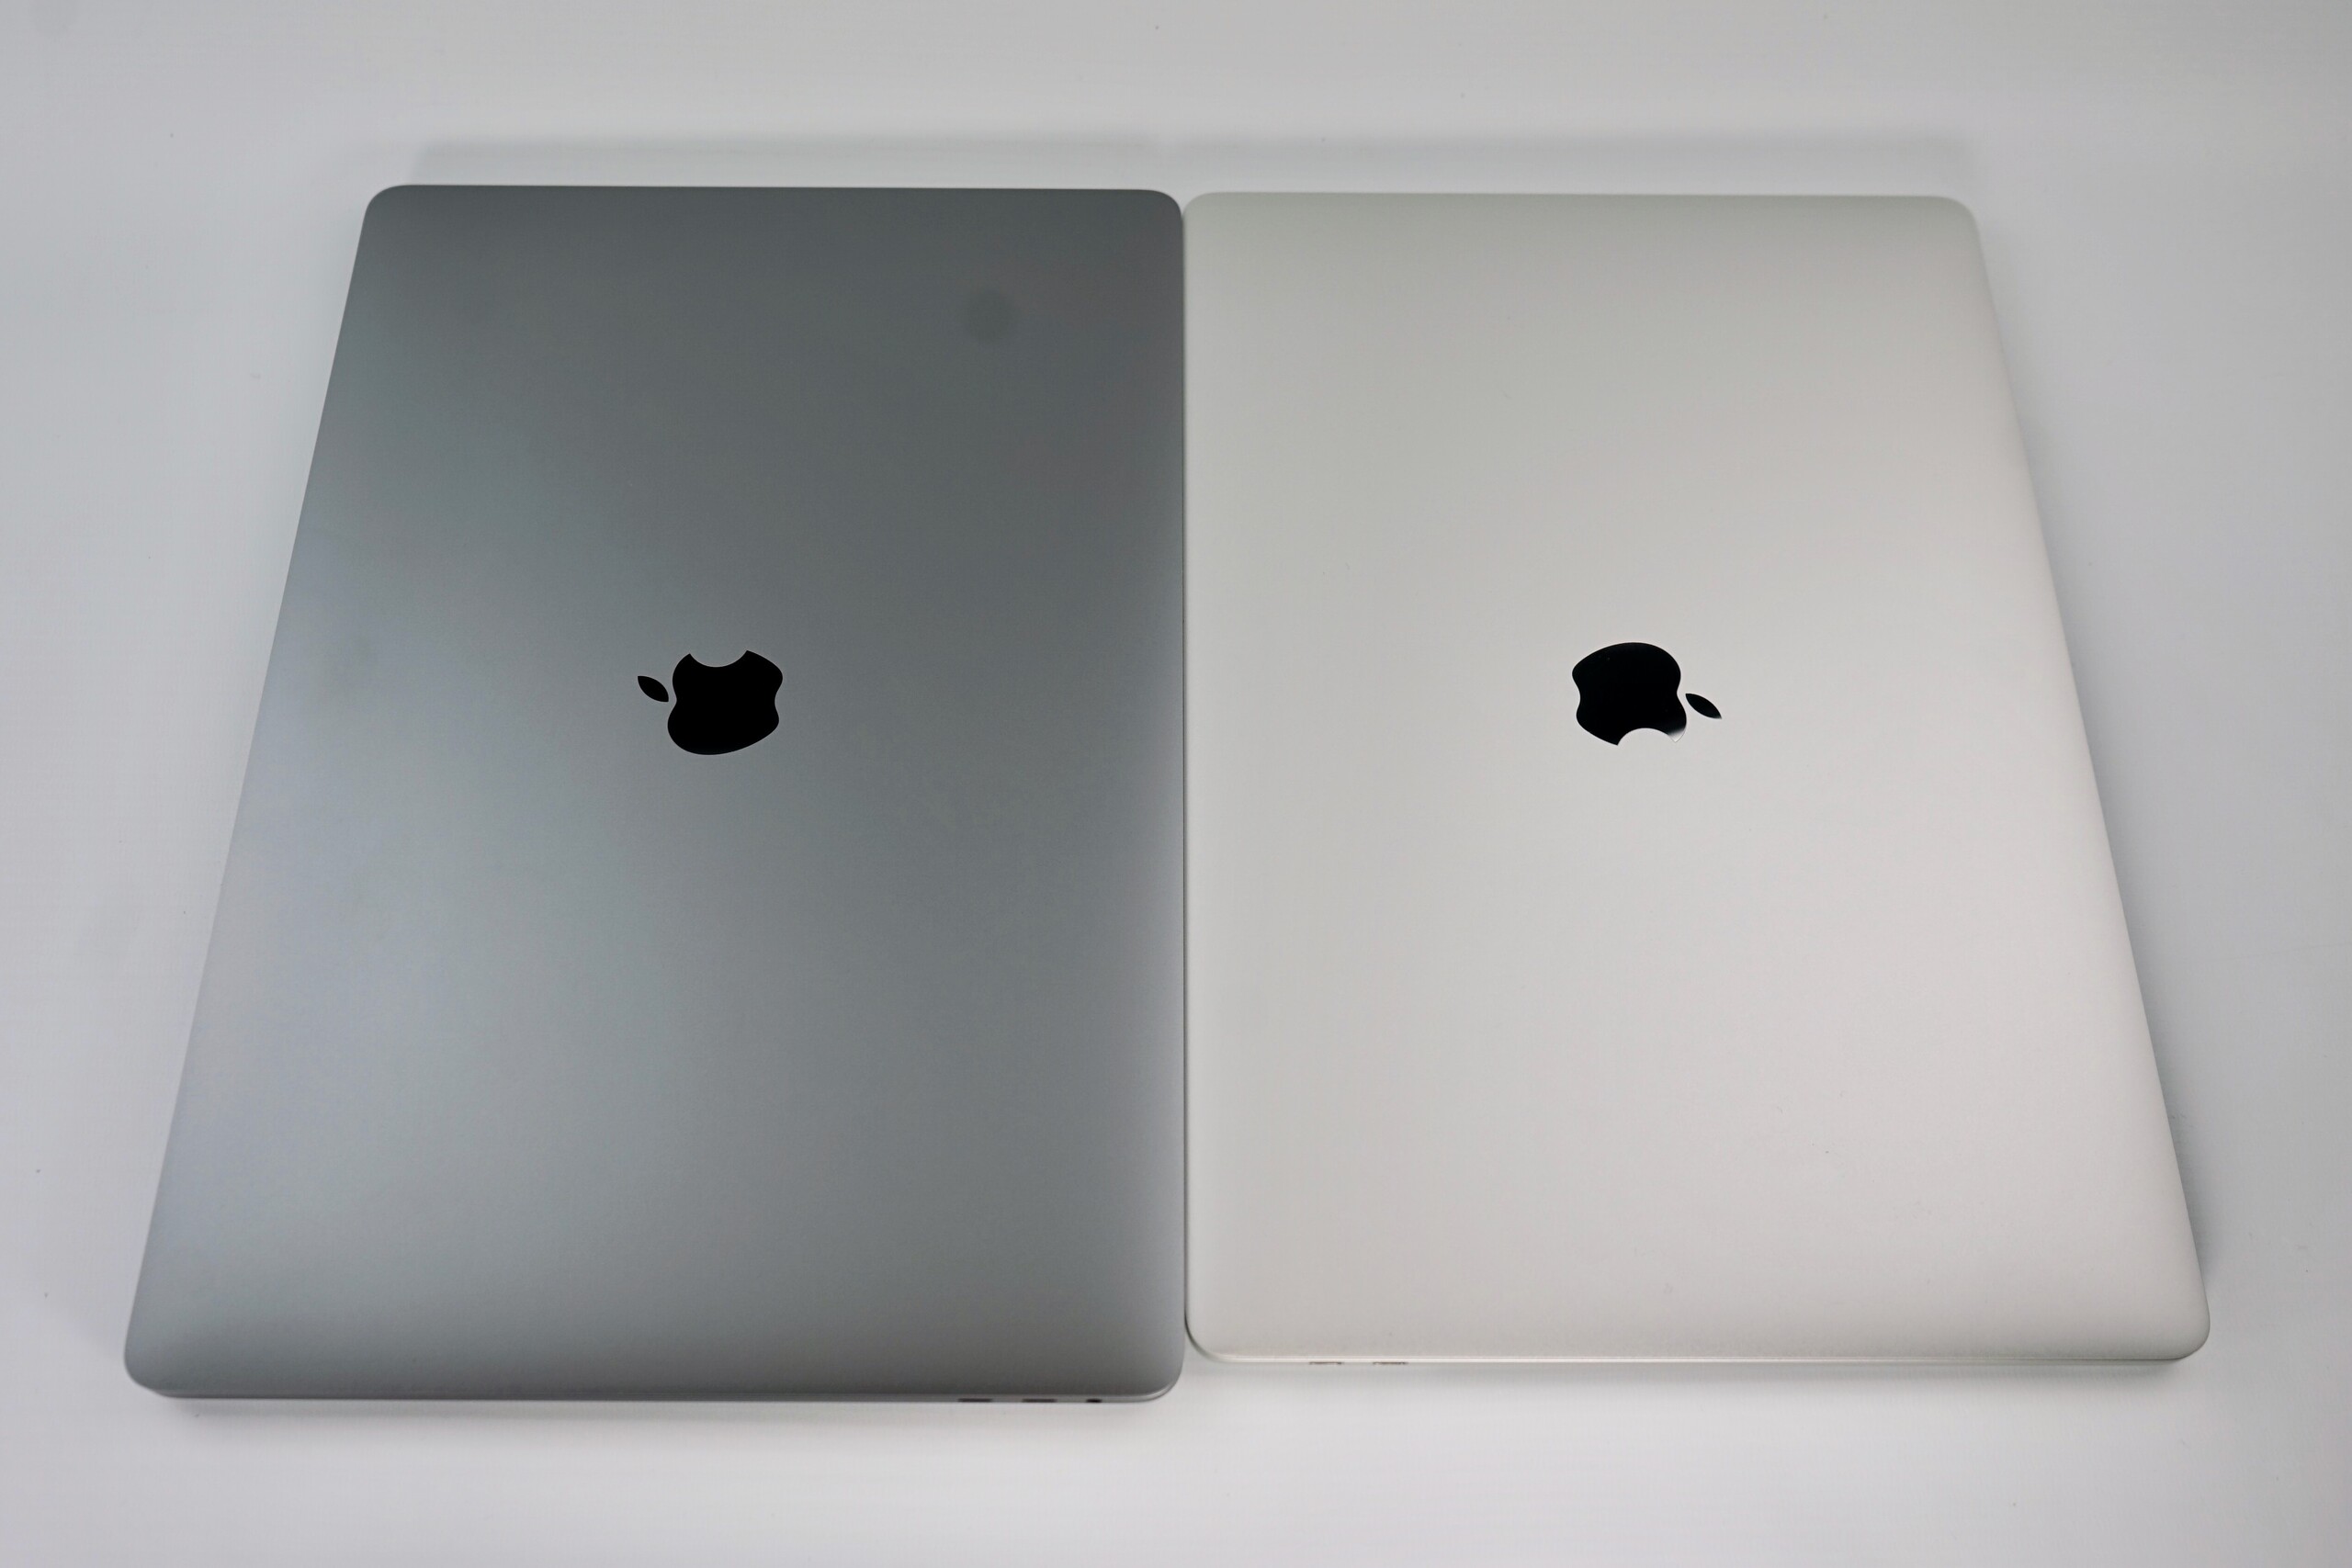
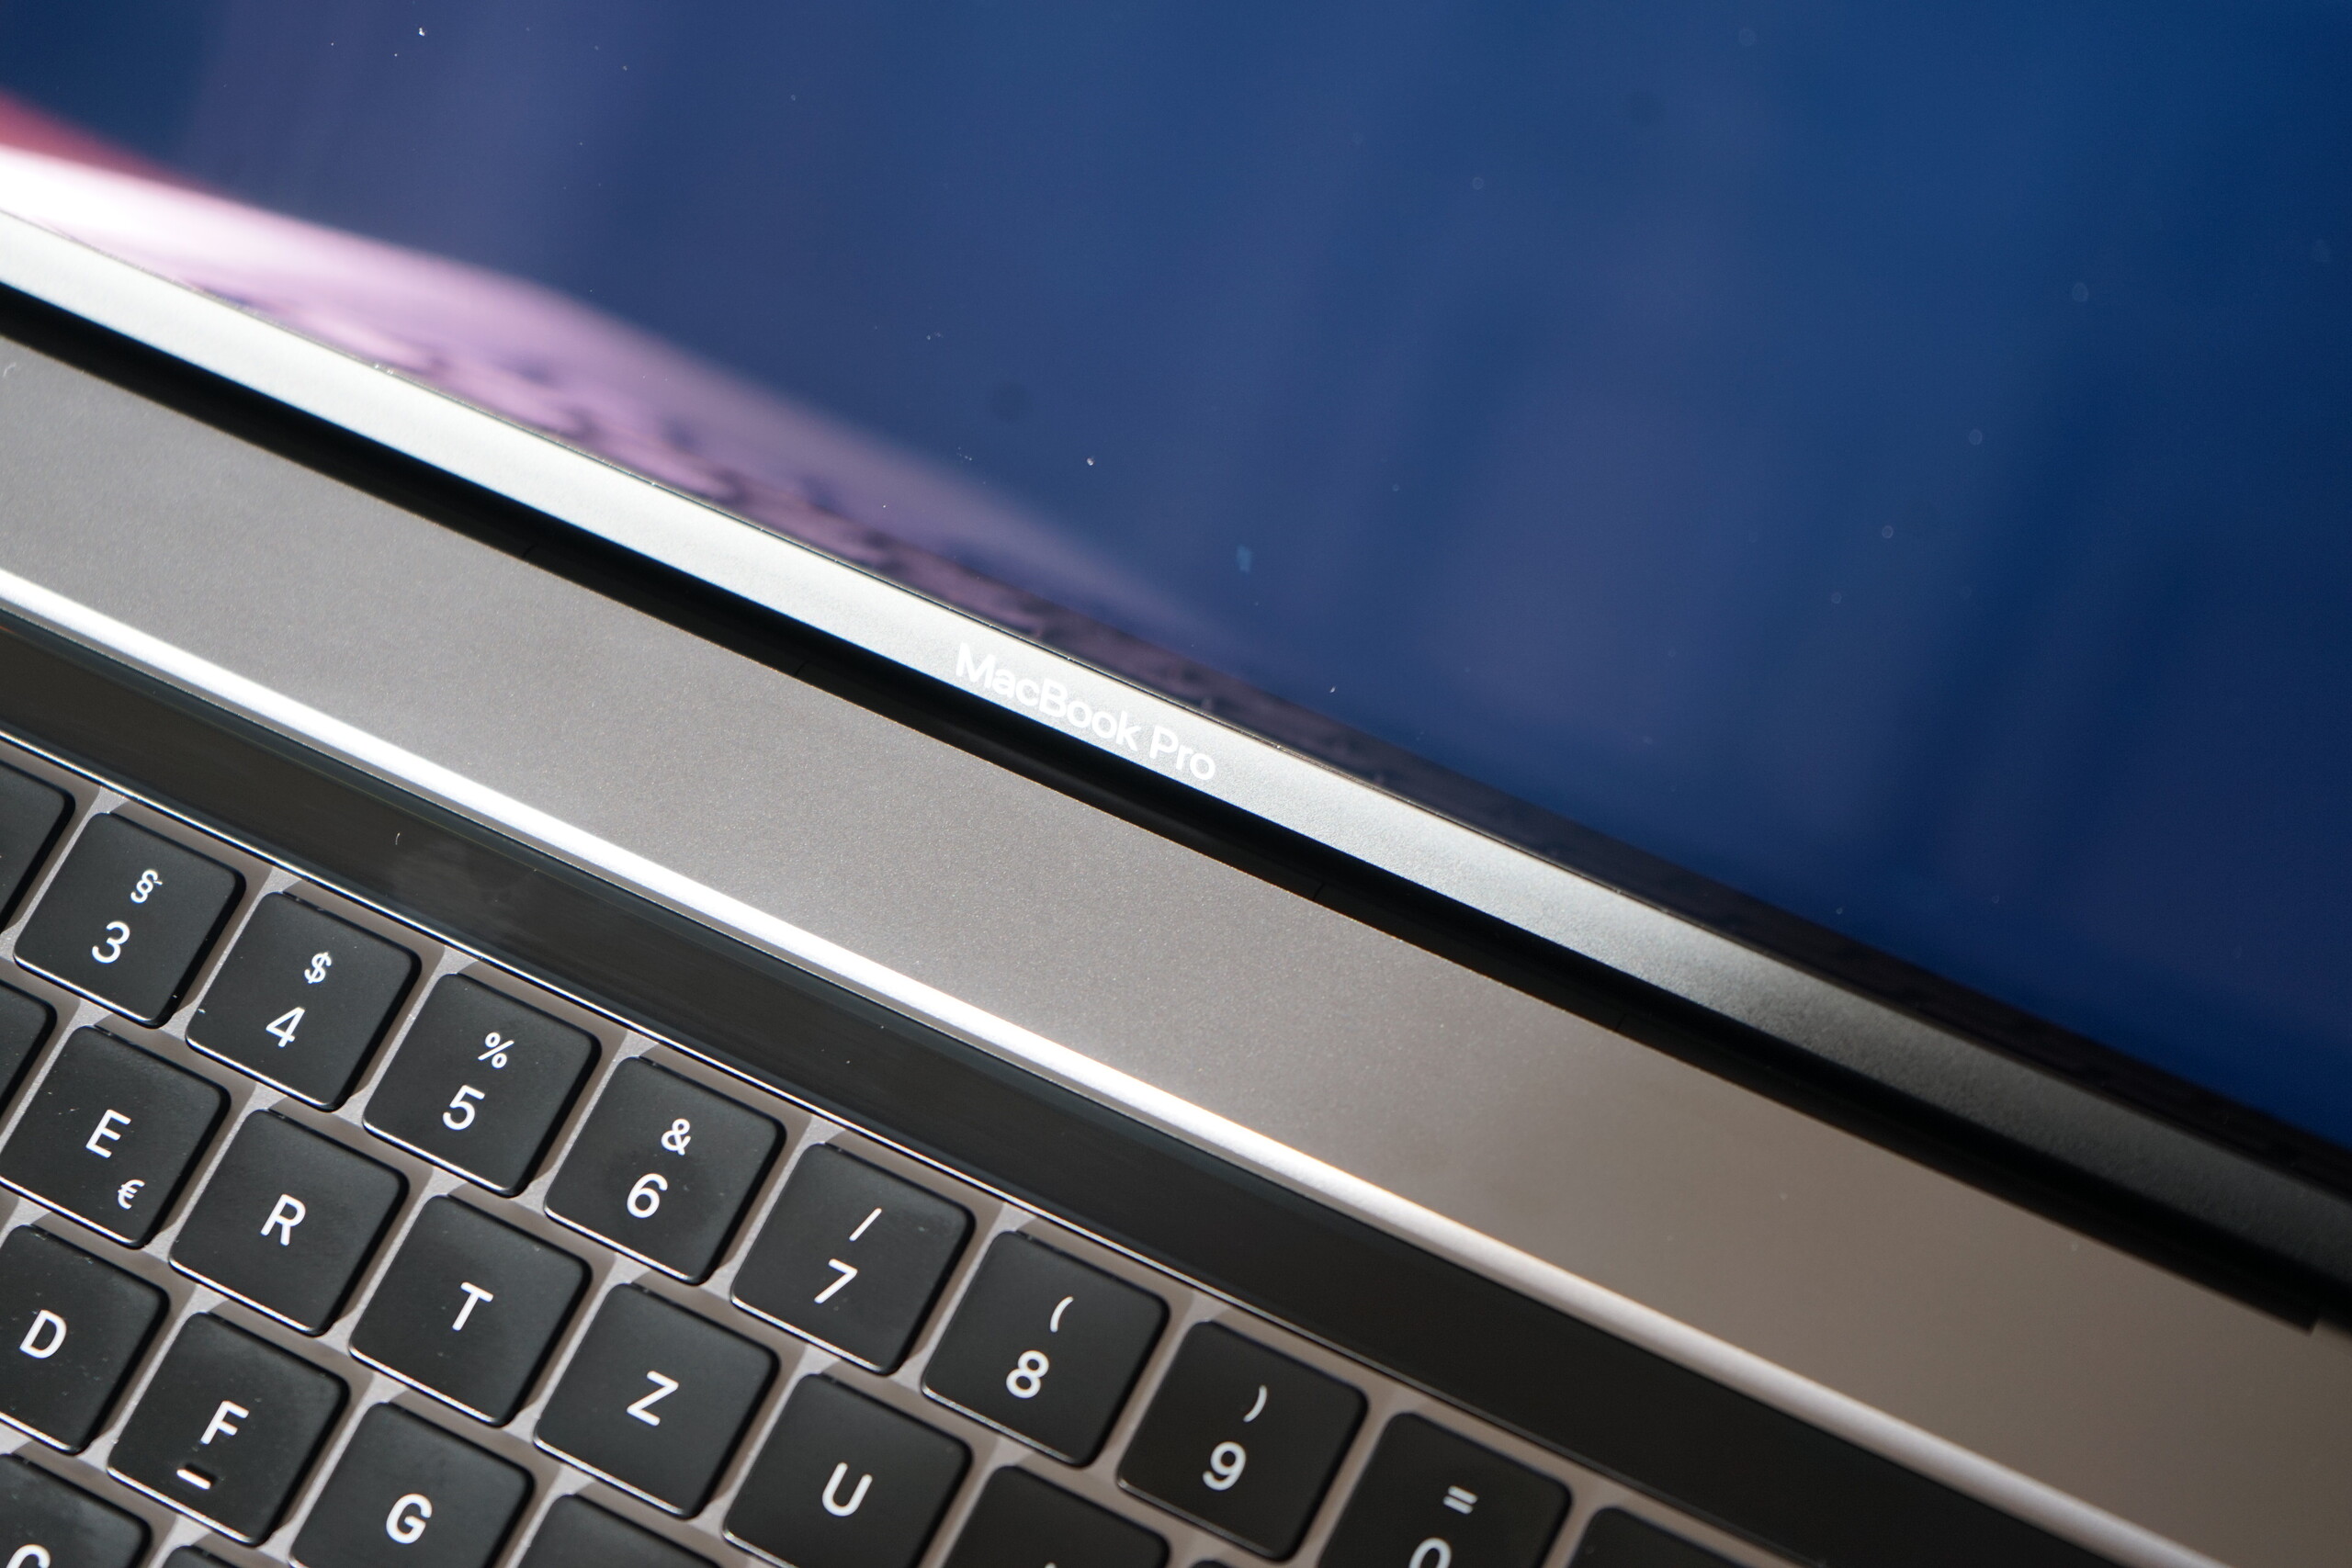
While the larger screen and higher-capacity battery necessitates using a thicker chassis, the basic design of the MacBook Pro has not changed. The MacBook Pro 16 looks so much like its predecessor, in our opinion, that it would be difficult to tell the two apart unless they are side-by-side. While the MacBook Pro 16 has slightly narrower display bezels than the MacBook Pro 15 too, Apple is still yet to adopt high screen-to-body ratios in its laptops. Apple continues to offer its largest MacBook Pro in Silver and Space Gray.
Furthermore, the MacBook Pro name remains synonymous with excellent craftsmanship and build quality. The aluminium case makes the MacBook Pro 16 feel premium, while its finish does not pick up fingerprints as easily as some plastic surfaces on its competitors do. We are looking at you, the Dell XPS 15 7590 and the Lenovo ThinkPad X1 Extreme Gen 2.
Overall, our review unit is sturdy, as we could not deform the chassis despite our best efforts. Likewise, the chassis is rigid, as is its display hinge. The display can be opened with one hand and also does not wobble when typing. The hinge allows the display to be opened to about 135° too, the same angle to which the most recent MacBook Pro 15 can be opened.
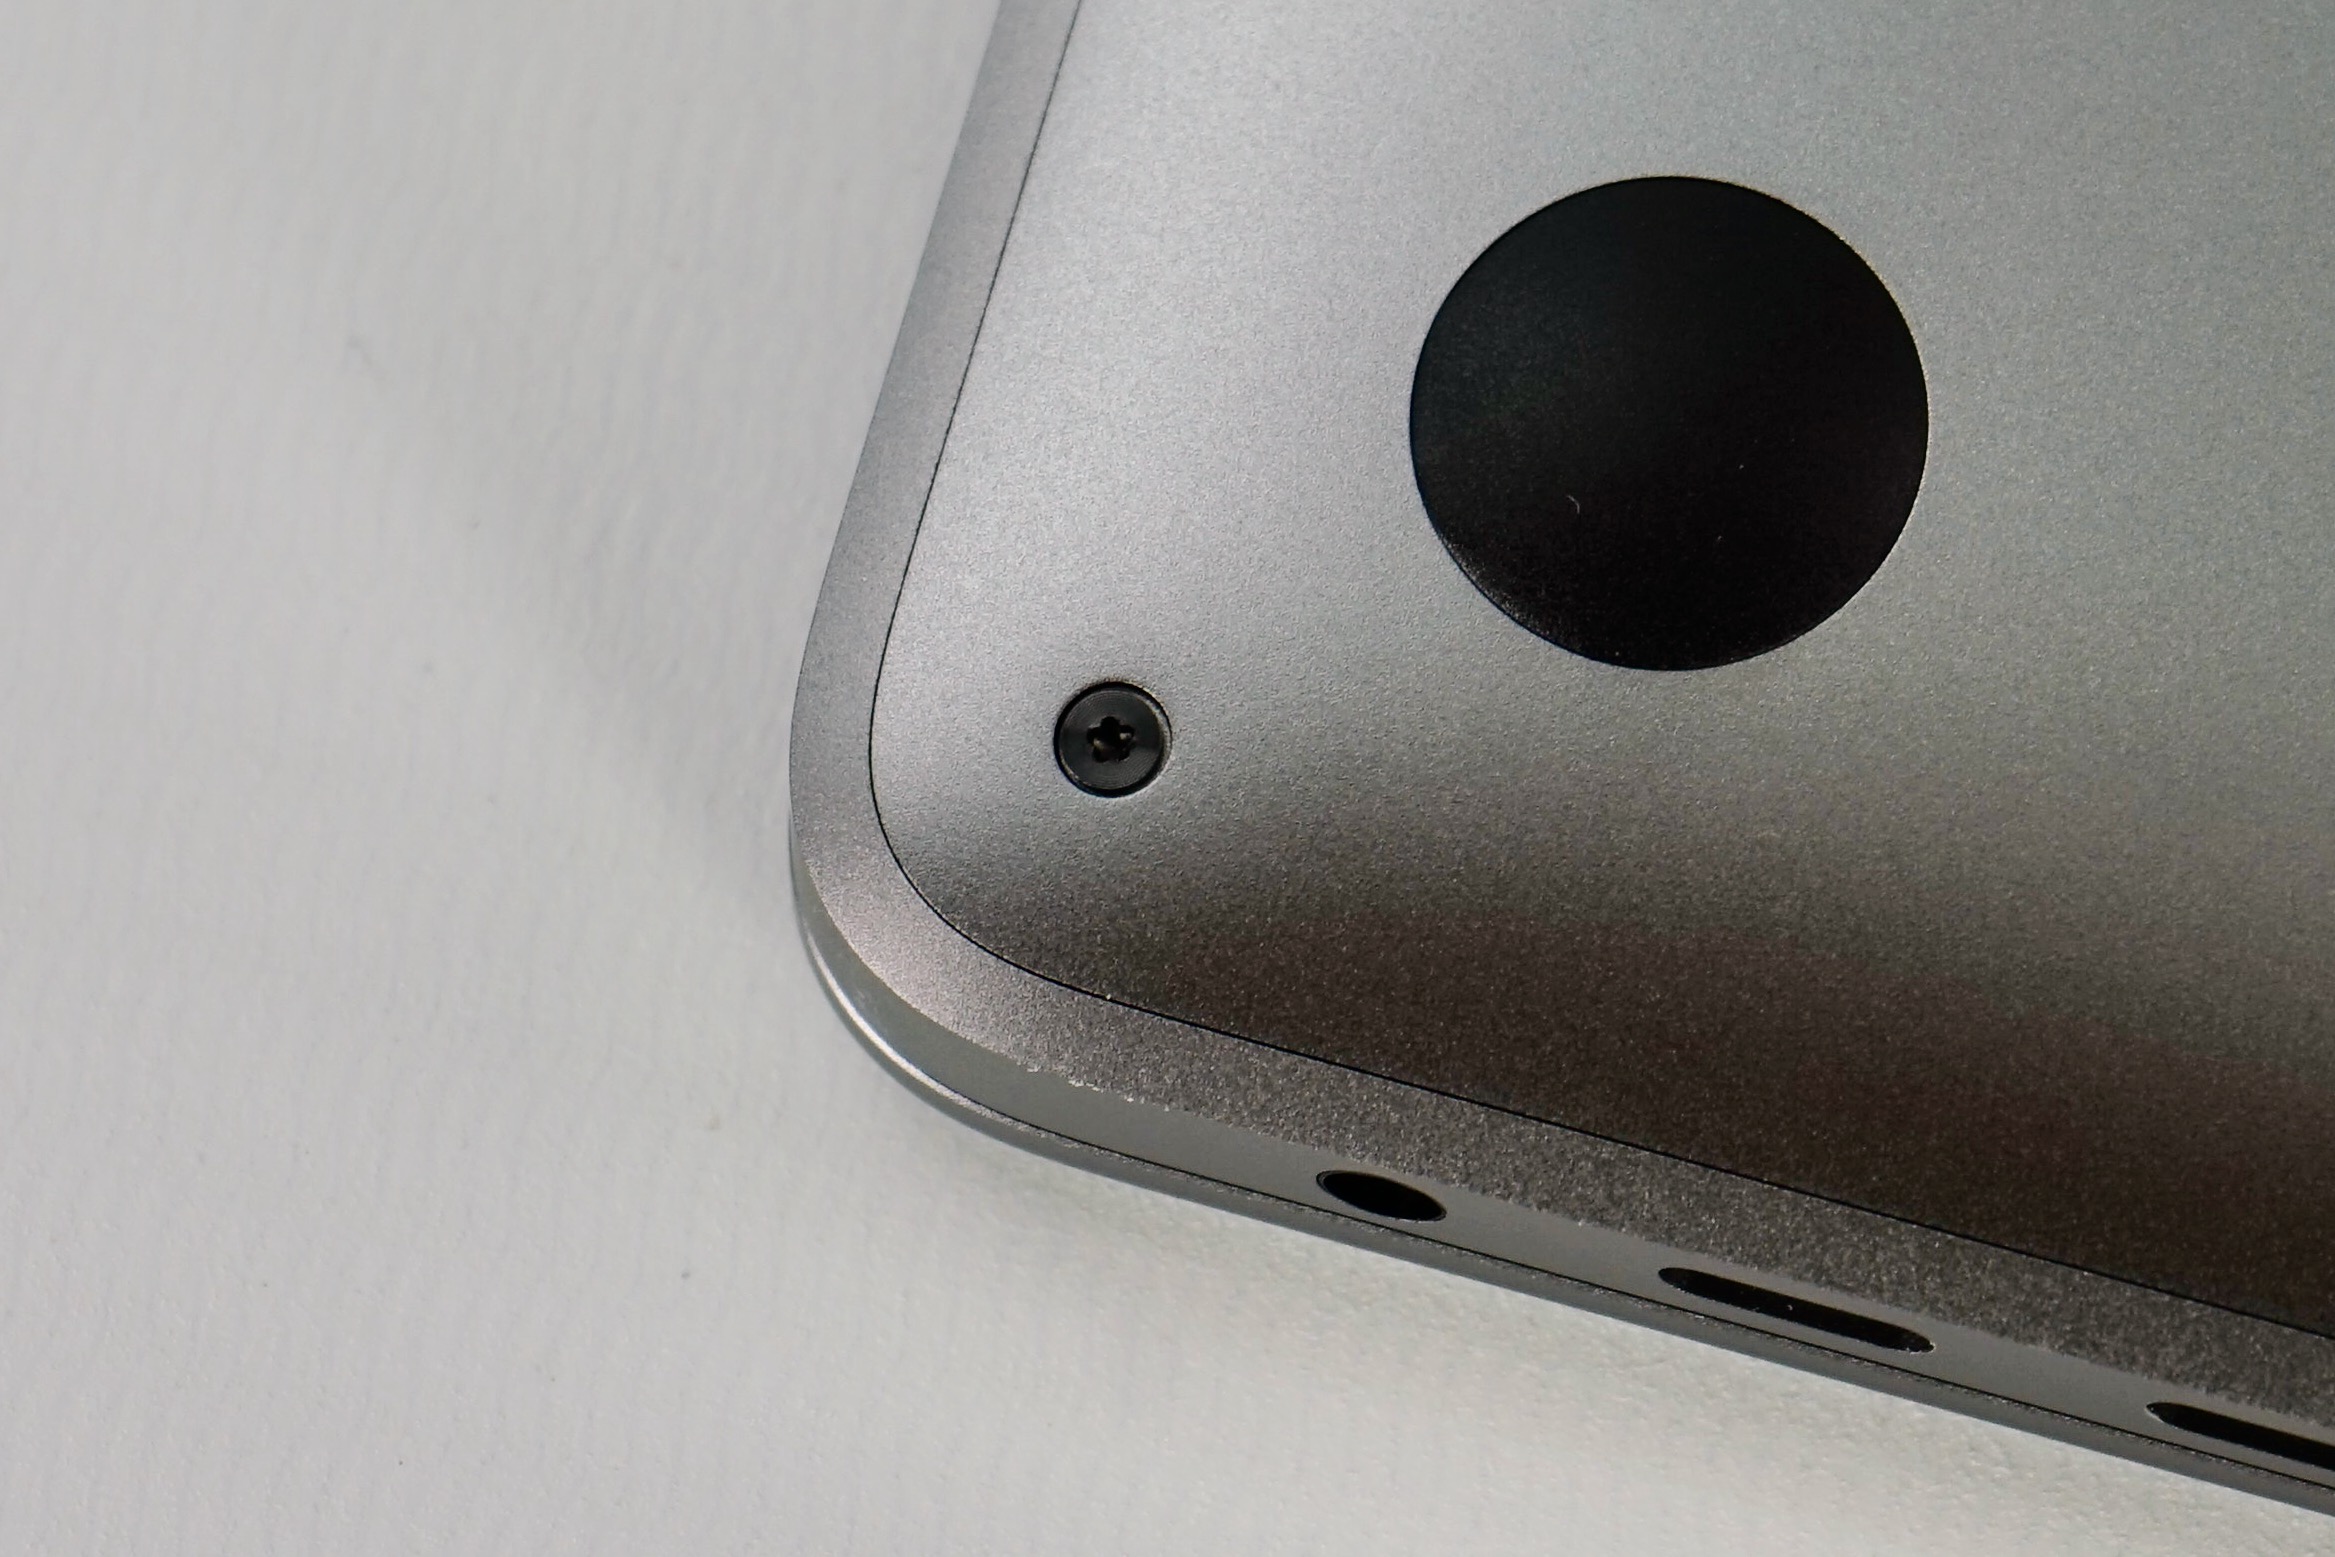
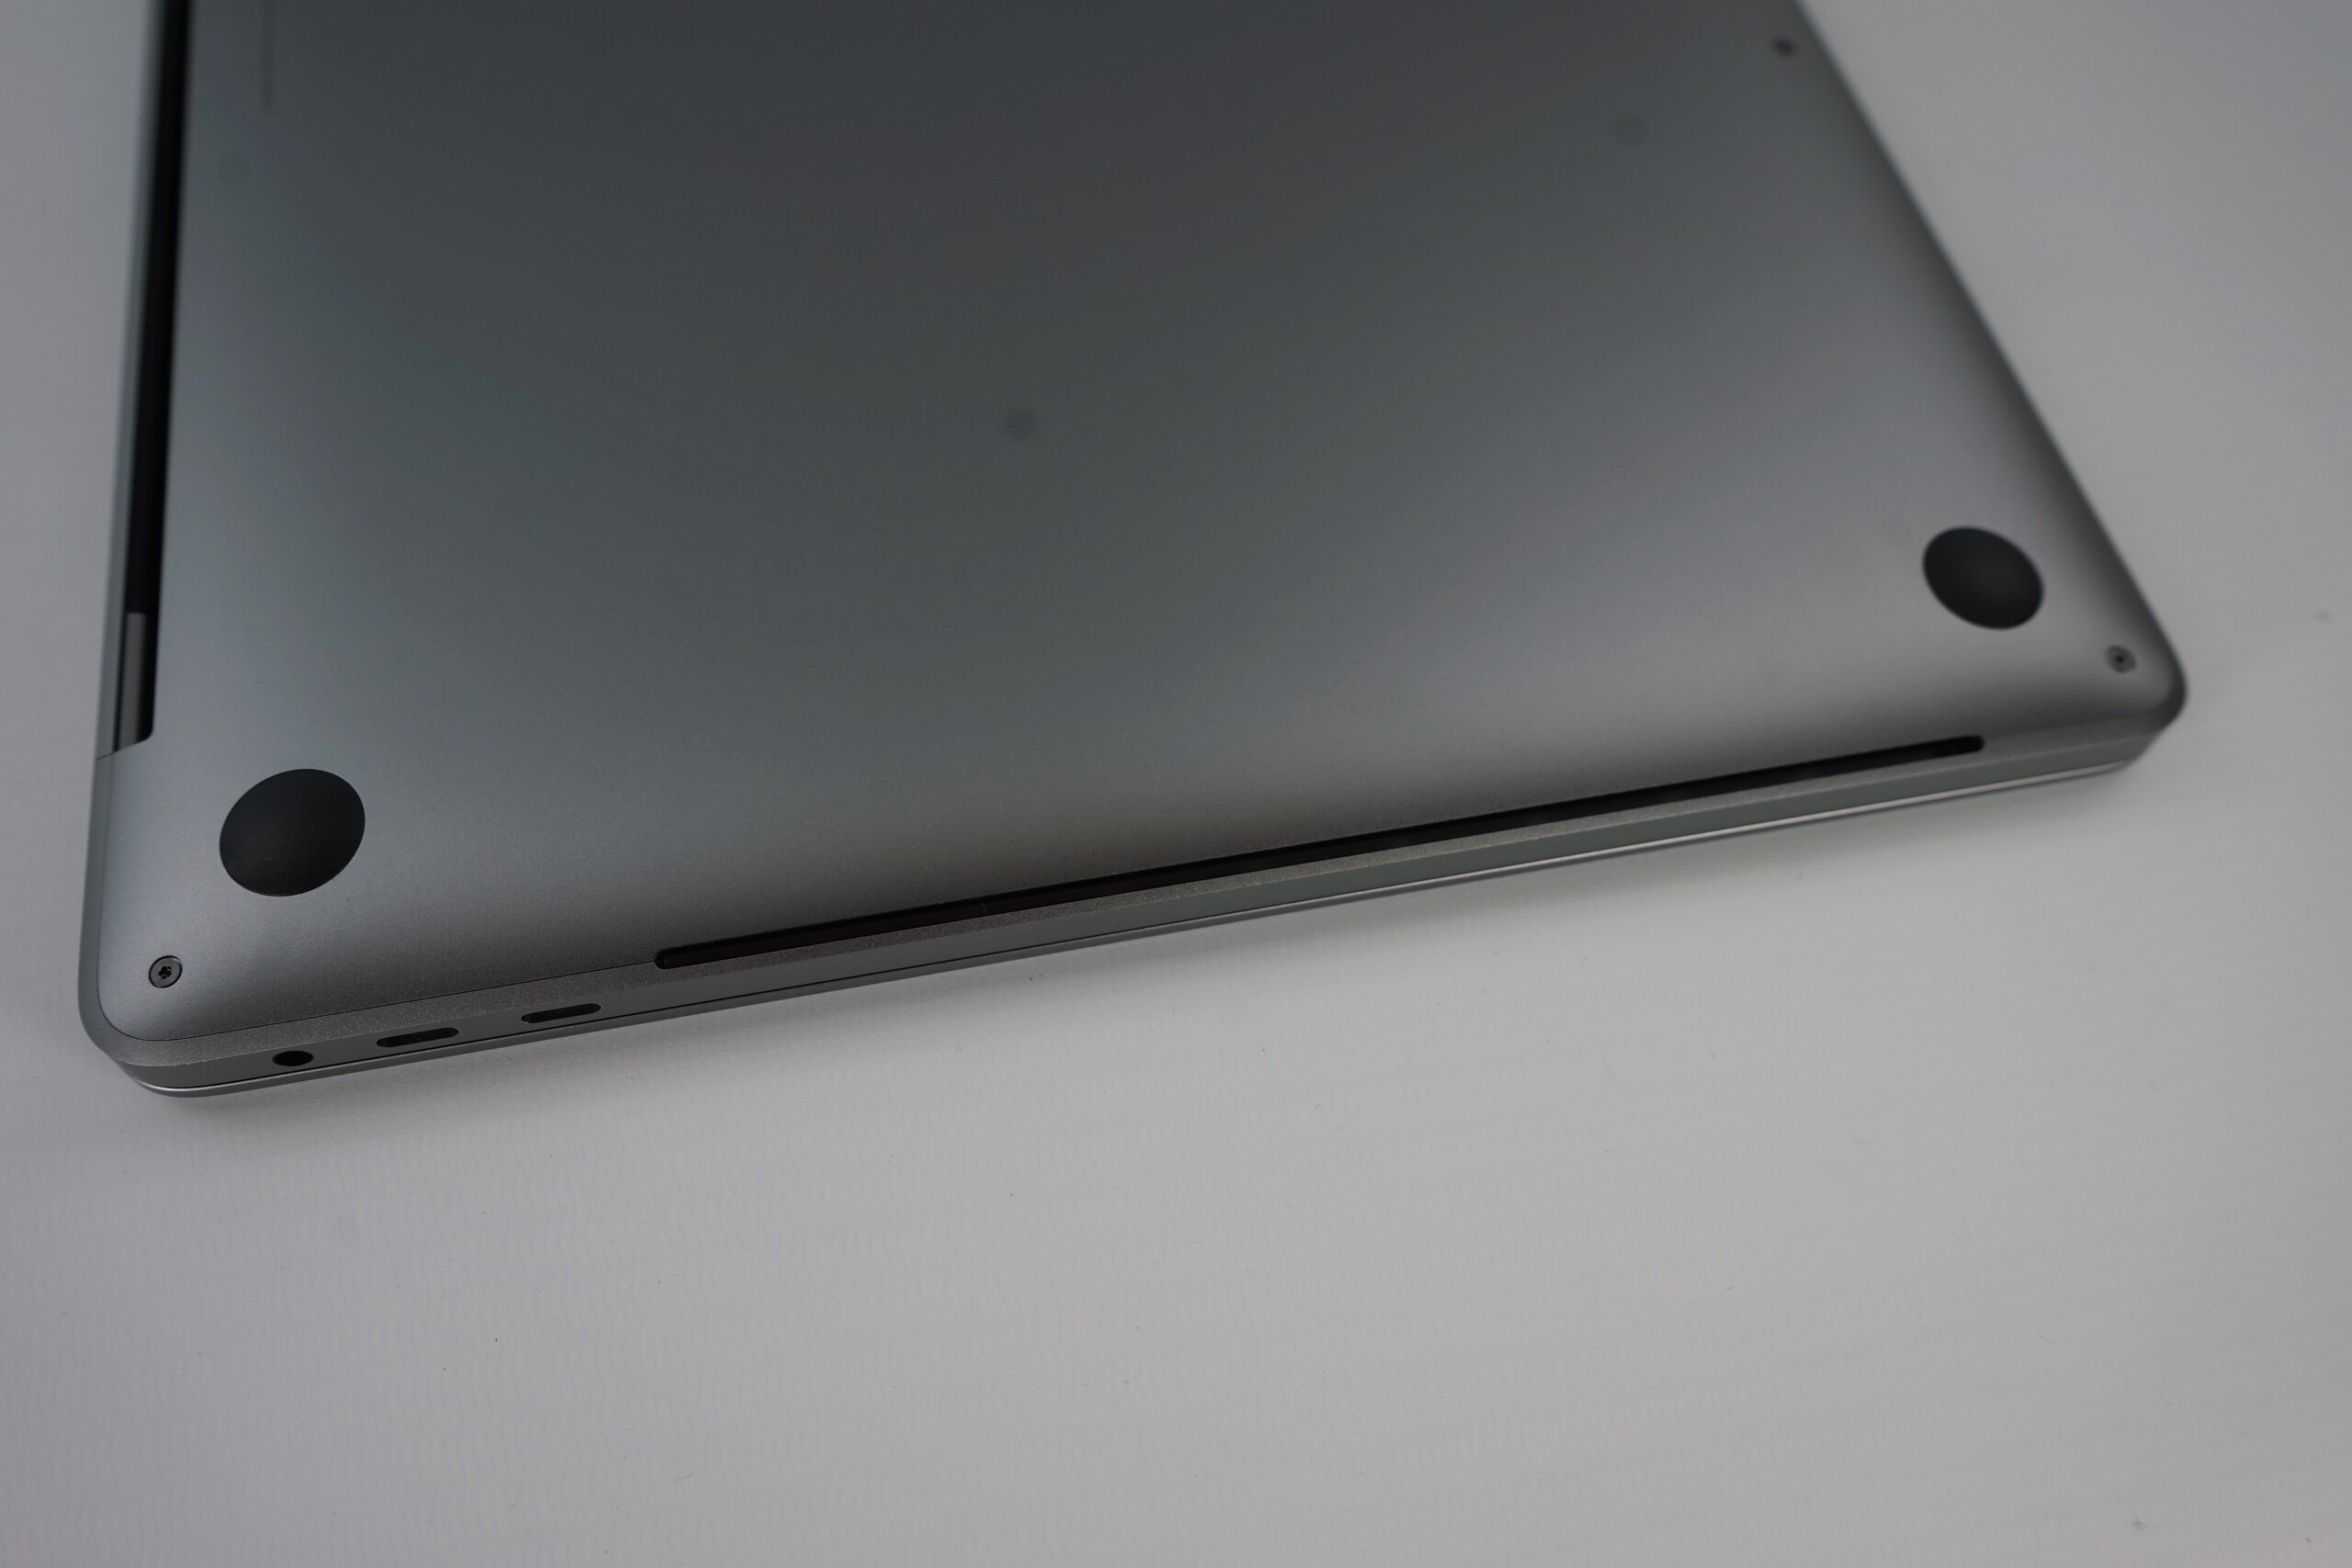

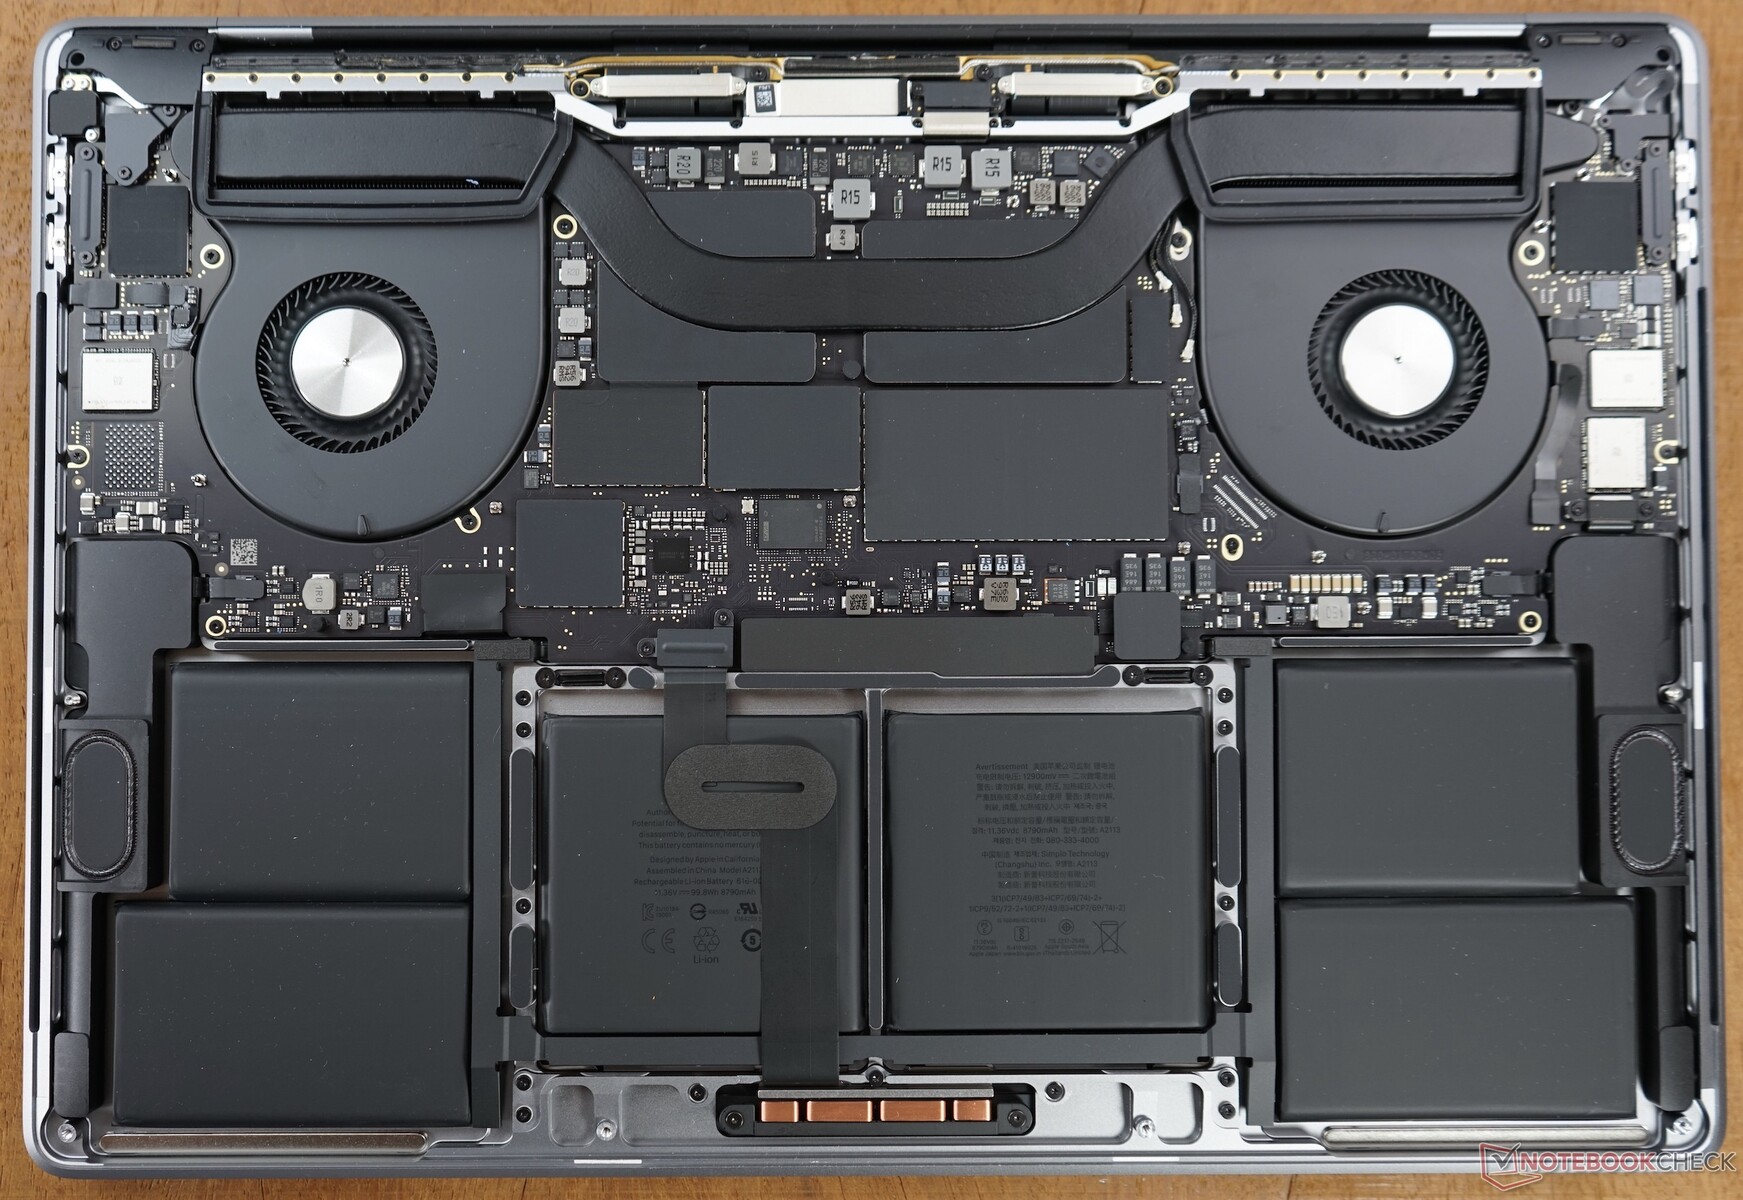
Apple continues to use proprietary Pentalobe screws on its latest MacBook Pro 16. These secure the bottom case to the chassis but are easy to remove with the right screwdriver. While we would recommend taking care when you remove the bottom case, there is hardly any point in doing so. Virtually all important components are either soldered to the logic board or are glued to the chassis. As we discussed recently, it is important to note that the bottom case is not only screwed and clipped to the chassis. Apple also hooks the bottom case to the chassis, so you must only pull the former away from the latter in a specific way. Apple has been doing this for a few years now, but it may be new for you if the MacBook Pro 16 is the first MacBook that you have bought in a few years. Incidentally, iFixit has already disassembled the new MacBook Pro and has awarded it 1/10 for repairability. The only positive is how simple it is to remove the trackpad.
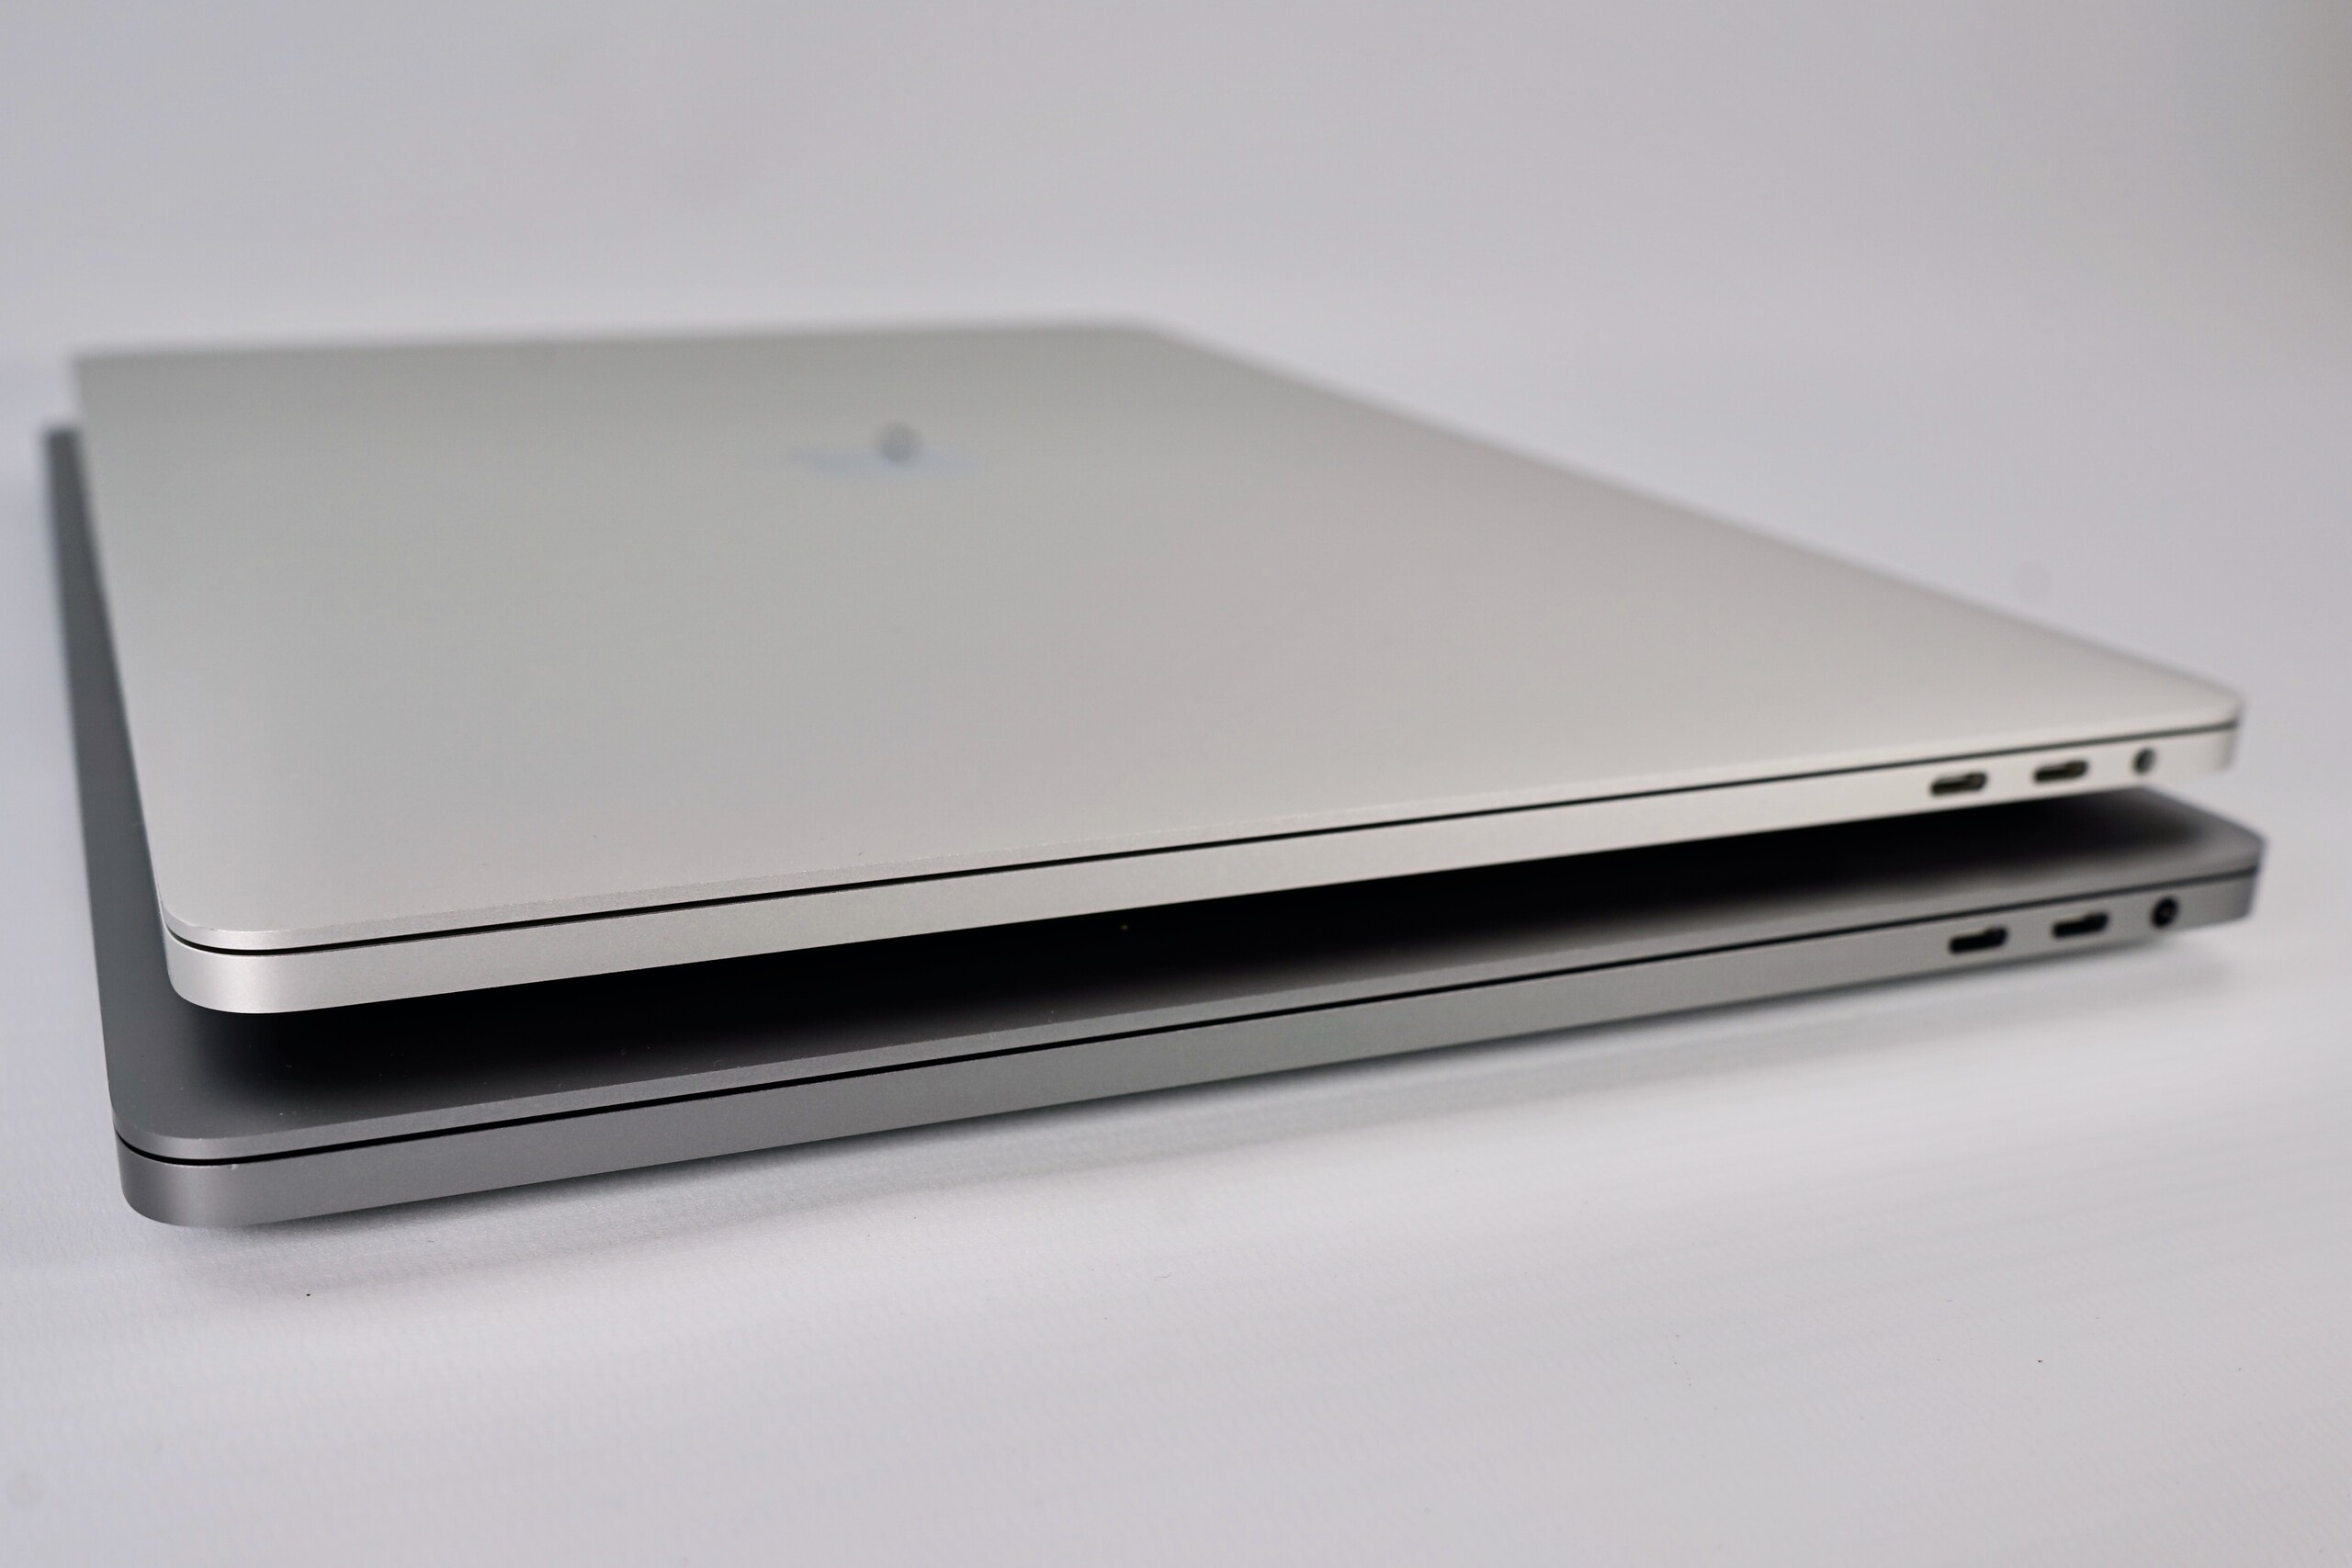
Size Comparison
The MacBook Pro 16 is slightly larger than its predecessor in all aspects, as the graphic below demonstrates. Subjectively, we can only notice the differences between the two when we have one in each hand. While the MacBook Pro 16 is heavier than most of our comparison devices, it has a smaller footprint than all but the Dell XPS 15 7590.
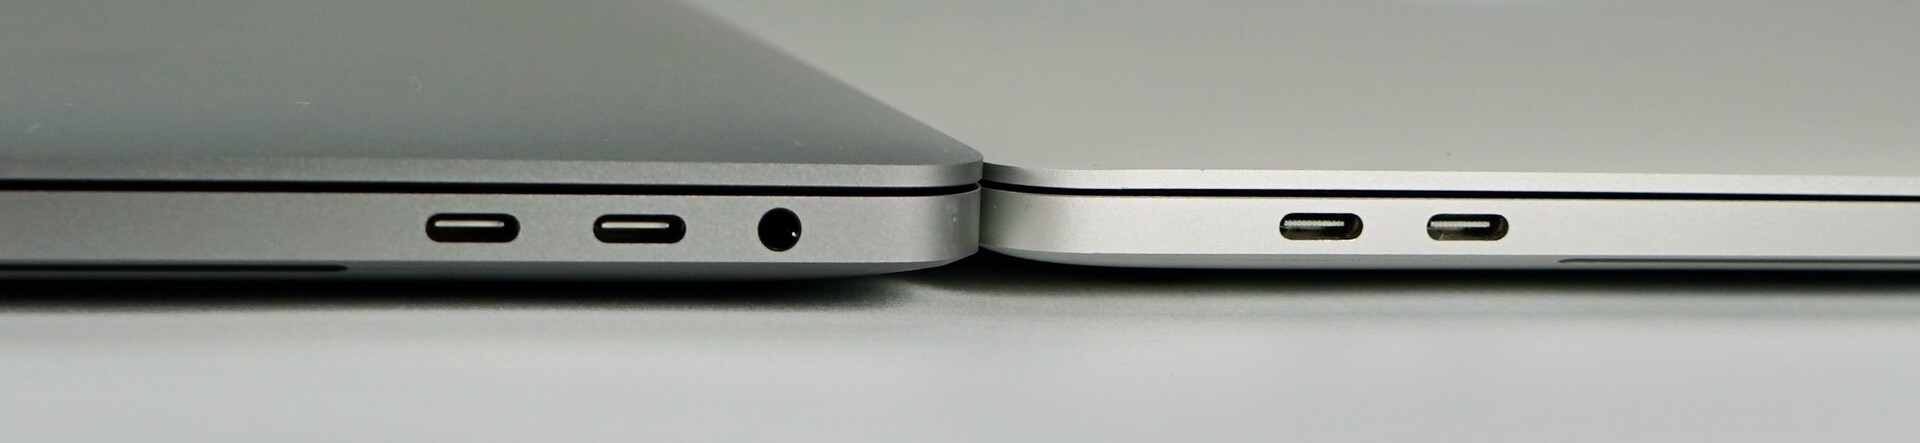
Connectivity - Sticking with Thunderbolt 3
Anyone who expected Apple to include a wider selection of ports along with reverting to a scissor keyboard will be left disappointed. The company continues to equip its MacBook Pros with just four Thunderbolt 3 ports and a 3.5 mm jack, a far cry from the volume and versatility of ports that its competitors offer. Thunderbolt 3 ports are versatile themselves, but you will need at least one USB Type-C dongle if you want to connect an HDMI cable, for example.


Communication - no Wi-Fi 6 in this year's MacBook Pro
Somewhat surprisingly, Apple has not equipped the MacBook Pro 16 with a Wi-Fi 6 modem (802.11ax). Instead, the company has opted for a Wi-Fi 5 Broadcom modem. Historically, MacBooks have offered some of the best Wi-Fi performance around, but the ThinkPad X1 Extreme Gen 2 embarrasses the MacBook Pro 16. A starting price of US$2,399 makes the lack of Wi-Fi 6 connectivity even more disappointing, in our opinion. Apple continues to refuse to offer WWAN connectivity even as an option too. Hence, you must tether your smartphone if you need a network connection with no Wi-Fi around. Doing so is not always practical, so the lack of WWAN connectivity feels like a missed opportunity.
The Wi-Fi module in our review unit did not convince us in our Wi-Fi tests, either. The MacBook Pro 16 dropped connection every time we ran iperf3 Client, for some reason. The first few seconds of the multiple tests that we ran show that the MacBook Pro 16 fluctuates between 600 and 800 Mb/s, putting it on par with its predecessor. However, the MacBook Pro 15 had no issues with running iperf3 Client on macOS Catalina.
We replicated this behaviour with the Linksys EA8500, Fritz! Box 7590 and Netgear Nighthawk AX12, thereby eliminating it as a router-compatibility issue. Our review unit maintained a stable and fast Wi-Fi 5 connection with our Fritz! Box 7590 router in daily use, though. We re-ran iperf3 Client on Windows 10 running in Boot Camp, the data from which we have provided below. Incidentally, the MacBook Pro 16 maintained a more stable connection when running on Windows 10 rather than macOS.
Webcam - Still 720p, but improved microphones
Sadly, the MacBook Pro 16 has the same 720p FaceTime HD webcam as its predecessor. While it is good enough for undemanding video calls, recent iPhones offer superior front-facing cameras than the MacBook Pro 16 does. Conversely, Apple has upgraded the microphones compared to those it used in the MacBook Pro 15, which it dubs as studio worthy. We would not go that far, but they are good enough to refrain from reaching for headphones for most tasks.

Warranty
Apple includes a one-year limited warranty with the MacBook Pro 16. The warranty coverage extends to telephone support even for software problems, but other OEMs offer longer warranties with comparable laptops. Apple sells AppleCare for the MacBook Pro 16 too should you want longer warranty coverage. The extended warranty lasts for three years and costs US$449, which is absurdly expensive.
Please see our Guarantees, Return Policies & Warranties FAQ for country-specific information.
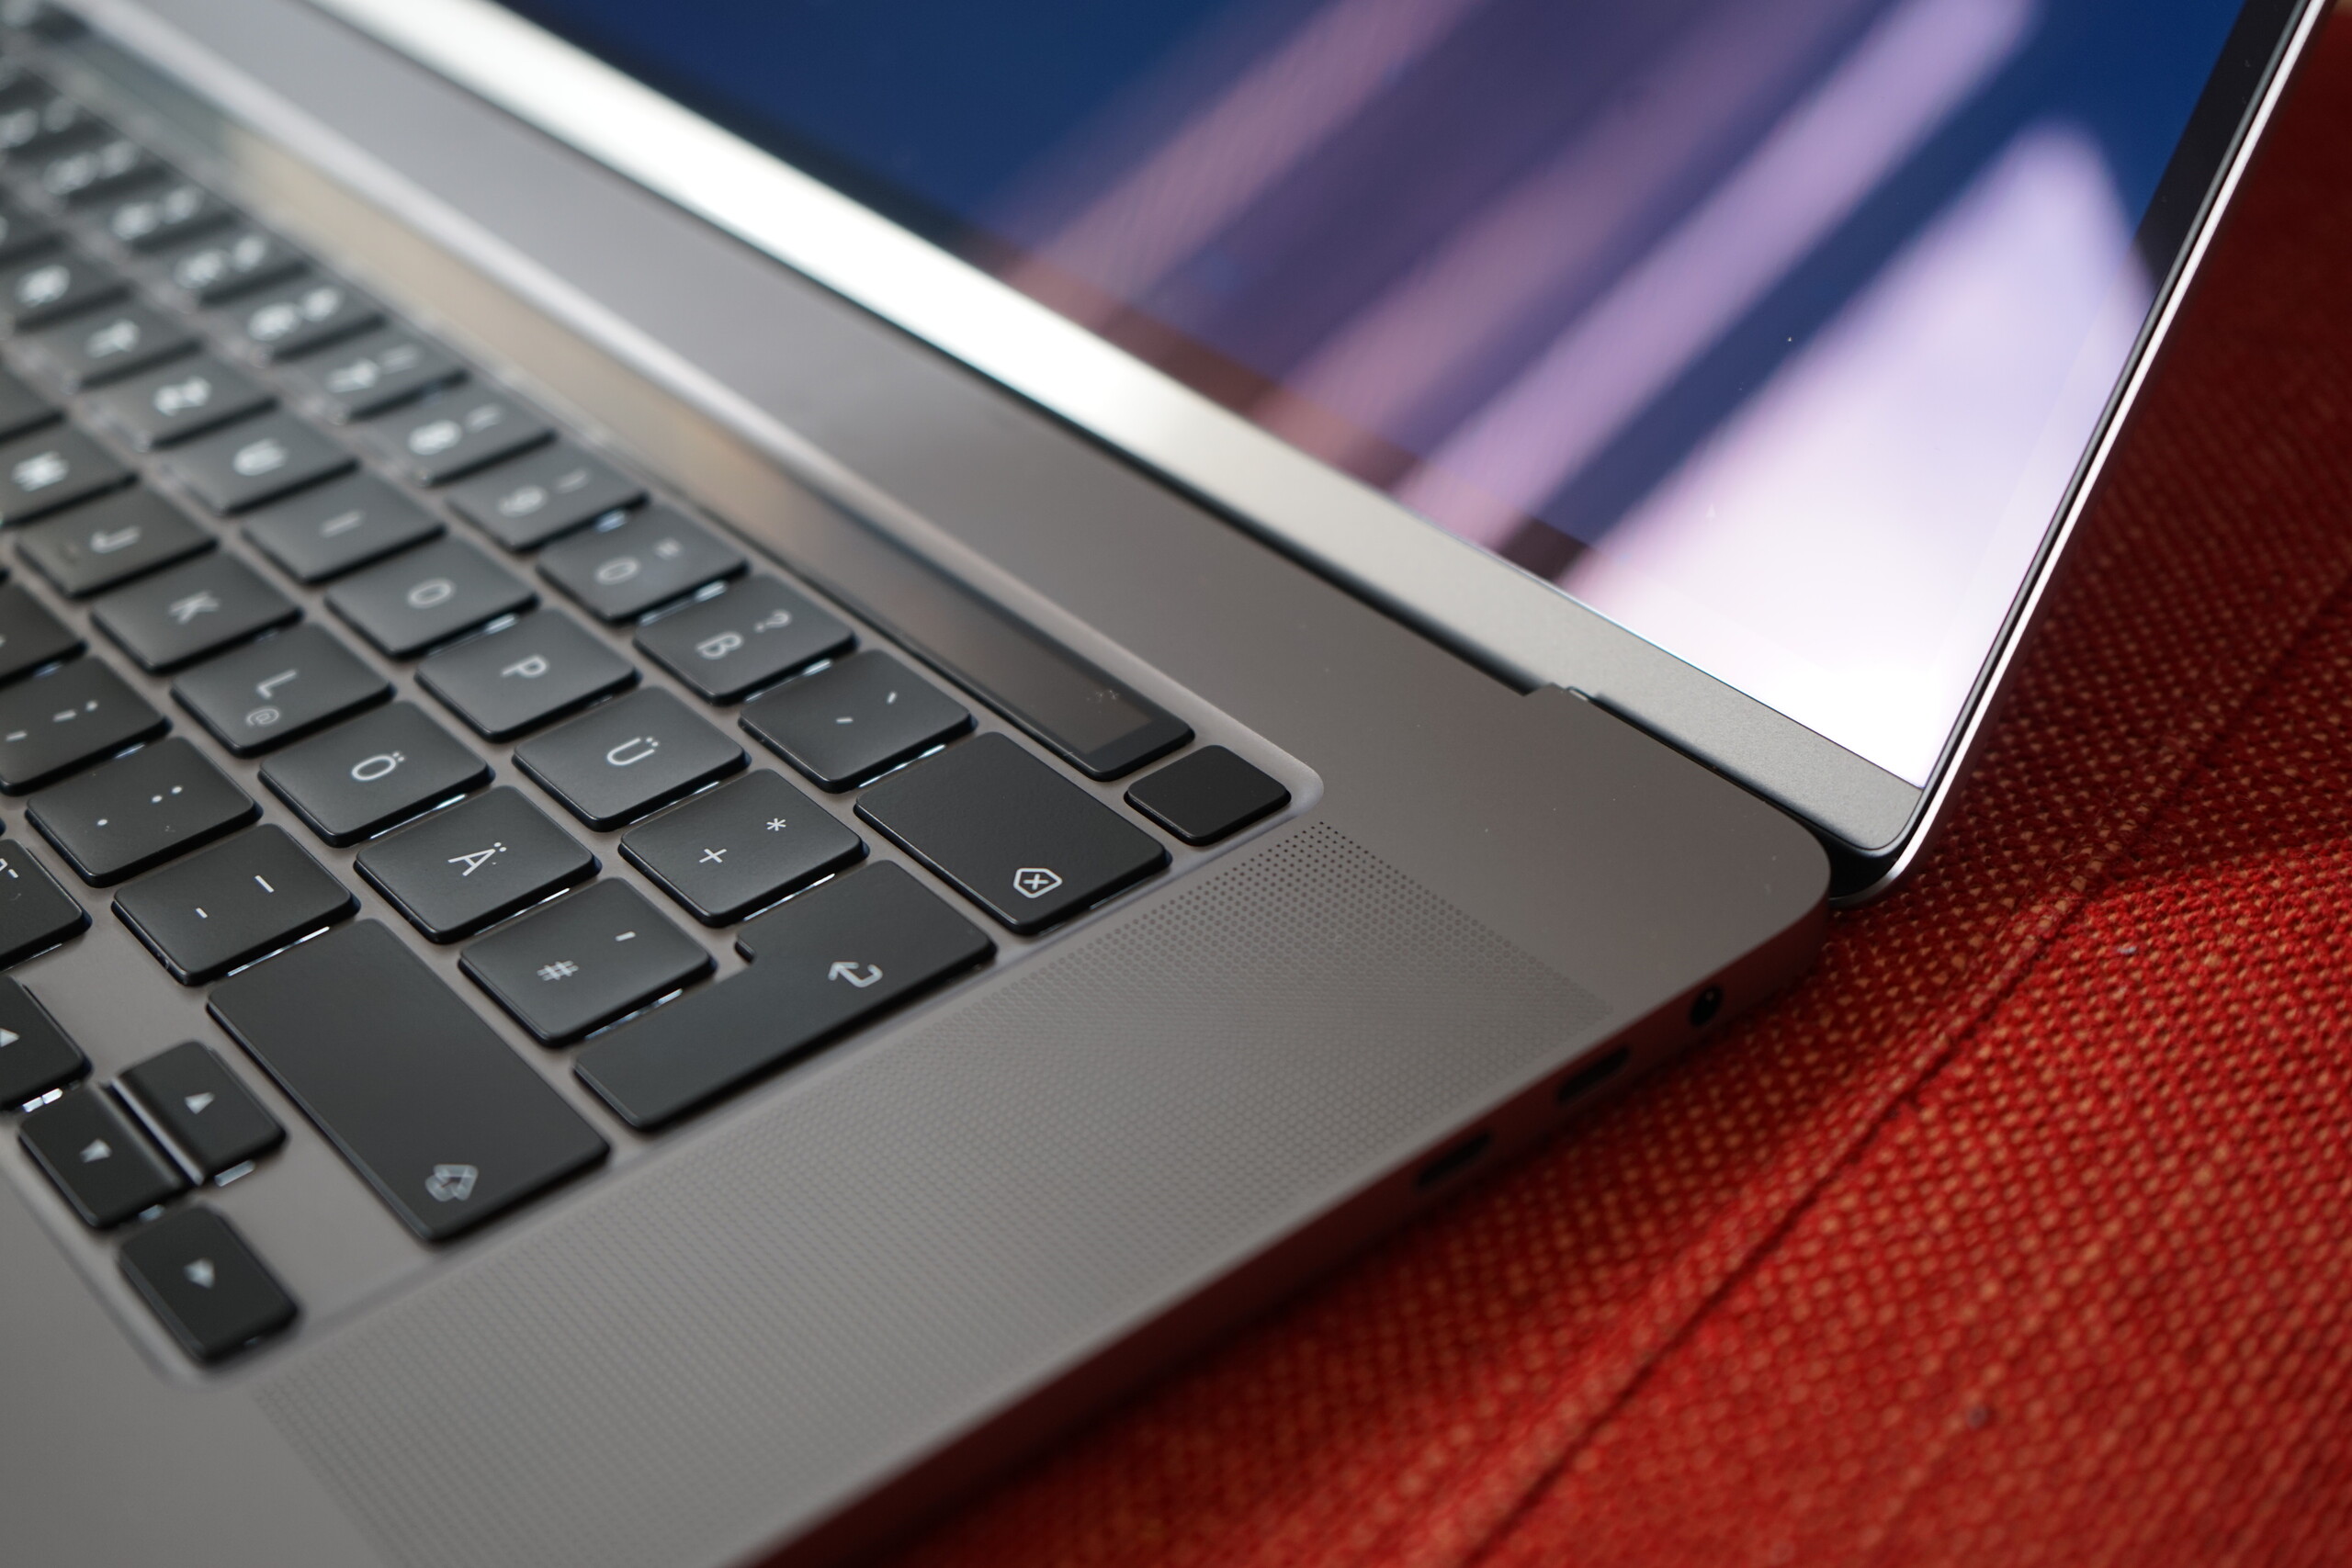
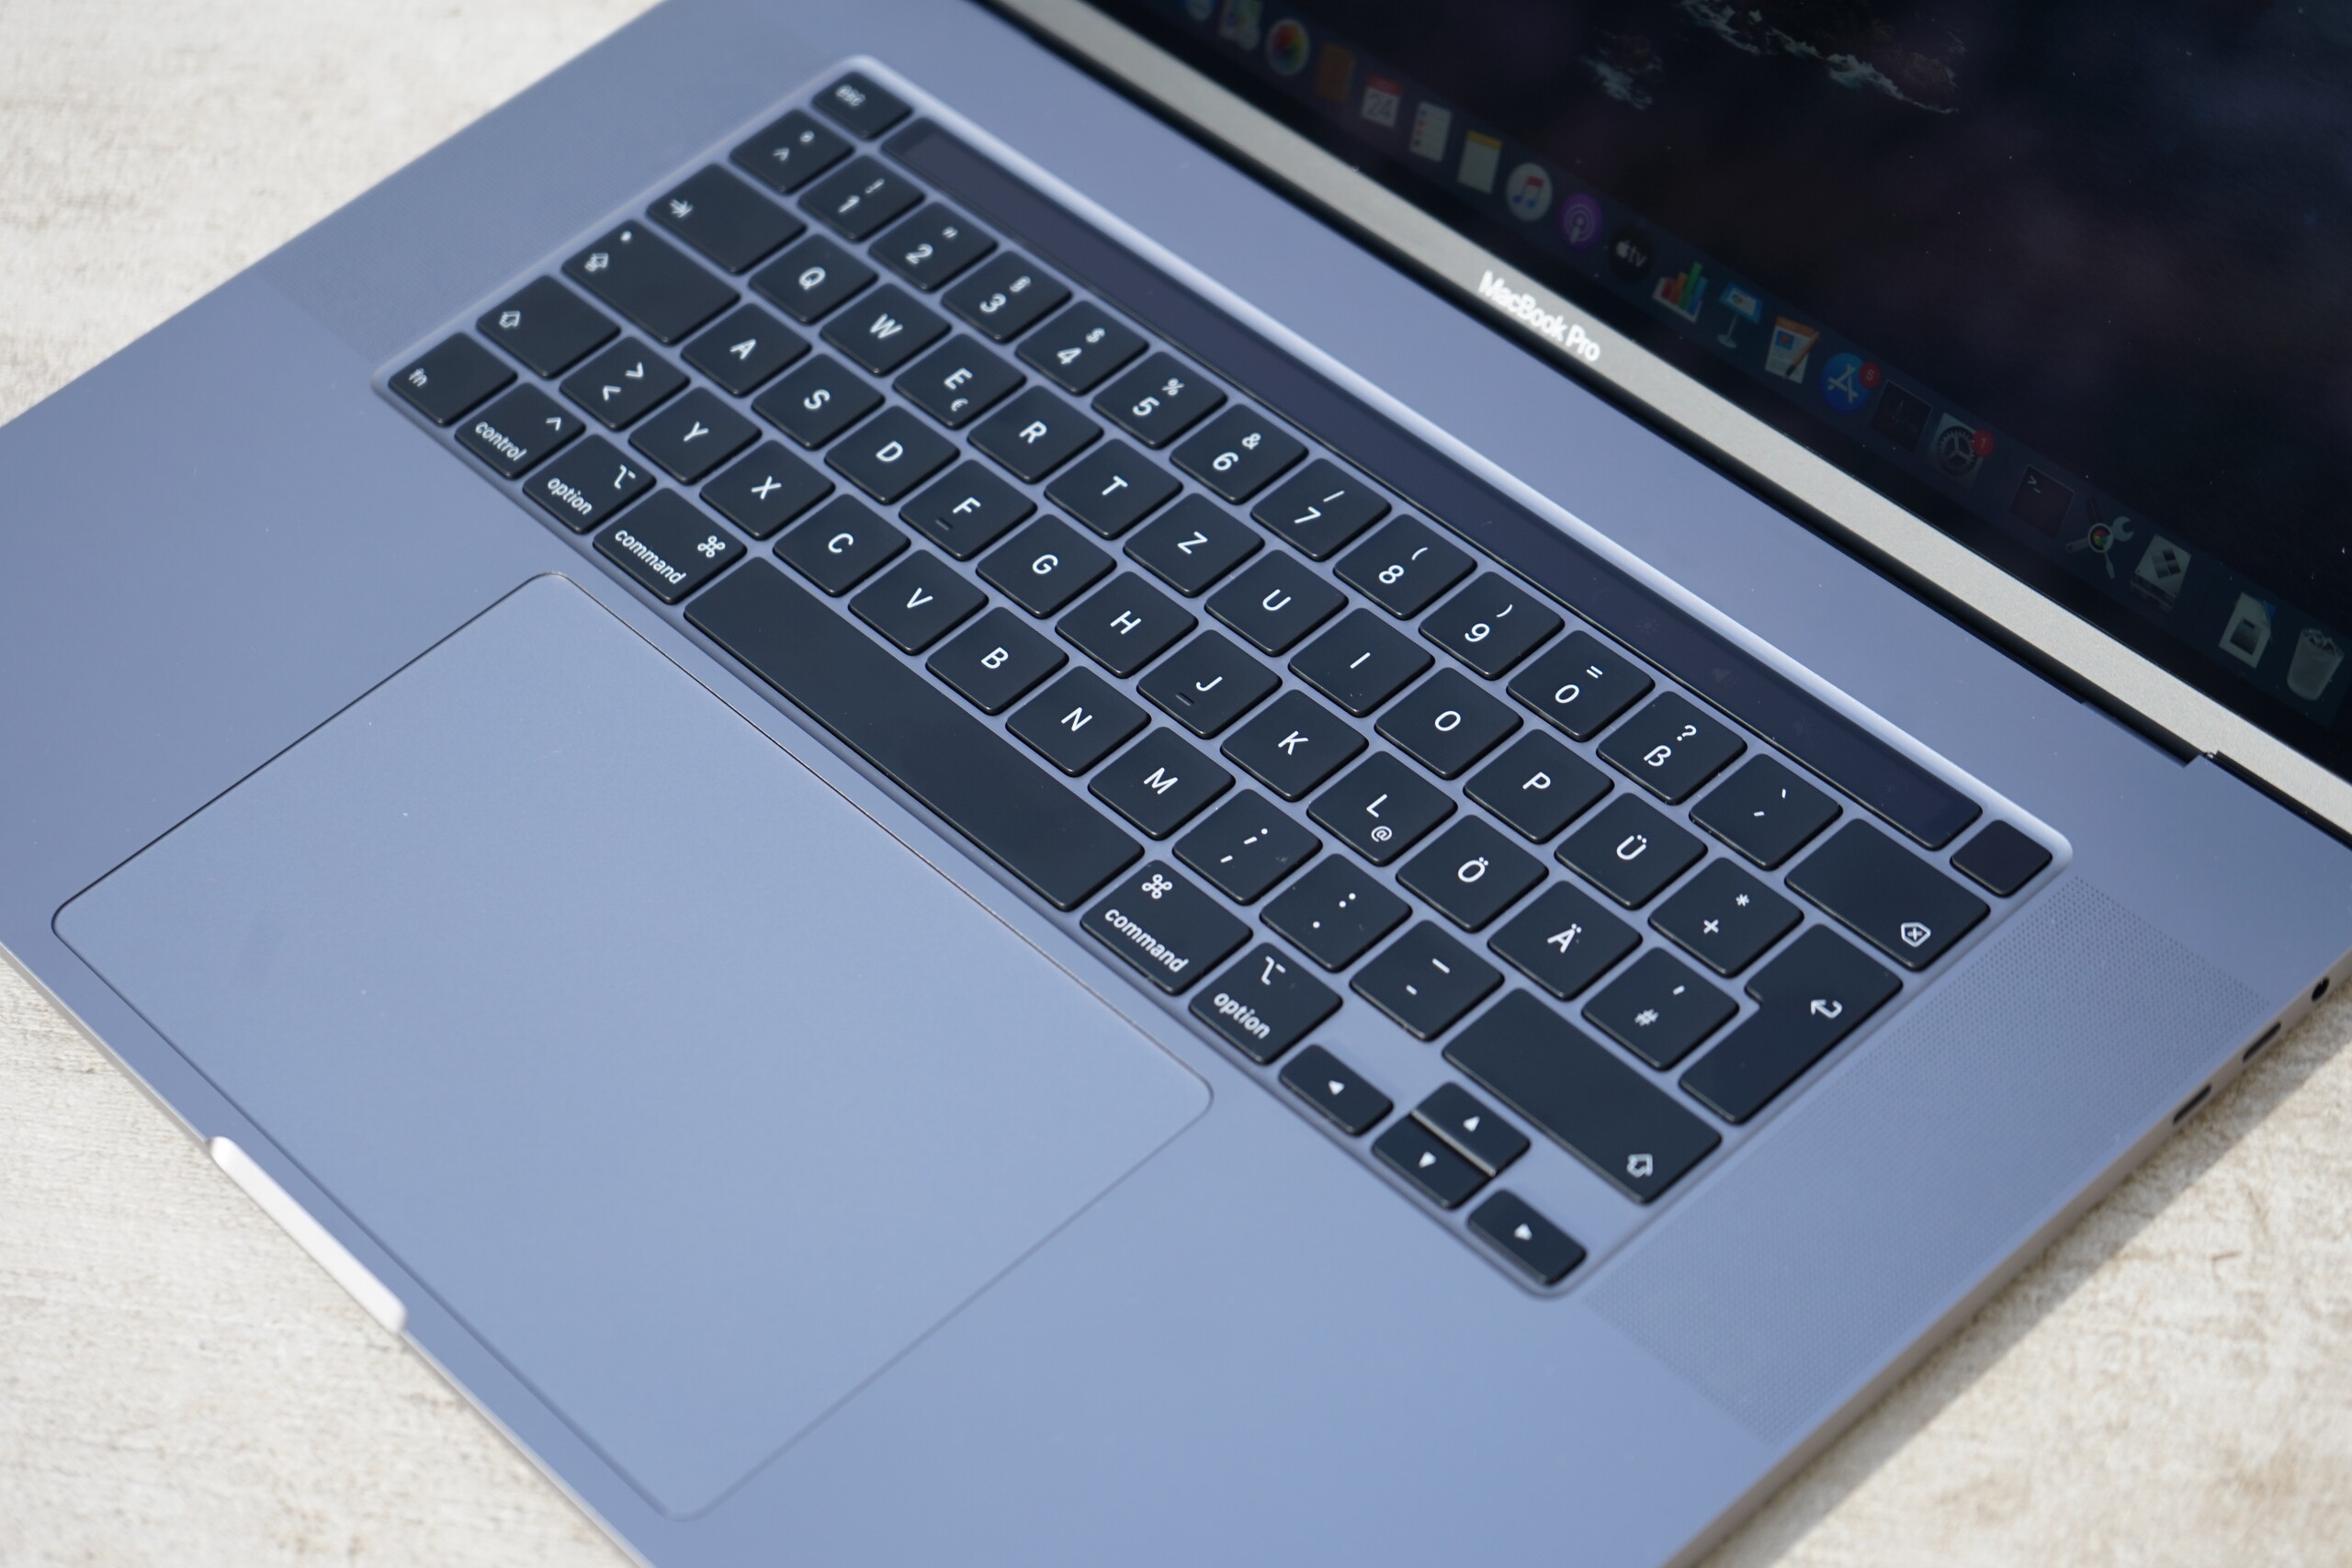
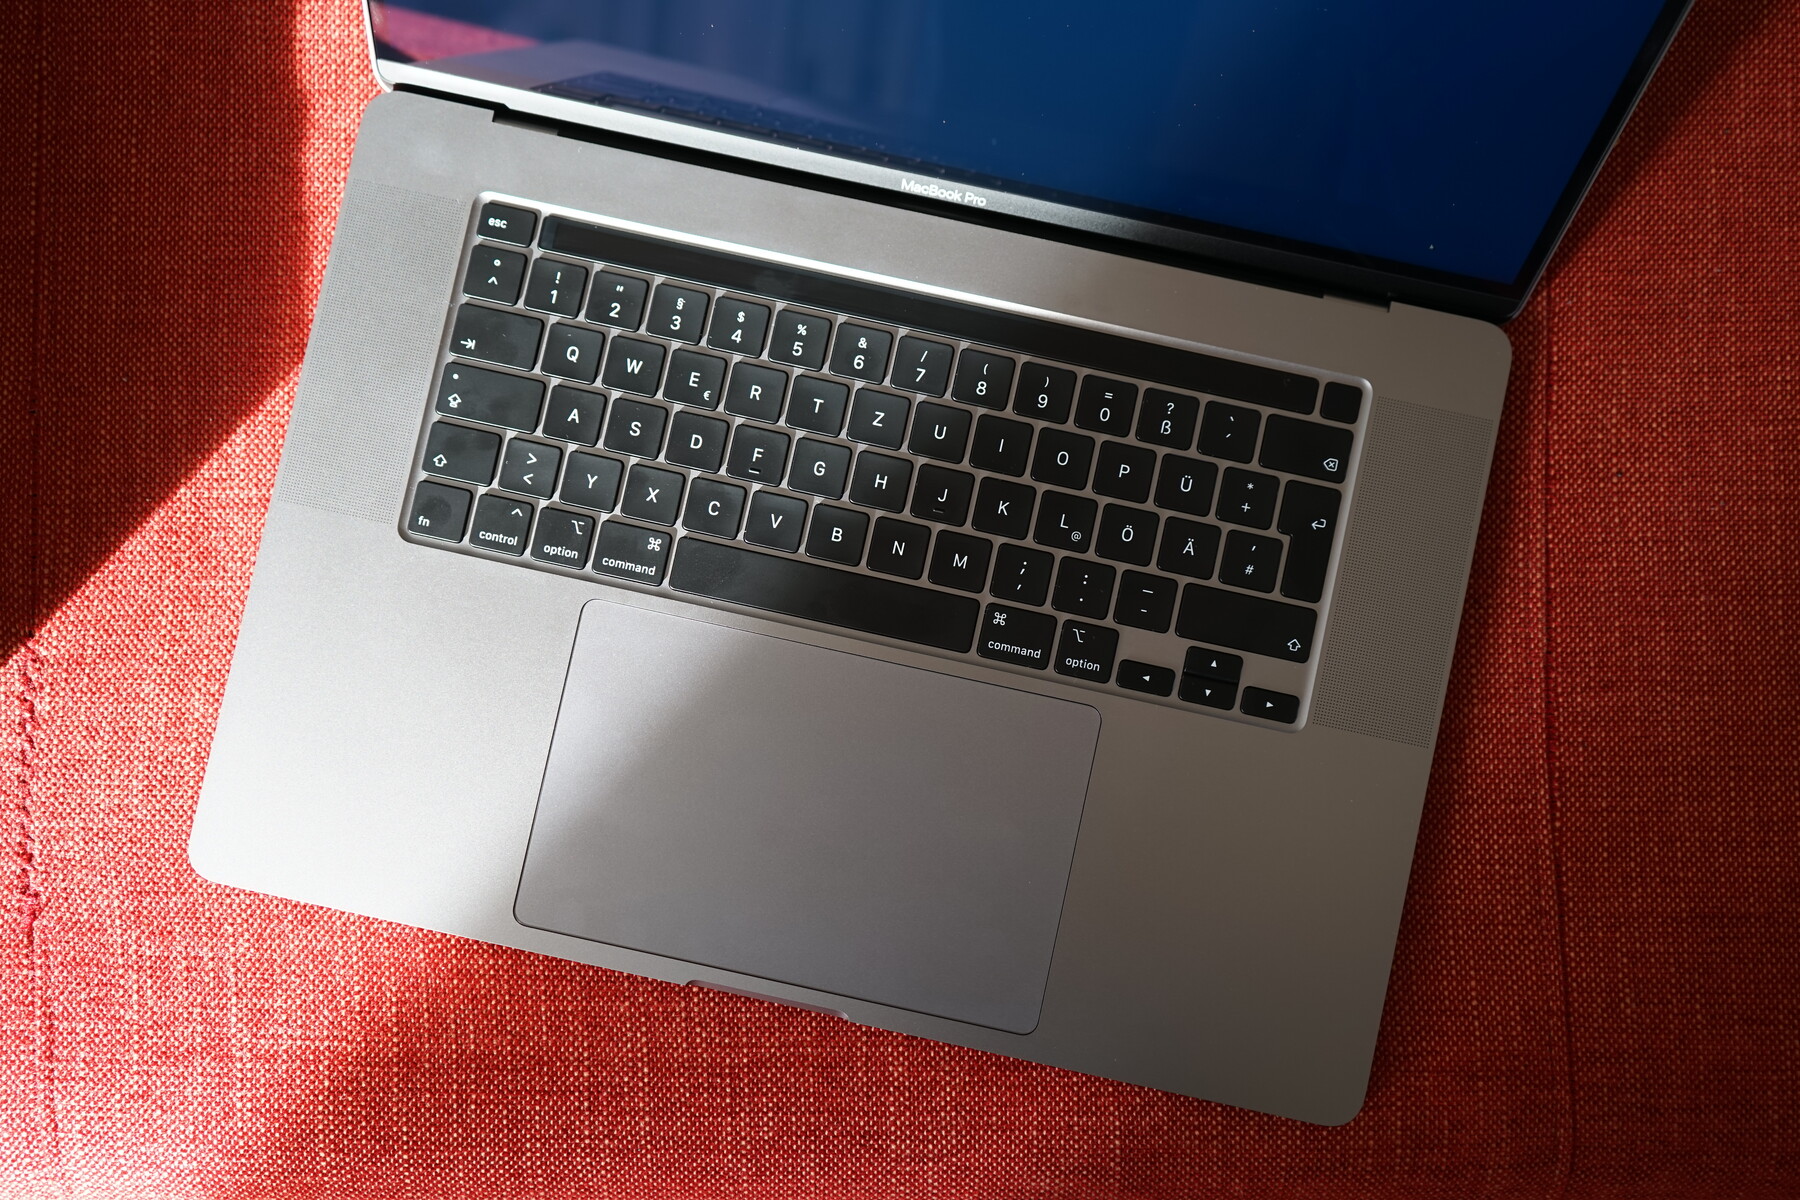
Input Devices - A new MacBook Pro with an old keyboard
Keyboard
The MacBook Pro 16 marks the first time that Apple has released a MacBook without a butterfly keyboard since it introduced the mechanism about four years ago. This is rather unsurprising considering the volume of negative headlines and longevity issues that the butterfly mechanism received.
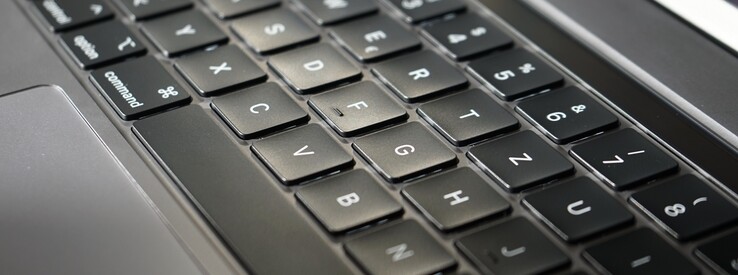
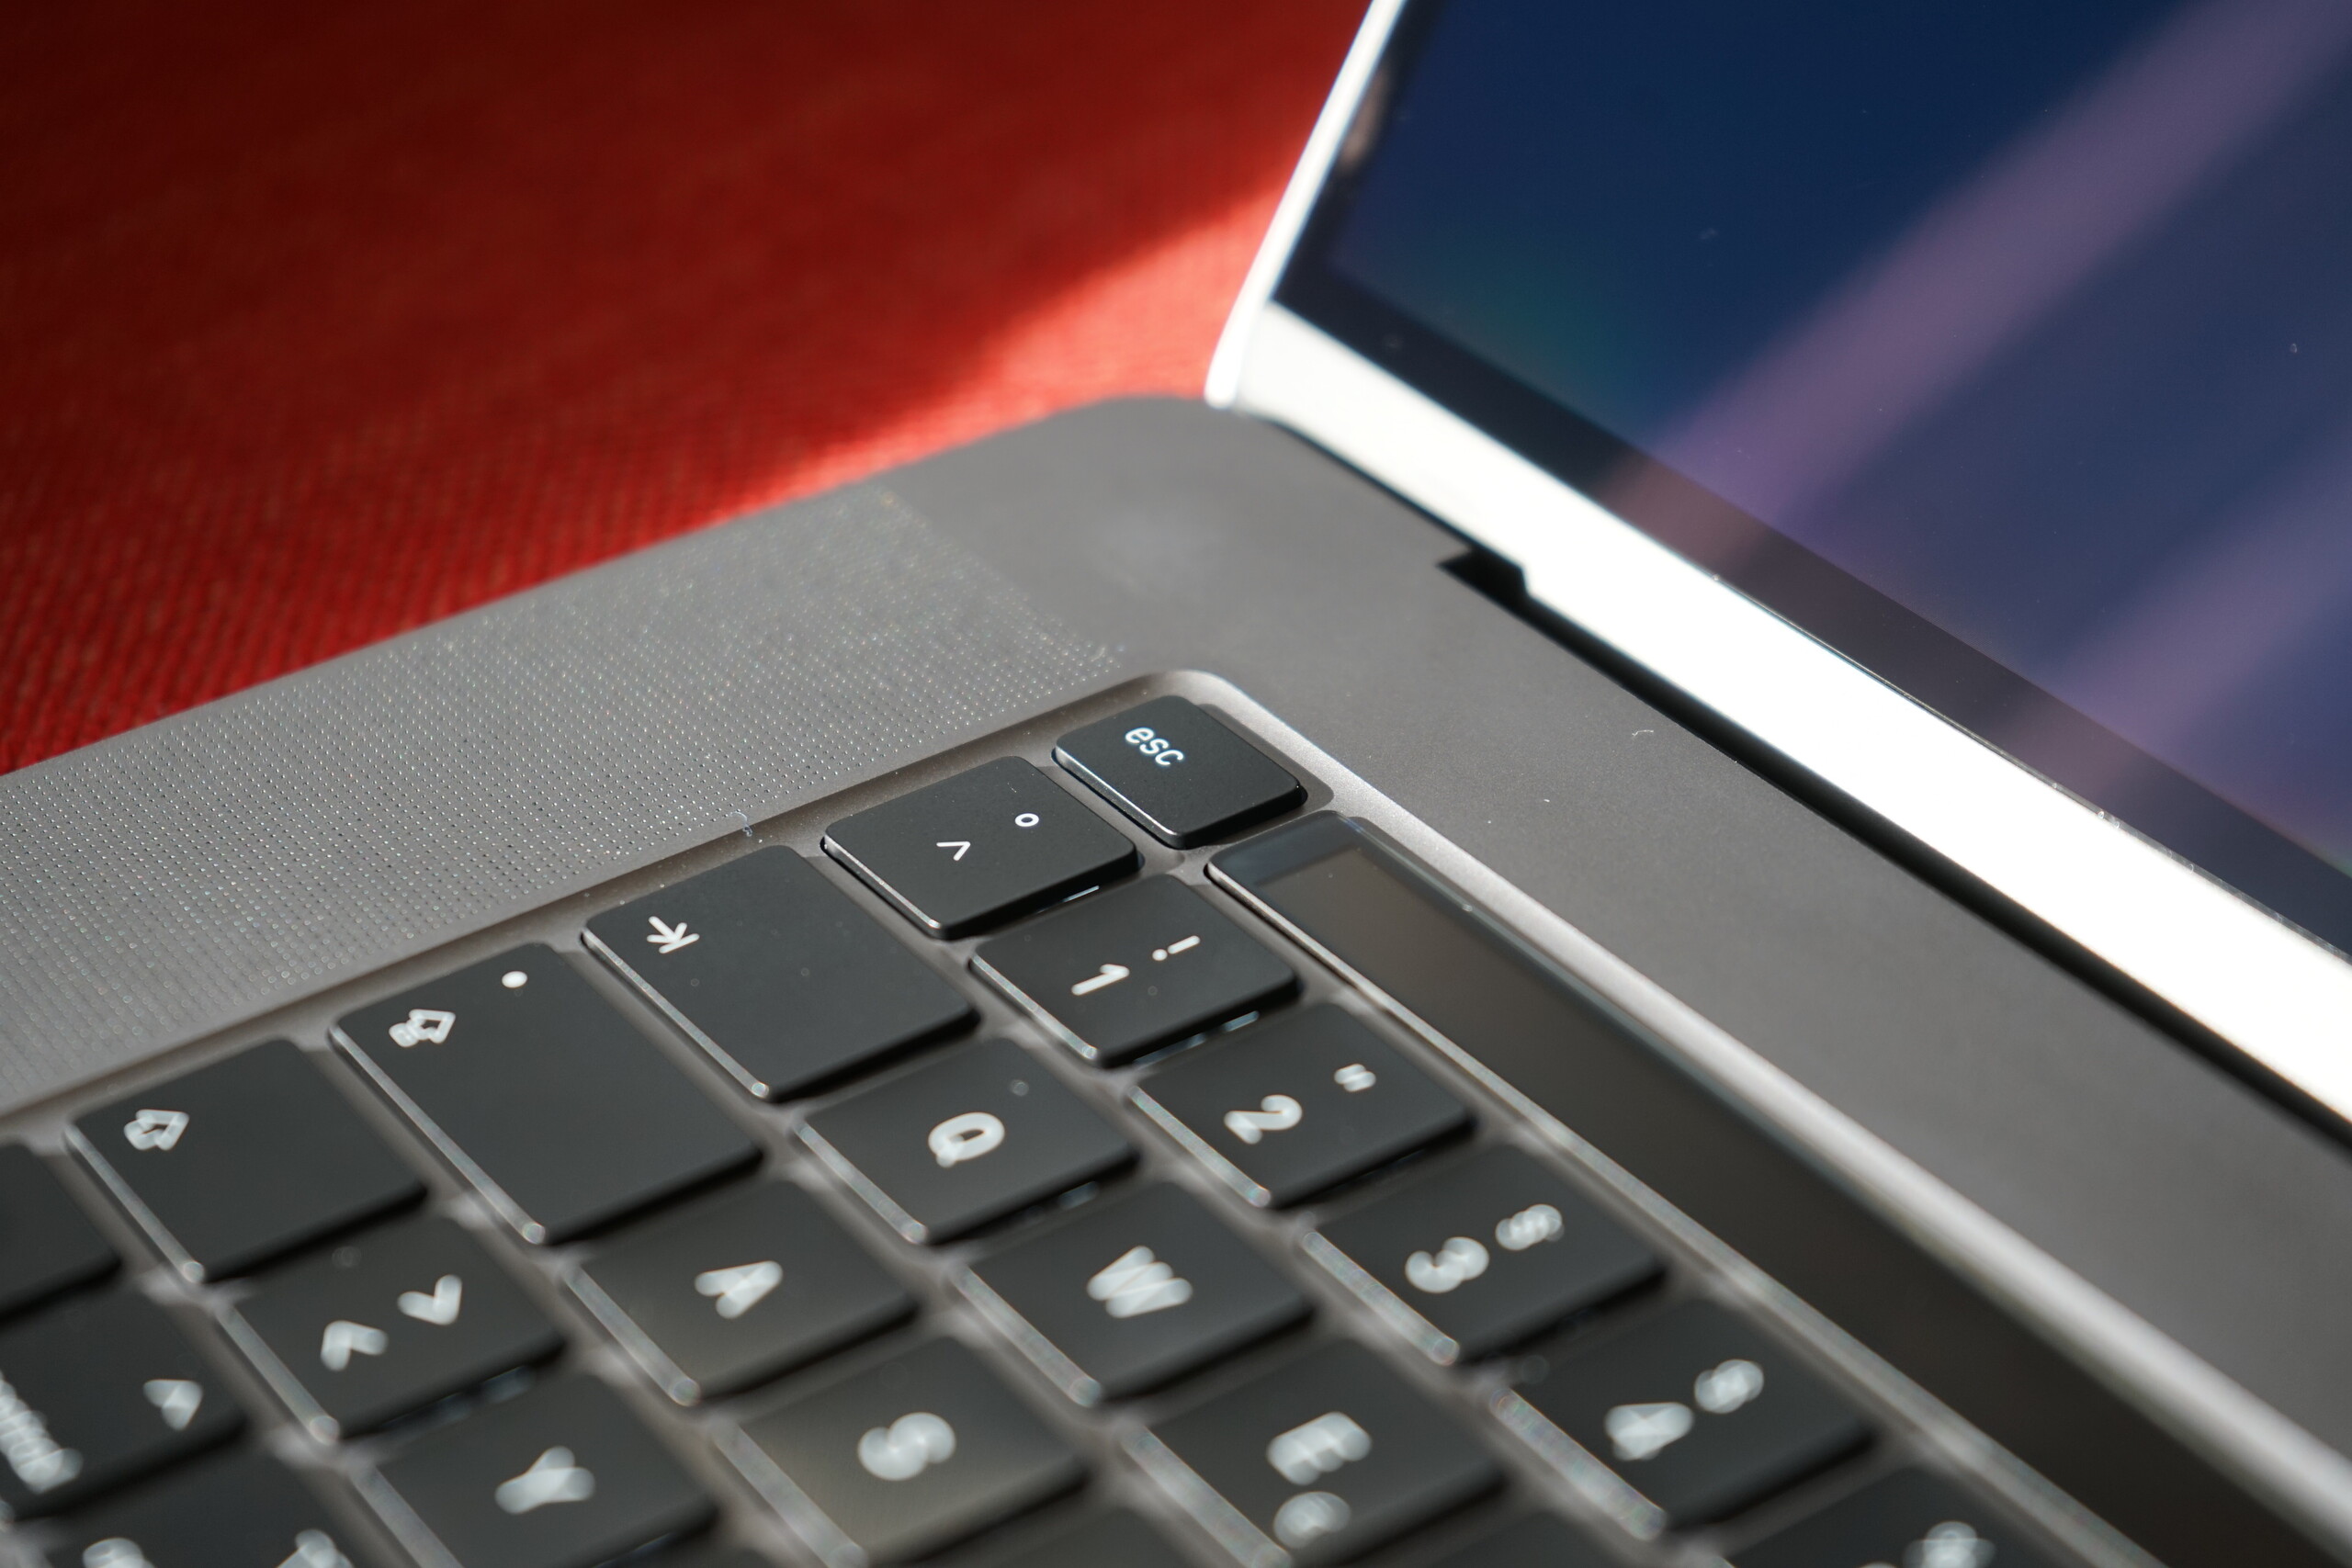
Apple has actually done a u-turn and has returned in principal to the keyboard it used in the Mid 2015 MacBook Pro 15. The scissor keyboard in the MacBook Pro 16 has about 1.2 mm of travel, which should please those who had trouble typing on the butterfly keyboard. The scissor keyboard is quieter than the butterfly mechanism too. Overall, we have little to complain about here. Apple has adjusted the shape of the arrow keys too, much to our approval. While the keys are smaller than the ones in the MacBook Pro 15, they are easier to use when touch typing, in our opinion. Contrary to other reports, we had no issues with getting used to scissor keyboards again, especially the precise feedback that the keys offer. Incidentally, we achieved the same words per minute (WPM) regardless of whether we are typing on the MacBook Pro 16 or MacBook Pro 15.
The MacBook Pro 16 retains the Touch Bar that its predecessors have featured, although this has also received a redesign. The Touch Bar now no longer sits flush with the top case, while it is a little narrower than the one found in the MacBook Pro 15 too. Moreover, there is now a dedicated escape key and power button. The latter supports Touch ID for biometric authentication and worked perfectly during our tests. The fingerprint scanner can be used not only for unlocking the device but also for passwords and Apple Pay.
The keyboard is backlit too, as all MacBook keyboards have been for well over a decade. Apple continues to offer better backlighting than many of its competitors, in our opinion. While the MacBook Pro 16 does not offer the same degree of backlight customisation as gaming laptops and their RGB keyboards do, it has finer controls than comparable Windows laptops do, which typically only offer two brightness levels. You will rarely find the need to adjust the keyboard backlight manually either, as the built-in brightness sensor reacts well to changing ambient light. The backlight uses pulse-width modulation (PWM) to adjust luminosity though, as the Touch Bar and display do too. PWM can cause health issues like eyestrain and headaches for some people, for reference.
Trackpad
Trackpads in Windows laptops have improved drastically over the last few years, but they are still playing catch up to those in modern MacBooks. The Force Touch glass trackpad remains the standard among laptops, with its size and accuracy unrivalled by what other OEMs currently offer. Multi-finger gestures are easy to pull off, as is moving the mouse with one finger. Overall, we have nothing to complain about here, nor do we about the Force Touch motor that provides haptic feedback. The motor works perfectly even into the corners of the trackpad and is something that Windows OEMs are still yet to match.
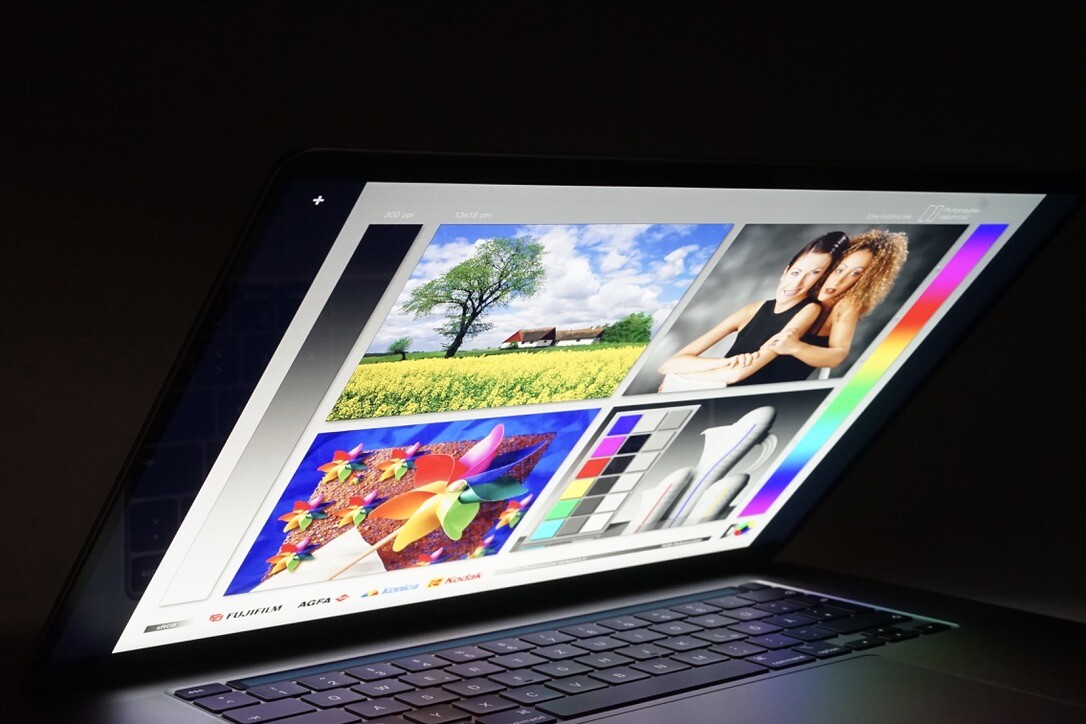
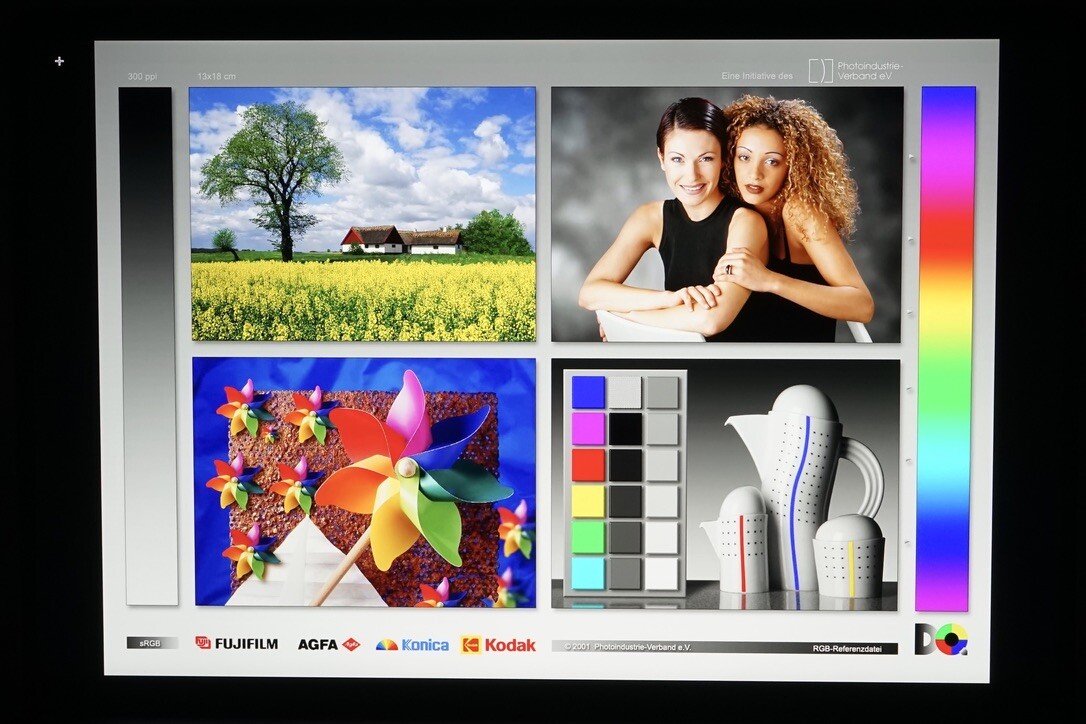
Display - A glorious 16-inch Retina display
One of the most obvious changes with the new MacBook Pro is its display. The new 16-inch panel is IPS rather than OLED and still carries the company's Retina branding. The 226 PPI pixel density of the 3072x1920 panel is lower than those of comparable 4K screens though, like those in the Dell XPS 15 7590 and Lenovo ThinkPad X1 Extreme Gen 2. Apple continues to only offer a single display variant with its MacBook Pro series, which is neither capable of high refresh rates nor HDR.
Apple advertises the MacBook Pro 16 as having a 500 cd/m² 16-inch display, a claim that is only true at the centre of our review unit's display according to X-Rite i1Pro 2. The software records the panel as being 86% evenly lit, which results in an average maximum luminosity of 477 cd/m². While the latter is higher than the luminosities that most of our comparison devices achieved in the same tests, the former could be better. The display has an acceptable black value too, which we measured at 0.39 cd/m². None of our comparison devices achieve drastically lower black values other than the Dell XPS 15 7590, but there are plenty of other laptops that are better than the MacBook Pro 16 in this regard. This applies to our review unit's contrast ratio of 1,331:1 too. Many Windows laptops have caught up to Apple here, while the MacBook Pro 16 broadly matched the values that its predecessor achieved.
Subjectively, the display in our review unit has excellent image quality with no visible backlight bleeding. We cannot detect classic PWM either, by which we mean square wave signals, although the backlight flickers at 131 kHz. However, this frequency is so high, and it varies so slightly when changing brightness levels, that few people should be affected by it. We suspect that Apple uses this method of regulating luminosity to reduce power consumption.
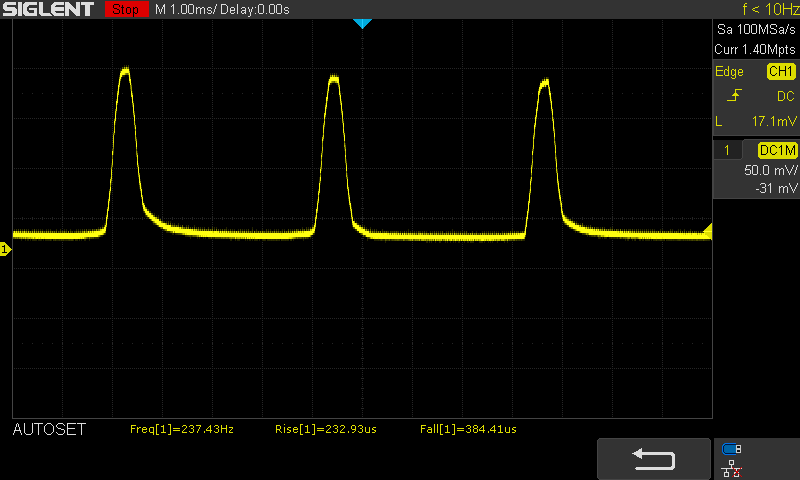
On the other hand, the Touch Bar may cause eyestrain and headaches for some people. The Touch Bar flickers at an OLED-typical 240 Hz, a PWM frequency that we have seen many smartphones also use. While there is a risk that the Touch Bar could affect some people, most will spend so little time looking at it that even those who are PWM sensitive should suffer no long-term ill-effects.
| |||||||||||||||||||||||||
Brightness Distribution: 86 %
Center on Battery: 519 cd/m²
Contrast: 1331:1 (Black: 0.39 cd/m²)
ΔE ColorChecker Calman: 2.28 | ∀{0.5-29.43 Ø4.75}
calibrated: 0.86
ΔE Greyscale Calman: 0.9 | ∀{0.09-98 Ø5}
100% sRGB (Calman 2D)
78% AdobeRGB 1998 (Argyll 1.6.3 3D)
Gamma: 2145
CCT: 6572 K
| Apple MacBook Pro 16 2019 i9 5500M APPA044, IPS, 3072x1920, 16" | Dell XPS 15 7590 9980HK GTX 1650 Samsung 156WR04, SDCA029, OLED, 3840x2160, 15.6" | Lenovo ThinkPad X1 Extreme 2019 20QV000WGE NE156QUM-N66, IPS, 3840x2160, 15.6" | Apple MacBook Pro 15 2018 (2.6 GHz, 560X) APPA040, IPS, 2880x1800, 15.4" | Asus ZenBook Pro 15 UX580GE AU Optronics B156ZAN03.1, IPS, 3840x2160, 15.6" | MSI P65 Creator 9SF-657 AU Optronics AUO41EB, IPS, 3840x2160, 15.6" | |
|---|---|---|---|---|---|---|
| Display | ||||||
| Display P3 Coverage (%) | 88.1 | 82 | 98.7 | 85.9 | 84.4 | |
| sRGB Coverage (%) | 99.6 | 99.1 | 99.9 | 100 | 100 | |
| AdobeRGB 1998 Coverage (%) | 91.8 | 96.9 | 86.6 | 99.1 | 98.5 | |
| Response Times | 95% | 12% | 15% | 26% | 7% | |
| Response Time Grey 50% / Grey 80% * (ms) | 52.4 ? | 2.3 ? 96% | 46.4 ? 11% | 43.2 ? 18% | 44 ? 16% | 51 ? 3% |
| Response Time Black / White * (ms) | 34.9 ? | 2.4 ? 93% | 30.4 ? 13% | 31.2 ? 11% | 22.8 ? 35% | 31 ? 11% |
| PWM Frequency (Hz) | 131700 | 59.5 ? | 117000 ? | |||
| Screen | -68% | -85% | 9% | -69% | -66% | |
| Brightness middle (cd/m²) | 519 | 421.2 -19% | 464 -11% | 520 0% | 357.6 -31% | 445 -14% |
| Brightness (cd/m²) | 477 | 417 -13% | 448 -6% | 492 3% | 350 -27% | 462 -3% |
| Brightness Distribution (%) | 86 | 94 9% | 90 5% | 88 2% | 85 -1% | 83 -3% |
| Black Level * (cd/m²) | 0.39 | 0.36 8% | 0.39 -0% | 0.35 10% | 0.5 -28% | |
| Contrast (:1) | 1331 | 1289 -3% | 1333 0% | 1022 -23% | 890 -33% | |
| Colorchecker dE 2000 * | 2.28 | 6.06 -166% | 4.2 -84% | 1.2 47% | 4.12 -81% | 4.75 -108% |
| Colorchecker dE 2000 max. * | 6.54 | 11.89 -82% | 11.4 -74% | 2.3 65% | 9.91 -52% | 7.79 -19% |
| Colorchecker dE 2000 calibrated * | 0.86 | 0.8 7% | 4.23 -392% | |||
| Greyscale dE 2000 * | 0.9 | 2.8 -211% | 7.2 -700% | 1.3 -44% | 1.8 -100% | 4.49 -399% |
| Gamma | 2145 0% | 2.15 102% | 2.17 101% | 2.18 101% | 2.17 101% | 2.49 88% |
| CCT | 6572 99% | 6235 104% | 6345 102% | 6738 96% | 6613 98% | 7374 88% |
| Color Space (Percent of AdobeRGB 1998) (%) | 78 | 81 4% | 85.2 9% | 87.5 12% | 87 12% | |
| Color Space (Percent of sRGB) (%) | 99.6 | 99 | 100 | 100 | ||
| Total Average (Program / Settings) | 14% /
-32% | -37% /
-69% | 12% /
10% | -22% /
-53% | -30% /
-53% |
* ... smaller is better
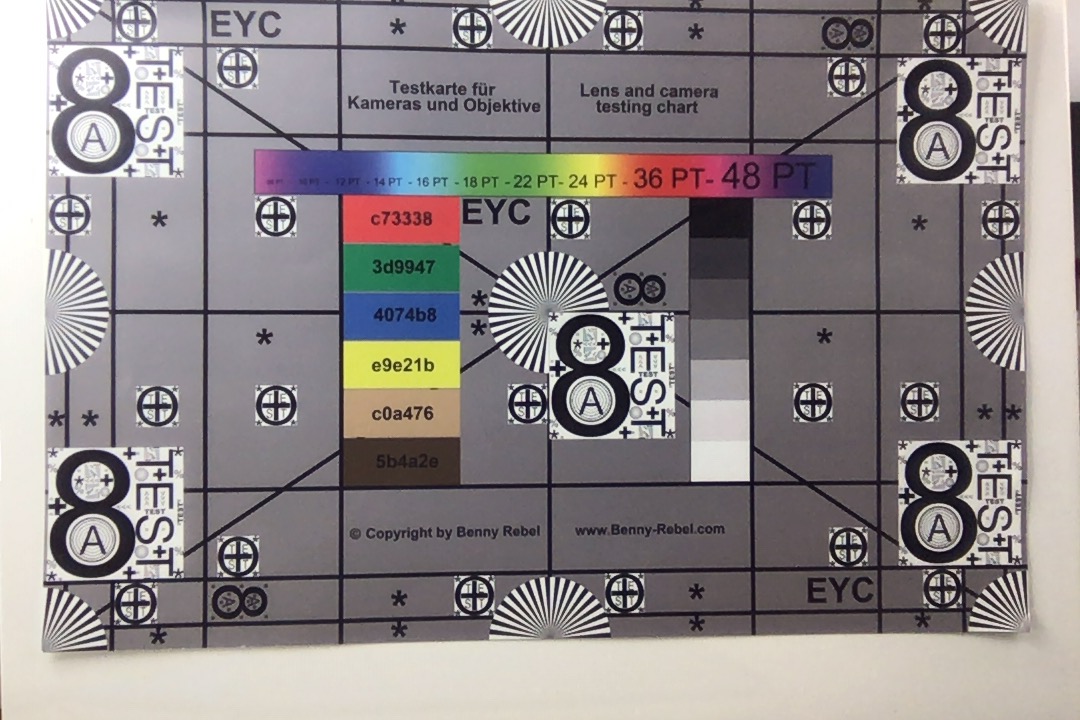
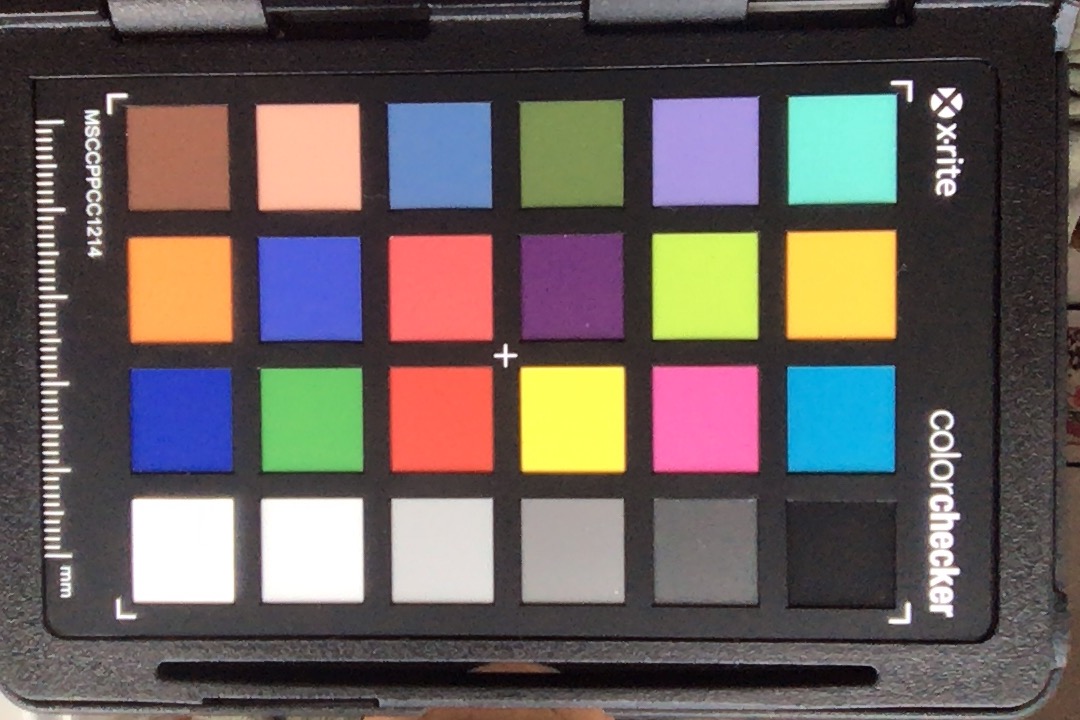
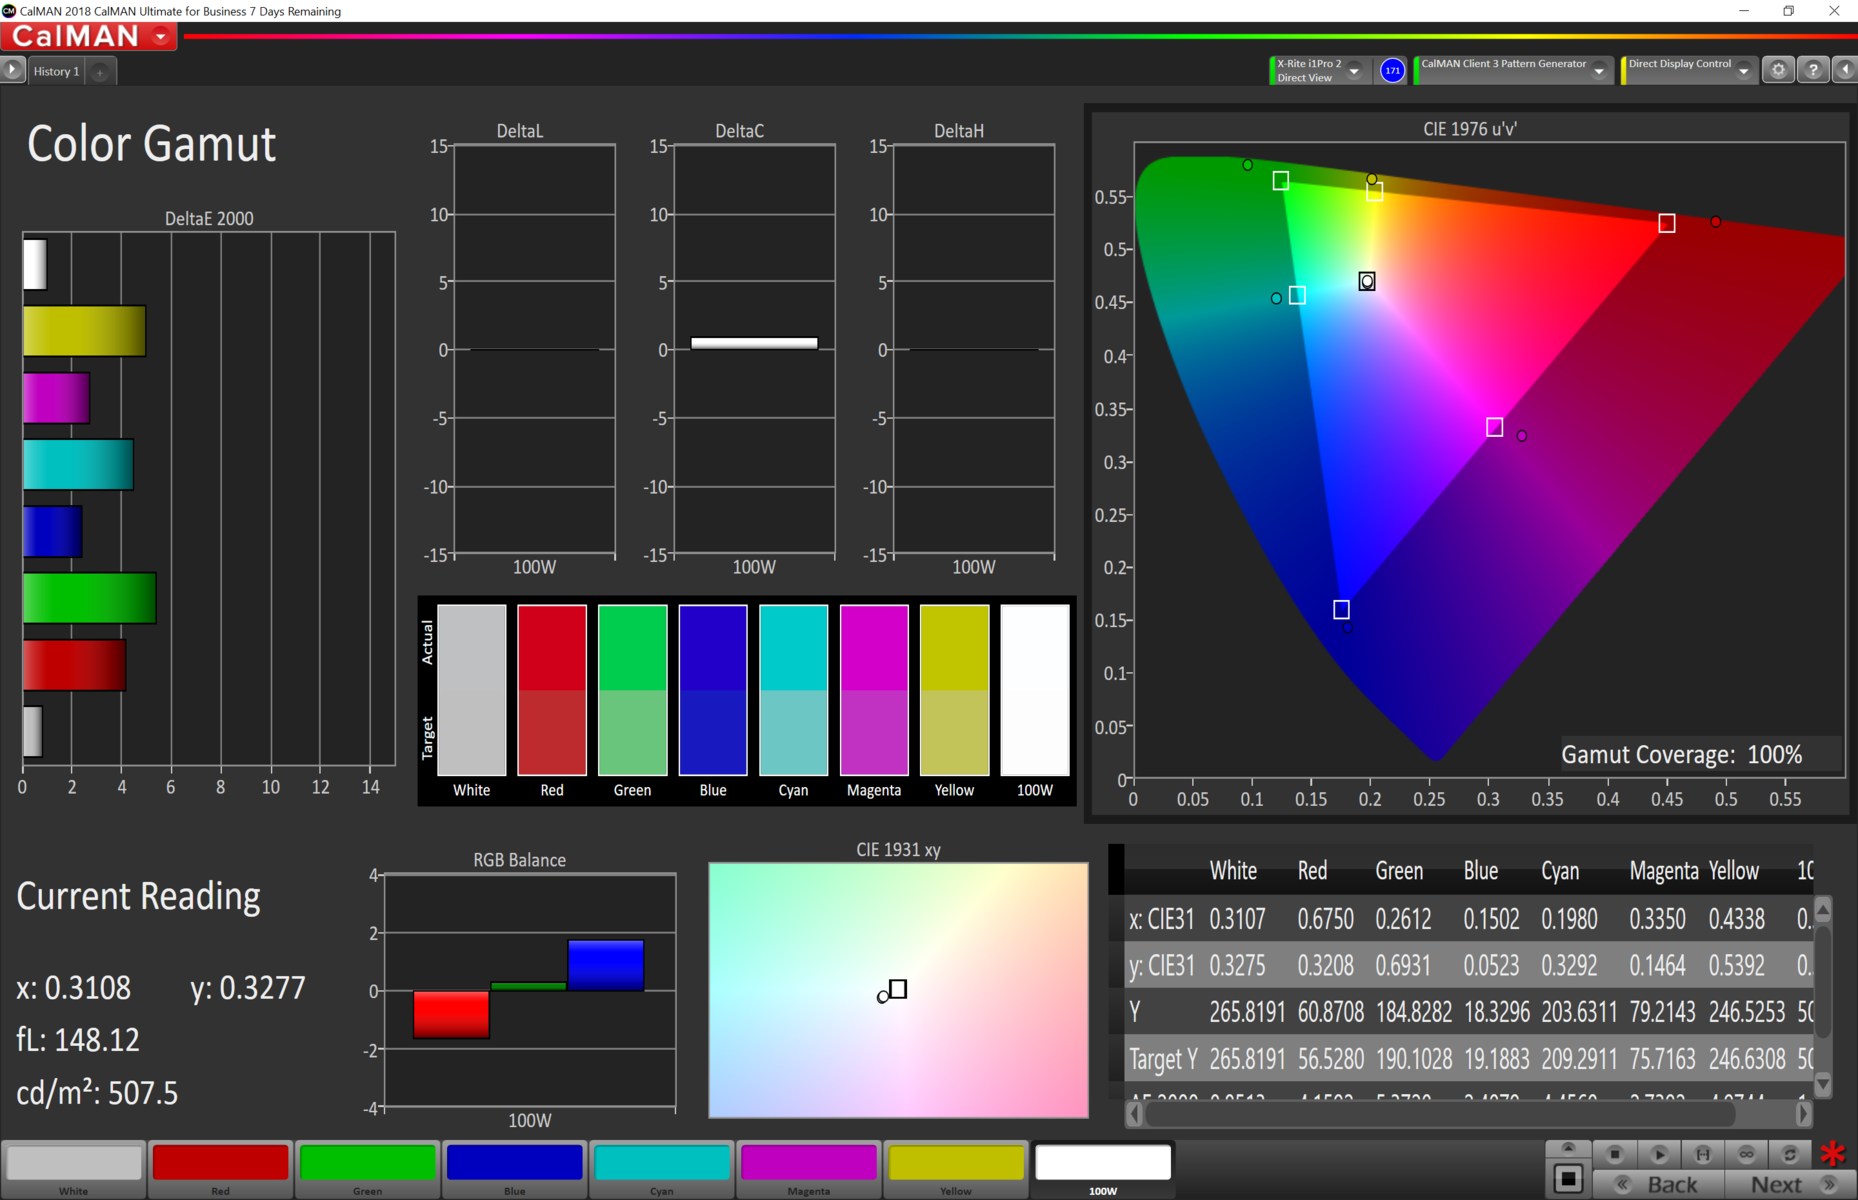
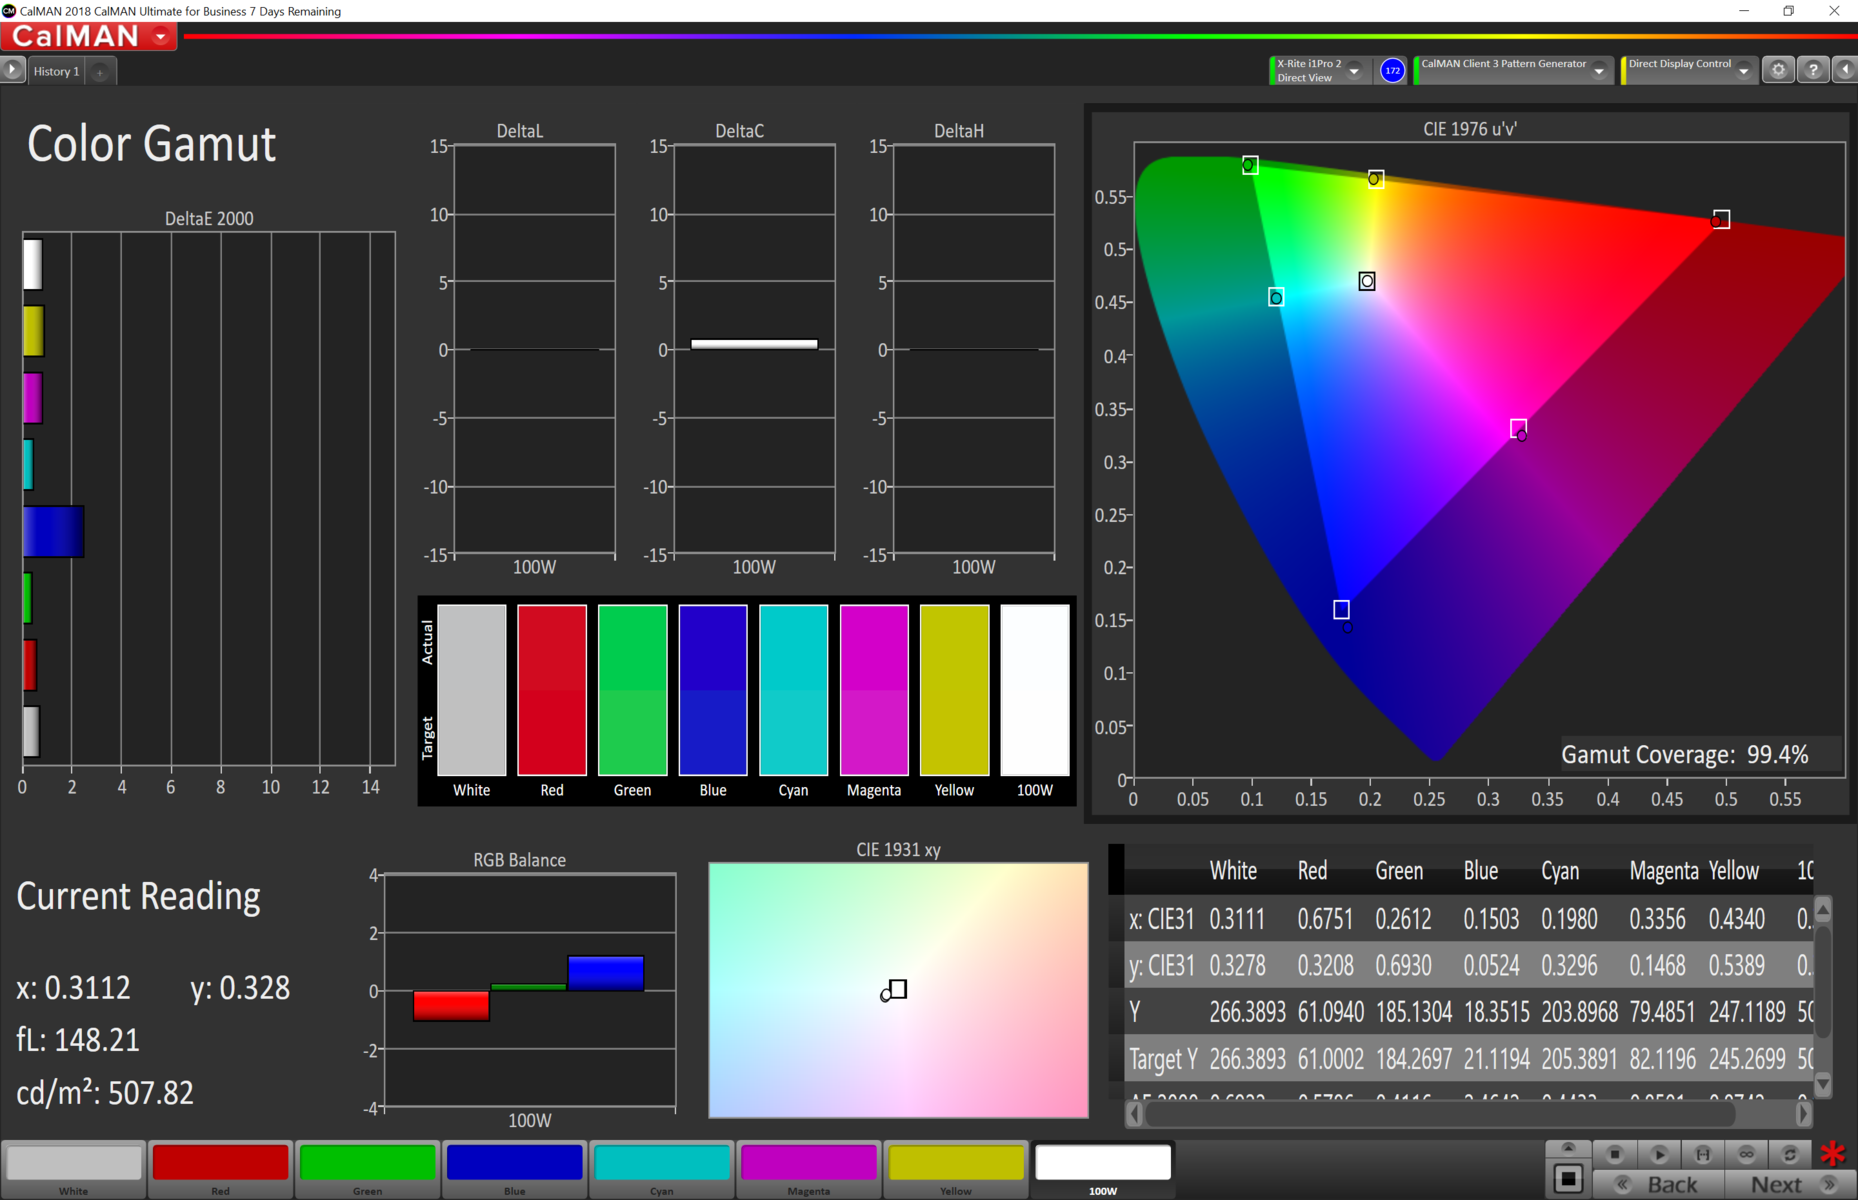
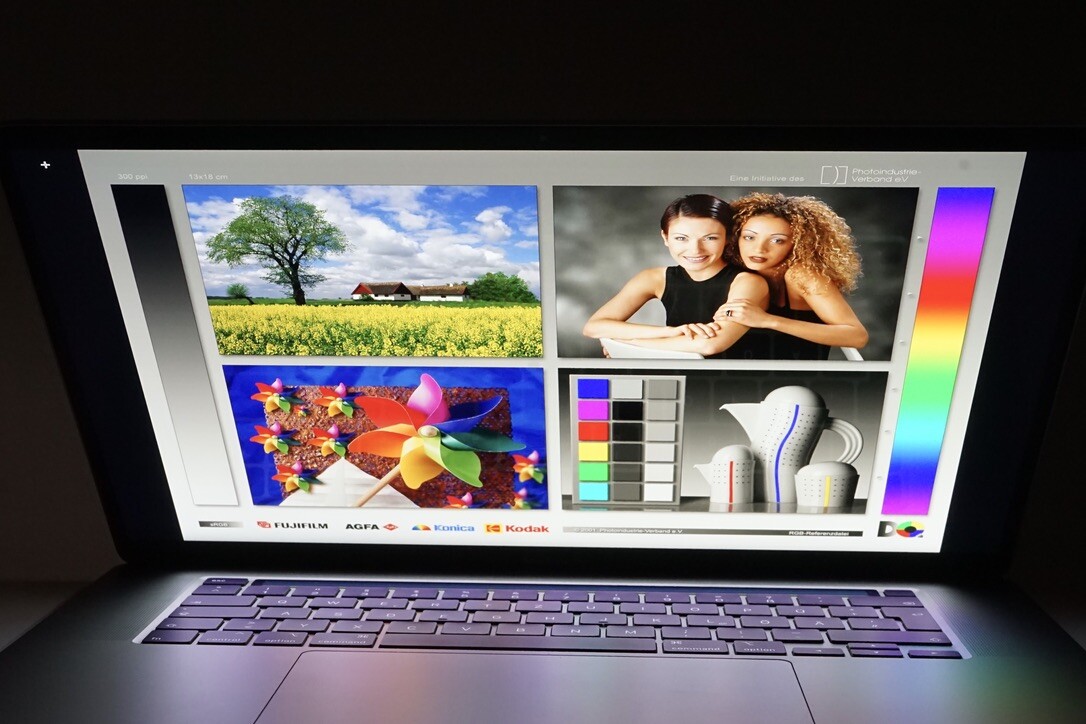
Contrary to its Windows competitors, Apple has been using P3 as the target colour space of its MacBook displays for several years. Correspondingly, we conducted our colour accuracy tests using the P3 colour space rather than AdobeRGB or sRGB. CalMAN Ultimate and our X-Rite i1 Pro2 spectrophotometer determine that Apple is still factory calibrating displays. However, the panel in our MacBook Pro 16 review unit is not as accurate as the display in the MacBook Pro 15 that we tested, which had only minor DeltaE deviations. While the MacBook Pro 16 has impressively low greyscale deviations, its brown and orange deviations are higher than what we would have expected.
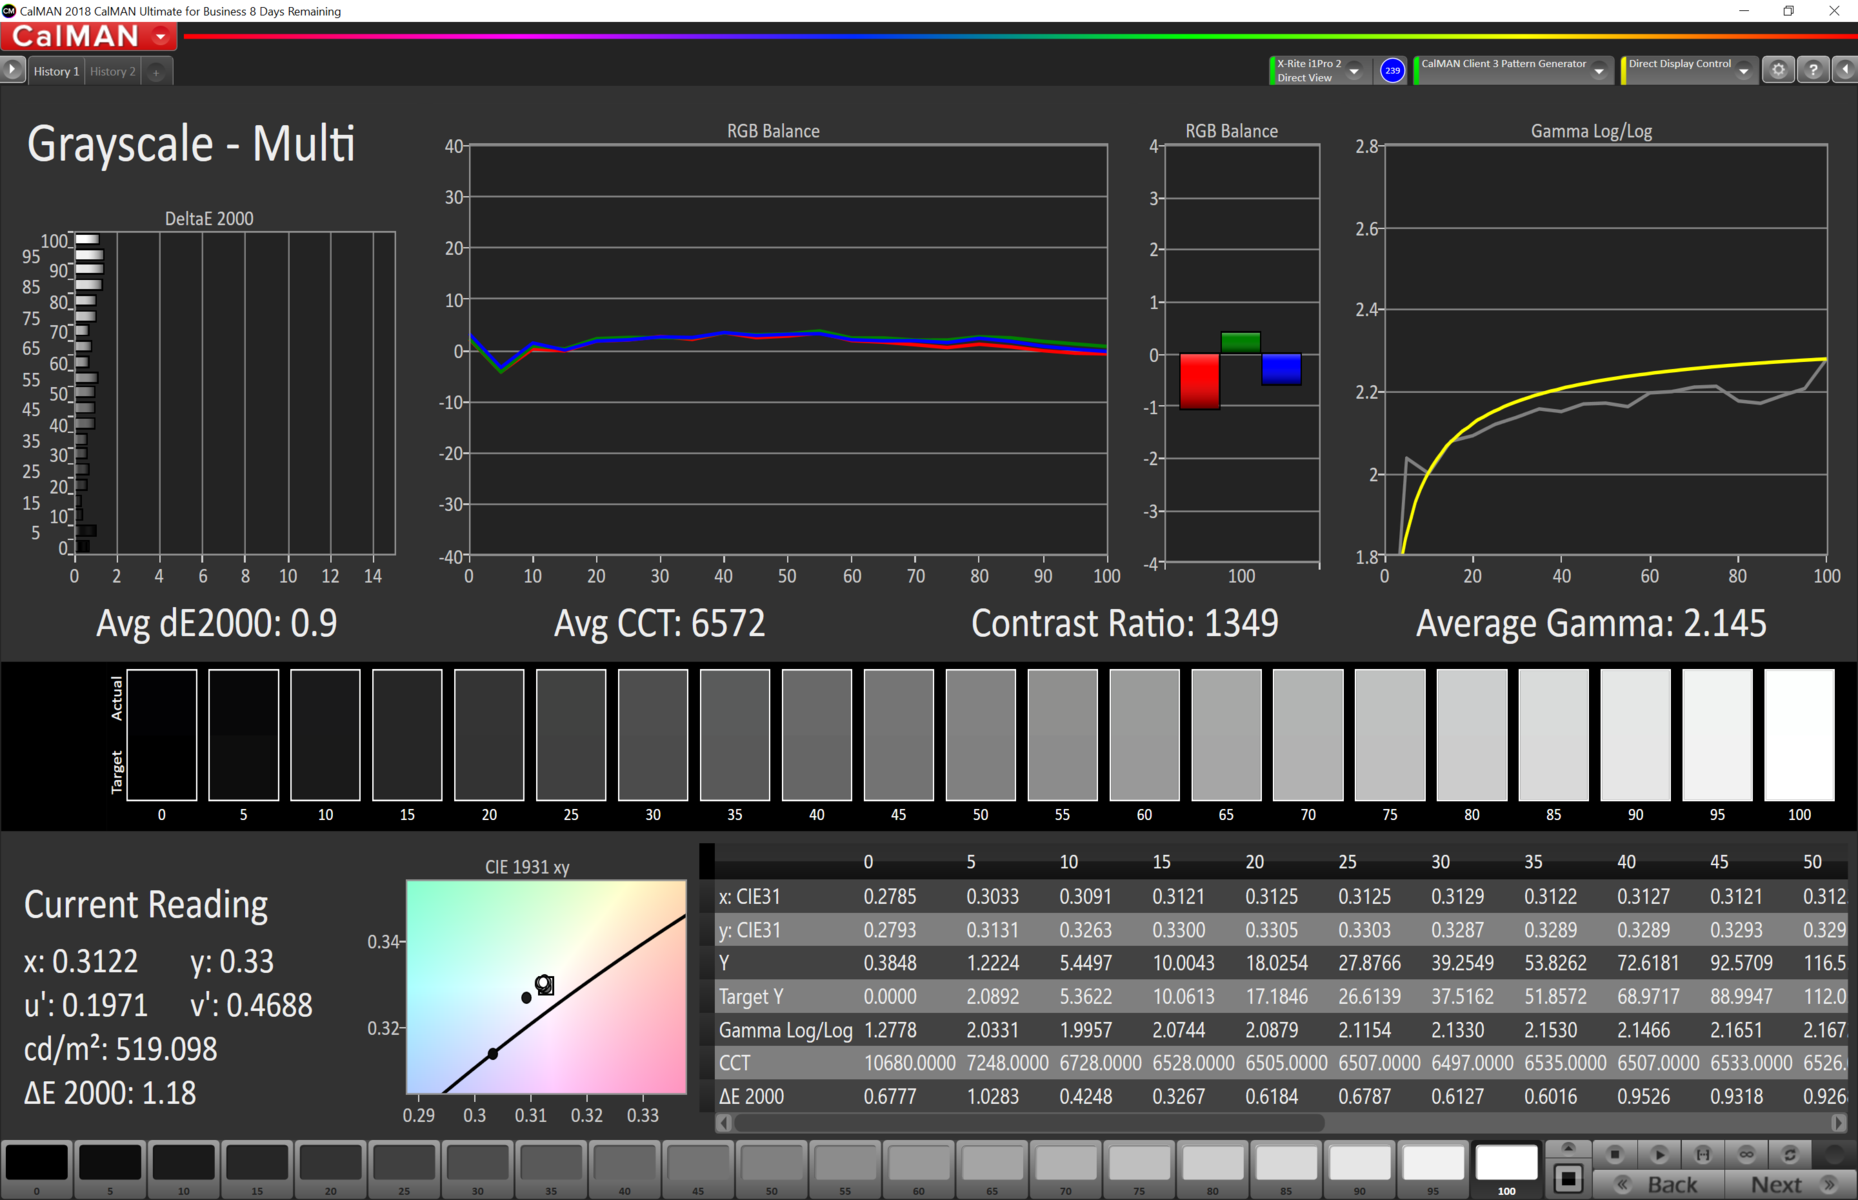
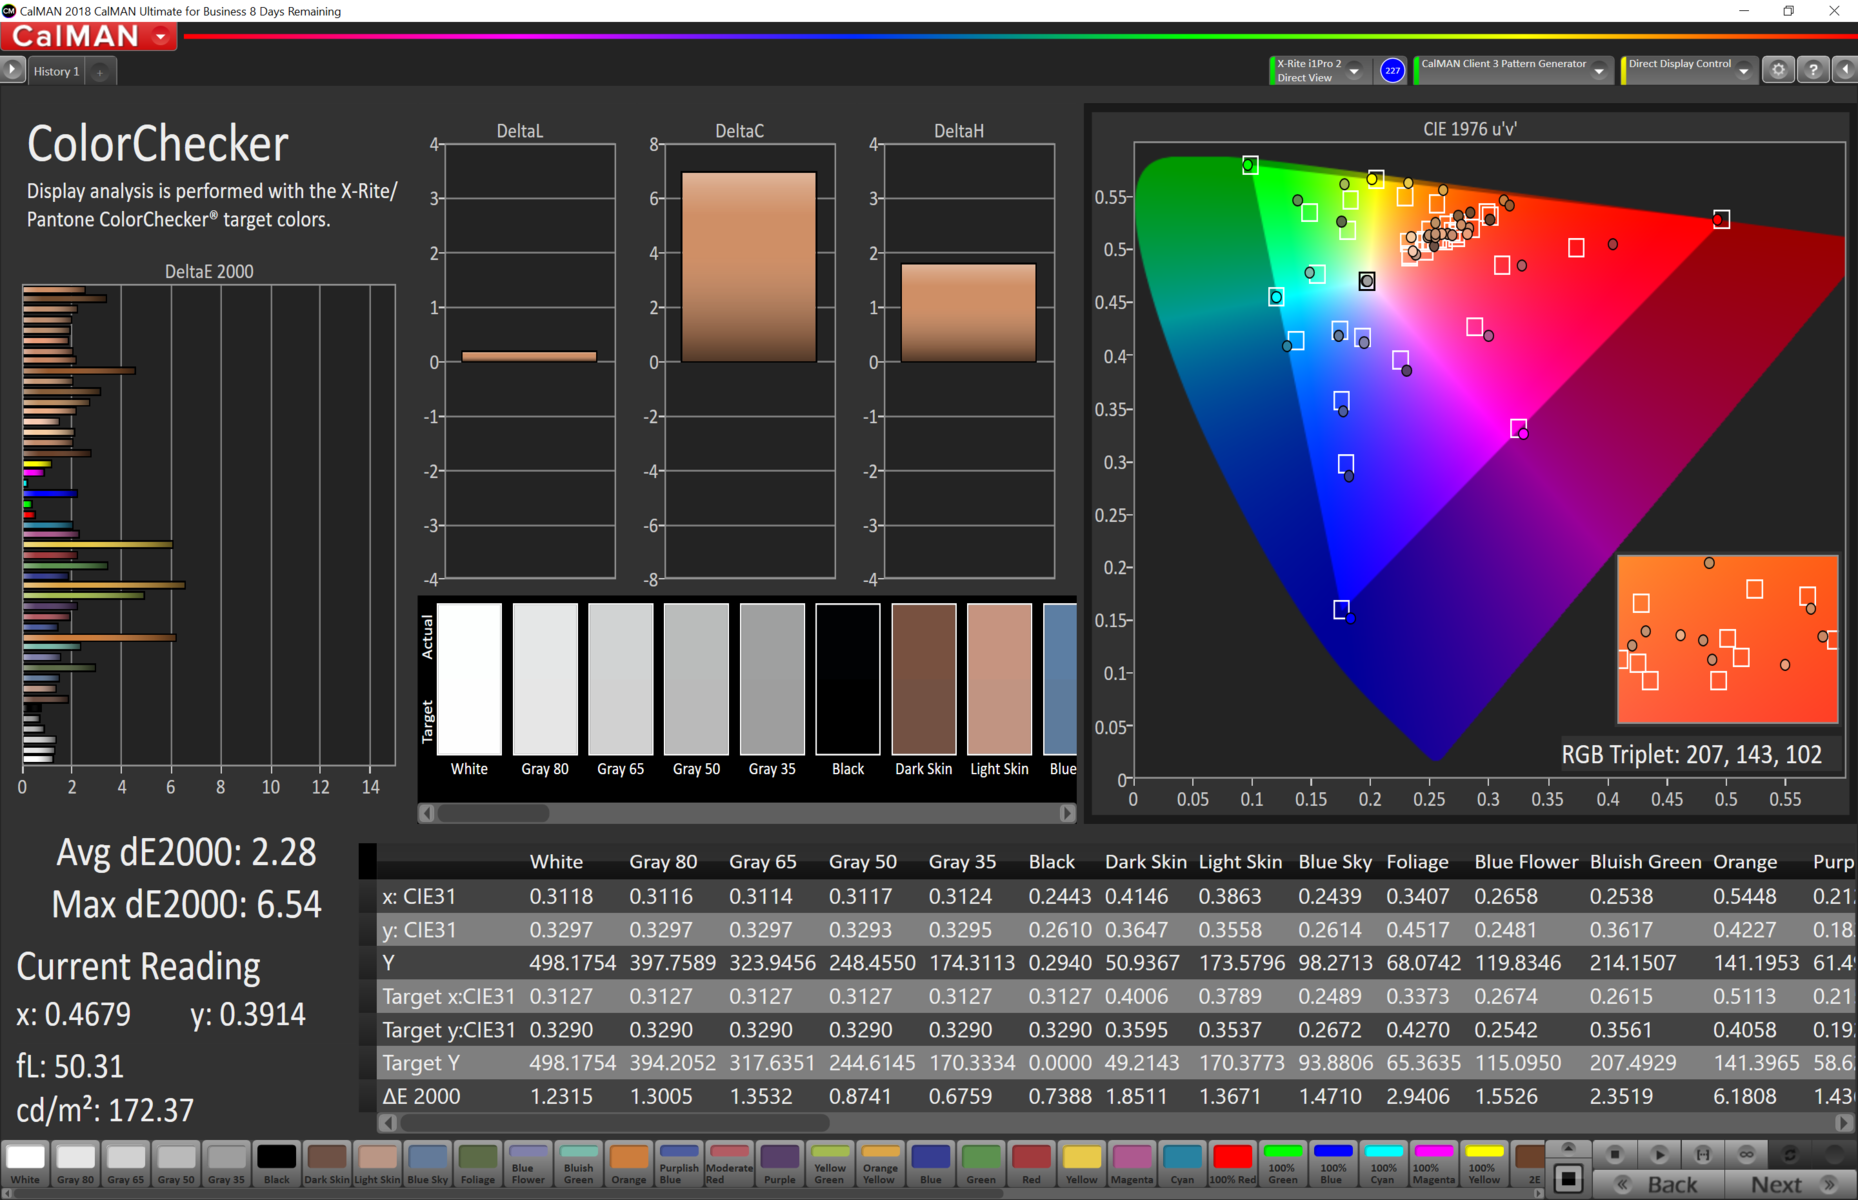
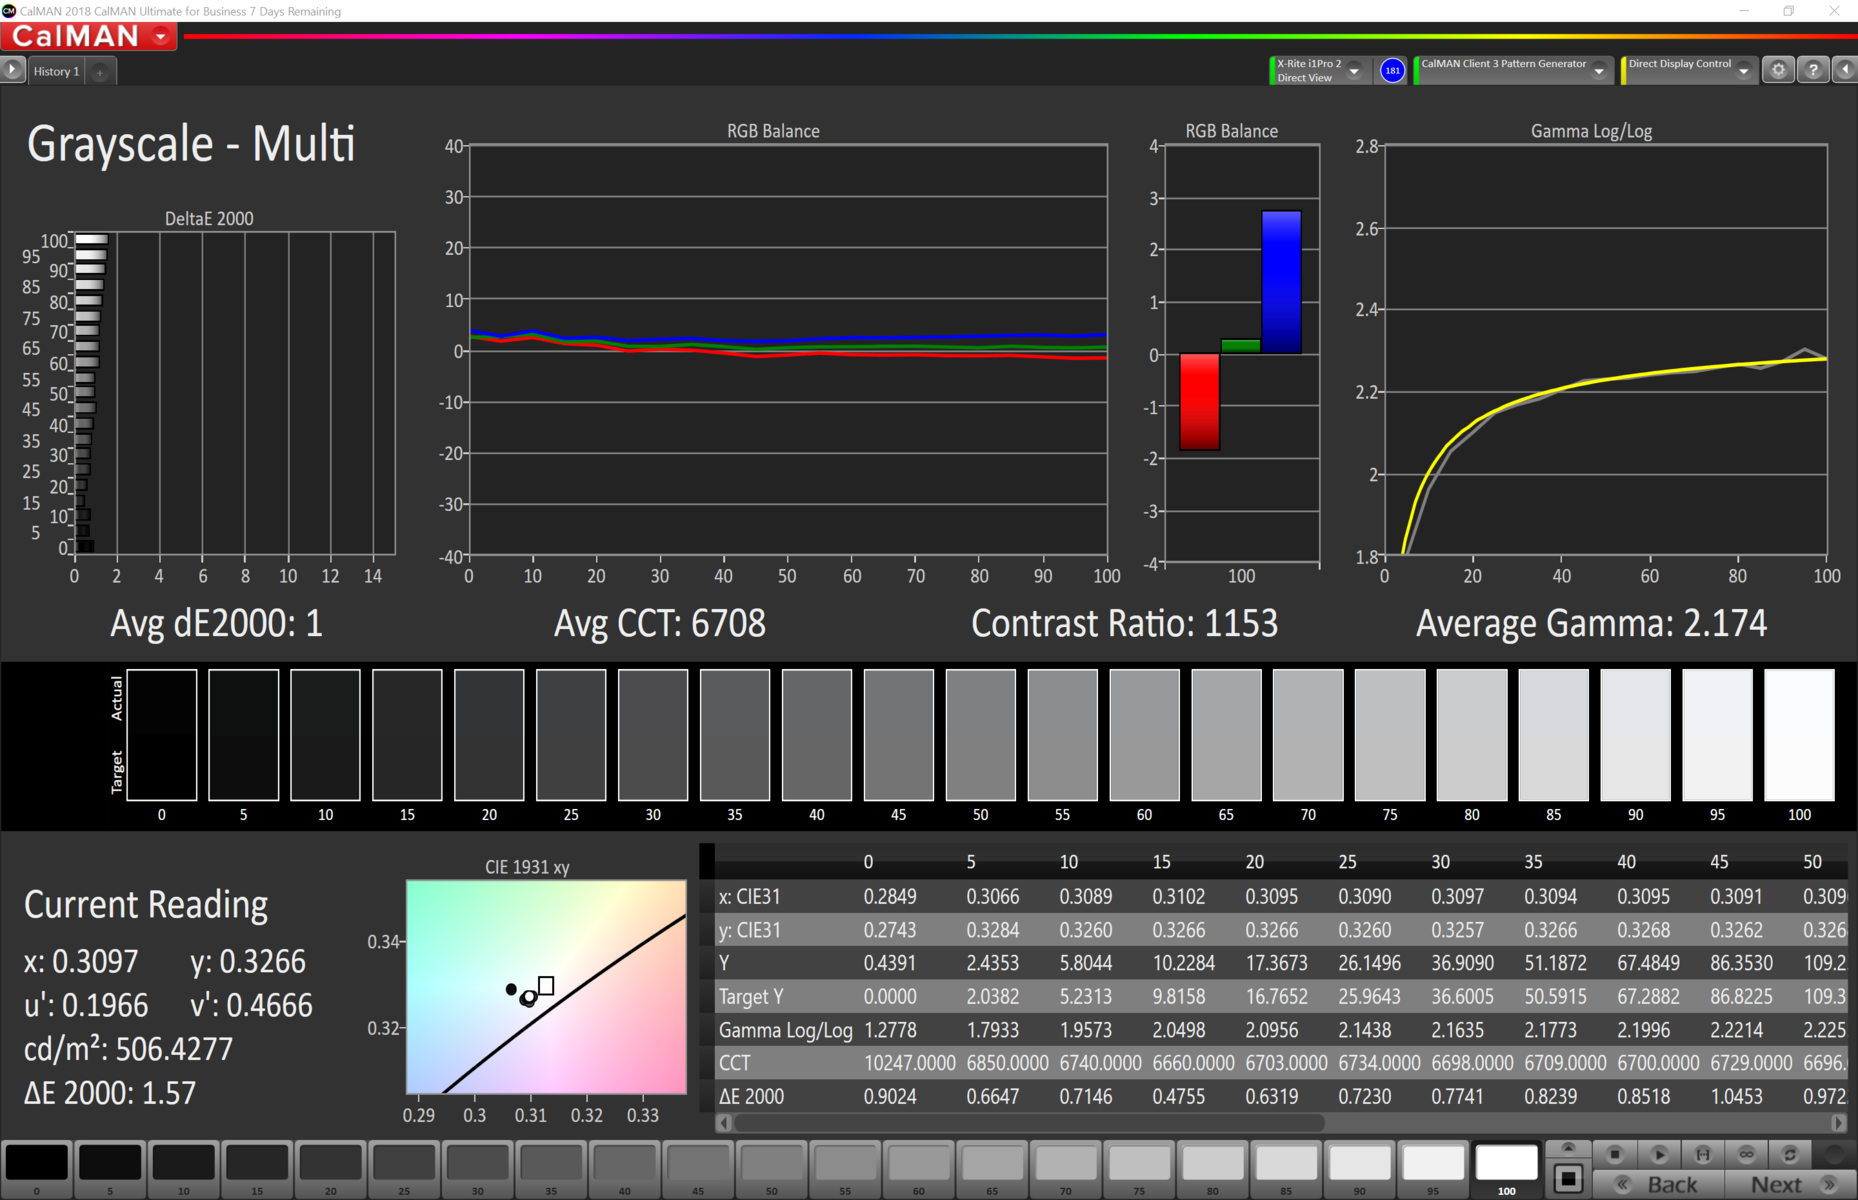
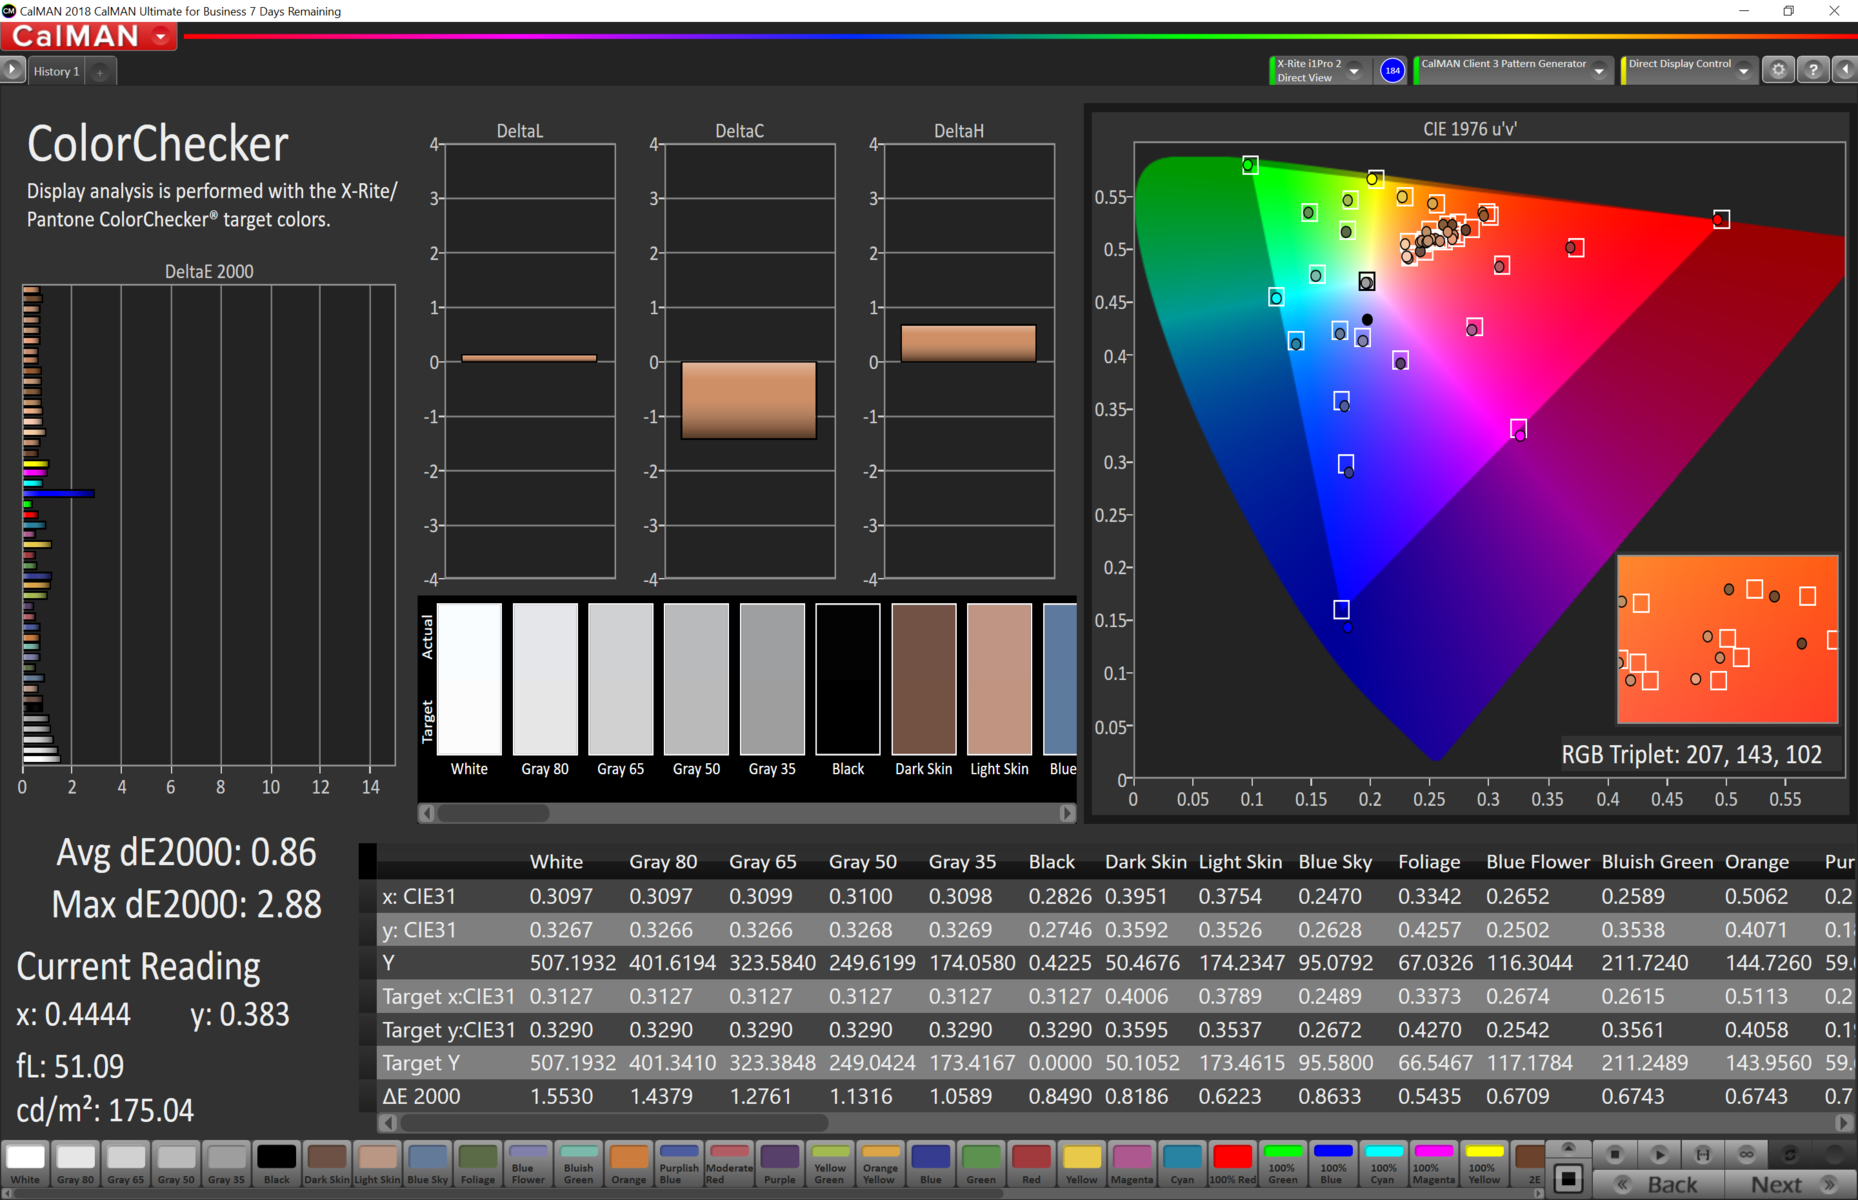
Additional calibration helped minimise deviations, with all metrics being better than the ideal value of three. You can find our calibrated ICC file in the box above our comparison table should you wish to use it. The display also completely covers the P3 and sRGB colour spaces, while its AdobeRGB coverage stands at 88.8%. Overall, the MacBook Pro 16 is colour accurate enough for professional image and video-editing.

Display Response Times
| ↔ Response Time Black to White | ||
|---|---|---|
| 34.9 ms ... rise ↗ and fall ↘ combined | ↗ 17.8 ms rise | 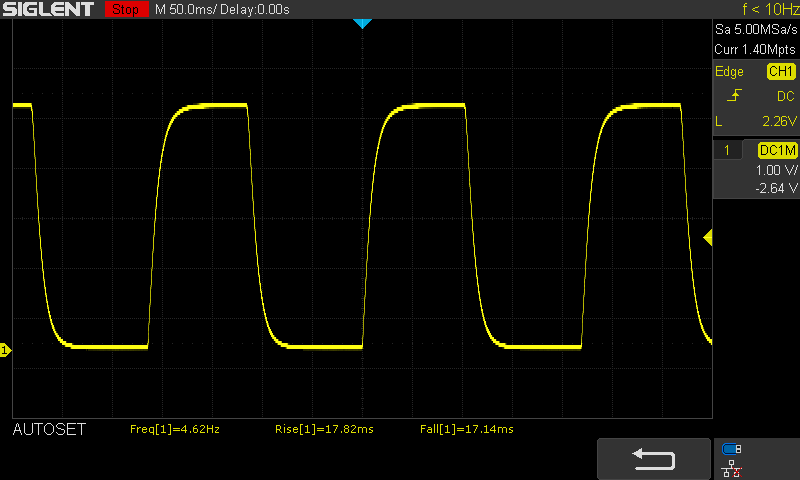 |
| ↘ 17.1 ms fall | ||
| The screen shows slow response rates in our tests and will be unsatisfactory for gamers. In comparison, all tested devices range from 0.1 (minimum) to 240 (maximum) ms. » 92 % of all devices are better. This means that the measured response time is worse than the average of all tested devices (20.1 ms). | ||
| ↔ Response Time 50% Grey to 80% Grey | ||
| 52.4 ms ... rise ↗ and fall ↘ combined | ↗ 23.9 ms rise | 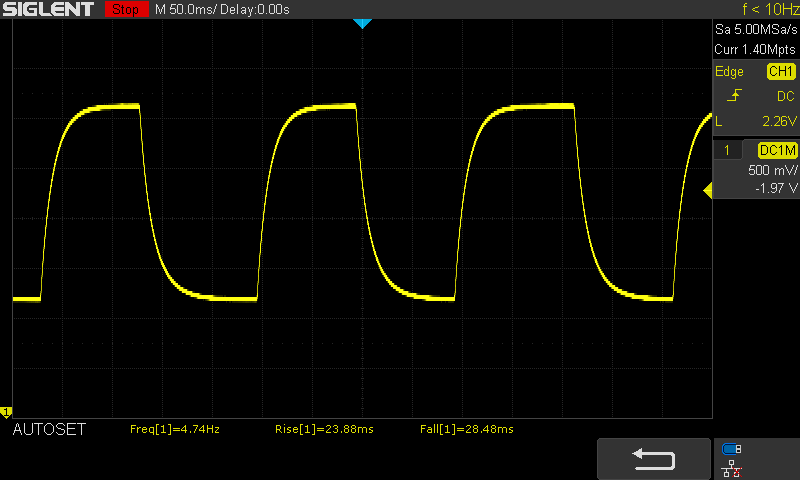 |
| ↘ 28.5 ms fall | ||
| The screen shows slow response rates in our tests and will be unsatisfactory for gamers. In comparison, all tested devices range from 0.165 (minimum) to 636 (maximum) ms. » 89 % of all devices are better. This means that the measured response time is worse than the average of all tested devices (31.4 ms). | ||
As we mentioned earlier, the MacBook Pro 16 flickers consistently at 131 kHz. While this could theoretically cause issues for those who are PWM sensitive, the frequency should be high enough not to affect most people's eyes. In short, the MacBook Pro 16 should not cause headaches or eyestrain after prolonged use.
Screen Flickering / PWM (Pulse-Width Modulation)
| Screen flickering / PWM detected | 131700 Hz | 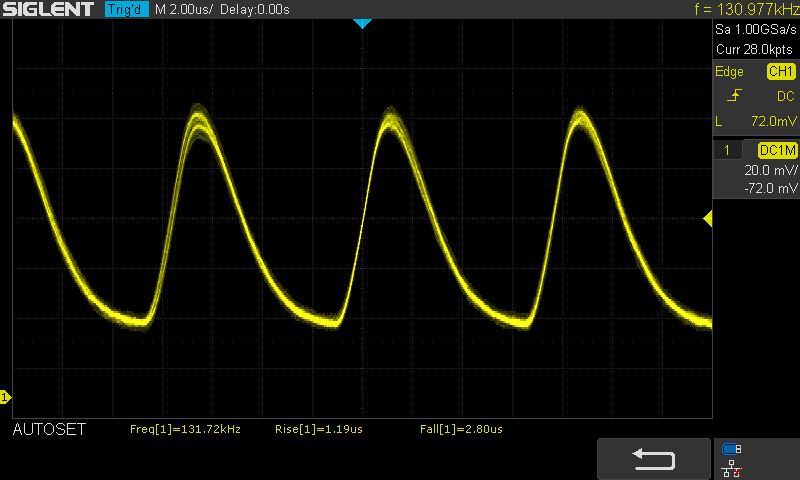 | |
The display backlight flickers at 131700 Hz (worst case, e.g., utilizing PWM) . The frequency of 131700 Hz is quite high, so most users sensitive to PWM should not notice any flickering. In comparison: 53 % of all tested devices do not use PWM to dim the display. If PWM was detected, an average of 7986 (minimum: 5 - maximum: 343500) Hz was measured. | |||
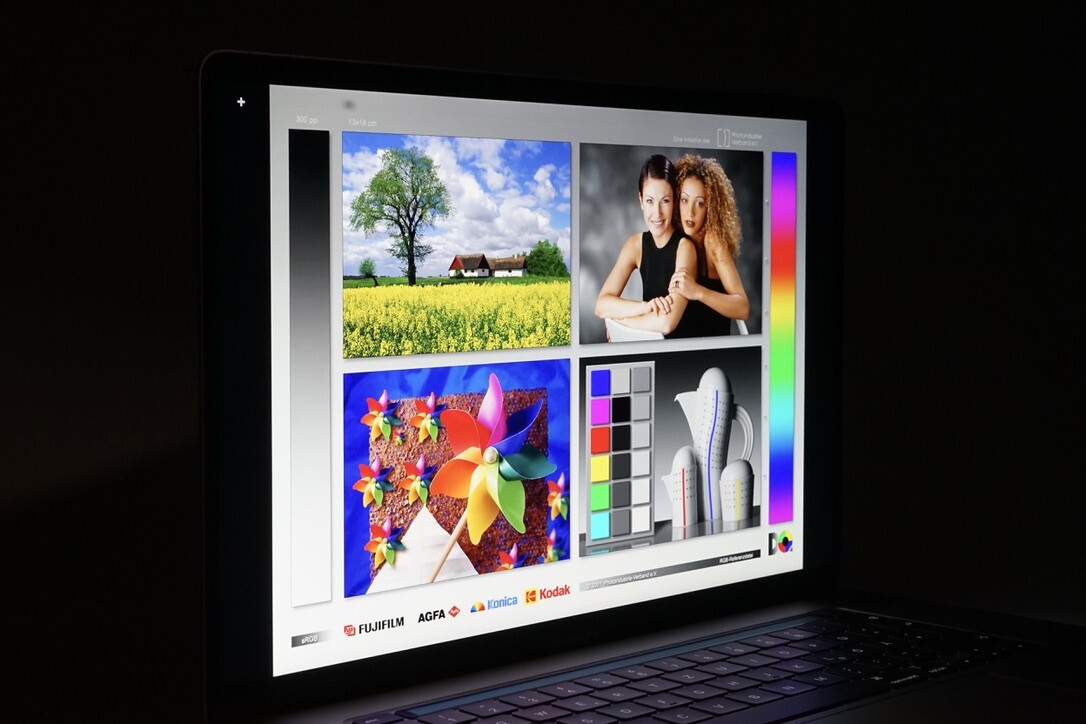
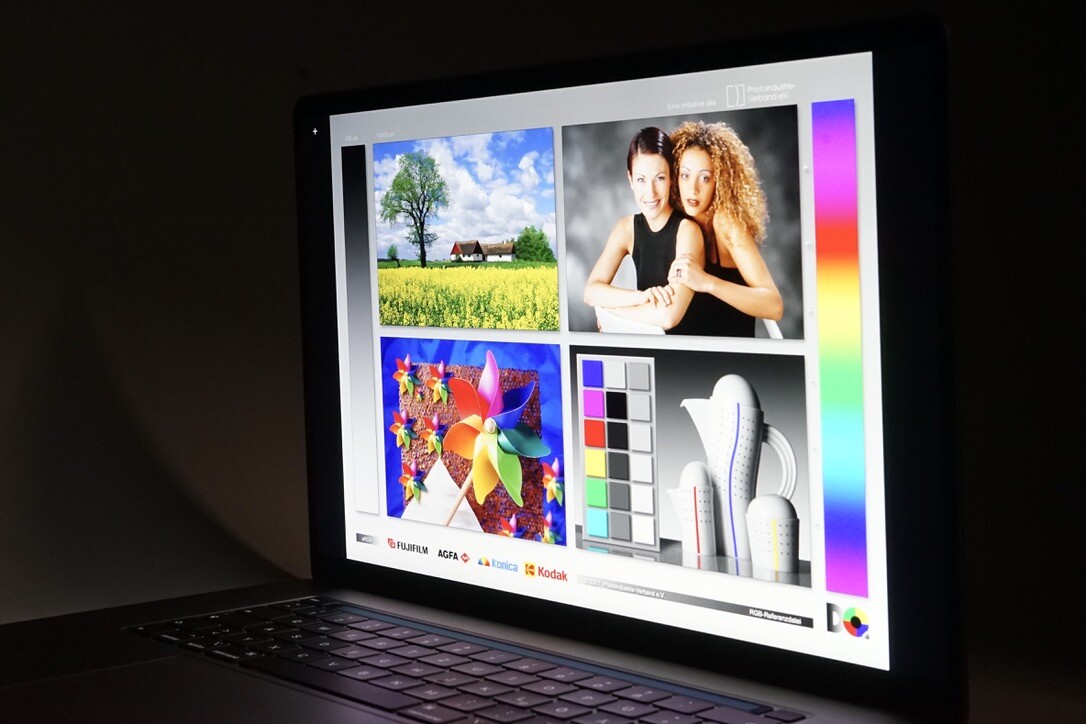
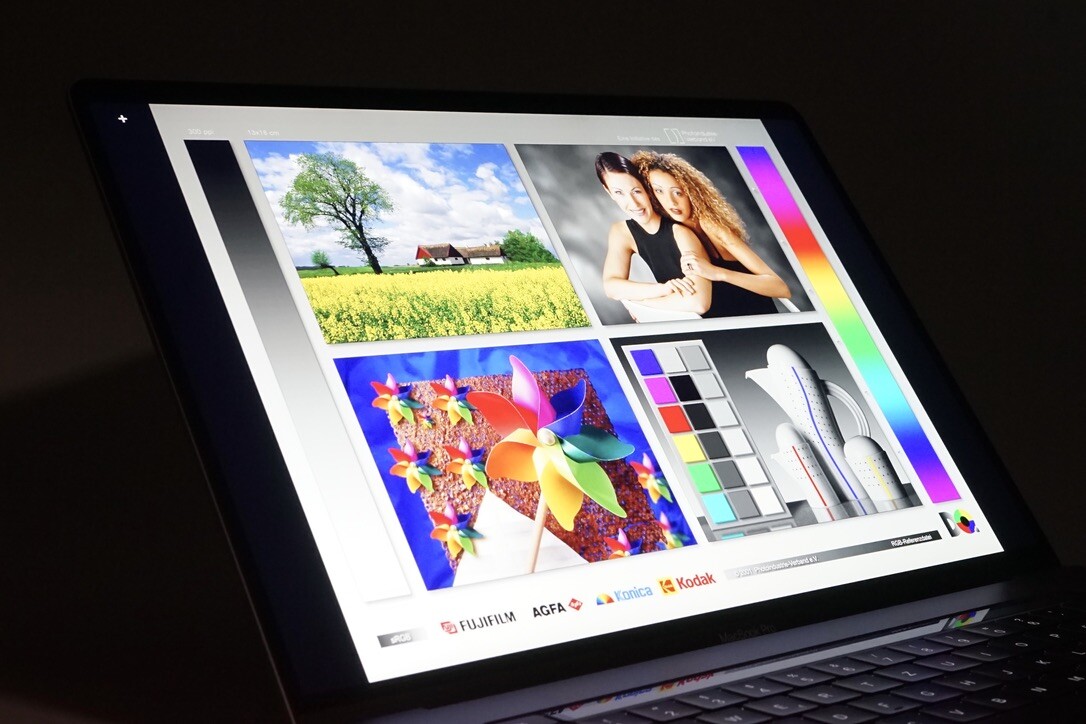
The IPS panel also has stable viewing angles, as the montage below demonstrates. Brightness drops off slightly at acute angles, but not worryingly so. Meanwhile, we encountered no colour distortion, making the MacBook Pro 16 readable from almost any angle.


Performance - A powerful mix of Navi and Coffee Lake
The MacBook Pro 16 is a very powerful multimedia laptop, irrespective of the version that you buy. Apple offers the device with hexa- or octa-core Coffee Lake processors, along with a choice between three AMD Radeon Pro GPUs. Strictly speaking it is only two, but the Radeon Pro 5500M comes in 4 GB and 8 GB variants. You can configure the MacBook Pro 16 with up to 64 GB of DDR4-2666 RAM and an 8 TB SSD too.
While we ran most of our benchmarks on macOS, we also ran them on Windows 10 using Boot Camp for the sake of comparability. Apple has optimised most drivers well for Windows 10 Boot Camp, making it a good alternative to macOS in most respects. However, you must put up with the dGPU being permanently enabled, which will impact battery life, while some benchmark results are lower than what they are in macOS for some reason.


Processor
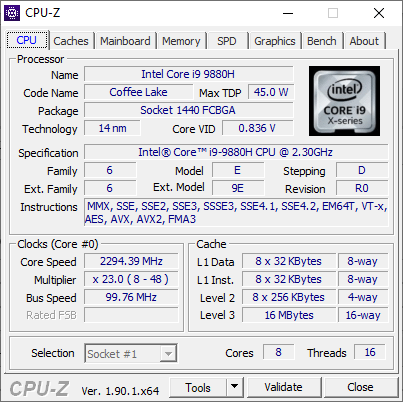
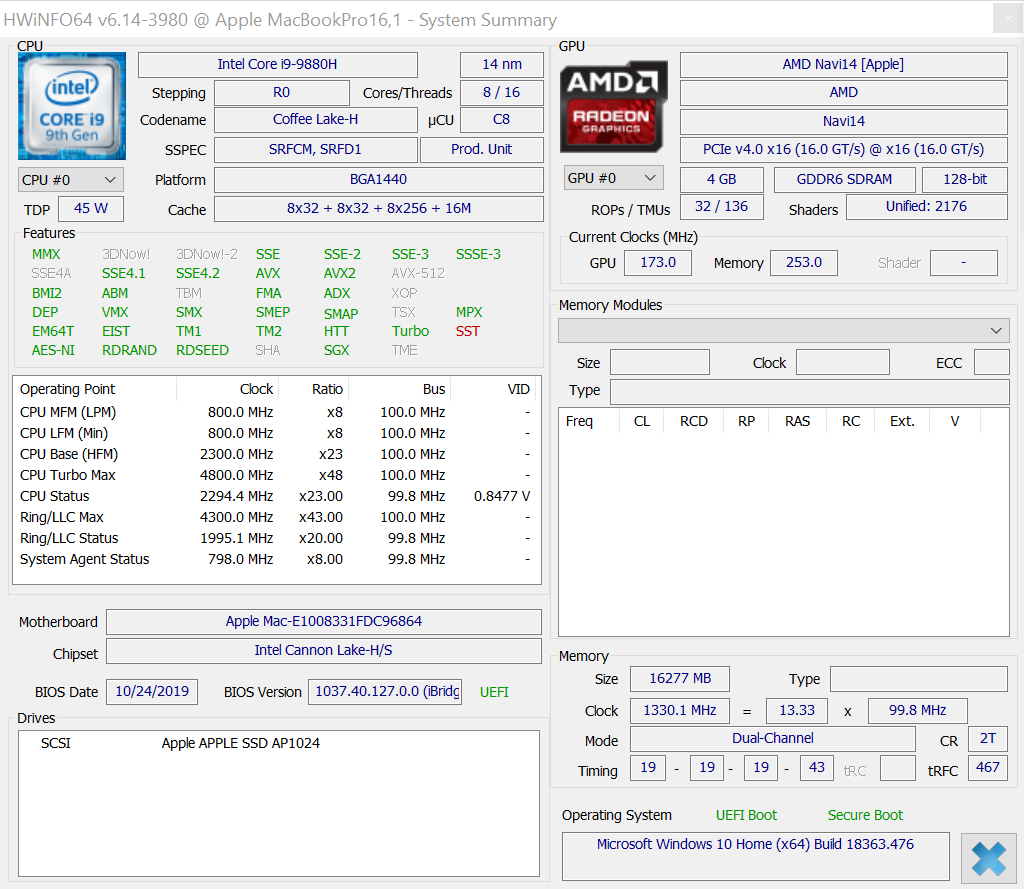
The Core i9-9880H powers our review unit, an octa-core processor that we have already benchmarked in the most recent MacBook Pro 15. Intel bases the chip on its Coffee Lake architecture, which it manufacturers on a 14 nm process and first introduced in Q3 2017. The Core i9-9880H supports Intel Hyper-Threading, allowing the processor to execute up to 16 threads simultaneously, and it can clock from 2.3 to 4.8 GHz. The CPU can only achieve its peak clock speeds by using Thermal Velocity Boost, though.
The level at which a processor performs depends on the quality of the cooling system with which OEMs pair it. The MacBook Pro 16 has a more robust cooling system than those which Apple included in its predecessors, which explains why it can achieve and maintain higher benchmark scores than the most recent MacBook Pro 15 can. The MacBook Pro 16 and its Core i9-9880H can even outperform the more powerful Core i9-9980HK in this year's MacBook Pro 15, underlining the superiority of the former's cooling system. Incidentally, our review unit achieved substantially better scores in Cinebench R15 Multi 64Bit when running macOS than Windows 10.
System Performance
While the MacBook Pro 16 tops all our PCMark benchmark tables, its dominance is even more remarkable than upon first glance. We had to rely on results achieved in Windows 10 here, so we are looking at how the MacBook Pro 16 compares against laptops running Windows 10 natively. Considering the performance gap between macOS and Windows 10 that we observed in our CPU benchmarks, the MacBook Pro 16 should have even better system performance when running macOS than our Windows 10 results would suggest.
| PCMark 8 Home Score Accelerated v2 | 4900 points | |
| PCMark 8 Creative Score Accelerated v2 | 7359 points | |
| PCMark 8 Work Score Accelerated v2 | 4812 points | |
| PCMark 10 Score | 5500 points | |
Help | ||
Storage Devices
Apple has been equipping MacBooks with in-house SSDs for several years now, which it pairs with its T2 security chip. The company solders both to the logic board, which means replacing the latter if either fail.
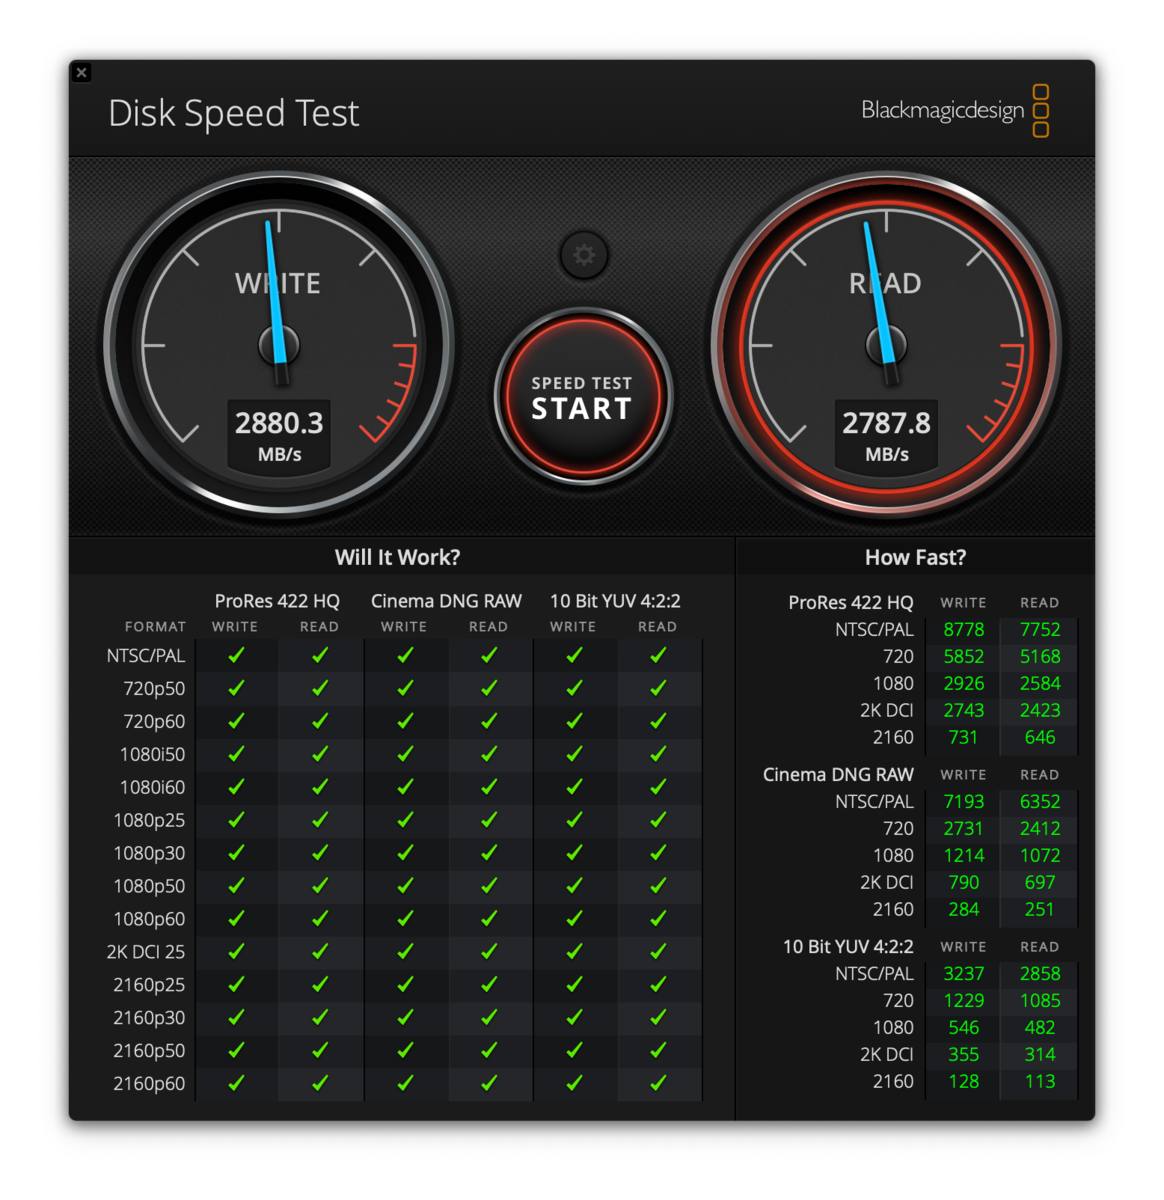
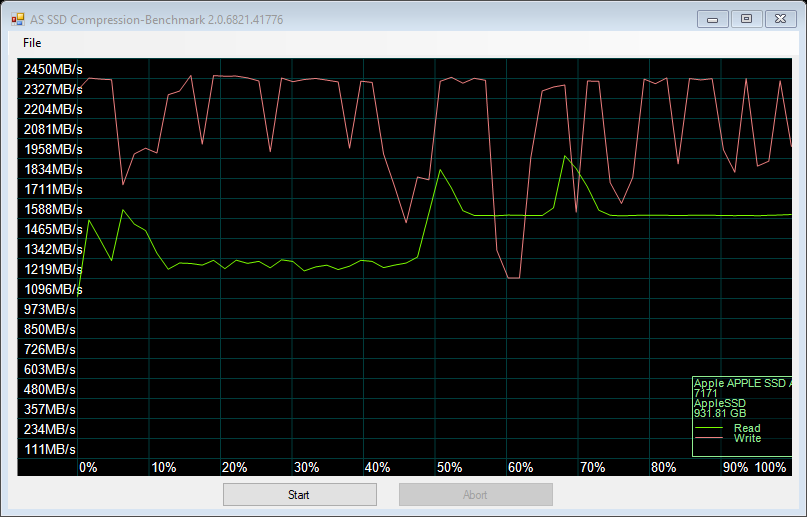
The 1 TB drive in our review unit achieved 2,800 MB/s transfer speeds on macOS 10.15.1, according to Blackmagic Disk Speed Test. The AP1024 can top this in Windows depending on the benchmarking tool used, though. However, the drive falls short of the class average in some areas. 4K transfer speeds with a queue depth of 1 are below-average, for instance, while it performed surprisingly weakly in the PCMark 8 Storage Test too. Overall, other drives like the Samsung 970 Pro edge out the AP1024 on performance. The differences are marginal though and will be hardly noticeable in daily use, if at all.
| Apple MacBook Pro 16 2019 i9 5500M Apple SSD AP1024 7171 | Dell XPS 15 7590 9980HK GTX 1650 Toshiba XG6 KXG60ZNV1T02 | Microsoft Surface Laptop 3 15 Ryzen 5 3580U SK hynix BC501 HFM256GDGTNG | Dell Precision 5540 SK hynix PC400 512 GB | Gigabyte Aero 17 XA RP77 Intel SSD 760p SSDPEKKW512G8 | Eurocom Nightsky RX15 Samsung SSD 970 Pro 512GB | |
|---|---|---|---|---|---|---|
| CrystalDiskMark 5.2 / 6 | 30% | -11% | 8% | 52% | 58% | |
| Write 4K (MB/s) | 55.5 | 104.3 88% | 99 78% | 98 77% | 169.6 206% | 153 176% |
| Read 4K (MB/s) | 16.21 | 45.23 179% | 35.63 120% | 41.25 154% | 58 258% | 60.5 273% |
| Write Seq (MB/s) | 1959 | 1729 -12% | 706 -64% | 1295 -34% | 1516 -23% | 1938 -1% |
| Read Seq (MB/s) | 1763 | 1861 6% | 1044 -41% | 1441 -18% | 2362 34% | 1932 10% |
| Write 4K Q32T1 (MB/s) | 398.5 | 509 28% | 326.6 -18% | 429.2 8% | 481.8 21% | 482.5 21% |
| Read 4K Q32T1 (MB/s) | 648 | 388.5 -40% | 270 -58% | 400.1 -38% | 506 -22% | 594 -8% |
| Write Seq Q32T1 (MB/s) | 2727 | 2813 3% | 820 -70% | 1366 -50% | 1530 -44% | 2324 -15% |
| Read Seq Q32T1 (MB/s) | 3242 | 2906 -10% | 2028 -37% | 2201 -32% | 2645 -18% | 3539 9% |
| AS SSD | 34% | -26% | 8% | -17% | 21% | |
| Seq Read (MB/s) | 2531 | 1723 -32% | 1122 -56% | 1743 -31% | 1812 -28% | 2352 -7% |
| Seq Write (MB/s) | 2289 | 1386 -39% | 514 -78% | 930 -59% | 1512 -34% | 2184 -5% |
| 4K Read (MB/s) | 15.85 | 43.25 173% | 34.98 121% | 39.1 147% | 32.68 106% | 28.65 81% |
| 4K Write (MB/s) | 39.88 | 98.3 146% | 96.8 143% | 92.1 131% | 107.7 170% | 61.3 54% |
| 4K-64 Read (MB/s) | 1267 | 1078 -15% | 492 -61% | 956 -25% | 504 -60% | 1317 4% |
| 4K-64 Write (MB/s) | 1749 | 1456 -17% | 339.9 -81% | 863 -51% | 534 -69% | 2156 23% |
| Access Time Read * (ms) | 0.122 | 0.05 59% | 0.056 54% | 0.074 39% | 0.05 59% | 0.101 17% |
| Access Time Write * (ms) | 0.095 | 0.039 59% | 0.11 -16% | 0.053 44% | 0.227 -139% | 0.09 5% |
| Score Read (Points) | 1536 | 1294 -16% | 639 -58% | 1170 -24% | 718 -53% | 1581 3% |
| Score Write (Points) | 2018 | 1693 -16% | 488 -76% | 1048 -48% | 793 -61% | 2435 21% |
| Score Total (Points) | 4317 | 3638 -16% | 1434 -67% | 2781 -36% | 1871 -57% | 4813 11% |
| Copy ISO MB/s (MB/s) | 1995 | 3182 59% | 828 -58% | 946 -53% | 2705 36% | |
| Copy Program MB/s (MB/s) | 584 | 984 68% | 200.5 -66% | 414.3 -29% | 666 14% | |
| Copy Game MB/s (MB/s) | 1135 | 1824 61% | 387.4 -66% | 1263 11% | 1583 39% | |
| PCMark 8 | ||||||
| Storage Score v2 (Points) | 1818 | |||||
| Total Average (Program / Settings) | 32% /
33% | -19% /
-21% | 8% /
8% | 18% /
8% | 40% /
35% |
* ... smaller is better

Graphics Card
GPU performance is one of the biggest advantages that the MacBook Pro 16 has over its predecessors. The machine comes with either a Radeon Pro 5300M or a Radeon Pro 5500M, although Apple offers the latter in 4 and 8 GB variants. TSMC manufactures both GPUs on its modern 7 nm process under instruction from AMD. The Radeon Pro models are based on the same Navi architectures as their Radeon RX counterparts, but they have two additional Compute Units (CUs) than the latter has. However, the Radeon Pro cards run at lower clock speeds and at lower TDPs than their Radeon RX equivalents do.
While the Radeon Pro 5500M and Radeon RX 5500M share similar names, the former often finished well short of the latter in synthetic GPU benchmarks. Clearly, the higher TDP and clock speeds of the Radeon RX 5500M can compensate against the two additional CUs that the Radeon Pro 5500M has. The latter generally outperforms the NVIDIA GeForce GTX 1650, though.
The Radeon Pro 5500M also has the edge over the Radeon Pro Vega 20 and Radeon Pro 560X found in its 15-inch predecessors. We lack detailed Windows 10 benchmark results for the Radeon Pro Vega 16 and Radeon Pro Vega 20. However, the latter is about 20% slower than the Radeon Pro 5500M in Unigine Valley 1.0, which should give you an idea of the performance advantage that Navi has over the Vega architecture.
| 3DMark 06 Standard Score | 34321 points | |
| 3DMark 11 Performance | 14097 points | |
| 3DMark Cloud Gate Standard Score | 30690 points | |
| 3DMark Fire Strike Score | 9196 points | |
| 3DMark Time Spy Score | 3629 points | |
Help | ||
SpecViewPerf 13
Gaming Performance
We have mainly focussed on gaming performance via Boot Camp as Windows 10 offers a superior selection of games from which to benchmark than macOS. Windows 10 also offers better gaming performance than macOS does. Expectedly, the Radeon Pro 5500M cannot match the performance that the Radeon RX 5500M offers, but it does generally outperform the GeForce GTX 1650 in games running at ultra graphics. The GeForce GTX 1660 Ti Max-Q proved too much for the Radeon Pro 5500M, though.
| Deus Ex Mankind Divided - 1920x1080 Ultra Preset AA:2xMS AF:8x | |
| Average NVIDIA GeForce GTX 1660 Ti Mobile (n=1) | |
| Apple MacBook Pro 16 2019 i9 5500M | |
| Average NVIDIA GeForce GTX 1650 Mobile (n=1) | |
| Apple MacBook Pro 15 2018 (2.6 GHz, 560X) | |
| Rage 2 - 1920x1080 Ultra Preset (Resolution Scale Off) | |
| Average NVIDIA GeForce GTX 1660 Ti Mobile (67.9 - 68.8, n=2) | |
| Average NVIDIA GeForce GTX 1660 Ti Max-Q (58.2 - 64.8, n=2) | |
| MSI Alpha 15 A3DDK | |
| Average NVIDIA GeForce GTX 1650 Mobile (45.1 - 60, n=3) | |
| Apple MacBook Pro 16 2019 i9 5500M | |
| Borderlands 3 - 1920x1080 Badass Overall Quality (DX11) | |
| Average NVIDIA GeForce GTX 1660 Ti Mobile (46.6 - 48.6, n=3) | |
| Average NVIDIA GeForce GTX 1660 Ti Max-Q (41.5 - 42.3, n=2) | |
| MSI Alpha 15 A3DDK | |
| Average NVIDIA GeForce GTX 1650 Mobile (29 - 34.6, n=5) | |
| Apple MacBook Pro 16 2019 i9 5500M | |
| Apple MacBook Pro 15 2018 (2.6 GHz, 560X) | |
| Ghost Recon Breakpoint - 1920x1080 Ultra Preset AA:T | |
| Average NVIDIA GeForce GTX 1660 Ti Mobile (51 - 55, n=2) | |
| Average NVIDIA GeForce GTX 1660 Ti Max-Q (48 - 51, n=2) | |
| Apple MacBook Pro 16 2019 i9 5500M | |
| Average NVIDIA GeForce GTX 1650 Mobile (30 - 37, n=2) | |
| MSI Alpha 15 A3DDK | |
| Apple MacBook Pro 15 2018 (2.6 GHz, 560X) | |
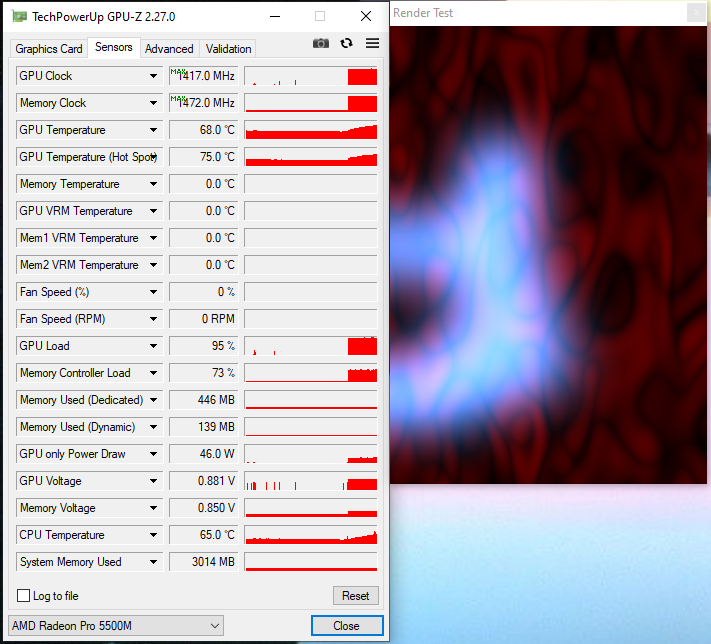
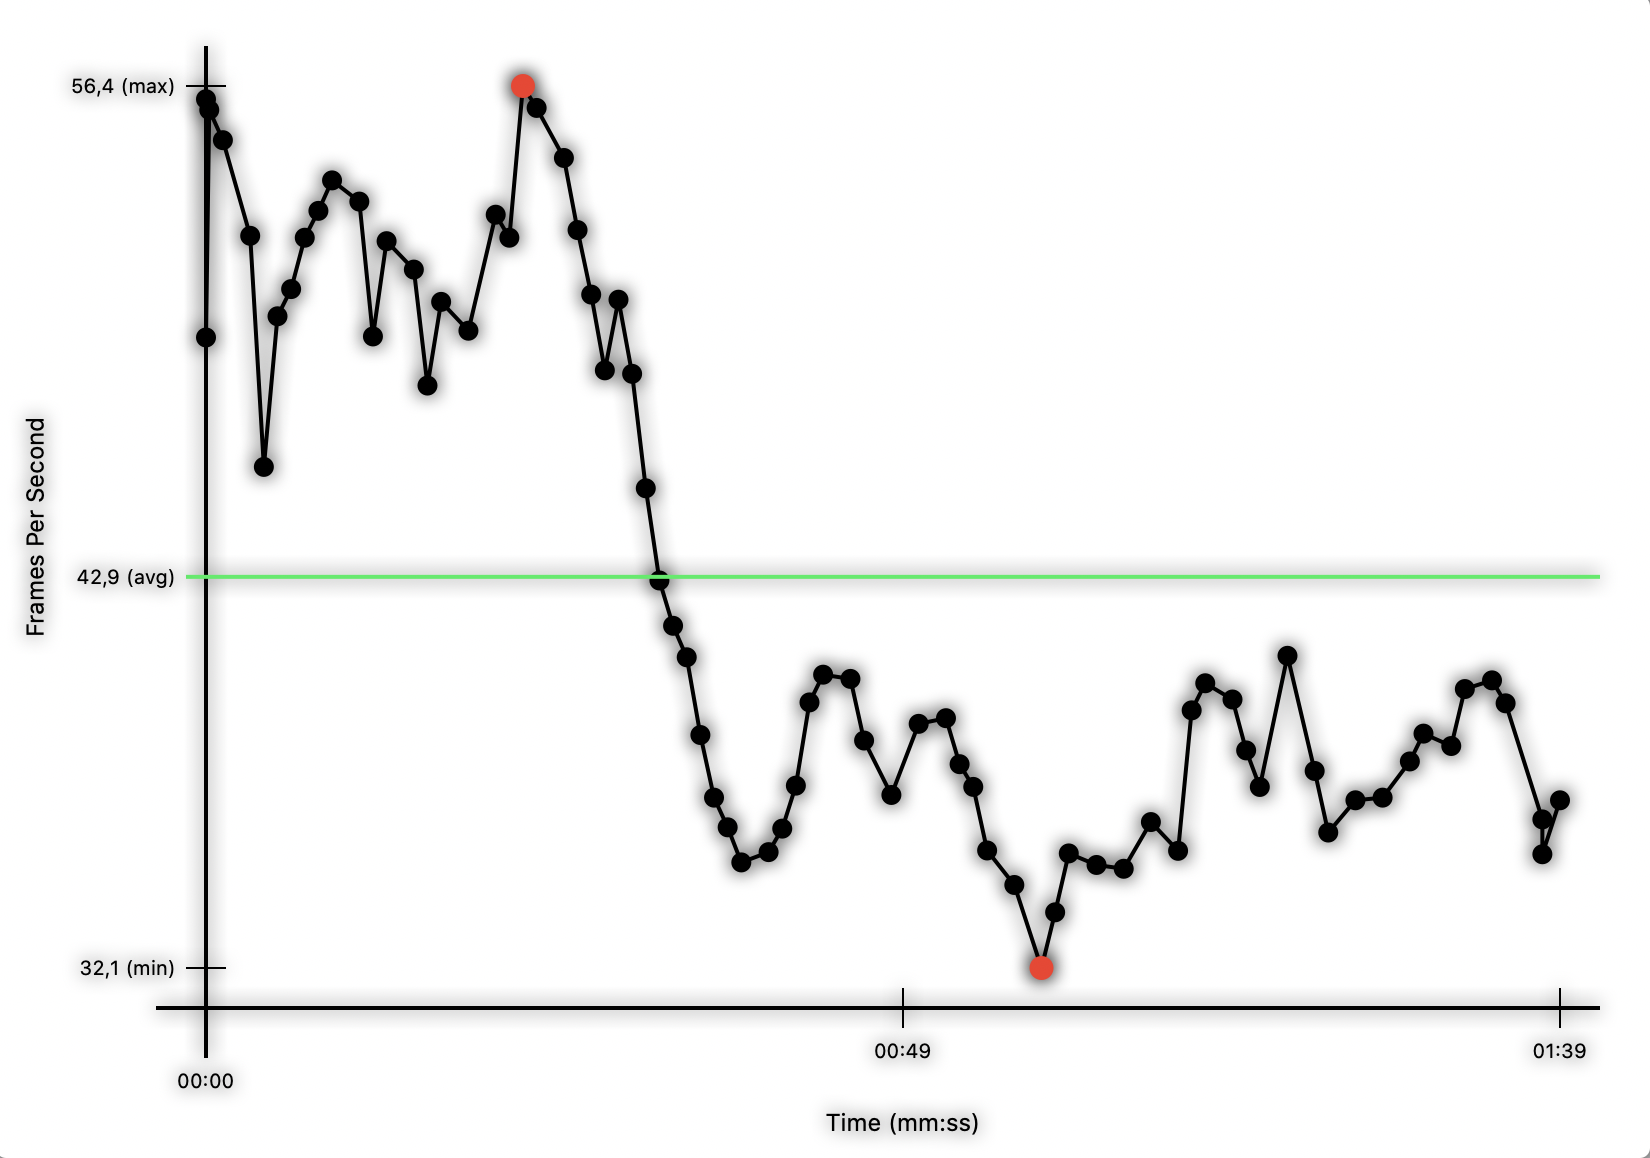
We have good news about GPU throttling; there is none. Our review unit maintained peak framerates during our The Witcher 3 endurance test, as the graph below demonstrates. Likewise, it achieved 98.2% in the 3DMark Sky Diver stress test, so you should encounter no GPU throttling even during prolonged use.
In general, the Radeon Pro 5500M is powerful enough for gaming in 1080p at high graphics levels on Windows 10. There are a few exceptions like Borderlands 3 and Metro Exodus, but simpler titles like FIFA 20 or Dota 2 Reborn remain playable at 4K on external monitors.
| low | med. | high | ultra | QHD | 4K | |
|---|---|---|---|---|---|---|
| Counter-Strike: GO (2012) | 208 | 118 | 71.4 | |||
| GTA V (2015) | 168 | 91.4 | 47.6 | 34.5 | 32.3 | |
| The Witcher 3 (2015) | 68 | 38.8 | ||||
| Dota 2 Reborn (2015) | 137 | 125 | 111 | 107 | 53.9 | |
| World of Warships (2015) | 43.4 | |||||
| Rainbow Six Siege (2015) | 126 | 44.8 | ||||
| Overwatch (2016) | 98 | |||||
| Deus Ex Mankind Divided (2016) | 52 | 27.8 | 16.9 | |||
| Rocket League (2017) | 153 | 107 | 59 | |||
| Final Fantasy XV Benchmark (2018) | 48.4 | 20.4 | ||||
| World of Tanks enCore (2018) | 76 | 49.1 | 24.6 | |||
| Far Cry 5 (2018) | 55 | 40 | 20 | |||
| Shadow of the Tomb Raider (2018) | 120 | 58 | 54 | 46 | 30 | 13 |
| Battlefield V (2018) | 85 | 76 | 62 | 58.9 | 47 | 14.4 |
| Apex Legends (2019) | 63 | 43.5 | ||||
| Far Cry New Dawn (2019) | 86 | 67 | 64 | 57 | 41 | 21 |
| Metro Exodus (2019) | 92 | 47.1 | 34.3 | 28.6 | 22 | |
| Dirt Rally 2.0 (2019) | 90 | 50.2 | 35.8 | |||
| The Division 2 (2019) | 56 | 39 | ||||
| Anno 1800 (2019) | 67 | 44.6 | 21.7 | |||
| Rage 2 (2019) | 113 | 53.7 | 45.2 | 44.4 | 28.4 | |
| Total War: Three Kingdoms (2019) | 175 | 64.1 | 40.5 | 29.7 | 19 | 7 |
| F1 2019 (2019) | 174 | 105 | 97 | 65 | 49 | |
| Control (2019) | 139 | 41.5 | 29.2 | 18.1 | ||
| Borderlands 3 (2019) | 41.4 | 30.8 | 21.4 | 3.8 | ||
| FIFA 20 (2019) | 144 | 124 | 90 | |||
| Ghost Recon Breakpoint (2019) | 50 | 35 | ||||
| GRID 2019 (2019) | 46.3 | 36.6 | 23.2 | |||
| Call of Duty Modern Warfare 2019 (2019) | 34.7 | |||||
| Need for Speed Heat (2019) | 74 | 56.7 | 50.9 | 44.7 | 28 | 12.8 |
| Star Wars Jedi Fallen Order (2019) | 75 | 61 | 54.3 | 35 | 16.2 | |
| Red Dead Redemption 2 (2019) | 97.6 | 55.2 | 35.8 | 20.9 | 0 () | 0 () |
| Fall Guys (2020) | 59.4 | 59.4 | 38.1 | |||
| Hearthstone (2020) | 33.2 | 32 | 59.7 | 59.6 | ||
| Doom Eternal (2020) | 84.8 | 47.5 | 27.5 | 21.9 | 15.1 | |
| Gears Tactics (2020) | 60 | 47.6 | 30.7 | |||
| F1 2020 (2020) | 0 game wont start | |||||
| Flight Simulator 2020 (2020) | 47.4 | 28 | 19.2 | 12.2 | ||
| Mafia Definitive Edition (2020) | 52.5 | 37.5 | ||||
| Star Wars Squadrons (2020) | 95.6 | 69.7 | 26.4 | |||
| FIFA 21 (2020) | 151 | 115 | 70 | |||
| Cyberpunk 2077 1.0 (2020) | 54.8 | 29.9 | 23.5 | |||
| Hitman 3 (2021) | 157 | 81.3 | 66.3 | 62 | ||
| Outriders (2021) | 70.7 | 44.4 | 36 | 27.6 | ||
| Resident Evil Village (2021) | 81.7 | 38.9 | 40.6 | |||
| Far Cry 6 (2021) | 0 game wont start | |||||
| Riders Republic (2021) | 61 | 41 | 28 | |||
| Call of Duty Vanguard (2021) | 43.1 | 21.7 | ||||
| Forza Horizon 5 (2021) | 85 | 31 |
Gaming on macOS - doable but not recommended
We also looked at gaming performance on macOS in case you did not fancy running Boot Camp. In short, the experience is not as good as it is on Windows 10. While Planetary Annihilation: TITANS remains playable at maximum graphics and the display's native resolution, we would recommend running League of Legends at a slightly reduced resolution if you are an avid gamer. Unfortunately, we could not show the frame rates our unit achieved when playing League of Legends.
Conversely, the MacBook Pro 16 could only average 40 FPS in Fortnite at 1636x960 and maximum graphics. The game does a wonderful job of scaling though, so do not let the resolution put you off. Meanwhile, Planetary Annihilations ran at 60 FPS natively and at maximum graphics, as we implied earlier. We achieved 60 FPS while playing skirmish games with two computers, for reference.
Overall, we would recommend using Windows 10 if you are planning on gaming with the MacBook Pro 16. Doing so will not only deliver a better gaming experience than macOS offers as many games are optimised better for DirectX but also a wider library of games from which to choose.
Emissions - Quiet fans and excellent speakers, but high internal temperatures
Fan Noise
As usual, Apple favours higher internal temperatures to keep the MacBook Pro 16 running quietly. The two fans are almost inaudible when our review unit is idling, although we can hear them with our ear around 10 cm away from the top case. Fan noise peaked at 46.1 dB(A) during our tests but averaged at a slightly quieter 43 dB(A). Subjectively, the fans in our review unit always sounded pleasant to our ears, even under maximum load. We noticed no high-pitched frequencies or coil whine during our tests, either.
Noise level
| Idle |
| 29.9 / 29.9 / 29.9 dB(A) |
| Load |
| 43 / 46.1 dB(A) |
 | ||
30 dB silent 40 dB(A) audible 50 dB(A) loud |
||
min: | ||
Temperature
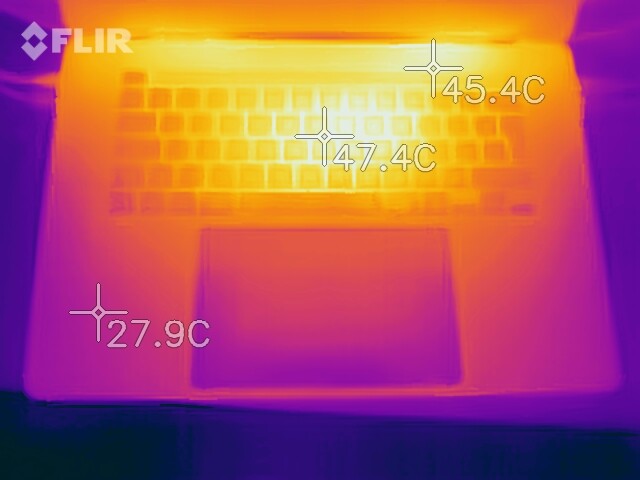
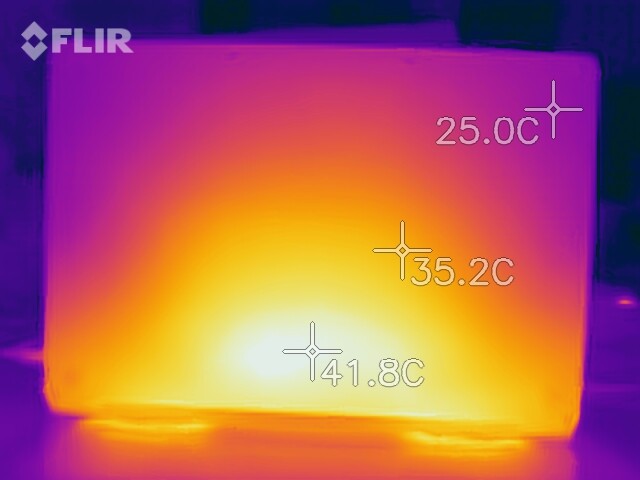
The MacBook Pro 16 remains relatively cool to the touch under load too. Surface temperatures peaked at 42 °C during our tests, which we determined by calibrated contact measurements. We should point out that infrared images recorded higher values, but these are not as accurate. We also measured these surface temperatures at relatively low ambient temperatures, so the MacBook Pro 16 may hit higher temperatures in more tropical climates.
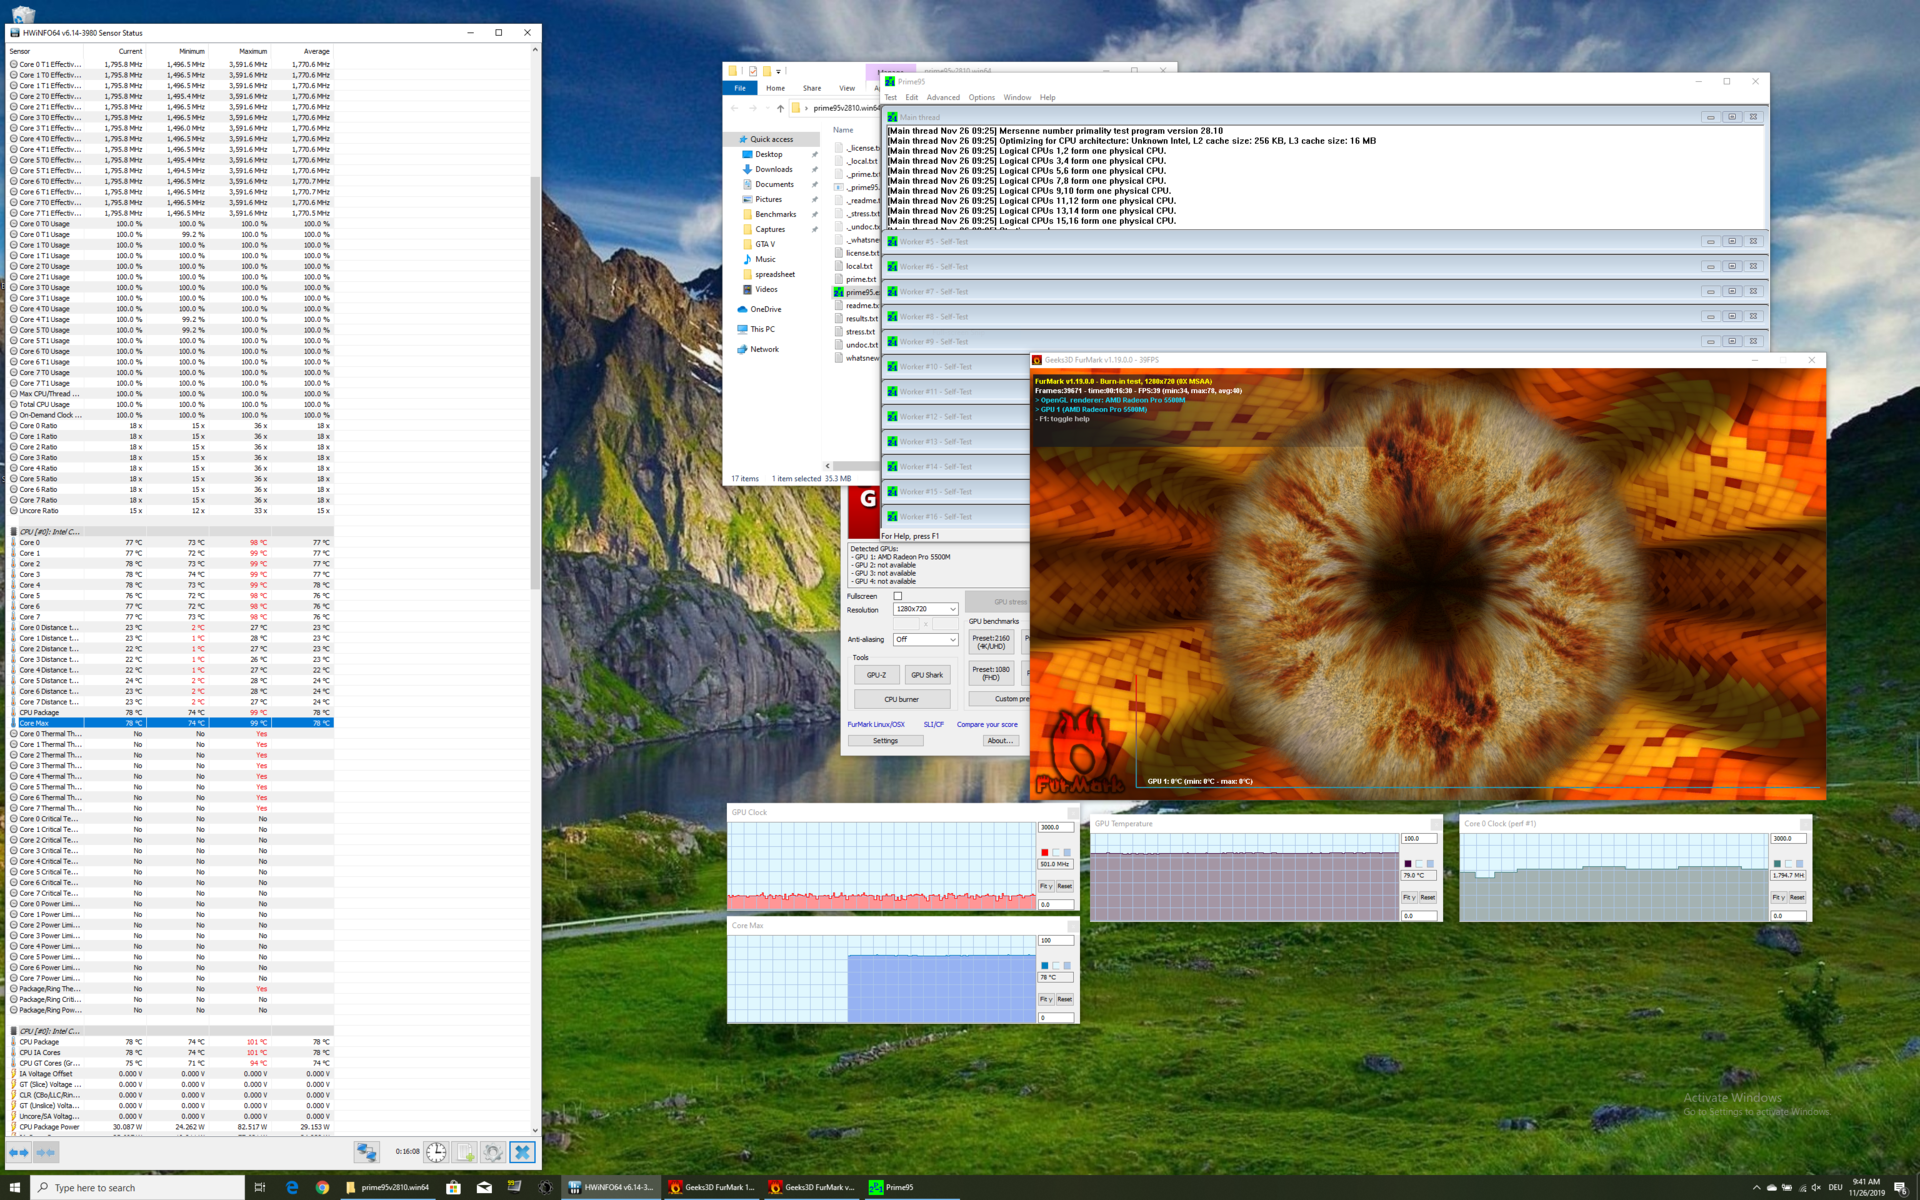
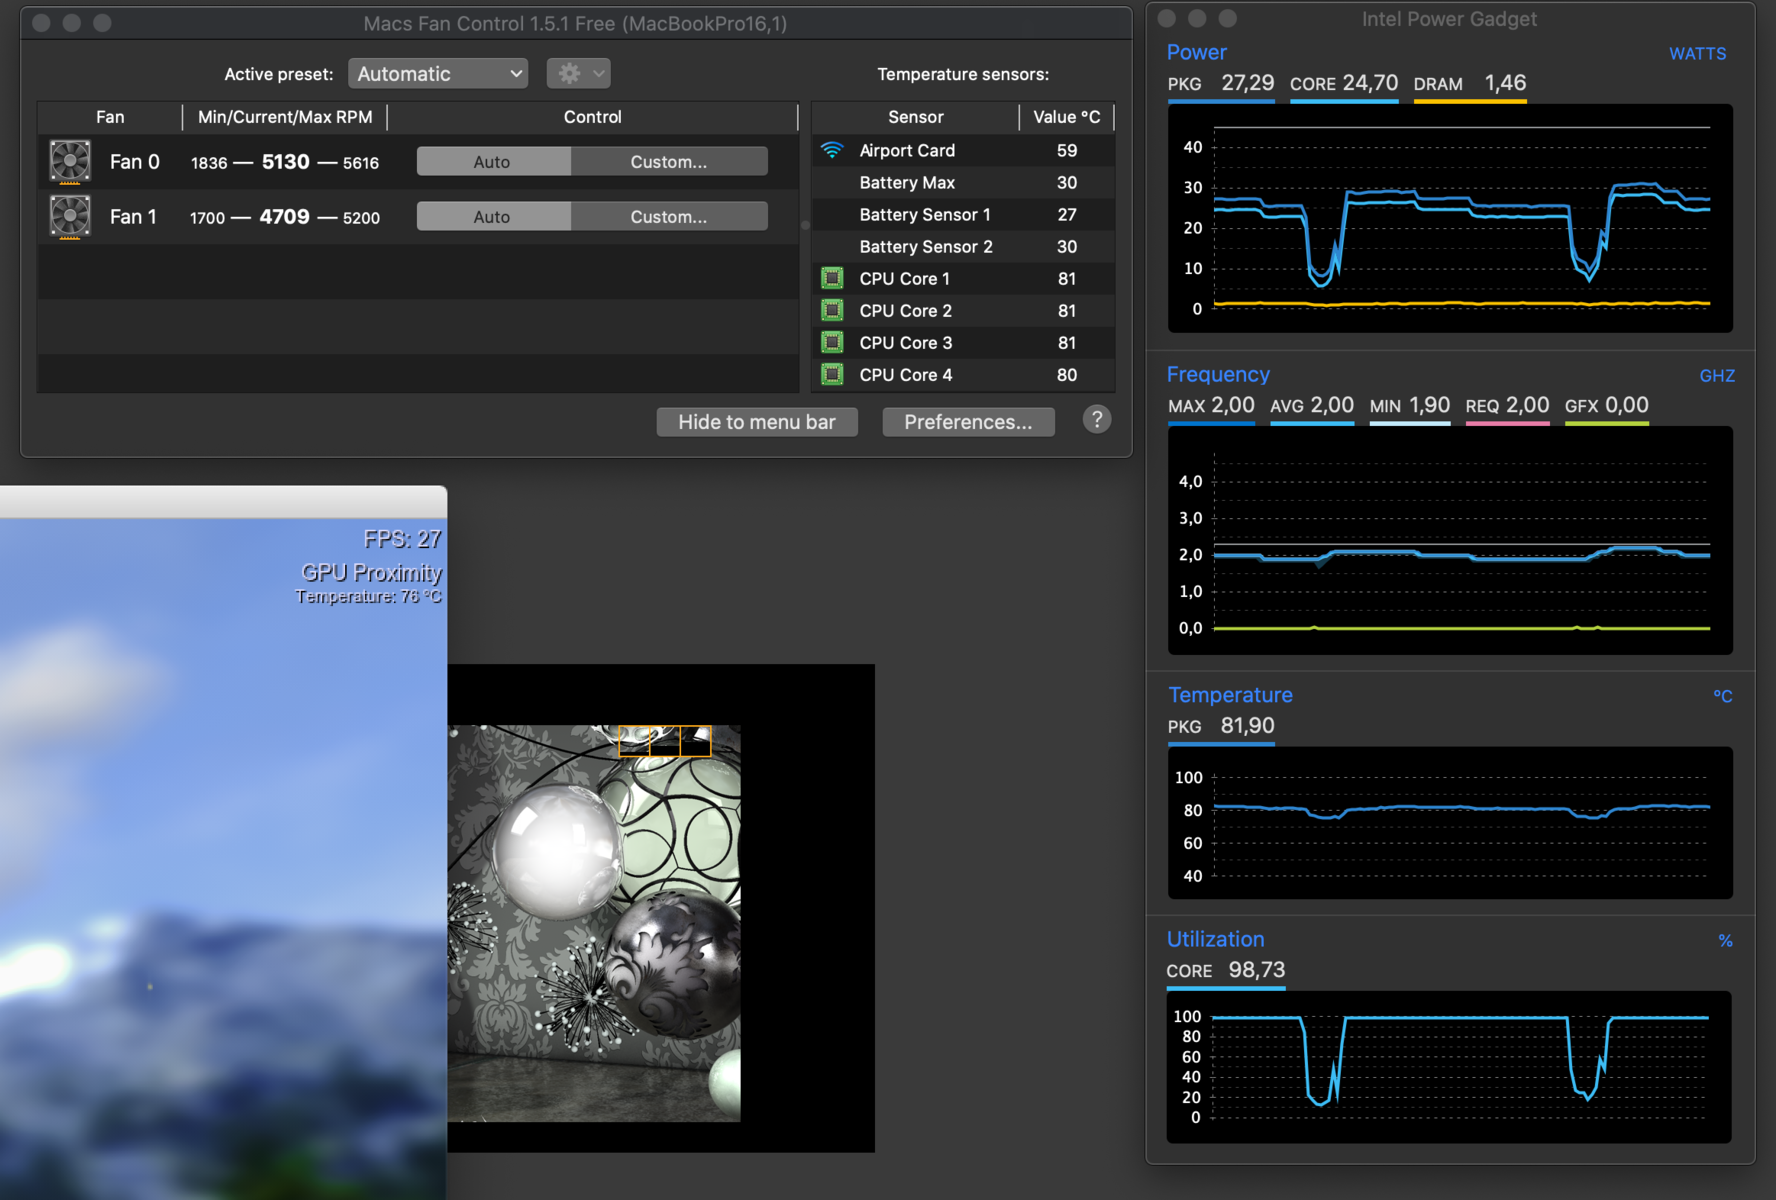
We also subjected our review unit to a stress test, during which CPU core temperatures reach 99 °C before its fans manage to get them under control. Core temperatures eventually settle at 77 °C, which is sustainable. Even GPU core temperatures remain at a non-critical 79 °C, so you should not experience any throttling with either component. A similar picture occurred when we stress-tested our machine in macOS, where CPU and GPU core temperatures settled at around 82 °C and 76 °C, respectively.
(±) The maximum temperature on the upper side is 42 °C / 108 F, compared to the average of 36.9 °C / 98 F, ranging from 21 to 71 °C for the class Multimedia.
(+) The bottom heats up to a maximum of 38 °C / 100 F, compared to the average of 39.1 °C / 102 F
(+) In idle usage, the average temperature for the upper side is 22.8 °C / 73 F, compared to the device average of 31.3 °C / 88 F.
(+) The palmrests and touchpad are cooler than skin temperature with a maximum of 27 °C / 80.6 F and are therefore cool to the touch.
(±) The average temperature of the palmrest area of similar devices was 28.7 °C / 83.7 F (+1.7 °C / 3.1 F).
Speakers
Although Apple is already the standard for laptop speakers in our opinion, the company has outdone itself on the MacBook Pro 16. The ones in our review unit have a linear frequency spectrum and offer good bass response, something that few other laptops can do. They do not get quite as loud as the speakers in the XPS 15 7590, though. The MacBook Pro 16 offers better bass than the MacBook Pro 15 does too, but at the cost of high-pitched tones.
Overall, the MacBook Pro 16 has excellent speakers. They even offer better audio quality than many Bluetooth speakers, in our opinion.
Apple MacBook Pro 16 2019 i9 5500M audio analysis
(+) | speakers can play relatively loud (82.3 dB)
Bass 100 - 315 Hz
(+) | good bass - only 2.3% away from median
(+) | bass is linear (5% delta to prev. frequency)
Mids 400 - 2000 Hz
(+) | balanced mids - only 2.7% away from median
(+) | mids are linear (3.4% delta to prev. frequency)
Highs 2 - 16 kHz
(+) | balanced highs - only 2.1% away from median
(+) | highs are linear (2.6% delta to prev. frequency)
Overall 100 - 16.000 Hz
(+) | overall sound is linear (6.9% difference to median)
Compared to same class
» 5% of all tested devices in this class were better, 1% similar, 95% worse
» The best had a delta of 5%, average was 17%, worst was 45%
Compared to all devices tested
» 1% of all tested devices were better, 0% similar, 99% worse
» The best had a delta of 4%, average was 24%, worst was 134%
Dell XPS 15 7590 9980HK GTX 1650 audio analysis
(+) | speakers can play relatively loud (88.4 dB)
Bass 100 - 315 Hz
(-) | nearly no bass - on average 24.9% lower than median
(±) | linearity of bass is average (14.4% delta to prev. frequency)
Mids 400 - 2000 Hz
(+) | balanced mids - only 2.8% away from median
(±) | linearity of mids is average (7.8% delta to prev. frequency)
Highs 2 - 16 kHz
(+) | balanced highs - only 1.9% away from median
(+) | highs are linear (5.3% delta to prev. frequency)
Overall 100 - 16.000 Hz
(±) | linearity of overall sound is average (17.8% difference to median)
Compared to same class
» 51% of all tested devices in this class were better, 8% similar, 42% worse
» The best had a delta of 5%, average was 17%, worst was 45%
Compared to all devices tested
» 35% of all tested devices were better, 8% similar, 56% worse
» The best had a delta of 4%, average was 24%, worst was 134%
Apple MacBook Pro 15 2018 (2.6 GHz, 560X) audio analysis
(+) | speakers can play relatively loud (85 dB)
Bass 100 - 315 Hz
(+) | good bass - only 4.7% away from median
(±) | linearity of bass is average (8.3% delta to prev. frequency)
Mids 400 - 2000 Hz
(+) | balanced mids - only 1.8% away from median
(+) | mids are linear (3.5% delta to prev. frequency)
Highs 2 - 16 kHz
(+) | balanced highs - only 2.6% away from median
(+) | highs are linear (5.7% delta to prev. frequency)
Overall 100 - 16.000 Hz
(+) | overall sound is linear (6.4% difference to median)
Compared to same class
» 3% of all tested devices in this class were better, 1% similar, 95% worse
» The best had a delta of 5%, average was 17%, worst was 45%
Compared to all devices tested
» 0% of all tested devices were better, 0% similar, 99% worse
» The best had a delta of 4%, average was 24%, worst was 134%
Power Management - Over 12 hours of battery life under certain conditions
Power Consumption
The MacBook Pro 16 has excellent power consumption, especially when idling. Our measurements only apply to macOS though, as the Radeon Pro 5500M always remains active on Windows 10. Apple has also simply better optimised the MacBook Pro 16 to run macOS than it has Windows 10, unsurprisingly.
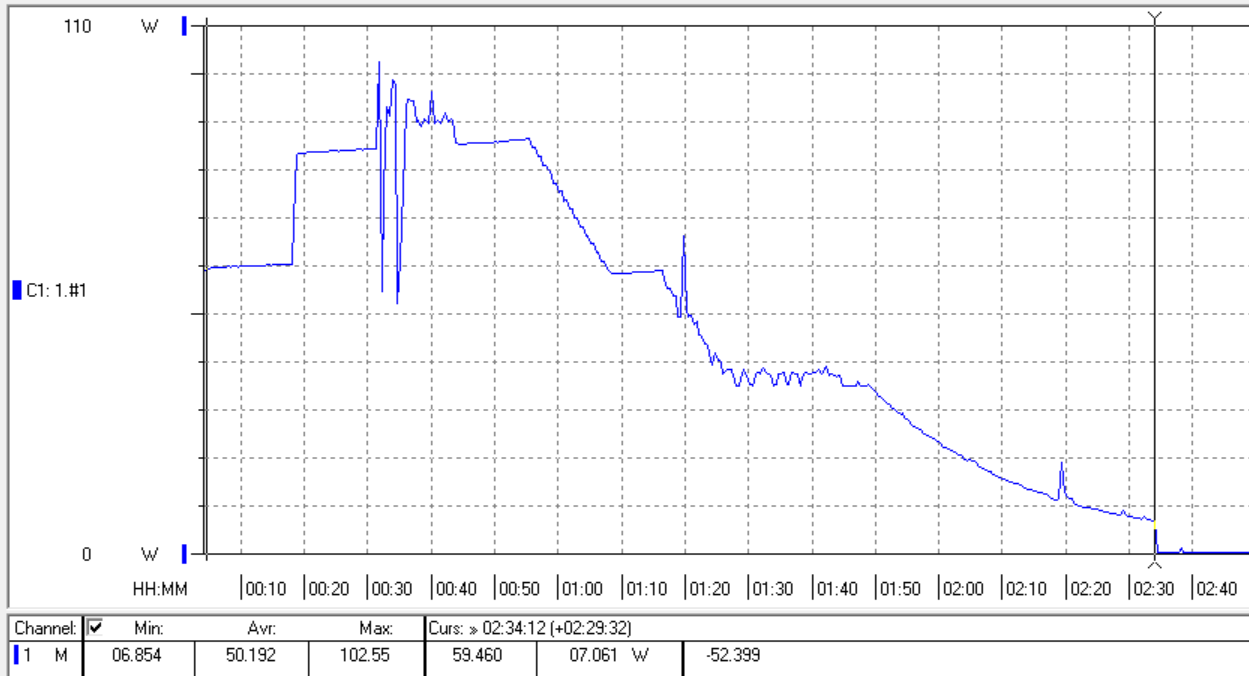
The MacBook Pro 16 runs into its power limitations under load, as its charger can only supply up to 103 W. Our review unit remained fully charged under sustained load too. However, power consumption remains at around 30 W when the machine returns to idling again as if it were charging.
Hence, we should point out that Thunderbolt 3 monitors like the LG 27UD88-W will not provide enough wattage to the MacBook Pro 16 during intensive tasks like gaming. Our review unit used its battery in parallel to receiving power when connected to an external monitor, for example, during our gaming session on macOS.
| Off / Standby | |
| Idle | |
| Load |
|
Key:
min: | |
| Apple MacBook Pro 16 2019 i9 5500M i9-9880H, Radeon Pro 5500M, Apple SSD AP1024 7171, IPS, 3072x1920, 16" | Apple MacBook Pro 15 2018 (2.6 GHz, 560X) i7-8850H, Radeon Pro 560X, Apple SSD AP0512, IPS, 2880x1800, 15.4" | Dell XPS 15 7590 9980HK GTX 1650 i9-9980HK, GeForce GTX 1650 Mobile, Toshiba XG6 KXG60ZNV1T02, OLED, 3840x2160, 15.6" | MSI P65 Creator 9SF-657 i9-9880H, GeForce RTX 2070 Max-Q, 2x Samsung SSD PM981 MZVLB512HAJQ (RAID 0), IPS, 3840x2160, 15.6" | Lenovo ThinkPad X1 Extreme 2019 20QV000WGE i7-9750H, GeForce GTX 1650 Mobile, Samsung SSD PM981 MZVLB512HAJQ, IPS, 3840x2160, 15.6" | Average of class Multimedia | |
|---|---|---|---|---|---|---|
| Power Consumption | 11% | -18% | -67% | -31% | -0% | |
| Idle Minimum * (Watt) | 3.7 | 3.4 8% | 6.2 -68% | 9.4 -154% | 8.5 -130% | 5.9 ? -59% |
| Idle Average * (Watt) | 12.1 | 11 9% | 9.6 21% | 17.4 -44% | 14.7 -21% | 10.4 ? 14% |
| Idle Maximum * (Watt) | 17 | 14.9 12% | 21.2 -25% | 19.6 -15% | 19.4 -14% | 12.3 ? 28% |
| Load Average * (Watt) | 91.5 | 78.9 14% | 104.3 -14% | 103 -13% | 89.6 2% | 67.2 ? 27% |
| Witcher 3 ultra * (Watt) | 103 | 91.7 11% | 96.1 7% | |||
| Load Maximum * (Watt) | 102.3 | 91.2 11% | 135.3 -32% | 216 -111% | 129.8 -27% | 113.9 ? -11% |
* ... smaller is better
Battery Life
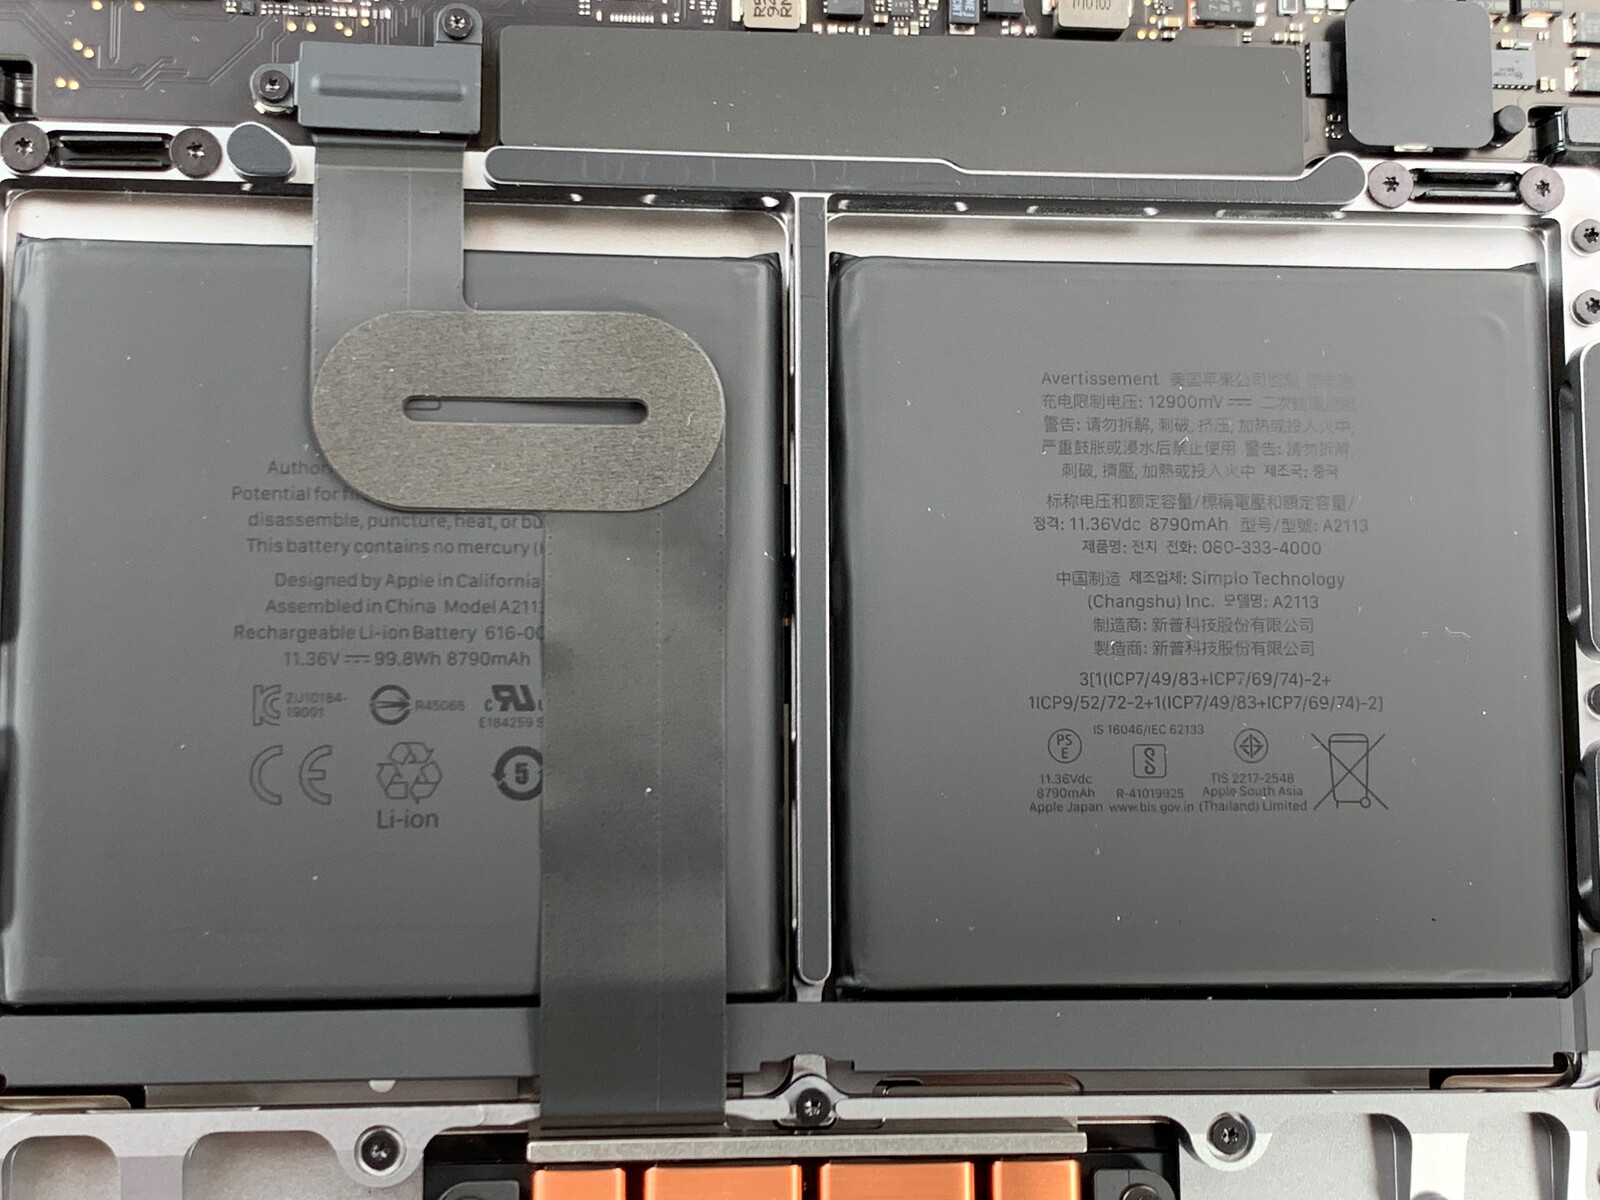
Another improvement that the MacBook Pro 16 offers over its predecessor is battery life. Apple has increased the battery capacity from 83 Wh to 100 Wh for the new 16-inch model, the maximum battery size that most airlines will let on their aircraft.
While the MacBook Pro 16 has excellent battery life, we had hoped that it would achieve better runtimes than it did. Our review unit lasted for 11:58 hours in our practical Wi-Fi test, an admirable runtime. The MacBook Pro 15 lasted for 14% less in the same test, but with a 20% smaller battery. We suspect that the more powerful components in the MacBook Pro 16 are likely at play here.
While the device supports automatic graphics-switching on macOS, its H.264 runtime left us baffled. Typically, laptops better or match their Wi-Fi runtimes in this test, but the MacBook Pro 16 did the opposite. The longest runtime we managed here was only 9:40 hours, which is 21% short of what the MacBook Pro 15 achieved. Seemingly, Apple has some optimisation to do of the CPU and GPU's video decoders, as the MacBook Pro 16 should last much longer than it does here.
Overall, the MacBook Pro 16 should last at least a full workday between charges. You will need to find a mains outlet after under an hour of gaming, though.
In Windows 10, using Bootcamp, the MBP16 offers significantly less battery runtime due to the always running Radeon GPU. We measured only 4 hours and 46 minutes in our Wi-Fi battery test running Edge 44.18362.
| Apple MacBook Pro 16 2019 i9 5500M i9-9880H, Radeon Pro 5500M, 99.8 Wh | Lenovo ThinkPad X1 Extreme 2019 20QV000WGE i7-9750H, GeForce GTX 1650 Mobile, 80 Wh | Dell XPS 15 7590 9980HK GTX 1650 i9-9980HK, GeForce GTX 1650 Mobile, 97 Wh | Asus ZenBook Pro 15 UX580GE i9-8950HK, GeForce GTX 1050 Ti Mobile, 71 Wh | MSI P65 Creator 9SF-657 i9-9880H, GeForce RTX 2070 Max-Q, 82 Wh | Apple MacBook Pro 15 2018 (2.6 GHz, 560X) i7-8850H, Radeon Pro 560X, 83 Wh | Average of class Multimedia | |
|---|---|---|---|---|---|---|---|
| Battery runtime | -31% | 98% | -9% | -20% | 24% | 44% | |
| H.264 (h) | 9.7 | 4.7 -52% | 11.7 21% | 16.1 ? 66% | |||
| WiFi v1.3 (h) | 12 | 4.8 -60% | 7.8 -35% | 6.3 -47% | 6 -50% | 10.2 -15% | 11.9 ? -1% |
| Witcher 3 ultra (h) | 0.9 | 1.5 67% | |||||
| Load (h) | 1 | 1.2 20% | 3.3 230% | 1.3 30% | 1.1 10% | 1.676 ? 68% |
Pros
Cons
Verdict - A fantastic, but expensive multimedia laptop
Apple has refined upon the old 15-inch design with the new 16-inch MacBook Pro by making some small but important changes. Firstly, the company has replaced its much-criticised butterfly keyboard mechanism with a scissor-switch design that is not only proven and provides more travel than butterfly keys but also should be more durable too. While Apple has taken heavily from the design of its most recent MacBook Pro 15 for the new 16-inch model, the latter is slightly thicker than its predecessor and delivers more efficient cooling too.
Unfortunately, Apple has persisted with only including four Thunderbolt 3 ports and a headphone jack in the new MacBook Pro. Ethernet, HDMI, a card reader and USB Type-A ports are all things of the past in Apple's ecosystem, so purchasing at least one dongle is probably necessary. Likewise, upgrade and repair options are as bad as they were previously, with Apple soldering the CPU, GPU, RAM, SSD and Wi-Fi chip to the logic board. This means that you must not only live with an outdated 802.11ac Broadcom Wi-Fi chip but also that you will need to replace the logic board if any of these components develop a fault.
The MacBook Pro 16 is an excellent and luxurious multimedia laptop with poor repairability.
The new 16-inch panel offers no surprises, either. The panel supports neither 120 Hz refresh rates nor Adaptive Sync, but its image quality is just as good as the displays in previous MacBook Pros that we have reviewed. The larger chassis has also allowed Apple to equip the MacBook Pro 16 with significantly better speakers than its 15-inch predecessor had. More efficient cooling has been long overdue too and allows our review unit to get significantly better performance from its Core i9-9880H processor than its predecessor could. While its new Navi GPU does not set the Windows world alight, it represents a good upgrade from the Vega GPUs with which Apple equipped the last MacBook Pro 15.
The MacBook Pro 16 did not set any runtime records for multimedia laptops despite having a 100 Wh battery, as its Core i9 processor, large display and dedicated GPU are all power-hungry components. However, you should get close to two hours longer between charges when browsing the web than you could with the MacBook Pro 15, which is a tangible improvement. The MacBook Pro 16 should last at least a full workday between charges too, something that none of our comparison devices could achieve.
Overall, the MacBook Pro 16 is an excellent multimedia laptop. It suffers from a few weaknesses, the greatest of which is its exorbitant price. US$2,799 only gets you a year's warranty too, and you may want to consider buying at least one USB Type-C dongle.
Apple MacBook Pro 16 2019 i9 5500M
- 12/02/2019 v7 (old)
Klaus Hinum, Andreas Osthoff
Price comparison

