AMD Radeon R7 (Bristol Ridge) vs Intel HD Graphics 5600
AMD Radeon R7 (Bristol Ridge) ► remove from comparison
The AMD Radeon R7 (Bristol Ridge) is an integrated graphics card for the fastest mobile AMD Carrizo APUs. At its launch, the R7 is available on the top model FX9830P with 512 GCN shader units and a core clock of 900 MHz. The technical specifications do not differ from the AMD Radeon R7 in Carrizo, but the clock is up to 100 MHz higher. Depending on the cooling and the configurable TDP (12-45 Watts), the performance can differ quite a lot. The performance also depends on the memory (best performance with dual-channel DDR4).
Architecture and Features
According to AMD, the Radeon R7 consists of eight cores based on the third GCN generation (often called GCN 1.2 or 2.0 in the press). It is therefore very similar to the Tonga desktop chip and supports DirectX 12 (FL 12_0). Furthermore, its shaders can be used with Mantle, OpenGL and OpenCL. HSA 1.0 is supported for running code on both CPU and GPU cores simultaneously.
Compared to the Kaveri generation (Kaveri R7 with GCN 1.1), the new color compression in particular results in better memory utilization and improves the gaming performance by 5-7 %.
The improved video decoder of Carrizo/Bristol Ridge now includes UVD 6 (Unified Video Decoder), which can decode HVEC / H.265 up to 4K in hardware. Furthermore, the VCE (Video Codec Engine) has been improved for faster transcoding of H.264. More information on architecture and features of the Bristol Ridge architecture can be found in our launch article.
Performance
Depending on the configurable TDP of the Bristol Ridge chips between 12 up to 45 Watts, there can be significant differences in games. Overall, the results are slightly better compared to the Carrizo Radeon R7 due to the higher clocks for comparable model. You can still use the Kaveri R7 benchmarks to check the gaming performance.
Power Consumption
Depending on the configurable TDP (cTDP), the 28 nm chip is specified at 12-45 Watts. It can therefore be used for thin and light notebooks as well as medium-sized devices or All-in-Ones (AiO).
Intel HD Graphics 5600 ► remove from comparison
The Intel HD Graphics 5600 (GT2) is an integrated graphics card of the Broadwell generation. It can be found in standard voltage CPUs (47 W) and offers 24 EUs (Execution Units). The clock range may depend on the model it is built into (Core i7-5700HQ : max. 1050 MHz with Turbo Boost).
Architecture and Features
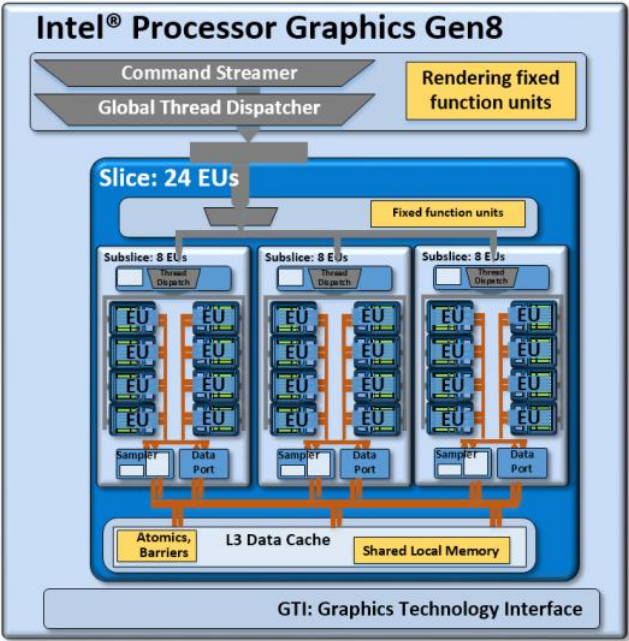
Broadwell features a GPU based on the Intel Gen8 architecture, which has been optimized in various aspects compared to the previous Gen7.5 (Haswell). Inter alia, the shader arrays called "subslice" have been reorganized and now offer 8 Execution Units (EUs) each. Three subslices form a "slice" for a total of 24 EUs. Combined with other improvements such as larger L1 caches and an optimized frontend, the integrated GPU has become faster and more efficient than its predecessor.
The HD Graphics 5600 represents the mid-range version of the Broadwell GPU family and consists of one slice with 24 EUs. Beyond that, there is also a low-end variant (GT1, 12 EUs) as well as higher-end models (GT3/GT3e + eDRAM, 48 EUs).
All Broadwell GPUs support OpenCL 2.0 and DirectX 12 (FL 11_1) . The video engine is now able to decode H.265 using both fixed function hardware as well as available GPU shaders. Up to three displays can be connected via DP 1.2/eDP 1.3 (max. 3840 x 2160 @ 60 Hz) or HDMI 1.4a (max. 3840 x 2160 @ 24 Hz). HDMI 2.0, however, is not supported.
Performance
Thanks to its improved architecture and the additional EUs, the HD Graphics 5600 is about 20 percent faster than the Haswell-based HD 4600 (20 EUs), but still somewhat slower than dedicated low-end GPUs like a GeForce 920M or Radeon R7 M360 . Most games as of 2014/2015 will be playable only in low settings (and sometimes not even that).
Power Consumption
The whole Broadwell chip is specified at 47 W TDP (i7-5700HQ) and therefore best suited for notebooks 14-inches in size and above. We tested the power consumption of the GPU with HWInfo sensors in a Core i7-5600HQ (MSI GP62). Idle on the Windows desktop the HD 5600 needed on average 0.04 Watt. Running World of Warships in high details, 9.6 Watt were used by the graphics card (whole CPU needed 41 Watt). In comparison, when we activated the dedicated GeForce 940M, the GPU part needed 0.4 Watt and the whole CPU 29 Watt.
AMD Radeon R7 (Bristol Ridge) Intel HD Graphics 5600 HD Graphics Series Codename Bristol Ridge Broadwell GT2 Architecture GCN 1.2 Gen. 8 Broadwell Pipelines 512 - unified 24 - unified Core Speed 900 (Boost) MHz 300 - 1050 (Boost) MHz Memory Bus Width 64/128 Bit 64/128 Bit Shared Memory yes yes API DirectX 12 (FL 12_0), OpenGL 4.4 DirectX 12 (FL 11_1), OpenGL 4.3 Power Consumption 12-45 Watt Transistors 2.4 Billion technology 28 nm 14 nm Features UVD 6, VCE QuickSync Notebook Size medium sized Date of Announcement 01.06.2016 02.06.2015
Benchmarks Performance Rating - 3DMark 11 + Fire Strike + Time Spy - Radeon R7 (Bristol Ridge)
0.5 pt (1%)
...
AMD Radeon R7 (Bristol Ridge)
...
max:
Performance Rating - 3DMark 11 + Fire Strike + Time Spy - HD Graphics 5600
0.5 pt (1%)
...
...
max:
3DMark - 3DMark Time Spy Score
min: 338 avg: 364.7 median: 358 (1%) max: 398 Points
3DMark - 3DMark Time Spy Graphics
min: 325 avg: 343.7 median: 347 (1%) max: 359 Points
3DMark - 3DMark Ice Storm Unlimited Graphics
min: 34845 avg: 49654 median: 52245.5 (6%) max: 59281 Points
3DMark - 3DMark Ice Storm Extreme Graphics
min: 32062 avg: 34971 median: 32389 (4%) max: 40461 Points
3DMark - 3DMark Cloud Gate Score
min: 3162 avg: 4026 median: 3942 (4%) max: 5173 Points
7499 Points (8%)
3DMark - 3DMark Cloud Gate Graphics
min: 3477 avg: 5531 median: 5311 (1%) max: 8107 Points
7757 Points (2%)
3DMark - 3DMark Fire Strike Standard Score
min: 667 avg: 938 median: 866 (2%) max: 1230 Points
944 Points (2%)
3DMark - 3DMark Fire Strike Standard Graphics
min: 750 avg: 1081 median: 1013 (1%) max: 1466 Points
991 Points (1%)
3DMark - 3DMark Ice Storm Graphics
min: 44545 avg: 48082 median: 46007 (6%) max: 53693 Points
79039 Points (9%)
3DMark 11 - 3DM11 Performance Score
min: 1737 avg: 1859 median: 1794 (2%) max: 2130 Points
1651 Points (2%)
3DMark 11 - 3DM11 Performance GPU
min: 1820 avg: 1913 median: 1852 (2%) max: 2210 Points
1431 Points (1%)
3DMark Vantage + AMD Radeon R7 (Bristol Ridge) 3DMark Vantage - 3DM Vant. Perf. total
5568 Points (2%)
3DM Vant. Perf. GPU no PhysX + AMD Radeon R7 (Bristol Ridge) 3DMark Vantage - 3DM Vant. Perf. GPU no PhysX
5111 Points (3%)
3DMark 06 3DMark 06 - Standard 1280x1024 + AMD Radeon R7 (Bristol Ridge)
min: 5635 avg: 6645 median: 6644.5 (9%) max: 7654 Points
Unigine Valley 1.0 - Unigine Valley 1.0 DX
3.5 fps (1%)
Unigine Heaven 3.0 - Unigine Heaven 3.0 DX 11
13.9 fps (5%)
Unigine Heaven 2.1 - Heaven 2.1 high
19.5 fps (4%)
Cinebench R10 Cinebench R10 Shading (32bit) + AMD Radeon R7 (Bristol Ridge) Cinebench R10 - Cinebench R10 Shading (32bit)
min: 4680 avg: 4943 median: 4845 (3%) max: 5403 Points
Cinebench R10 Shading (32bit) + Intel HD Graphics 5600
7445 Points (5%)
Cinebench R11.5 Cinebench R11.5 OpenGL 64 Bit + AMD Radeon R7 (Bristol Ridge) Cinebench R11.5 - Cinebench R11.5 OpenGL 64 Bit
min: 18.06 avg: 20.1 median: 18.3 (6%) max: 25.65 fps
Cinebench R11.5 OpenGL 64 Bit + Intel HD Graphics 5600
41.2 fps (14%)
Cinebench R15 + AMD Radeon R7 (Bristol Ridge) Cinebench R15 - Cinebench R15 OpenGL 64 Bit
min: 22.88 avg: 25.1 median: 23.2 (1%) max: 31.43 fps
Cinebench R15 OpenGL 64 Bit + Intel HD Graphics 5600
37.9 fps (2%)
Cinebench R15 OpenGL Ref. Match 64 Bit + AMD Radeon R7 (Bristol Ridge) Cinebench R15 - Cinebench R15 OpenGL Ref. Match 64 Bit
98 % (98%)
GFXBench - GFXBench Car Chase Offscreen
23.8 fps (3%)
GFXBench 3.1 - GFXBench Manhattan ES 3.1 Offscreen
24.3 fps (1%)
GFXBench 3.0 - GFXBench 3.0 Manhattan Offscreen
25.9 fps (2%)
GFXBench (DX / GLBenchmark) 2.7 + AMD Radeon R7 (Bristol Ridge) GFXBench (DX / GLBenchmark) 2.7 - GFXBench T-Rex HD Offscreen C24Z16
90 fps (1%)
LuxMark v2.0 64Bit - LuxMark v2.0 Room GPU
min: 175 avg: 178.5 median: 178.5 (1%) max: 182 Samples/s
LuxMark v2.0 64Bit - LuxMark v2.0 Sala GPU
min: 358 avg: 362.5 median: 362.5 (1%) max: 367 Samples/s
ComputeMark v2.1 - ComputeMark v2.1 Result
min: 1093 avg: 1346 median: 1450 (2%) max: 1495 Points
Power Consumption - Furmark Stress Test Power Consumption - external Monitor *
57.8 Watt (8%)
Power Consumption - The Witcher 3 Power Consumption - external Monitor *
29.1 Watt (4%)
44.6 Watt (6%)
Clock Speed - GPU Clock Witcher 3 ultra
472 MHz (19%)
Average Benchmarks AMD Radeon R7 (Bristol Ridge) → 100% n=10 Average Benchmarks Intel HD Graphics 5600 → 143% n=10
- Range of benchmark values for this graphics card
- Average benchmark values for this graphics card
* Smaller numbers mean a higher performance
1 This benchmark is not used for the average calculation
Game Benchmarks The following benchmarks stem from our benchmarks of review laptops. The performance depends on the used graphics memory, clock rate, processor, system settings, drivers, and operating systems. So the results don't have to be representative for all laptops with this GPU. For detailed information on the benchmark results, click on the fps number.
HD Graphics 5600:
15.1 [X] MSI GP62 2QD Intel Core i7-5700HQ 2.7GHz
HD Graphics 5600
min:
13 fps, max:
20 fps
fps
HD Graphics 5600:
10.4 [X] MSI GP62 2QD Intel Core i7-5700HQ 2.7GHz
HD Graphics 5600
min:
8 fps, max:
13 fps
fps
HD Graphics 5600:
8.7 [X] MSI GP62 2QD Intel Core i7-5700HQ 2.7GHz
HD Graphics 5600
min:
1 fps, max:
14 fps
fps
HD Graphics 5600:
71 [X] MSI GP62 2QD Intel Core i7-5700HQ 2.7GHz
HD Graphics 5600
min:
58 fps, max:
79 fps
fps
HD Graphics 5600:
0 (!) [X] MSI GP62 2QD Intel Core i7-5700HQ 2.7GHz
HD Graphics 5600
fps
100%
Radeon R7 (Bristol Ridge):
13.1 [X] Acer Aspire E15 E5-553G-15FM AMD A12-9700P 2.5GHz
Radeon R7 (Bristol Ridge)
min:
8 fps, max:
16 fps
fps
100%
Radeon R7 (Bristol Ridge):
13.8 [X] Acer Aspire E15 E5-553G-15FM AMD A12-9700P 2.5GHz
Radeon R7 (Bristol Ridge)
min:
10 fps, max:
19 fps
fps
100%
Radeon R7 (Bristol Ridge):
46.2 [X] Acer Aspire E15 E5-553G-15FM AMD A12-9700P 2.5GHz
Radeon R7 (Bristol Ridge)
min:
41 fps
fps
223%
HD Graphics 5600:
103 [X] MSI GP62 2QD Intel Core i7-5700HQ 2.7GHz
HD Graphics 5600
min:
93 fps
fps
HD Graphics 5600:
94 [X] MSI GP62 2QD Intel Core i7-5700HQ 2.7GHz
HD Graphics 5600
min:
88 fps
fps
100%
Radeon R7 (Bristol Ridge):
34 [X] Acer Aspire E15 E5-553G-15FM AMD A12-9700P 2.5GHz
Radeon R7 (Bristol Ridge)
min:
30 fps
fps
124%
HD Graphics 5600:
42 [X] MSI GP62 2QD Intel Core i7-5700HQ 2.7GHz
HD Graphics 5600
min:
39 fps
fps
HD Graphics 5600:
15.4 [X] MSI GP62 2QD Intel Core i7-5700HQ 2.7GHz
HD Graphics 5600
min:
14 fps
fps
100%
Radeon R7 (Bristol Ridge):
40.9 [X] Acer Aspire E15 E5-553G-15FM AMD A12-9700P 2.5GHz
Radeon R7 (Bristol Ridge)
min:
37 fps, max:
45 fps
fps
97%
HD Graphics 5600:
39.7 [X] MSI GP62 2QD Intel Core i7-5700HQ 2.7GHz
HD Graphics 5600
min:
37 fps, max:
43 fps
fps
100%
Radeon R7 (Bristol Ridge):
57 [X] Acer Aspire E15 E5-553G-15FM AMD A12-9700P 2.5GHz
Radeon R7 (Bristol Ridge)
min:
16 fps, max:
71 fps
fps
97%
HD Graphics 5600:
55.2 [X] MSI GP62 2QD Intel Core i7-5700HQ 2.7GHz
HD Graphics 5600
min:
49 fps, max:
63 fps
fps
100%
Radeon R7 (Bristol Ridge):
33.2 [X] Acer Aspire E15 E5-553G-15FM AMD A12-9700P 2.5GHz
Radeon R7 (Bristol Ridge)
min:
15 fps, max:
45 fps
fps
86%
HD Graphics 5600:
28.6 [X] MSI GP62 2QD Intel Core i7-5700HQ 2.7GHz
HD Graphics 5600
min:
24 fps, max:
33 fps
fps
100%
Radeon R7 (Bristol Ridge):
18.1 [X] Acer Aspire E15 E5-553G-15FM AMD A12-9700P 2.5GHz
Radeon R7 (Bristol Ridge)
min:
8 fps, max:
25 fps
fps
HD Graphics 5600:
17.1 [X] MSI GP62 2QD Intel Core i7-5700HQ 2.7GHz
HD Graphics 5600
min:
14 fps, max:
22 fps
fps
100%
Radeon R7 (Bristol Ridge):
11.9 fps
100%
Radeon R7 (Bristol Ridge):
5.3 fps
100%
Radeon R7 (Bristol Ridge):
20.6 fps
106%
HD Graphics 5600:
21.9 [X] MSI GP62 2QD Intel Core i7-5700HQ 2.7GHz
HD Graphics 5600
min:
15 fps, max:
32 fps
fps
100%
Radeon R7 (Bristol Ridge):
7.1 fps
120%
HD Graphics 5600:
8.5 [X] MSI GP62 2QD Intel Core i7-5700HQ 2.7GHz
HD Graphics 5600
min:
7 fps, max:
11 fps
fps
100%
Radeon R7 (Bristol Ridge):
31.9 36.7 [X] Acer Aspire E15 E5-553G-15FM AMD A12-9700P 2.5GHz
Radeon R7 (Bristol Ridge)
min:
31 fps, max:
42 fps
~ 34 fps
100%
Radeon R7 (Bristol Ridge):
12.2 fps
HD Graphics 5600:
14.9 [X] MSI GP62 2QD Intel Core i7-5700HQ 2.7GHz
HD Graphics 5600
min:
12 fps, max:
18 fps
fps
HD Graphics 5600:
12.3 [X] MSI GP62 2QD Intel Core i7-5700HQ 2.7GHz
HD Graphics 5600
min:
10 fps, max:
15 fps
fps
100%
Radeon R7 (Bristol Ridge):
11 fps
0%
HD Graphics 5600:
0 (!) [X] MSI GP62 2QD Intel Core i7-5700HQ 2.7GHz
HD Graphics 5600
fps
100%
Radeon R7 (Bristol Ridge):
8.8 fps
100%
Radeon R7 (Bristol Ridge):
34 fps
100%
Radeon R7 (Bristol Ridge):
30.3 fps
100%
Radeon R7 (Bristol Ridge):
10.5 fps
100%
Radeon R7 (Bristol Ridge):
63.2 fps
100%
Radeon R7 (Bristol Ridge):
47.5 fps
96%
HD Graphics 5600:
45.5 [X] MSI GP62 2QD Intel Core i7-5700HQ 2.7GHz
HD Graphics 5600
min:
43 fps, max:
56 fps
fps
100%
Radeon R7 (Bristol Ridge):
22 fps
82%
HD Graphics 5600:
18.1 [X] MSI GP62 2QD Intel Core i7-5700HQ 2.7GHz
HD Graphics 5600
min:
16 fps, max:
22 fps
fps
100%
Radeon R7 (Bristol Ridge):
23.3 fps
128%
HD Graphics 5600:
29.8 [X] MSI GP62 2QD Intel Core i7-5700HQ 2.7GHz
HD Graphics 5600
min:
27 fps, max:
32 fps
fps
100%
Radeon R7 (Bristol Ridge):
16.7 fps
116%
HD Graphics 5600:
19.3 [X] MSI GP62 2QD Intel Core i7-5700HQ 2.7GHz
HD Graphics 5600
min:
16 fps, max:
21 fps
fps
100%
Radeon R7 (Bristol Ridge):
8.3 fps
106%
HD Graphics 5600:
8.8 [X] MSI GP62 2QD Intel Core i7-5700HQ 2.7GHz
HD Graphics 5600
min:
7 fps, max:
10 fps
fps
HD Graphics 5600:
7.6 [X] MSI GP62 2QD Intel Core i7-5700HQ 2.7GHz
HD Graphics 5600
min:
6 fps, max:
9 fps
fps
100%
Radeon R7 (Bristol Ridge):
30.5 fps
100%
Radeon R7 (Bristol Ridge):
14.6 fps
100%
Radeon R7 (Bristol Ridge):
7.6 fps
HD Graphics 5600:
8.3 [X] MSI GP62 2QD Intel Core i7-5700HQ 2.7GHz
HD Graphics 5600
min:
5 fps, max:
12 fps
fps
HD Graphics 5600:
68 (!) [X] MSI GP62 2QD Intel Core i7-5700HQ 2.7GHz
HD Graphics 5600
min:
50 fps, max:
77 fps
fps
HD Graphics 5600:
50.4 (!) [X] MSI GP62 2QD Intel Core i7-5700HQ 2.7GHz
HD Graphics 5600
min:
41 fps, max:
57 fps
fps
HD Graphics 5600:
28.1 (!) [X] MSI GP62 2QD Intel Core i7-5700HQ 2.7GHz
HD Graphics 5600
min:
23 fps, max:
31 fps
fps
100%
Radeon R7 (Bristol Ridge):
10 15.5 ~ 13 fps
100%
Radeon R7 (Bristol Ridge):
7 11.6 ~ 9 fps
100%
Radeon R7 (Bristol Ridge):
6.4 fps
100%
Radeon R7 (Bristol Ridge):
16.9 fps
100%
Radeon R7 (Bristol Ridge):
11.7 fps
HD Graphics 5600:
40 [X] MSI GP62 2QD Intel Core i7-5700HQ 2.7GHz
HD Graphics 5600
min:
32 fps, max:
49 fps
fps
HD Graphics 5600:
28 [X] MSI GP62 2QD Intel Core i7-5700HQ 2.7GHz
HD Graphics 5600
min:
23 fps, max:
34 fps
fps
100%
Radeon R7 (Bristol Ridge):
8 fps
73%
HD Graphics 5600:
5.8 [X] MSI GP62 2QD Intel Core i7-5700HQ 2.7GHz
HD Graphics 5600
fps
100%
Radeon R7 (Bristol Ridge):
17.4 fps
100%
HD Graphics 5600:
17.4 [X] MSI GP62 2QD Intel Core i7-5700HQ 2.7GHz
HD Graphics 5600
min:
13 fps, max:
25 fps
fps
100%
Radeon R7 (Bristol Ridge):
10.6 fps
100%
Radeon R7 (Bristol Ridge):
15 fps
107%
HD Graphics 5600:
16 [X] MSI GP62 2QD Intel Core i7-5700HQ 2.7GHz
HD Graphics 5600
min:
13 fps, max:
20 fps
fps
100%
Radeon R7 (Bristol Ridge):
9 fps
89%
HD Graphics 5600:
8 [X] MSI GP62 2QD Intel Core i7-5700HQ 2.7GHz
HD Graphics 5600
min:
7 fps, max:
9 fps
fps
100%
Radeon R7 (Bristol Ridge):
8 fps
100%
Radeon R7 (Bristol Ridge):
18.4 fps
86%
HD Graphics 5600:
15.8 [X] MSI GP62 2QD Intel Core i7-5700HQ 2.7GHz
HD Graphics 5600
min:
13 fps, max:
20 fps
fps
100%
Radeon R7 (Bristol Ridge):
6.9 fps
100%
Radeon R7 (Bristol Ridge):
4.9 fps
0%
HD Graphics 5600:
0 (!) [X] MSI GP62 2QD Intel Core i7-5700HQ 2.7GHz
HD Graphics 5600
fps
100%
Radeon R7 (Bristol Ridge):
6.2 7 7.1 ~ 7 fps
100%
Radeon R7 (Bristol Ridge):
47.1 fps
100%
Radeon R7 (Bristol Ridge):
20.8 fps
100%
Radeon R7 (Bristol Ridge):
14.7 fps
100%
Radeon R7 (Bristol Ridge):
16 fps
0%
HD Graphics 5600:
0 (!) [X] MSI GP62 2QD Intel Core i7-5700HQ 2.7GHz
HD Graphics 5600
fps
100%
Radeon R7 (Bristol Ridge):
13.2 fps
100%
Radeon R7 (Bristol Ridge):
22.9 fps
100%
Radeon R7 (Bristol Ridge):
21.2 fps
100%
Radeon R7 (Bristol Ridge):
10.5 fps
HD Graphics 5600:
17.9 [X] MSI GP62 2QD Intel Core i7-5700HQ 2.7GHz
HD Graphics 5600
min:
11 fps, max:
25 fps
fps
HD Graphics 5600:
31.2 [X] MSI GP62 2QD Intel Core i7-5700HQ 2.7GHz
HD Graphics 5600
min:
28 fps, max:
35 fps
fps
HD Graphics 5600:
18.5 [X] MSI GP62 2QD Intel Core i7-5700HQ 2.7GHz
HD Graphics 5600
min:
15 fps, max:
22 fps
fps
100%
Radeon R7 (Bristol Ridge):
26.1 fps
100%
Radeon R7 (Bristol Ridge):
14.4 fps
100%
Radeon R7 (Bristol Ridge):
6.7 fps
HD Graphics 5600:
70 [X] MSI GP62 2QD Intel Core i7-5700HQ 2.7GHz
HD Graphics 5600
min:
64 fps, max:
76 fps
fps
HD Graphics 5600:
39.8 [X] MSI GP62 2QD Intel Core i7-5700HQ 2.7GHz
HD Graphics 5600
min:
34 fps, max:
44 fps
fps
HD Graphics 5600:
20.8 [X] MSI GP62 2QD Intel Core i7-5700HQ 2.7GHz
HD Graphics 5600
min:
17 fps, max:
23 fps
fps
100%
Radeon R7 (Bristol Ridge):
47.1 fps
157%
HD Graphics 5600:
74 [X] MSI GP62 2QD Intel Core i7-5700HQ 2.7GHz
HD Graphics 5600
min:
50 fps, max:
87 fps
fps
100%
Radeon R7 (Bristol Ridge):
35.4 fps
136%
HD Graphics 5600:
48 [X] MSI GP62 2QD Intel Core i7-5700HQ 2.7GHz
HD Graphics 5600
min:
32 fps, max:
58 fps
fps
100%
Radeon R7 (Bristol Ridge):
20.9 fps
110%
HD Graphics 5600:
22.9 [X] MSI GP62 2QD Intel Core i7-5700HQ 2.7GHz
HD Graphics 5600
min:
13 fps, max:
31 fps
fps
HD Graphics 5600:
16.5 [X] MSI GP62 2QD Intel Core i7-5700HQ 2.7GHz
HD Graphics 5600
min:
11 fps, max:
24 fps
fps
100%
Radeon R7 (Bristol Ridge):
45.5 fps
69%
HD Graphics 5600:
31.2 [X] MSI GP72 Intel Core i7-5700HQ 2.7GHz
HD Graphics 5600
fps
100%
Radeon R7 (Bristol Ridge):
36.4 fps
57%
HD Graphics 5600:
20.7 [X] MSI GP72 Intel Core i7-5700HQ 2.7GHz
HD Graphics 5600
fps
100%
Radeon R7 (Bristol Ridge):
14.3 fps
50%
HD Graphics 5600:
7.2 [X] MSI GP72 Intel Core i7-5700HQ 2.7GHz
HD Graphics 5600
fps
HD Graphics 5600:
16.4 [X] MSI GP72 Intel Core i7-5700HQ 2.7GHz
HD Graphics 5600
fps
HD Graphics 5600:
7.6 [X] MSI GP72 Intel Core i7-5700HQ 2.7GHz
HD Graphics 5600
fps
100%
Radeon R7 (Bristol Ridge):
47.9 [X] Acer Aspire E15 E5-553G-15FM AMD A12-9700P 2.5GHz
Radeon R7 (Bristol Ridge)
min:
38 fps
fps
100%
Radeon R7 (Bristol Ridge):
16 [X] Acer Aspire E15 E5-553G-15FM AMD A12-9700P 2.5GHz
Radeon R7 (Bristol Ridge)
min:
14 fps
fps
100%
Radeon R7 (Bristol Ridge):
13.9 [X] Acer Aspire E15 E5-553G-15FM AMD A12-9700P 2.5GHz
Radeon R7 (Bristol Ridge)
min:
11 fps
fps
100%
Radeon R7 (Bristol Ridge):
9 12 ~ 11 fps
109%
HD Graphics 5600:
12 [X] MSI GP72 Intel Core i7-5700HQ 2.7GHz
HD Graphics 5600
fps
100%
Radeon R7 (Bristol Ridge):
3 11 ~ 7 fps
129%
HD Graphics 5600:
9 [X] MSI GP72 Intel Core i7-5700HQ 2.7GHz
HD Graphics 5600
fps
HD Graphics 5600:
5 [X] MSI GP72 Intel Core i7-5700HQ 2.7GHz
HD Graphics 5600
fps
100%
Radeon R7 (Bristol Ridge):
11.9 14 ~ 13 fps
113%
HD Graphics 5600:
14.7 [X] MSI GT72 Intel Core i7-5700HQ 2.7GHz
HD Graphics 5600
fps
100%
Radeon R7 (Bristol Ridge):
7.6 9.2 ~ 8 fps
120%
HD Graphics 5600:
9.6 [X] MSI GT72 Intel Core i7-5700HQ 2.7GHz
HD Graphics 5600
fps
HD Graphics 5600:
5.6 [X] MSI GT72 Intel Core i7-5700HQ 2.7GHz
HD Graphics 5600
fps
HD Graphics 5600:
3.1 [X] MSI GT72 Intel Core i7-5700HQ 2.7GHz
HD Graphics 5600
fps
100%
Radeon R7 (Bristol Ridge):
79 fps
143%
HD Graphics 5600:
112.7 [X] MSI GT72 Intel Core i7-5700HQ 2.7GHz
HD Graphics 5600
fps
100%
Radeon R7 (Bristol Ridge):
27.3 fps
100%
HD Graphics 5600:
27.4 [X] MSI GT72 Intel Core i7-5700HQ 2.7GHz
HD Graphics 5600
fps
100%
Radeon R7 (Bristol Ridge):
15.2 fps
85%
HD Graphics 5600:
12.9 [X] MSI GT72 Intel Core i7-5700HQ 2.7GHz
HD Graphics 5600
fps
HD Graphics 5600:
12.5 [X] MSI GT72 Intel Core i7-5700HQ 2.7GHz
HD Graphics 5600
fps
100%
Radeon R7 (Bristol Ridge):
41.5 fps
100%
Radeon R7 (Bristol Ridge):
38.1 fps
100%
Radeon R7 (Bristol Ridge):
10 fps
100%
Radeon R7 (Bristol Ridge):
37.7 fps
100%
HD Graphics 5600:
37.8 [X] MSI GT72 Intel Core i7-5700HQ 2.7GHz
HD Graphics 5600
fps
100%
Radeon R7 (Bristol Ridge):
32.1 fps
83%
HD Graphics 5600:
26.8 [X] MSI GT72 Intel Core i7-5700HQ 2.7GHz
HD Graphics 5600
fps
100%
Radeon R7 (Bristol Ridge):
12.9 fps
84%
HD Graphics 5600:
10.8 [X] MSI GT72 Intel Core i7-5700HQ 2.7GHz
HD Graphics 5600
fps
HD Graphics 5600:
6 [X] MSI GT72 Intel Core i7-5700HQ 2.7GHz
HD Graphics 5600
fps
HD Graphics 5600:
19 [X] MSI GT72 Intel Core i7-5700HQ 2.7GHz
HD Graphics 5600
fps
HD Graphics 5600:
13.5 [X] MSI GT72 Intel Core i7-5700HQ 2.7GHz
HD Graphics 5600
fps
HD Graphics 5600:
7.7 [X] MSI GT72 Intel Core i7-5700HQ 2.7GHz
HD Graphics 5600
fps
HD Graphics 5600:
6.7 [X] MSI GT72 Intel Core i7-5700HQ 2.7GHz
HD Graphics 5600
fps
100%
Radeon R7 (Bristol Ridge):
29.9 fps
107%
HD Graphics 5600:
32.1 [X] MSI GT72 Intel Core i7-5700HQ 2.7GHz
HD Graphics 5600
fps
100%
Radeon R7 (Bristol Ridge):
27.3 fps
74%
HD Graphics 5600:
20.3 [X] MSI GT72 Intel Core i7-5700HQ 2.7GHz
HD Graphics 5600
fps
100%
Radeon R7 (Bristol Ridge):
16.7 fps
43%
HD Graphics 5600:
7.2 [X] MSI GT72 Intel Core i7-5700HQ 2.7GHz
HD Graphics 5600
fps
HD Graphics 5600:
4.2 [X] MSI GT72 Intel Core i7-5700HQ 2.7GHz
HD Graphics 5600
fps
HD Graphics 5600:
22.5 [X] MSI GT72 Intel Core i7-5700HQ 2.7GHz
HD Graphics 5600
fps
HD Graphics 5600:
16.3 [X] MSI GT72 Intel Core i7-5700HQ 2.7GHz
HD Graphics 5600
fps
HD Graphics 5600:
8.4 [X] MSI GT72 Intel Core i7-5700HQ 2.7GHz
HD Graphics 5600
fps
HD Graphics 5600:
6.3 [X] MSI GT72 Intel Core i7-5700HQ 2.7GHz
HD Graphics 5600
fps
HD Graphics 5600:
0 (!) [X] MSI GT72 Intel Core i7-5700HQ 2.7GHz
HD Graphics 5600
fps
HD Graphics 5600:
0 (!) [X] MSI GT72 Intel Core i7-5700HQ 2.7GHz
HD Graphics 5600
fps
HD Graphics 5600:
0 (!) [X] MSI GT72 Intel Core i7-5700HQ 2.7GHz
HD Graphics 5600
fps
HD Graphics 5600:
0 (!) [X] MSI GT72 Intel Core i7-5700HQ 2.7GHz
HD Graphics 5600
fps
100%
Radeon R7 (Bristol Ridge):
16 fps
279%
HD Graphics 5600:
44.6 [X] MSI GT72 Intel Core i7-5700HQ 2.7GHz
HD Graphics 5600
fps
HD Graphics 5600:
21.8 [X] MSI GT72 Intel Core i7-5700HQ 2.7GHz
HD Graphics 5600
fps
HD Graphics 5600:
9.9 [X] MSI GT72 Intel Core i7-5700HQ 2.7GHz
HD Graphics 5600
fps
HD Graphics 5600:
5.2 [X] MSI GT72 Intel Core i7-5700HQ 2.7GHz
HD Graphics 5600
fps
100%
Radeon R7 (Bristol Ridge):
62 fps
119%
HD Graphics 5600:
74 [X] MSI GT72 Intel Core i7-5700HQ 2.7GHz
HD Graphics 5600
fps
100%
Radeon R7 (Bristol Ridge):
41 fps
120%
HD Graphics 5600:
49 [X] MSI GT72 Intel Core i7-5700HQ 2.7GHz
HD Graphics 5600
fps
100%
Radeon R7 (Bristol Ridge):
31 fps
81%
HD Graphics 5600:
25 [X] MSI GT72 Intel Core i7-5700HQ 2.7GHz
HD Graphics 5600
fps
HD Graphics 5600:
15 [X] MSI GT72 Intel Core i7-5700HQ 2.7GHz
HD Graphics 5600
fps
HD Graphics 5600:
21.8 [X] MSI GT72 Intel Core i7-5700HQ 2.7GHz
HD Graphics 5600
fps
HD Graphics 5600:
14 [X] MSI GT72 Intel Core i7-5700HQ 2.7GHz
HD Graphics 5600
fps
HD Graphics 5600:
6.7 [X] MSI GT72 Intel Core i7-5700HQ 2.7GHz
HD Graphics 5600
fps
HD Graphics 5600:
6.3 [X] MSI GT72 Intel Core i7-5700HQ 2.7GHz
HD Graphics 5600
fps
100%
Radeon R7 (Bristol Ridge):
32 fps
142%
HD Graphics 5600:
45.3 [X] MSI GT72 Intel Core i7-5700HQ 2.7GHz
HD Graphics 5600
fps
100%
Radeon R7 (Bristol Ridge):
20 fps
142%
HD Graphics 5600:
28.3 [X] MSI GT72 Intel Core i7-5700HQ 2.7GHz
HD Graphics 5600
fps
HD Graphics 5600:
14.4 [X] MSI GT72 Intel Core i7-5700HQ 2.7GHz
HD Graphics 5600
fps
HD Graphics 5600:
10.5 [X] MSI GT72 Intel Core i7-5700HQ 2.7GHz
HD Graphics 5600
fps
100%
Radeon R7 (Bristol Ridge):
21.7 fps
147%
HD Graphics 5600:
32 [X] MSI GT72 Intel Core i7-5700HQ 2.7GHz
HD Graphics 5600
fps
100%
Radeon R7 (Bristol Ridge):
14.7 fps
135%
HD Graphics 5600:
19.9 [X] MSI GT72 Intel Core i7-5700HQ 2.7GHz
HD Graphics 5600
fps
HD Graphics 5600:
10.5 [X] MSI GT72 Intel Core i7-5700HQ 2.7GHz
HD Graphics 5600
fps
HD Graphics 5600:
8.3 [X] MSI GT72 Intel Core i7-5700HQ 2.7GHz
HD Graphics 5600
fps
HD Graphics 5600:
65.3 [X] MSI GT72 Intel Core i7-5700HQ 2.7GHz
HD Graphics 5600
fps
HD Graphics 5600:
45.7 [X] MSI GT72 Intel Core i7-5700HQ 2.7GHz
HD Graphics 5600
fps
HD Graphics 5600:
24.7 [X] MSI GT72 Intel Core i7-5700HQ 2.7GHz
HD Graphics 5600
fps
100%
Radeon R7 (Bristol Ridge):
122.3 fps
153%
HD Graphics 5600:
187.4 [X] MSI GT72 Intel Core i7-5700HQ 2.7GHz
HD Graphics 5600
fps
100%
Radeon R7 (Bristol Ridge):
44.8 fps
117%
HD Graphics 5600:
52.6 [X] MSI GT72 Intel Core i7-5700HQ 2.7GHz
HD Graphics 5600
fps
100%
Radeon R7 (Bristol Ridge):
23.2 fps
109%
HD Graphics 5600:
25.2 [X] MSI GT72 Intel Core i7-5700HQ 2.7GHz
HD Graphics 5600
fps
HD Graphics 5600:
16.8 [X] MSI GT72 Intel Core i7-5700HQ 2.7GHz
HD Graphics 5600
fps
100%
Radeon R7 (Bristol Ridge):
91.3 fps
111%
HD Graphics 5600:
101.1 [X] MSI GT72 Intel Core i7-5700HQ 2.7GHz
HD Graphics 5600
fps
100%
Radeon R7 (Bristol Ridge):
40.6 fps
111%
HD Graphics 5600:
44.9 [X] MSI GT72 Intel Core i7-5700HQ 2.7GHz
HD Graphics 5600
fps
100%
Radeon R7 (Bristol Ridge):
21.6 fps
106%
HD Graphics 5600:
22.9 [X] MSI GT72 Intel Core i7-5700HQ 2.7GHz
HD Graphics 5600
fps
HD Graphics 5600:
12.5 [X] MSI GT72 Intel Core i7-5700HQ 2.7GHz
HD Graphics 5600
fps
HD Graphics 5600:
30.3 [X] MSI GT72 Intel Core i7-5700HQ 2.7GHz
HD Graphics 5600
fps
HD Graphics 5600:
17.9 [X] MSI GT72 Intel Core i7-5700HQ 2.7GHz
HD Graphics 5600
fps
HD Graphics 5600:
5.9 [X] MSI GT72 Intel Core i7-5700HQ 2.7GHz
HD Graphics 5600
fps
HD Graphics 5600:
3.8 [X] MSI GT72 Intel Core i7-5700HQ 2.7GHz
HD Graphics 5600
fps
100%
Radeon R7 (Bristol Ridge):
13 15.3 ~ 14 fps
198%
HD Graphics 5600:
27.7 [X] MSI GT72 Intel Core i7-5700HQ 2.7GHz
HD Graphics 5600
fps
100%
Radeon R7 (Bristol Ridge):
10 12.6 ~ 11 fps
145%
HD Graphics 5600:
15.9 [X] MSI GT72 Intel Core i7-5700HQ 2.7GHz
HD Graphics 5600
fps
100%
Radeon R7 (Bristol Ridge):
8 12.3 ~ 10 fps
127%
HD Graphics 5600:
12.7 [X] MSI GT72 Intel Core i7-5700HQ 2.7GHz
HD Graphics 5600
fps
HD Graphics 5600:
6.1 [X] MSI GT72 Intel Core i7-5700HQ 2.7GHz
HD Graphics 5600
fps
138%
HD Graphics 5600:
46.9 [X] MSI GT72 Intel Core i7-5700HQ 2.7GHz
HD Graphics 5600
fps
134%
HD Graphics 5600:
30.9 [X] MSI GT72 Intel Core i7-5700HQ 2.7GHz
HD Graphics 5600
fps
124%
HD Graphics 5600:
18.6 [X] MSI GT72 Intel Core i7-5700HQ 2.7GHz
HD Graphics 5600
fps
100%
Radeon R7 (Bristol Ridge):
5.1 5.6 7.7 ~ 6 fps
100%
HD Graphics 5600:
6 [X] MSI GT72 Intel Core i7-5700HQ 2.7GHz
HD Graphics 5600
fps
100%
Radeon R7 (Bristol Ridge):
48 fps
100%
Radeon R7 (Bristol Ridge):
29 fps
100%
Radeon R7 (Bristol Ridge):
15 fps
100%
Radeon R7 (Bristol Ridge):
11 fps
100%
Radeon R7 (Bristol Ridge):
11 fps
100%
Radeon R7 (Bristol Ridge):
6 fps
100%
Radeon R7 (Bristol Ridge):
16 fps
206%
HD Graphics 5600:
32.9 [X] MSI GT72 Intel Core i7-5700HQ 2.7GHz
HD Graphics 5600
fps
100%
Radeon R7 (Bristol Ridge):
12 fps
200%
HD Graphics 5600:
24 [X] MSI GT72 Intel Core i7-5700HQ 2.7GHz
HD Graphics 5600
fps
HD Graphics 5600:
15.8 [X] MSI GT72 Intel Core i7-5700HQ 2.7GHz
HD Graphics 5600
fps
HD Graphics 5600:
7.5 [X] MSI GT72 Intel Core i7-5700HQ 2.7GHz
HD Graphics 5600
fps
113%
HD Graphics 5600:
57.6 [X] MSI GT72 Intel Core i7-5700HQ 2.7GHz
HD Graphics 5600
fps
101%
HD Graphics 5600:
30.3 [X] MSI GT72 Intel Core i7-5700HQ 2.7GHz
HD Graphics 5600
fps
96%
HD Graphics 5600:
25 [X] MSI GT72 Intel Core i7-5700HQ 2.7GHz
HD Graphics 5600
fps
83%
HD Graphics 5600:
7.5 [X] MSI GT72 Intel Core i7-5700HQ 2.7GHz
HD Graphics 5600
fps
100%
Radeon R7 (Bristol Ridge):
54.9 74.1 ~ 65 fps
126%
HD Graphics 5600:
81.6 [X] MSI GT72 Intel Core i7-5700HQ 2.7GHz
HD Graphics 5600
fps
100%
Radeon R7 (Bristol Ridge):
29.8 36.9 ~ 33 fps
119%
HD Graphics 5600:
39.4 [X] MSI GT72 Intel Core i7-5700HQ 2.7GHz
HD Graphics 5600
fps
100%
Radeon R7 (Bristol Ridge):
20.9 28.1 ~ 25 fps
100%
HD Graphics 5600:
25 [X] MSI GT72 Intel Core i7-5700HQ 2.7GHz
HD Graphics 5600
fps
100%
Radeon R7 (Bristol Ridge):
10.7 12.7 ~ 12 fps
95%
HD Graphics 5600:
11.4 [X] MSI GT72 Intel Core i7-5700HQ 2.7GHz
HD Graphics 5600
fps
HD Graphics 5600:
30.8 [X] MSI GT72 Intel Core i7-5700HQ 2.7GHz
HD Graphics 5600
fps
HD Graphics 5600:
18.8 [X] MSI GT72 Intel Core i7-5700HQ 2.7GHz
HD Graphics 5600
fps
HD Graphics 5600:
12.4 [X] MSI GT72 Intel Core i7-5700HQ 2.7GHz
HD Graphics 5600
fps
HD Graphics 5600:
4.7 [X] MSI GT72 Intel Core i7-5700HQ 2.7GHz
HD Graphics 5600
fps
100%
Radeon R7 (Bristol Ridge):
70 fps
100%
Radeon R7 (Bristol Ridge):
54.6 fps
100%
Radeon R7 (Bristol Ridge):
45.5 fps
100%
Radeon R7 (Bristol Ridge):
41.3 fps
100%
Radeon R7 (Bristol Ridge):
28 fps
100%
Radeon R7 (Bristol Ridge):
19 fps
100%
Radeon R7 (Bristol Ridge):
13 fps
100%
Radeon R7 (Bristol Ridge):
36 fps
100%
Radeon R7 (Bristol Ridge):
29 fps
100%
Radeon R7 (Bristol Ridge):
15 fps
Average Gaming AMD Radeon R7 (Bristol Ridge) → 100% Average Gaming 30-70 fps → 100%
Average Gaming Intel HD Graphics 5600 → 111% Average Gaming 30-70 fps → 128%
For more games that might be playable and a list of all games and graphics cards visit our Gaming List
v1.27
log 16. 06:48:44
#0 checking url part for id 7442 +0s ... 0s
#1 checking url part for id 5949 +0s ... 0s
#2 not redirecting to Ajax server +0s ... 0s
#3 did not recreate cache, as it is less than 5 days old! Created at Sun, 16 Jun 2024 05:38:48 +0200 +0.001s ... 0.001s
#4 composed specs +0.157s ... 0.159s
#5 did output specs +0s ... 0.159s
#6 start showIntegratedCPUs +0s ... 0.159s
#7 getting avg benchmarks for device 7442 +0.064s ... 0.223s
#8 got single benchmarks 7442 +0.031s ... 0.253s
#9 getting avg benchmarks for device 5949 +0.02s ... 0.273s
#10 got single benchmarks 5949 +0.01s ... 0.284s
#11 got avg benchmarks for devices +0s ... 0.284s
#12 min, max, avg, median took s +0.27s ... 0.554s
#13 before gaming benchmark output +0s ... 0.554s
#14 Got 320 rows for game benchmarks. +0.057s ... 0.611s
#15 composed SQL query for gamebenchmarks +0s ... 0.611s
#16 got data and put it in $dataArray +0.053s ... 0.664s
#17 benchmarks composed for output. +0.164s ... 0.828s
#18 calculated avg scores. +0s ... 0.828s
#19 return log +0.081s ... 0.909s
Please share our article, every link counts!
Redaktion, 2017-09- 8 (Update: 2023-07- 1)
 Deutsch
 English
 Español
 Français
 Italiano
 Nederlands
 Polski
 Português
 Русский
 Türkçe
 Svenska
 Chinese
 Magyar