Intel HD Graphics P530 vs 4x NVIDIA RTX A6000 vs Intel HD Graphics 5000
Intel HD Graphics P530 ► remove from comparison
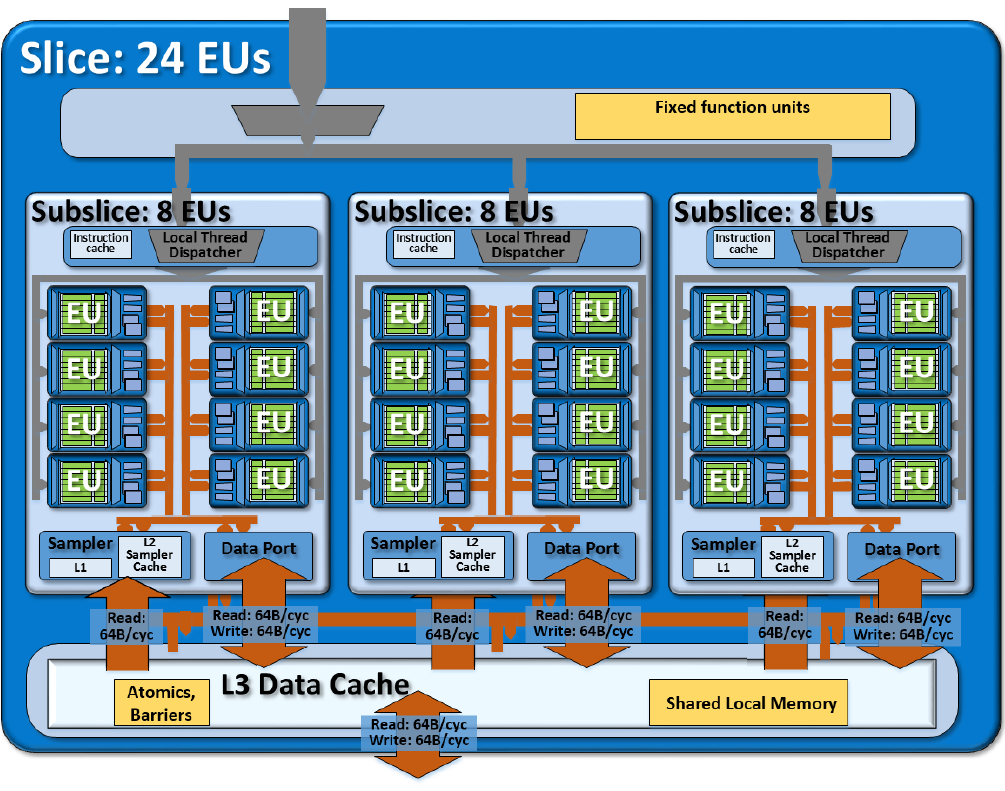
The Intel HD Graphics P530 (GT2) is an integrated graphics unit, which can be found in various Xeon workstation processors of the Skylake generation. The "GT2" version of the Skylake GPU offers 24 Execution Units (EUs) clocked at up to 1050 MHz (depending on the CPU model). Due to its lack of dedicated graphics memory or eDRAM cache, the P530 has to access the main memory (2x 64bit DDR3L-1600 / DDR4-2133).
Performance
Depending on the memory configuration, the HD Graphics P530 is just slightly behind a dedicated GeForce 920M and will handle modern games (as of 2015) in low or medium settings.
Features
The revised video engine now decodes H.265/HEVC completely in hardware and thereby much more efficiently than before. Displays can be connected via DP 1.2 / eDP 1.3 (max. 3840 x 2160 @ 60 Hz), whereas HDMI is limited to the older version 1.4a (max. 3840 x 2160 @ 30 Hz). However, HDMI 2.0 can be added using a DisplayPort converter. Up to three displays can be controlled simultaneously.
Power Consumption
The HD Graphics P530 can be found in mobile quad-core Xeon processors with 45 W TDP.
4x NVIDIA RTX A6000 ► remove from comparison
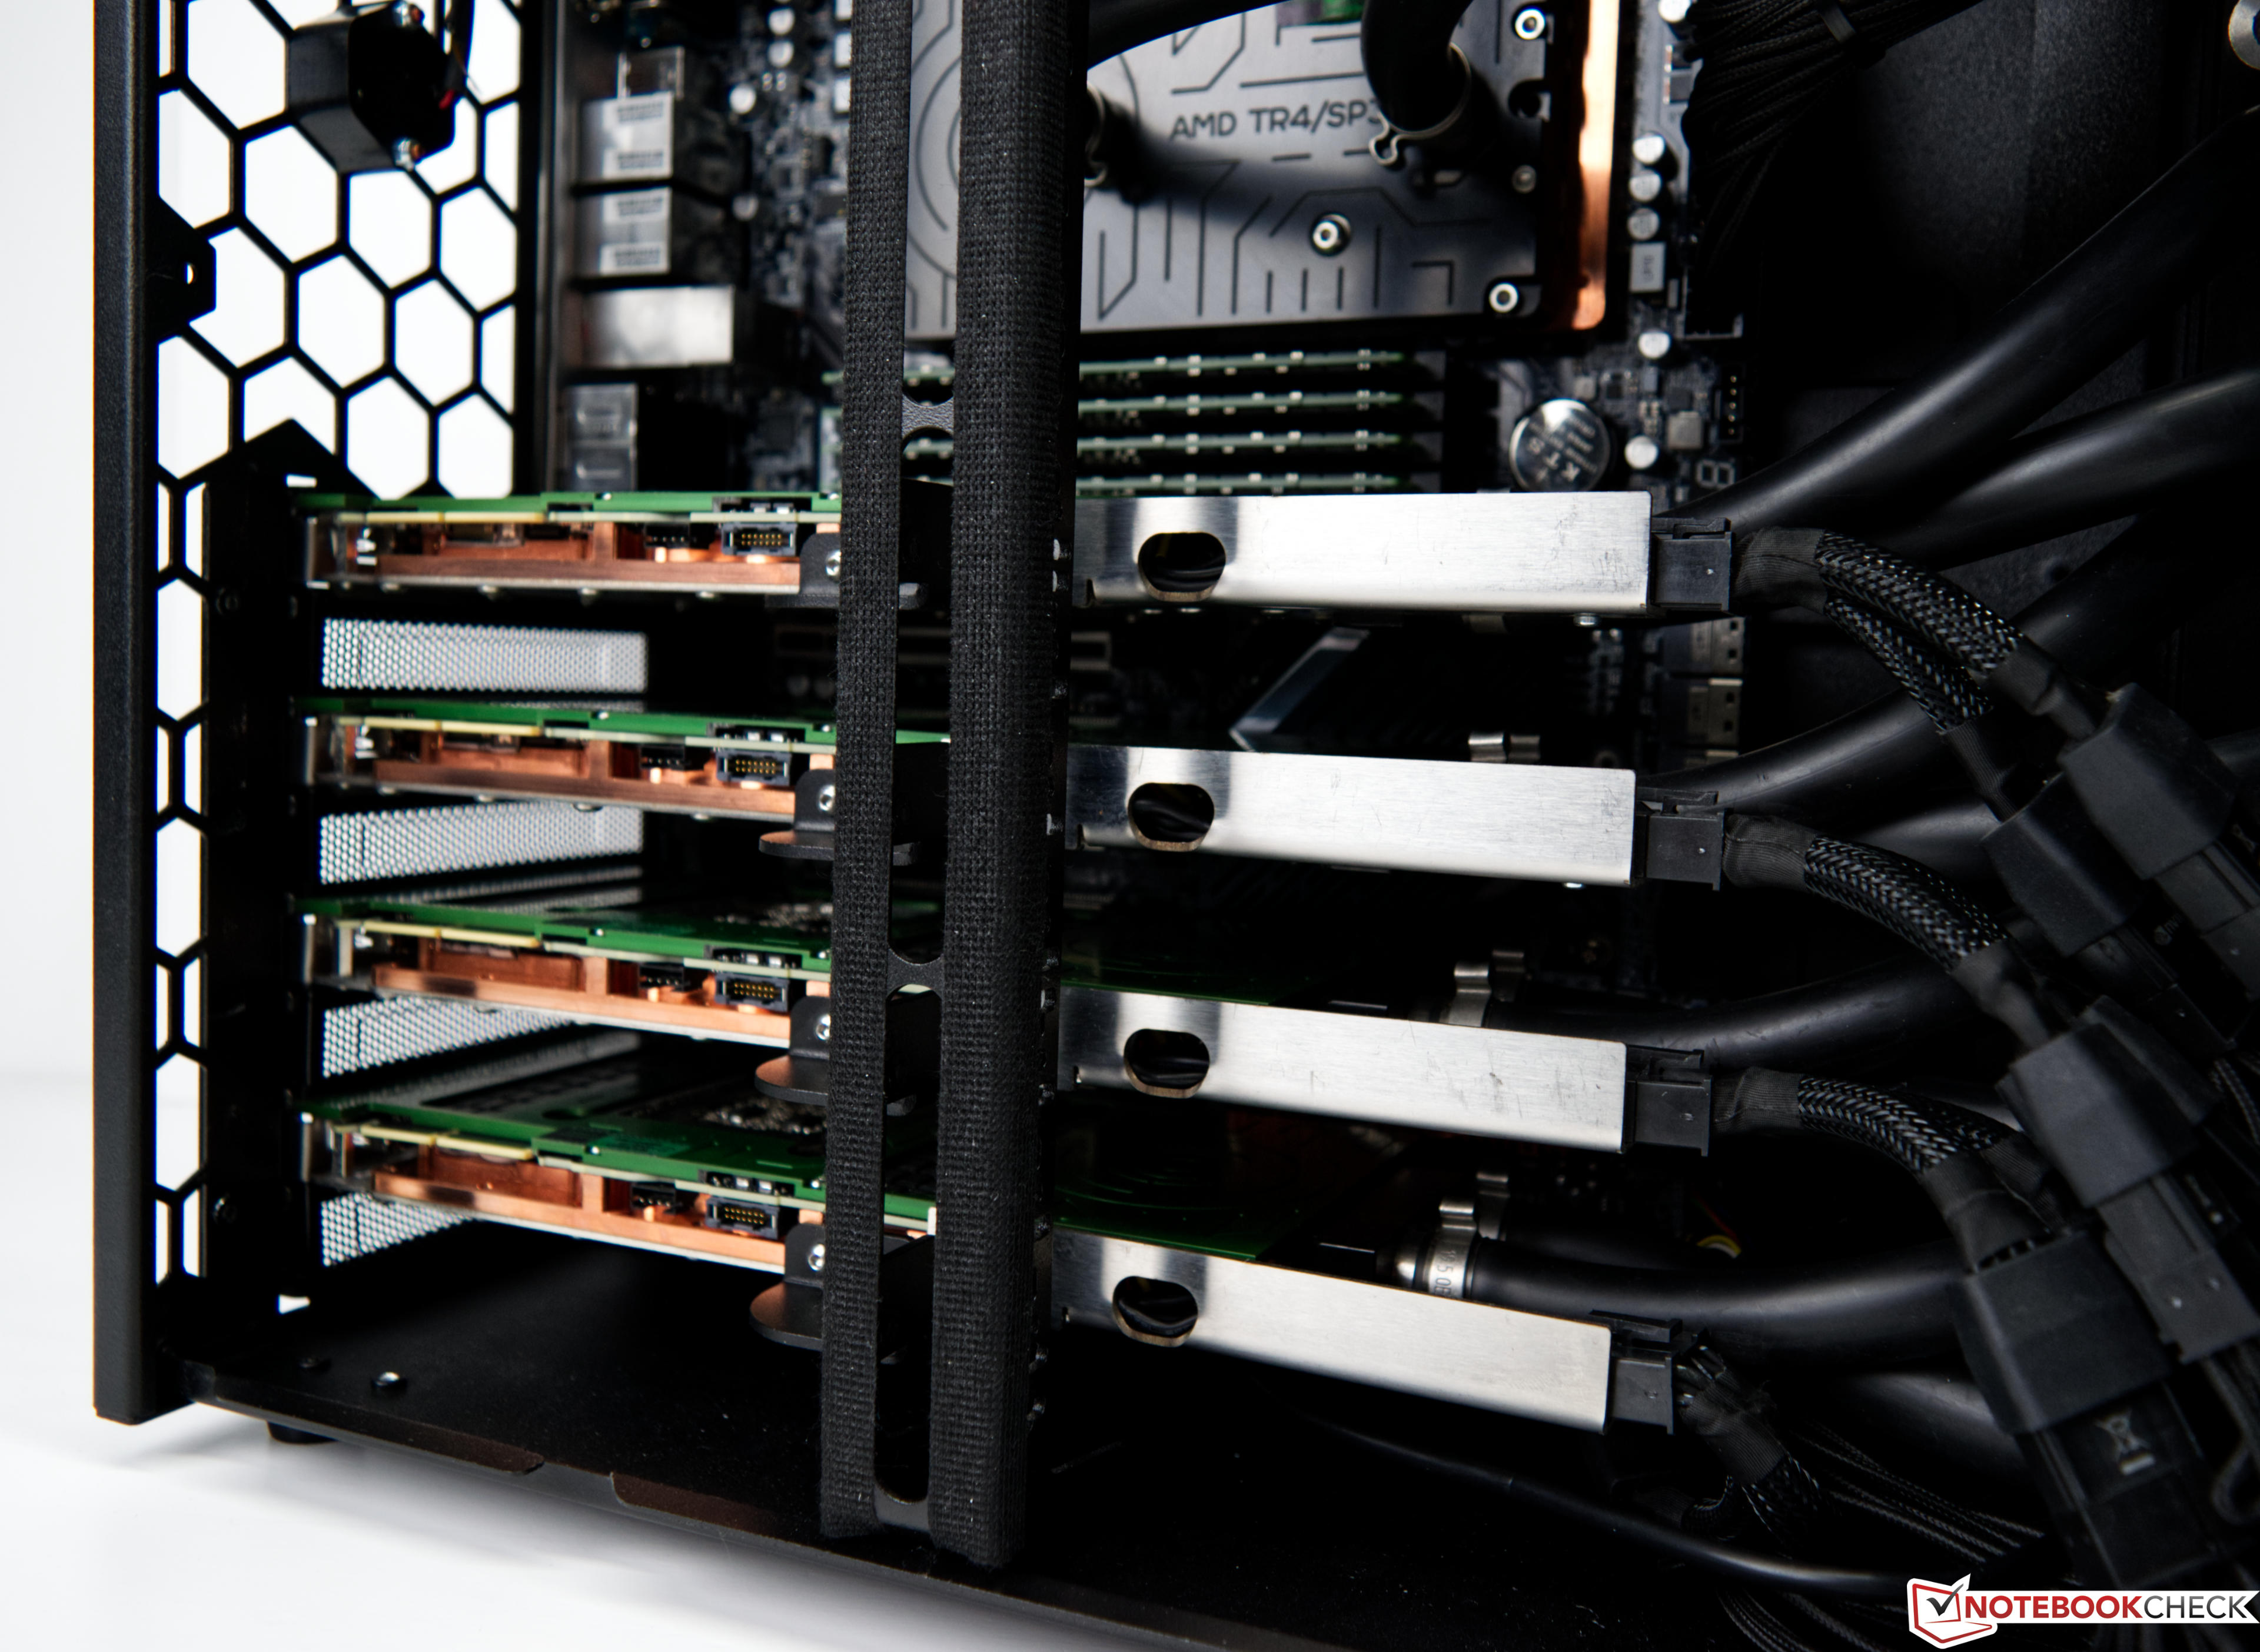
The 4x Nvidia RTX A6000 (Quad NV-Link) is a graphics solution consisting out of four professional RTX A6000 graphics cards connected via NV-Link. Each card uses the GA102 chip and offers 10.752 CUDA cores and 48 GB GDDR6 memory. Only a selected number of professional apps can make use of all four graphics cards, otherwise only one card is used (e.g. in games).
Intel HD Graphics 5000 ► remove from comparison
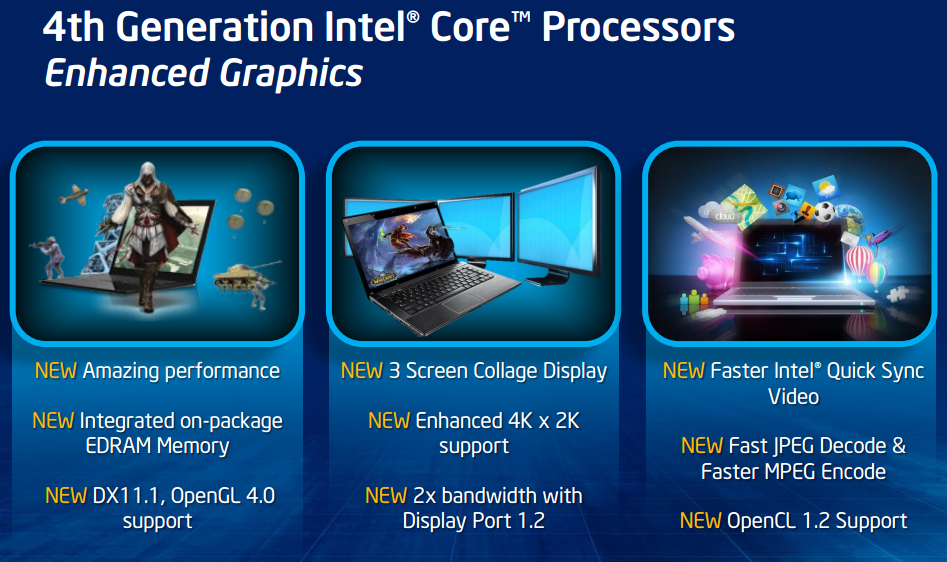
The Intel HD Graphics 5000 (GT3) is a processor graphics card included in some of the ULV Haswell processors of 2013 (e.g. Core i5-4250U ). It represents the highest configuration of the integrated graphics unit (40 execution units), but lacks the additional eDRAM cache of the Iris Pro Graphics 5200 . The relatively low base clock can be automatically overclocked using Turbo Boost technology. Depending on the processor model, the base and turbo clock rates may differ, resulting in varying graphics performance between CPU models.
In comparison to the HD 4000, the graphics core has been modified extensively. The GPU supports DirectX 11.1, OpenCL 1.2 and OpenGL 4.0. It also features an improved decoder for 4K videos and the fast Quick Sync encoder.
According to benchmarks in 3DMark 11, the HD Graphics 5000 is up to 50 percent faster than the previous HD 4000 . In games, however, the performance advantage is significantly lower. With simultaneous load on the CPU, the low TDP of the ULV models (15 W) limits the Turbo Boost of the GPU. Although the HD 5000 features 40 Execution Units, the graphics performance is still somewhat below the HD Graphics 4600 with only 20 EUs (HD 4000 : 16 EUs). Overall, the HD 5000 is thus just behind the AMD Radeon HD 7660G and at the level of a dedicated Radeon HD 7650M . Current games (as of 2013) will run fluently in low to medium-low settings.
Due to the 22nm 3D Tri-Gate production process, power consumption is relatively low. The HD Graphics 5000 is available on certain ULV dual-core Haswell models in the 15 Watt TDP range.
Intel HD Graphics P530 4x NVIDIA RTX A6000 Intel HD Graphics 5000 HD Graphics Series NVIDIA RTX A6000 (Quad NV-Link) 10752 @ 1.41 - 1.8 GHz 384 Bit @ 16000 MHz NVIDIA RTX A6000 10752 @ 1.41 - 1.8 GHz 384 Bit @ 16000 MHz
Codename Skylake GT2 Ampere Haswell GT3 Architecture Gen. 9 Skylake Ampere Gen. 7.5 Haswell Pipelines 24 - unified 10752 - unified 40 - unified Core Speed 350 - 1050 (Boost) MHz 1410 - 1800 (Boost) MHz 200 - 1100 (Boost) MHz Memory Bus Width 64/128 Bit 384 Bit 64/128 Bit Memory Type DDR3/DDR4 GDDR6 Shared Memory yes no yes API DirectX 12_1, OpenGL 4.4 DirectX 12_2, Shader 6.6, OpenGL 4.6 DirectX 11.1, Shader 5.0, OpenGL 4.0 technology 14 nm 8 nm 22 nm Features QuickSync QuickSync Date of Announcement 01.09.2015 05.10.2020 05.06.2013 Memory Speed 16000 MHz Max. Amount of Memory 48 GB Power Consumption 300 Watt Transistors 28.3 Billion
Benchmarks Performance Rating - 3DMark 11 + Fire Strike + Time Spy - NVIDIA RTX A6000 (Quad NV-Link)
12.7 pt (38%)
...
max:
Performance Rating - 3DMark 11 + Fire Strike + Time Spy - HD Graphics 5000
0.3 pt (1%)
...
...
max:
3DMark - 3DMark Time Spy Score
min: 10303 avg: 11122 median: 11122 (32%) max: 11941 Points
3DMark - 3DMark Time Spy Graphics
10167 Points (27%)
3DMark - 3DMark Ice Storm Unlimited Graphics
440592 Points (50%)
65904 Points (7%)
GPU TDP ? TDP 300 W 15% 100%
3DMark - 3DMark Ice Storm Extreme Graphics
404406 Points (52%)
37346 Points (5%)
GPU TDP ? TDP 300 W 9% 100%
3DMark - 3DMark Cloud Gate Score
41996 Points (45%)
min: 4331 avg: 4586 median: 4496.5 (5%) max: 5059 Points
GPU TDP ? TDP 300 W 11% 100%
3DMark - 3DMark Cloud Gate Graphics
92363 Points (24%)
min: 5381 avg: 5981 median: 5693.5 (1%) max: 6762 Points
GPU TDP ? TDP 300 W 6% 100%
3DMark - 3DMark Fire Strike Standard Score
24576 Points (43%)
min: 583 avg: 669 median: 651 (1%) max: 808 Points
GPU TDP ? TDP 300 W 3% 100%
3DMark - 3DMark Fire Strike Standard Graphics
27937 Points (32%)
min: 620 avg: 725 median: 715.5 (1%) max: 875 Points
GPU TDP ? TDP 300 W 3% 100%
3DMark - 3DMark Ice Storm Graphics
407114 Points (49%)
min: 35584 avg: 41867 median: 40454 (5%) max: 52302 Points
GPU TDP ? TDP 300 W 10% 100%
3DMark - 3DMark Night Raid
min: 43353 avg: 49697 median: 49696.5 (47%) max: 56040 Points
3DMark - 3DMark Night Raid Graphics Score
min: 72784 avg: 102103 median: 102102 (39%) max: 131421 Points
3DMark 11 - 3DM11 Performance Score
29277 Points (41%)
min: 962 avg: 1088 median: 1125.5 (2%) max: 1163 Points
GPU TDP ? TDP 300 W 4% 100%
3DMark 11 - 3DM11 Performance GPU
38132 Points (33%)
min: 859 avg: 993 median: 1033.5 (1%) max: 1072 Points
GPU TDP ? TDP 300 W 3% 100%
3DMark Vantage + 4x NVIDIA RTX A6000 3DMark Vantage - 3DM Vant. Perf. total
78808 Points (23%)
3DM Vant. Perf. total + Intel HD Graphics 5000
min: 3418 avg: 4231 median: 4276.5 (1%) max: 4734 Points
GPU TDP ? TDP 300 W 5% 100%
3DM Vant. Perf. GPU no PhysX + 4x NVIDIA RTX A6000 3DMark Vantage - 3DM Vant. Perf. GPU no PhysX
83834 Points (48%)
3DM Vant. Perf. GPU no PhysX + Intel HD Graphics 5000
min: 2917 avg: 3639 median: 3665 (2%) max: 4108 Points
GPU TDP ? TDP 300 W 4% 100%
3DMark 03 - 3DMark 03 - Standard
min: 15752 avg: 18768 median: 18768 (10%) max: 21784 Points
3DMark 05 - 3DMark 05 - Standard
35288 Points (39%)
min: 9623 avg: 9763 median: 9763 (11%) max: 9903 Points
GPU TDP ? TDP 300 W 28% 100%
3DMark 06 3DMark 06 - Standard 1280x1024 + 4x NVIDIA RTX A6000
38668 Points (51%)
3DMark 06 - Standard 1280x1024 + Intel HD Graphics 5000
min: 4751 avg: 5775 median: 5940 (8%) max: 6160 Points
GPU TDP ? TDP 300 W 15% 100%
3DMark 06 - Standard 1280x800 + Intel HD Graphics 5000
6675 Points (9%)
Unigine Valley 1.0 - Unigine Valley 1.0 DX
134.7 fps (44%)
Unigine Heaven 3.0 - Unigine Heaven 3.0 DX 11
12.1 fps (4%)
Unigine Heaven 3.0 - Unigine Heaven 3.0 OpenGL
12.1 fps (5%)
Unigine Heaven 2.1 - Heaven 2.1 high
min: 12.3 avg: 13 median: 13.1 (2%) max: 13.5 fps
SPECviewperf 11 + Intel HD Graphics 5000 SPECviewperf 11 - specvp11 snx-01
min: 1.26 avg: 1.5 median: 1.5 (1%) max: 1.64 fps
specvp11 tcvis-02 + Intel HD Graphics 5000 SPECviewperf 11 - specvp11 tcvis-02
min: 1.77 avg: 2.1 median: 2.1 (1%) max: 2.51 fps
specvp11 sw-02 + Intel HD Graphics 5000 SPECviewperf 11 - specvp11 sw-02
min: 7.95 avg: 9.9 median: 9.9 (8%) max: 11.8 fps
specvp11 proe-05 + Intel HD Graphics 5000 SPECviewperf 11 - specvp11 proe-05
min: 1.42 avg: 1.6 median: 1.6 (2%) max: 1.78 fps
specvp11 maya-03 + Intel HD Graphics 5000 SPECviewperf 11 - specvp11 maya-03
min: 12.95 avg: 14.2 median: 14.2 (11%) max: 15.43 fps
specvp11 lightwave-01 + Intel HD Graphics 5000 SPECviewperf 11 - specvp11 lightwave-01
min: 13.34 avg: 14.5 median: 14.5 (16%) max: 15.62 fps
specvp11 ensight-04 + Intel HD Graphics 5000 SPECviewperf 11 - specvp11 ensight-04
min: 2.06 avg: 2.1 median: 2.1 (1%) max: 2.11 fps
specvp11 catia-03 + Intel HD Graphics 5000 SPECviewperf 11 - specvp11 catia-03
4.5 fps (2%)
SPECviewperf 12 + 4x NVIDIA RTX A6000 SPECviewperf 12 - specvp12 sw-03
208 fps (52%)
specvp12 snx-02 + 4x NVIDIA RTX A6000 SPECviewperf 12 - specvp12 snx-02
333 fps (49%)
specvp12 showcase-01 + 4x NVIDIA RTX A6000 SPECviewperf 12 - specvp12 showcase-01
237 fps (52%)
specvp12 mediacal-01 + 4x NVIDIA RTX A6000 SPECviewperf 12 - specvp12 mediacal-01
156 fps (40%)
specvp12 maya-04 + 4x NVIDIA RTX A6000 SPECviewperf 12 - specvp12 maya-04
147 fps (40%)
specvp12 energy-01 + 4x NVIDIA RTX A6000 SPECviewperf 12 - specvp12 energy-01
39.3 fps (35%)
specvp12 creo-01 + 4x NVIDIA RTX A6000 SPECviewperf 12 - specvp12 creo-01
127 fps (51%)
specvp12 catia-04 + 4x NVIDIA RTX A6000 SPECviewperf 12 - specvp12 catia-04
208 fps (34%)
specvp12 3dsmax-05 + 4x NVIDIA RTX A6000 SPECviewperf 12 - specvp12 3dsmax-05
245 fps (43%)
SPECviewperf 13 specvp13 sw-04 + 4x NVIDIA RTX A6000 SPECviewperf 13 - specvp13 sw-04
191 fps (51%)
specvp13 snx-03 + 4x NVIDIA RTX A6000 SPECviewperf 13 - specvp13 snx-03
604 fps (67%)
specvp13 showcase-02 + 4x NVIDIA RTX A6000 SPECviewperf 13 - specvp13 showcase-02
239 fps (52%)
specvp13 medical-02 + 4x NVIDIA RTX A6000 SPECviewperf 13 - specvp13 medical-02
180 fps (38%)
specvp13 maya-05 + 4x NVIDIA RTX A6000 SPECviewperf 13 - specvp13 maya-05
405 fps (46%)
specvp13 energy-02 + 4x NVIDIA RTX A6000 SPECviewperf 13 - specvp13 energy-02
128 fps (41%)
specvp13 creo-02 + 4x NVIDIA RTX A6000 SPECviewperf 13 - specvp13 creo-02
292 fps (43%)
specvp13 catia-05 + 4x NVIDIA RTX A6000 SPECviewperf 13 - specvp13 catia-05
359 fps (40%)
specvp13 3dsmax-06 + 4x NVIDIA RTX A6000 SPECviewperf 13 - specvp13 3dsmax-06
247 fps (43%)
SPECviewperf 2020 specvp2020 solidworks-05 4k + 4x NVIDIA RTX A6000 SPECviewperf 2020 - specvp2020 solidworks-05 4k
141 fps (42%)
specvp2020 snx-04 4k + 4x NVIDIA RTX A6000 SPECviewperf 2020 - specvp2020 snx-04 4k
367 fps (38%)
specvp2020 medical-03 4k + 4x NVIDIA RTX A6000 SPECviewperf 2020 - specvp2020 medical-03 4k
32.1 fps (31%)
specvp2020 maya-06 4k + 4x NVIDIA RTX A6000 SPECviewperf 2020 - specvp2020 maya-06 4k
262 fps (43%)
specvp2020 energy-03 4k + 4x NVIDIA RTX A6000 SPECviewperf 2020 - specvp2020 energy-03 4k
46.1 fps (10%)
specvp2020 creo-03 4k + 4x NVIDIA RTX A6000 SPECviewperf 2020 - specvp2020 creo-03 4k
75.6 fps (36%)
specvp2020 catia-06 4k + 4x NVIDIA RTX A6000 SPECviewperf 2020 - specvp2020 catia-06 4k
67.5 fps (44%)
specvp2020 3dsmax-07 4k + 4x NVIDIA RTX A6000 SPECviewperf 2020 - specvp2020 3dsmax-07 4k
95.7 fps (40%)
Windows 7 Experience Index - Win7 Gaming graphics
min: 6.5 avg: 6.6 median: 6.6 (84%) max: 6.7 Points
Windows 7 Experience Index - Win7 Graphics
min: 5.8 avg: 5.9 median: 5.9 (74%) max: 5.9 Points
Cinebench R10 Cinebench R10 Shading (32bit) + 4x NVIDIA RTX A6000 Cinebench R10 - Cinebench R10 Shading (32bit)
6831 Points (5%)
Cinebench R10 Shading (32bit) + Intel HD Graphics 5000
min: 5143 avg: 6901 median: 6946.5 (5%) max: 7959 Points
GPU TDP ? TDP 300 W 100% 99%
Cinebench R11.5 Cinebench R11.5 OpenGL 64 Bit + 4x NVIDIA RTX A6000 Cinebench R11.5 - Cinebench R11.5 OpenGL 64 Bit
76.2 fps (26%)
Cinebench R11.5 OpenGL 64 Bit + Intel HD Graphics 5000
min: 15.01 avg: 19.6 median: 19.6 (7%) max: 24.76 fps
GPU TDP ? TDP 300 W 26% 100%
Cinebench R15 + 4x NVIDIA RTX A6000 Cinebench R15 - Cinebench R15 OpenGL 64 Bit
204.8 fps (12%)
Cinebench R15 OpenGL 64 Bit + Intel HD Graphics 5000
min: 24.15 avg: 27.4 median: 27.4 (2%) max: 30.64 fps
GPU TDP ? TDP 300 W 13% 100%
Cinebench R15 OpenGL Ref. Match 64 Bit + 4x NVIDIA RTX A6000 Cinebench R15 - Cinebench R15 OpenGL Ref. Match 64 Bit
99.6 % (100%)
Cinebench R15 OpenGL Ref. Match 64 Bit + Intel HD Graphics 5000
min: 63.3 avg: 81.1 median: 80.7 (81%) max: 99.6 %
GPU TDP ? TDP 300 W 81% 100%
GFXBench 3.0 - GFXBench 3.0 Manhattan Offscreen
22.5 fps (1%)
GFXBench (DX / GLBenchmark) 2.7 + Intel HD Graphics 5000 GFXBench (DX / GLBenchmark) 2.7 - GFXBench T-Rex HD Offscreen C24Z16
min: 62 avg: 72.5 median: 72.5 (1%) max: 83 fps
LuxMark v2.0 64Bit - LuxMark v2.0 Room GPU
22134 Samples/s (100%)
min: 139 avg: 187 median: 201 (1%) max: 221 Samples/s
GPU TDP ? TDP 300 W 1% 100%
LuxMark v2.0 64Bit - LuxMark v2.0 Sala GPU
57054 Samples/s (100%)
min: 286 avg: 305.3 median: 306 (1%) max: 324 Samples/s
GPU TDP ? TDP 300 W 1% 100%
ComputeMark v2.1 - ComputeMark v2.1 Result
43210 Points (47%)
min: 775 avg: 817 median: 816.5 (1%) max: 858 Points
GPU TDP ? TDP 300 W 2% 100%
Power Consumption - Furmark Stress Test Power Consumption - external Monitor *
650 Watt (92%)
Power Consumption - The Witcher 3 Power Consumption - external Monitor *
716 Watt (100%)
Power Consumption - Witcher 3 ultra Power Efficiency - external Monitor
0.2 fps per Watt (20%)
Average Benchmarks 4x NVIDIA RTX A6000 → 0% n= Average Benchmarks Intel HD Graphics 5000 → 0% n=
- Range of benchmark values for this graphics card
- Average benchmark values for this graphics card
* Smaller numbers mean a higher performance
1 This benchmark is not used for the average calculation
Game Benchmarks The following benchmarks stem from our benchmarks of review laptops. The performance depends on the used graphics memory, clock rate, processor, system settings, drivers, and operating systems. So the results don't have to be representative for all laptops with this GPU. For detailed information on the benchmark results, click on the fps number.
NVIDIA RTX A6000 (Quad NV-Link):
328 [X] 815237
AMD Ryzen Threadripper PRO 3975WX 3.5GHz
NVIDIA RTX A6000 (Quad NV-Link)
min:
255 fps, P1:
226 fps, max:
360 fps
fps
NVIDIA RTX A6000 (Quad NV-Link):
303 [X] 815237
AMD Ryzen Threadripper PRO 3975WX 3.5GHz
NVIDIA RTX A6000 (Quad NV-Link)
min:
226 fps, P1:
207 fps, max:
346 fps
fps
NVIDIA RTX A6000 (Quad NV-Link):
278 [X] 815237
AMD Ryzen Threadripper PRO 3975WX 3.5GHz
NVIDIA RTX A6000 (Quad NV-Link)
min:
200 fps, P1:
169 fps, max:
327 fps
fps
NVIDIA RTX A6000 (Quad NV-Link):
159 [X] 815237
AMD Ryzen Threadripper PRO 3975WX 3.5GHz
NVIDIA RTX A6000 (Quad NV-Link)
min:
131 fps, P1:
117 fps, max:
171 fps
fps
NVIDIA RTX A6000 (Quad NV-Link):
149 [X] 815237
AMD Ryzen Threadripper PRO 3975WX 3.5GHz
NVIDIA RTX A6000 (Quad NV-Link)
min:
111 fps, P1:
100 fps, max:
158 fps
fps
NVIDIA RTX A6000 (Quad NV-Link):
96.8 [X] 815237
AMD Ryzen Threadripper PRO 3975WX 3.5GHz
NVIDIA RTX A6000 (Quad NV-Link)
min:
80 fps, P1:
81 fps, max:
107 fps
fps
NVIDIA RTX A6000 (Quad NV-Link):
277 [X] 759689
AMD Ryzen Threadripper PRO 3975WX 3.5GHz
NVIDIA RTX A6000 (Quad NV-Link)
min:
231 fps, max:
300 fps
fps
NVIDIA RTX A6000 (Quad NV-Link):
241 [X] 759689
AMD Ryzen Threadripper PRO 3975WX 3.5GHz
NVIDIA RTX A6000 (Quad NV-Link)
min:
193 fps, max:
274 fps
fps
NVIDIA RTX A6000 (Quad NV-Link):
241 [X] 759689
AMD Ryzen Threadripper PRO 3975WX 3.5GHz
NVIDIA RTX A6000 (Quad NV-Link)
min:
202 fps, max:
267 fps
fps
NVIDIA RTX A6000 (Quad NV-Link):
221 [X] 759689
AMD Ryzen Threadripper PRO 3975WX 3.5GHz
NVIDIA RTX A6000 (Quad NV-Link)
min:
170 fps, max:
254 fps
fps
NVIDIA RTX A6000 (Quad NV-Link):
210 [X] 759689
AMD Ryzen Threadripper PRO 3975WX 3.5GHz
NVIDIA RTX A6000 (Quad NV-Link)
min:
170 fps, max:
249 fps
fps
NVIDIA RTX A6000 (Quad NV-Link):
136 [X] 759689
AMD Ryzen Threadripper PRO 3975WX 3.5GHz
NVIDIA RTX A6000 (Quad NV-Link)
min:
114 fps, max:
160 fps
fps
NVIDIA RTX A6000 (Quad NV-Link):
40 [X] AMD Ryzen Threadripper PRO 3975WX 3.5GHz
NVIDIA RTX A6000 (Quad NV-Link)
min:
23 fps, max:
65 fps
fps
NVIDIA RTX A6000 (Quad NV-Link):
40 [X] AMD Ryzen Threadripper PRO 3975WX 3.5GHz
NVIDIA RTX A6000 (Quad NV-Link)
min:
23 fps, max:
59 fps
fps
NVIDIA RTX A6000 (Quad NV-Link):
38 [X] AMD Ryzen Threadripper PRO 3975WX 3.5GHz
NVIDIA RTX A6000 (Quad NV-Link)
min:
25 fps, max:
54 fps
fps
NVIDIA RTX A6000 (Quad NV-Link):
37 [X] AMD Ryzen Threadripper PRO 3975WX 3.5GHz
NVIDIA RTX A6000 (Quad NV-Link)
min:
23 fps, max:
59 fps
fps
NVIDIA RTX A6000 (Quad NV-Link):
37 [X] AMD Ryzen Threadripper PRO 3975WX 3.5GHz
NVIDIA RTX A6000 (Quad NV-Link)
min:
22 fps, max:
51 fps
fps
NVIDIA RTX A6000 (Quad NV-Link):
36 [X] AMD Ryzen Threadripper PRO 3975WX 3.5GHz
NVIDIA RTX A6000 (Quad NV-Link)
min:
20 fps, max:
55 fps
fps
NVIDIA RTX A6000 (Quad NV-Link):
119 [X] AMD Ryzen Threadripper PRO 3975WX 3.5GHz
NVIDIA RTX A6000 (Quad NV-Link)
min:
72.6 fps, max:
199.68 fps
fps
NVIDIA RTX A6000 (Quad NV-Link):
106 [X] AMD Ryzen Threadripper PRO 3975WX 3.5GHz
NVIDIA RTX A6000 (Quad NV-Link)
min:
66.01 fps, max:
175.96 fps
fps
NVIDIA RTX A6000 (Quad NV-Link):
95.7 [X] AMD Ryzen Threadripper PRO 3975WX 3.5GHz
NVIDIA RTX A6000 (Quad NV-Link)
min:
59.73 fps, max:
153.09 fps
fps
NVIDIA RTX A6000 (Quad NV-Link):
87.9 [X] AMD Ryzen Threadripper PRO 3975WX 3.5GHz
NVIDIA RTX A6000 (Quad NV-Link)
min:
56.75 fps, max:
137.17 fps
fps
NVIDIA RTX A6000 (Quad NV-Link):
83.5 [X] AMD Ryzen Threadripper PRO 3975WX 3.5GHz
NVIDIA RTX A6000 (Quad NV-Link)
min:
56.07 fps, max:
126.84 fps
fps
NVIDIA RTX A6000 (Quad NV-Link):
67 [X] AMD Ryzen Threadripper PRO 3975WX 3.5GHz
NVIDIA RTX A6000 (Quad NV-Link)
min:
41.38 fps, max:
103.26 fps
fps
NVIDIA RTX A6000 (Quad NV-Link):
317 [X] 1.47.22.14 D3D12
AMD Ryzen Threadripper PRO 3975WX 3.5GHz
NVIDIA RTX A6000 (Quad NV-Link)
min:
41.3 fps, P1:
235 fps, max:
482 fps
fps
NVIDIA RTX A6000 (Quad NV-Link):
260 [X] 1.47.22.14 D3D12
AMD Ryzen Threadripper PRO 3975WX 3.5GHz
NVIDIA RTX A6000 (Quad NV-Link)
min:
47.8 fps, P1:
188 fps, max:
444 fps
fps
NVIDIA RTX A6000 (Quad NV-Link):
257 [X] 1.47.22.14 D3D12
AMD Ryzen Threadripper PRO 3975WX 3.5GHz
NVIDIA RTX A6000 (Quad NV-Link)
min:
52.3 fps, P1:
186 fps, max:
429 fps
fps
NVIDIA RTX A6000 (Quad NV-Link):
258 [X] 1.47.22.14 D3D12
AMD Ryzen Threadripper PRO 3975WX 3.5GHz
NVIDIA RTX A6000 (Quad NV-Link)
min:
38.6 fps, P1:
179 fps, max:
419 fps
fps
NVIDIA RTX A6000 (Quad NV-Link):
252 [X] 1.47.22.14 D3D12
AMD Ryzen Threadripper PRO 3975WX 3.5GHz
NVIDIA RTX A6000 (Quad NV-Link)
min:
62.6 fps, P1:
175 fps, max:
406 fps
fps
NVIDIA RTX A6000 (Quad NV-Link):
246 [X] 1.47.22.14 D3D12
AMD Ryzen Threadripper PRO 3975WX 3.5GHz
NVIDIA RTX A6000 (Quad NV-Link)
min:
41 fps, P1:
167 fps, max:
401 fps
fps
NVIDIA RTX A6000 (Quad NV-Link):
18 [X] AMD Ryzen Threadripper PRO 3975WX 3.5GHz
NVIDIA RTX A6000 (Quad NV-Link)
min:
11 fps, max:
34 fps
fps
NVIDIA RTX A6000 (Quad NV-Link):
18 [X] AMD Ryzen Threadripper PRO 3975WX 3.5GHz
NVIDIA RTX A6000 (Quad NV-Link)
min:
12 fps, max:
31 fps
fps
NVIDIA RTX A6000 (Quad NV-Link):
17 [X] AMD Ryzen Threadripper PRO 3975WX 3.5GHz
NVIDIA RTX A6000 (Quad NV-Link)
min:
11 fps, max:
25 fps
fps
NVIDIA RTX A6000 (Quad NV-Link):
18 [X] AMD Ryzen Threadripper PRO 3975WX 3.5GHz
NVIDIA RTX A6000 (Quad NV-Link)
min:
9 fps, max:
30 fps
fps
NVIDIA RTX A6000 (Quad NV-Link):
17 [X] AMD Ryzen Threadripper PRO 3975WX 3.5GHz
NVIDIA RTX A6000 (Quad NV-Link)
min:
10 fps, max:
29 fps
fps
NVIDIA RTX A6000 (Quad NV-Link):
18 [X] AMD Ryzen Threadripper PRO 3975WX 3.5GHz
NVIDIA RTX A6000 (Quad NV-Link)
min:
11 fps, max:
27 fps
fps
NVIDIA RTX A6000 (Quad NV-Link):
109 [X] AMD Ryzen Threadripper PRO 3975WX 3.5GHz
NVIDIA RTX A6000 (Quad NV-Link)
fps
NVIDIA RTX A6000 (Quad NV-Link):
96.8 [X] AMD Ryzen Threadripper PRO 3975WX 3.5GHz
NVIDIA RTX A6000 (Quad NV-Link)
fps
NVIDIA RTX A6000 (Quad NV-Link):
78.3 [X] AMD Ryzen Threadripper PRO 3975WX 3.5GHz
NVIDIA RTX A6000 (Quad NV-Link)
fps
NVIDIA RTX A6000 (Quad NV-Link):
67.8 [X] AMD Ryzen Threadripper PRO 3975WX 3.5GHz
NVIDIA RTX A6000 (Quad NV-Link)
fps
NVIDIA RTX A6000 (Quad NV-Link):
175 [X] 1.3
AMD Ryzen Threadripper PRO 3975WX 3.5GHz
NVIDIA RTX A6000 (Quad NV-Link)
fps
NVIDIA RTX A6000 (Quad NV-Link):
167 [X] 1.3
AMD Ryzen Threadripper PRO 3975WX 3.5GHz
NVIDIA RTX A6000 (Quad NV-Link)
fps
NVIDIA RTX A6000 (Quad NV-Link):
131 [X] 1.3
AMD Ryzen Threadripper PRO 3975WX 3.5GHz
NVIDIA RTX A6000 (Quad NV-Link)
fps
NVIDIA RTX A6000 (Quad NV-Link):
113 [X] 1.3
AMD Ryzen Threadripper PRO 3975WX 3.5GHz
NVIDIA RTX A6000 (Quad NV-Link)
fps
NVIDIA RTX A6000 (Quad NV-Link):
56.3 [X] 1.3
AMD Ryzen Threadripper PRO 3975WX 3.5GHz
NVIDIA RTX A6000 (Quad NV-Link)
fps
NVIDIA RTX A6000 (Quad NV-Link):
154 [X] AMD Ryzen Threadripper PRO 3975WX 3.5GHz
NVIDIA RTX A6000 (Quad NV-Link)
min:
130.6 fps, max:
-1 fps
fps
NVIDIA RTX A6000 (Quad NV-Link):
135.3 [X] AMD Ryzen Threadripper PRO 3975WX 3.5GHz
NVIDIA RTX A6000 (Quad NV-Link)
min:
115.4 fps, max:
-1 fps
fps
NVIDIA RTX A6000 (Quad NV-Link):
126.8 [X] AMD Ryzen Threadripper PRO 3975WX 3.5GHz
NVIDIA RTX A6000 (Quad NV-Link)
min:
103.2 fps, max:
-1 fps
fps
NVIDIA RTX A6000 (Quad NV-Link):
115.3 [X] AMD Ryzen Threadripper PRO 3975WX 3.5GHz
NVIDIA RTX A6000 (Quad NV-Link)
min:
93.7 fps, max:
-1 fps
fps
NVIDIA RTX A6000 (Quad NV-Link):
109.3 [X] AMD Ryzen Threadripper PRO 3975WX 3.5GHz
NVIDIA RTX A6000 (Quad NV-Link)
min:
82.8 fps, max:
-1 fps
fps
NVIDIA RTX A6000 (Quad NV-Link):
351 [X] AMD Ryzen Threadripper PRO 3975WX 3.5GHz
NVIDIA RTX A6000 (Quad NV-Link)
min:
17 fps, P0.1:
55.7 fps, P1:
175 fps, max:
602 fps
fps
NVIDIA RTX A6000 (Quad NV-Link):
331 [X] AMD Ryzen Threadripper PRO 3975WX 3.5GHz
NVIDIA RTX A6000 (Quad NV-Link)
min:
22 fps, P0.1:
86.4 fps, P1:
203 fps, max:
468 fps
fps
NVIDIA RTX A6000 (Quad NV-Link):
305 [X] AMD Ryzen Threadripper PRO 3975WX 3.5GHz
NVIDIA RTX A6000 (Quad NV-Link)
min:
55.7 fps, P0.1:
85.6 fps, P1:
170 fps, max:
445 fps
fps
NVIDIA RTX A6000 (Quad NV-Link):
173 [X] AMD Ryzen Threadripper PRO 3975WX 3.5GHz
NVIDIA RTX A6000 (Quad NV-Link)
min:
18.6 fps, P0.1:
58.7 fps, P1:
91.1 fps, max:
314 fps
fps
NVIDIA RTX A6000 (Quad NV-Link):
142 [X] AMD Ryzen Threadripper PRO 3975WX 3.5GHz
NVIDIA RTX A6000 (Quad NV-Link)
min:
35.4 fps, P0.1:
62.7 fps, P1:
101 fps, max:
411 fps
fps
NVIDIA RTX A6000 (Quad NV-Link):
169 [X] AMD Ryzen Threadripper PRO 3975WX 3.5GHz
NVIDIA RTX A6000 (Quad NV-Link)
min:
0.803 fps, P1:
62.5 fps, max:
292 fps
fps
HD Graphics 5000:
19.2 fps
NVIDIA RTX A6000 (Quad NV-Link):
162 [X] AMD Ryzen Threadripper PRO 3975WX 3.5GHz
NVIDIA RTX A6000 (Quad NV-Link)
min:
3.97 fps, P1:
50 fps, max:
281 fps
fps
NVIDIA RTX A6000 (Quad NV-Link):
142 [X] AMD Ryzen Threadripper PRO 3975WX 3.5GHz
NVIDIA RTX A6000 (Quad NV-Link)
min:
2.64 fps, P1:
27 fps, max:
268 fps
fps
NVIDIA RTX A6000 (Quad NV-Link):
88.5 [X] AMD Ryzen Threadripper PRO 3975WX 3.5GHz
NVIDIA RTX A6000 (Quad NV-Link)
min:
0.4426 fps, P1:
20.4 fps, max:
166 fps
fps
NVIDIA RTX A6000 (Quad NV-Link):
88.4 [X] AMD Ryzen Threadripper PRO 3975WX 3.5GHz
NVIDIA RTX A6000 (Quad NV-Link)
min:
1.477 fps, P1:
20.8 fps, max:
164 fps
fps
NVIDIA RTX A6000 (Quad NV-Link):
139 [X] AMD Ryzen Threadripper PRO 3975WX 3.5GHz
NVIDIA RTX A6000 (Quad NV-Link)
min:
0.64 fps, P1:
25 fps, max:
249 fps
fps
HD Graphics 5000:
20.8 fps
HD Graphics 5000:
15.1 fps
HD Graphics 5000:
12.7 fps
HD Graphics 5000:
15.8 fps
HD Graphics 5000:
10.6 fps
HD Graphics 5000:
17.4 fps
HD Graphics 5000:
14.3 fps
HD Graphics 5000:
10.6 fps
HD Graphics 5000:
25.4 fps
HD Graphics 5000:
16.2 fps
HD Graphics 5000:
15.5 fps
HD Graphics 5000:
12.2 fps
HD Graphics 5000:
14.2 fps
HD Graphics 5000:
10.6 fps
HD Graphics 5000:
14.7 fps
HD Graphics 5000:
28.9 fps
HD Graphics 5000:
20.9 fps
HD Graphics 5000:
11.4 fps
HD Graphics 5000:
20.1 fps
HD Graphics 5000:
36.2 fps
HD Graphics 5000:
28.1 fps
HD Graphics 5000:
17.4 fps
HD Graphics 5000:
168.3 fps
HD Graphics 5000:
32.8 fps
HD Graphics 5000:
14.2 fps
HD Graphics 5000:
28.7 fps
HD Graphics 5000:
17.6 fps
HD Graphics 5000:
85.7 fps
HD Graphics 5000:
30.2 fps
HD Graphics 5000:
14.9 fps
HD Graphics 5000:
12.5 fps
HD Graphics 5000:
17 18.1 ~ 18 fps
HD Graphics 5000:
27.2 fps
HD Graphics 5000:
22.1 fps
HD Graphics 5000:
10.7 fps
HD Graphics 5000:
33.2 fps
HD Graphics 5000:
20.2 fps
HD Graphics 5000:
13.2 fps
HD Graphics 5000:
8.4 9.7 ~ 9 fps
HD Graphics 5000:
20.5 fps
HD Graphics 5000:
28.6 fps
HD Graphics 5000:
19.9 fps
HD Graphics 5000:
13.3 fps
HD Graphics 5000:
165.1 fps
HD Graphics 5000:
100.2 fps
HD Graphics 5000:
71.4 fps
HD Graphics 5000:
39.3 fps
HD Graphics 5000:
39.8 fps
HD Graphics 5000:
29.4 fps
HD Graphics 5000:
21.6 fps
HD Graphics 5000:
13.3 fps
HD Graphics 5000:
10.4 fps
HD Graphics 5000:
58.6 fps
HD Graphics 5000:
31.3 fps
HD Graphics 5000:
22.7 fps
HD Graphics 5000:
12.5 fps
HD Graphics 5000:
32 [X] Dell XPS 12 Haswell Intel Core i7-4650U 1.7GHz
HD Graphics 5000
34.3 34.3 38.3 ~ 35 fps
HD Graphics 5000:
17 [X] Dell XPS 12 Haswell Intel Core i7-4650U 1.7GHz
HD Graphics 5000
20.1 20.9 22.5 ~ 20 fps
HD Graphics 5000:
14 [X] Dell XPS 12 Haswell Intel Core i7-4650U 1.7GHz
HD Graphics 5000
14.2 16.6 18.2 ~ 16 fps
HD Graphics 5000:
44 [X] Dell XPS 12 Haswell Intel Core i7-4650U 1.7GHz
HD Graphics 5000
52.5 53.9 54.3 55.3 56 ~ 53 fps
HD Graphics 5000:
23 [X] Dell XPS 12 Haswell Intel Core i7-4650U 1.7GHz
HD Graphics 5000
25 26 27.5 28.3 28.6 ~ 26 fps
HD Graphics 5000:
14 14.9 15 [X] Dell XPS 12 Haswell Intel Core i7-4650U 1.7GHz
HD Graphics 5000
15.8 17.4 17.5 ~ 16 fps
HD Graphics 5000:
7.9 8 [X] Dell XPS 12 Haswell Intel Core i7-4650U 1.7GHz
HD Graphics 5000
9.5 ~ 8 fps
HD Graphics 5000:
20.9 fps
HD Graphics 5000:
28.6 fps
HD Graphics 5000:
19.2 fps
HD Graphics 5000:
16.6 fps
HD Graphics 5000:
11.2 fps
HD Graphics 5000:
22.3 fps
HD Graphics 5000:
15.7 fps
HD Graphics 5000:
40.5 fps
HD Graphics 5000:
14.1 fps
HD Graphics 5000:
54 58 59 [X] Dell XPS 12 Haswell Intel Core i7-4650U 1.7GHz
HD Graphics 5000
~ 57 fps
HD Graphics 5000:
38 [X] Dell XPS 12 Haswell Intel Core i7-4650U 1.7GHz
HD Graphics 5000
42 ~ 40 fps
HD Graphics 5000:
31 [X] Dell XPS 12 Haswell Intel Core i7-4650U 1.7GHz
HD Graphics 5000
32 ~ 32 fps
HD Graphics 5000:
13 19 21 [X] Dell XPS 12 Haswell Intel Core i7-4650U 1.7GHz
HD Graphics 5000
~ 18 fps
HD Graphics 5000:
57.8 59.2 61 [X] Dell XPS 12 Haswell Intel Core i7-4650U 1.7GHz
HD Graphics 5000
~ 59 fps
HD Graphics 5000:
30 [X] Dell XPS 12 Haswell Intel Core i7-4650U 1.7GHz
HD Graphics 5000
32.2 32.8 ~ 32 fps
HD Graphics 5000:
16.2 18 [X] Dell XPS 12 Haswell Intel Core i7-4650U 1.7GHz
HD Graphics 5000
20.1 ~ 18 fps
HD Graphics 5000:
9 [X] Dell XPS 12 Haswell Intel Core i7-4650U 1.7GHz
HD Graphics 5000
fps
HD Graphics 5000:
29.5 fps
HD Graphics 5000:
18.4 fps
HD Graphics 5000:
11.6 fps
HD Graphics 5000:
88.8 fps
HD Graphics 5000:
126 169 [X] Dell XPS 12 Haswell Intel Core i7-4650U 1.7GHz
HD Graphics 5000
~ 148 fps
HD Graphics 5000:
38 43 [X] Dell XPS 12 Haswell Intel Core i7-4650U 1.7GHz
HD Graphics 5000
~ 41 fps
HD Graphics 5000:
24 26 [X] Dell XPS 12 Haswell Intel Core i7-4650U 1.7GHz
HD Graphics 5000
~ 25 fps
HD Graphics 5000:
10 16 [X] Dell XPS 12 Haswell Intel Core i7-4650U 1.7GHz
HD Graphics 5000
~ 13 fps
4x NVIDIA RTX A6000 low med. high ultra QHD 4K F1 2021 328 303 278 159 149 96.8 F1 2020 277 241 241 221 210 136 Far Cry New Dawn 40 40 38 37 37 36 Metro Exodus 119 106 95.7 87.9 83.5 67 Strange Brigade 317 260 257 258 252 246 Far Cry 5 18 18 17 18 17 18 X-Plane 11.11 109 96.8 78.3 67.8 Final Fantasy XV Benchmark 175 167 131 113 56.3 Dota 2 Reborn 154 135.3 126.8 115.3 109.3 The Witcher 3 351 331 305 173 142 GTA V 169 162 142 88.5 88.4 139 < 30 fps < 60 fps < 120 fps ≥ 120 fps 1 1 2 7 1 1 2 7 1 1 2 7 1 1 3 4 1 1 3 3 1 2 4 4
For more games that might be playable and a list of all games and graphics cards visit our Gaming List
v1.26
log 29. 19:29:55
#0 checking url part for id 6452 +0s ... 0s
#1 checking url part for id 11095 +0s ... 0s
#2 checking url part for id 4574 +0s ... 0s
#3 not redirecting to Ajax server +0s ... 0s
#4 did not recreate cache, as it is less than 5 days old! Created at Tue, 28 May 2024 05:35:22 +0200 +0.001s ... 0.001s
#5 composed specs +0.128s ... 0.128s
#6 did output specs +0s ... 0.129s
#7 start showIntegratedCPUs +0s ... 0.129s
#8 getting avg benchmarks for device 6452 +0.039s ... 0.168s
#9 got single benchmarks 6452 +0s ... 0.168s
#10 getting avg benchmarks for device 11095 +0.018s ... 0.186s
#11 got single benchmarks 11095 +0.008s ... 0.194s
#12 getting avg benchmarks for device 4574 +0.015s ... 0.208s
#13 got single benchmarks 4574 +0.023s ... 0.231s
#14 got avg benchmarks for devices +0s ... 0.231s
#15 min, max, avg, median took s +0.348s ... 0.579s
#16 before gaming benchmark output +0s ... 0.579s
#17 Got 258 rows for game benchmarks. +0.04s ... 0.619s
#18 composed SQL query for gamebenchmarks +0s ... 0.619s
#19 got data and put it in $dataArray +0.037s ... 0.656s
#20 benchmarks composed for output. +0.13s ... 0.785s
#21 calculated avg scores. +0s ... 0.785s
#22 return log +0.003s ... 0.788s
Please share our article, every link counts!
Redaktion, 2017-09- 8 (Update: 2023-07- 1)
 Deutsch
 English
 Español
 Français
 Italiano
 Nederlands
 Polski
 Português
 Русский
 Türkçe
 Svenska
 Chinese
 Magyar