Notebookcheck Logo

AMD Radeon Graphics (Ryzen 7000) vs Intel HD Graphics (Haswell)

AMD Radeon Graphics (Ryzen 7000)

► remove from comparison AMD Radeon Graphics (Ryzen 7000)

The AMD Radeon Graphics of the Ryzen 7000 desktop CPUs is an integrated graphics card (iGPU) based on the RDNA 2 architecture. It offers only 2 CUs (128 shader) and is similar to the Radeon 610M. The clock speed in most CPUs ranges between 400 to 2200 MHz. Due to the low amount of shaders, the gaming performance is very low and only suited for low demanding games. The GPU also integrates an AMD Video Coding Engine (VCE) for H.264, H.265 10/8bpc encoding and AV1, VP9, H.265, and H.264 10/8bpc decoding.

Intel HD Graphics (Haswell)

► remove from comparison Intel HD Graphics (Haswell)

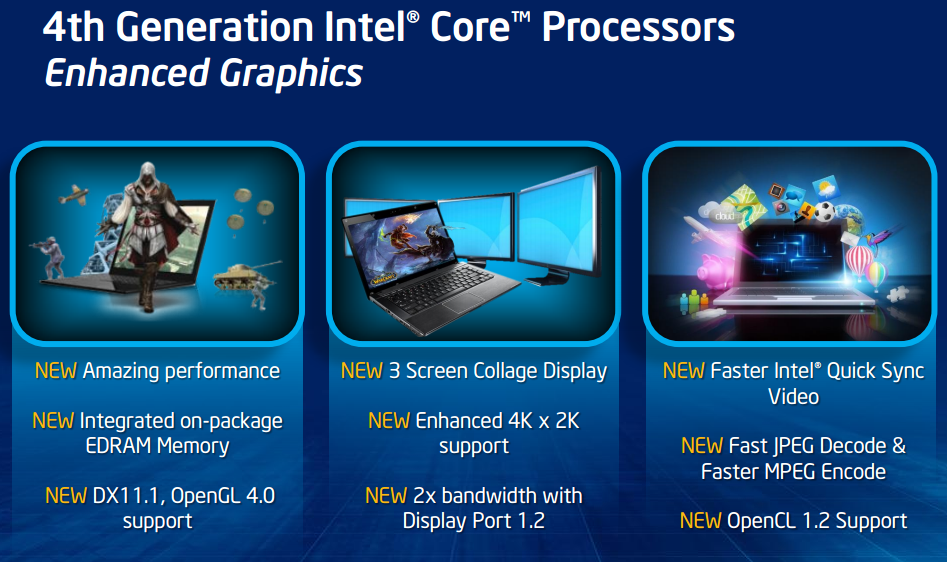
The Intel HD Graphics (Haswell) is an integrated graphics card in the Haswell codenamed processors (Celeron and Pentium). It is the successor the the Intel HD Graphics in the Ivy Bridge CPUs and performs slightly better. Depending on the processor model, the base and turbo clock rates may differ, resulting in varying graphics performance between CPU models.

In comparison to the HD 4000, the graphics core has been modified extensively. The GPU supports DirectX 11.1, OpenCL 1.2 and OpenGL 4.0. It also features an improved decoder for 4K videos and the fast Quick Sync encoder (deactivated in many entry level models).

The Performance of the HD Graphics (Haswell) is similar to the old HD Graphics 3000 or the AMD Radeon HD 8250. Only a few modern games like Dota 2 can be played fluently in very low details and resolutions.

Due to the 22nm 3D Tri-Gate production process, the power consumption should be relatively low (the development was focused on performance per Watt). The GPU can be found in ULV models and regular (37 W) dual core CPUs.

AMD Radeon Graphics (Ryzen 7000)Intel HD Graphics (Haswell)
HD Graphics Series
Radeon 680M compare 768 @ 2.4 GHz
Radeon 660M compare 384 @ 1.9 GHz
Radeon Graphics (Ryzen 7000) 128 @ 2.2 GHz
Radeon 610M compare 128 @ 0.4 - 2.2 GHz
HD Graphics P530 compare 24 @ 0.35 - 1.05 GHz64/128 Bit
HD Graphics 5600 compare 24 @ 0.3 - 1.05 GHz64/128 Bit
HD Graphics 6000 compare 48 @ 0.3 - 1 GHz64/128 Bit
HD Graphics 4600 compare 20 @ 0.2 - 1.35 GHz64/128 Bit
HD Graphics 5500 compare 24 @ 0.3 - 0.95 GHz64/128 Bit
HD Graphics 5000 compare 40 @ 0.2 - 1.1 GHz64/128 Bit
HD Graphics 4400 compare 20 @ 0.2 - 1.1 GHz64/128 Bit
HD Graphics 5300 compare 24 @ 0.1 - 0.9 GHz64/128 Bit
HD Graphics 4000 compare 16 @ 0.35 - 1.35 GHz64/128 Bit
HD Graphics (Broadwell) compare 12 @ 0.1 - 0.85 GHz64/128 Bit
HD Graphics 4200 compare 20 @ 0.2 - 0.85 GHz64/128 Bit
HD Graphics (Skylake) compare 12 @ 0.3 - 0.8 GHz64/128 Bit
HD Graphics 405 (Braswell) compare 16 @ 0.32 - 0.7 GHz64/128 Bit
HD Graphics (Braswell) compare 16 @ 0.32 - 0.7 GHz64/128 Bit
HD Graphics 400 (Braswell) compare 12 @ 0.32 - 0.64 GHz64/128 Bit
HD Graphics (Haswell) 10 @ 0.2 - 1 GHz64/128 Bit
HD Graphics (Cherry Trail) compare 16 @ 0.2 - 0.6 GHz64/128 Bit
HD Graphics 3000 compare 12 @ 0.35 - 1.35 GHz64/128 Bit
HD Graphics 2500 compare 6 @ 0.65 - 1.15 GHz64/128 Bit
HD Graphics (Ivy Bridge) compare 6 @ 0.35 - 1.1 GHz64/128 Bit
HD Graphics 2000 compare 6 @ 0.85 - 1.35 GHz64/128 Bit
HD Graphics (Sandy Bridge) compare 6 @ 0.35 - 1.1 GHz64/128 Bit
HD Graphics (Bay Trail) compare 4 @ 0.31 - 0.9 GHz32/64/128 Bit
CodenameRaphaelHaswell GT1
ArchitectureRDNA 2Gen. 7.5 Haswell
Pipelines128 - unified10 - unified
TMUs8
ROPs4
Raytracing Cores1
Core Speed2200 (Boost) MHz200 - 1000 (Boost) MHz
Shared Memoryyesyes
APIDirectX 12_2, OpenGL 4.6DirectX 11.1, Shader 5.0
Transistors3.4 Billion
Die Size 122 mm²
technology6 nm22 nm
Date of Announcement26.09.2022 01.10.2012
Memory Bus Width64/128 Bit
CPU in Radeon Graphics (Ryzen 7000)GPU Base SpeedGPU Boost / Turbo
AMD Ryzen 9 7950X16 x 4500 MHz, 170 W400 MHz2200 MHz
AMD Ryzen 9 7950X3D16 x 4200 MHz, 120 W400 MHz2200 MHz
AMD Ryzen 9 7900X12 x 4700 MHz, 170 W? MHz? MHz
min. - max.400 MHz2200 MHz
CPU in HD Graphics (Haswell)GPU Base SpeedGPU Boost / Turbo
Intel Pentium 3560M2 x 2400 MHz, 37 W400 MHz1100 MHz
Intel Pentium 3550M2 x 2300 MHz, 37 W400 MHz1100 MHz
Intel Celeron 2970M2 x 2200 MHz, 37 W400 MHz1100 MHz
min. - max.200 - 400 MHz850 - 1100 MHz

Benchmarks

Performance Rating - 3DMark 11 + Fire Strike + Time Spy - Radeon Graphics (Ryzen 7000)
0.9 pt (3%)
Restrict / Search: Model: Max. age: years
Performance Rating - 3DMark 11 + Fire Strike + Time Spy - HD Graphics (Haswell)
0.1 pt (0%)
Restrict / Search: Model: Max. age: years
3DMark - 3DMark Time Spy Score
min: 817     avg: 831     median: 831 (2%)     max: 845 Points
3DMark - 3DMark Time Spy Graphics
min: 705     avg: 715     median: 715 (1%)     max: 725 Points
3DMark - 3DMark Ice Storm Unlimited Graphics
159603 Points (16%)
43493 Points (4%)
3DMark - 3DMark Ice Storm Extreme Graphics
min: 59739     avg: 64109     median: 66294 (8%)     max: 66294 Points
3DMark - 3DMark Cloud Gate Score
min: 15883     avg: 16468     median: 16760 (16%)     max: 16760 Points
min: 2141     avg: 2403     median: 2335.5 (2%)     max: 3011 Points
3DMark - 3DMark Cloud Gate Graphics
min: 14990     avg: 15161     median: 15247 (4%)     max: 15247 Points
min: 3111     avg: 3415     median: 3278 (1%)     max: 4199 Points
3DMark - 3DMark Fire Strike Standard Score
min: 2183     avg: 2211     median: 2211 (3%)     max: 2239 Points
min: 300     avg: 323.8     median: 314 (0%)     max: 383 Points
3DMark - 3DMark Fire Strike Standard Graphics
min: 2287     avg: 2338     median: 2337.5 (2%)     max: 2388 Points
min: 340     avg: 370.8     median: 362.5 (0%)     max: 433 Points
3DMark - 3DMark Ice Storm Graphics
min: 90272     avg: 97292     median: 100802 (11%)     max: 100802 Points
min: 29291     avg: 34138     median: 34675 (4%)     max: 40515 Points
3DMark - 3DMark Night Raid
10411 Points (10%)
3DMark - 3DMark Night Raid Graphics Score
10021 Points (4%)
3DMark 11 - 3DM11 Performance Score
min: 3466     avg: 3636     median: 3466 (4%)     max: 3977 Points
min: 435     avg: 543     median: 544 (1%)     max: 688 Points
3DMark 11 - 3DM11 Performance GPU
min: 3026     avg: 3170     median: 3026 (2%)     max: 3458 Points
min: 384     avg: 479.6     median: 484 (0%)     max: 602 Points
3DMark Vantage
3DM Vant. Perf. total + AMD Radeon Graphics (Ryzen 7000)
3DMark Vantage - 3DM Vant. Perf. total
min: 11455     avg: 11703     median: 11703 (3%)     max: 11951 Points
3DM Vant. Perf. total + Intel HD Graphics (Haswell)
min: 2146     avg: 2163     median: 2163 (1%)     max: 2180 Points
3DM Vant. Perf. GPU no PhysX + AMD Radeon Graphics (Ryzen 7000)
3DMark Vantage - 3DM Vant. Perf. GPU no PhysX
min: 8837     avg: 9054     median: 9053.5 (5%)     max: 9270 Points
3DM Vant. Perf. GPU no PhysX + Intel HD Graphics (Haswell)
min: 1848     avg: 1859     median: 1859 (1%)     max: 1870 Points
3DMark 05 - 3DMark 05 - Standard
min: 36694     avg: 37469     median: 37468.5 (41%)     max: 38243 Points
3DMark 06 3DMark 06 - Standard 1280x1024 + AMD Radeon Graphics (Ryzen 7000)
3DMark 06
min: 20707     avg: 21111     median: 21110.5 (28%)     max: 21514 Points
3DMark 06 - Standard 1280x1024 + Intel HD Graphics (Haswell)
min: 2917     avg: 3274     median: 3357.5 (4%)     max: 3463 Points
Unigine Valley 1.0 - Unigine Valley 1.0 DX
9.9 fps (3%)
Windows 7 Experience Index - Win7 Gaming graphics
6.3 Points (80%)
Windows 7 Experience Index - Win7 Graphics
4.7 Points (59%)
Cinebench R10 Cinebench R10 Shading (32bit) + AMD Radeon Graphics (Ryzen 7000)
Cinebench R10 - Cinebench R10 Shading (32bit)
min: 6826     avg: 15239     median: 17737.5 (13%)     max: 18855 Points
Cinebench R10 Shading (32bit) + Intel HD Graphics (Haswell)
min: 3867     avg: 4235     median: 4215.5 (3%)     max: 4642 Points
Cinebench R11.5 Cinebench R11.5 OpenGL 64 Bit + AMD Radeon Graphics (Ryzen 7000)
Cinebench R11.5 - Cinebench R11.5 OpenGL 64 Bit
min: 198.52     avg: 203     median: 205 (67%)     max: 205.43 fps
Cinebench R11.5 OpenGL 64 Bit + Intel HD Graphics (Haswell)
min: 9.38     avg: 11.4     median: 11.6 (4%)     max: 12.78 fps
Cinebench R15
Cinebench R15 OpenGL 64 Bit + AMD Radeon Graphics (Ryzen 7000)
Cinebench R15 - Cinebench R15 OpenGL 64 Bit
min: 97.22     avg: 158.8     median: 101.4 (6%)     max: 359.59 fps
Cinebench R15 OpenGL 64 Bit + Intel HD Graphics (Haswell)
min: 10.28     avg: 13.2     median: 13.9 (1%)     max: 14.59 fps
Cinebench R15 OpenGL Ref. Match 64 Bit + AMD Radeon Graphics (Ryzen 7000)
Cinebench R15 - Cinebench R15 OpenGL Ref. Match 64 Bit
min: 97.9     avg: 98.3     median: 97.9 (98%)     max: 99.6 %
Cinebench R15 OpenGL Ref. Match 64 Bit + Intel HD Graphics (Haswell)
GFXBench - GFXBench Car Chase Offscreen
11.6 fps (1%)
GFXBench 3.1 - GFXBench Manhattan ES 3.1 Offscreen
20.1 fps (0%)
GFXBench 3.0 - GFXBench 3.0 Manhattan Offscreen
28.7 fps (1%)
GFXBench (DX / GLBenchmark) 2.7
GFXBench T-Rex HD Offscreen C24Z16 + Intel HD Graphics (Haswell)
GFXBench (DX / GLBenchmark) 2.7 - GFXBench T-Rex HD Offscreen C24Z16
53.5 fps (0%)
Basemark GPU 1.2 - Basemark GPU 1.2 Vulkan Official Medium Offscreen 1080
1992 fps (49%)
Basemark GPU 1.2 - Basemark GPU 1.2 Vulkan Official High Offscreen 2160
176.8 fps (32%)
Geekbench 6.4 - Geekbench 6.4 GPU OpenCL
6167 Points (2%)
Geekbench 6.4 - Geekbench 6.4 GPU Vulkan
8032 Points (2%)
LuxMark v2.0 64Bit - LuxMark v2.0 Room GPU
257 Samples/s (1%)
min: 77     avg: 93     median: 93 (0%)     max: 109 Samples/s
LuxMark v2.0 64Bit - LuxMark v2.0 Sala GPU
583 Samples/s (1%)
min: 115     avg: 140     median: 140 (0%)     max: 165 Samples/s
ComputeMark v2.1 - ComputeMark v2.1 Result
1616 Points (1%)
min: 355     avg: 370     median: 370 (0%)     max: 385 Points
Power Consumption - Furmark Stress Test Power Consumption - external Monitor *
43.7 Watt (6%)
Power Consumption - The Witcher 3 Power Consumption - external Monitor *
30.5 Watt (4%)

Average Benchmarks AMD Radeon Graphics (Ryzen 7000) → 100% n=18

Average Benchmarks Intel HD Graphics (Haswell) → 24% n=18

- Range of benchmark values for this graphics card
red legend - Average benchmark values for this graphics card
* Smaller numbers mean a higher performance
1 This benchmark is not used for the average calculation

Game Benchmarks

The following benchmarks stem from our benchmarks of review laptops. The performance depends on the used graphics memory, clock rate, processor, system settings, drivers, and operating systems. So the results don't have to be representative for all laptops with this GPU. For detailed information on the benchmark results, click on the fps number.

F1 2021

F1 2021

2021
low 1280x720
100%
Radeon Graphics (Ryzen 7000):
46.3  fps
med. 1920x1080
100%
Radeon Graphics (Ryzen 7000):
18.3  fps
high 1920x1080
100%
Radeon Graphics (Ryzen 7000):
15  fps
ultra 1920x1080
100%
Radeon Graphics (Ryzen 7000):
5.7  fps
F1 2020

F1 2020

2020
low 1280x720
100%
Radeon Graphics (Ryzen 7000):
49.7  fps
med. 1920x1080
100%
Radeon Graphics (Ryzen 7000):
18.7  fps
high 1920x1080
100%
Radeon Graphics (Ryzen 7000):
13.7  fps
ultra 1920x1080
100%
Radeon Graphics (Ryzen 7000):
8.7  fps
low 1280x720
HD Graphics (Haswell):
0 (!)  fps
Hitman 2

Hitman 2

2018
low 1280x720
HD Graphics (Haswell):
4.9 (!)  fps
Strange Brigade

Strange Brigade

2018
low 1280x720
100%
Radeon Graphics (Ryzen 7000):
54  fps
med. 1920x1080
100%
Radeon Graphics (Ryzen 7000):
17.4  fps
high 1920x1080
100%
Radeon Graphics (Ryzen 7000):
11.4  fps
ultra 1920x1080
100%
Radeon Graphics (Ryzen 7000):
9  fps
low 1280x720
100%
Radeon Graphics (Ryzen 7000):
35.9 49.8 ~ 43 fps
33%
HD Graphics (Haswell):
14.3  fps
med. 1920x1080
100%
Radeon Graphics (Ryzen 7000):
23 29.2 ~ 26 fps
31%
HD Graphics (Haswell):
8  fps
high 1920x1080
100%
Radeon Graphics (Ryzen 7000):
20.5 25.9 ~ 23 fps
low 1280x720
100%
Radeon Graphics (Ryzen 7000):
19.3 26.1 ~ 23 fps
med. 1920x1080
100%
Radeon Graphics (Ryzen 7000):
12.2 19.3 ~ 16 fps
high 1920x1080
100%
Radeon Graphics (Ryzen 7000):
5.7 8.9 ~ 7 fps
low 1280x720
HD Graphics (Haswell):
5.9  fps
F1 2017

F1 2017

2017
low 1280x720
HD Graphics (Haswell):
13  fps
low 1280x720
HD Graphics (Haswell):
62  fps
med. 1366x768
HD Graphics (Haswell):
28.6  fps
Dirt 4

Dirt 4

2017
low 1280x720
HD Graphics (Haswell):
16.4  fps
low 1280x720
HD Graphics (Haswell):
45.1  fps
med. 1920x1080
HD Graphics (Haswell):
15.9  fps
low 1280x720
HD Graphics (Haswell):
0 (!)  fps
low 1280x720
HD Graphics (Haswell):
17.8  fps
low 1280x720
HD Graphics (Haswell):
38.6  fps
med. 1366x768
HD Graphics (Haswell):
21.6  fps
high 1920x1080
HD Graphics (Haswell):
6.3  fps
low 1280x720
HD Graphics (Haswell):
14.1  fps
low 1280x720
HD Graphics (Haswell):
12.4  fps
med. 1366x768
HD Graphics (Haswell):
7.1  fps
Overwatch

Overwatch

2016
low 1280x720
HD Graphics (Haswell):
26.1  fps
med. 1366x768
HD Graphics (Haswell):
16.3  fps
Doom

Doom

2016
low 1280x720
HD Graphics (Haswell):
0 (!)  fps
low 1280x720
HD Graphics (Haswell):
6  fps
low 1280x720
HD Graphics (Haswell):
8.5  fps
low 1280x720
HD Graphics (Haswell):
9  fps
low 1024x768
HD Graphics (Haswell):
9.4  fps
med. 1366x768
HD Graphics (Haswell):
5.3  fps
high 1920x1080
HD Graphics (Haswell):
2.5  fps
ultra 1920x1080
HD Graphics (Haswell):
1.8  fps
low 1024x768
HD Graphics (Haswell):
13.7  fps
med. 1366x768
HD Graphics (Haswell):
8.9  fps
low 1024x768
HD Graphics (Haswell):
11.7  fps
low 1024x768
HD Graphics (Haswell):
0 (!)  fps
low 1366x768
HD Graphics (Haswell):
41.4  fps
med. 1366x768
HD Graphics (Haswell):
24.1  fps
high 1920x1080
HD Graphics (Haswell):
11.4  fps
low 1280x720
100%
Radeon Graphics (Ryzen 7000):
157.8 219.5 ~ 189 fps
med. 1366x768
100%
Radeon Graphics (Ryzen 7000):
61.8 89.9 ~ 76 fps
high 1920x1080
100%
Radeon Graphics (Ryzen 7000):
25.7 38.8 ~ 32 fps
ultra 1920x1080
100%
Radeon Graphics (Ryzen 7000):
23.6 35 ~ 29 fps
low 1024x768
HD Graphics (Haswell):
8.9  fps
med. 1366x768
HD Graphics (Haswell):
5.2 5.8 ~ 6 fps
high 1920x1080
HD Graphics (Haswell):
3.1  fps
low 1024x768
HD Graphics (Haswell):
52.4  fps
med. 1366x768
HD Graphics (Haswell):
12.8  fps
low 1024x768
HD Graphics (Haswell):
15.9  fps
med. 1366x768
HD Graphics (Haswell):
11.2  fps
Evolve

Evolve

2015
low 1024x768
HD Graphics (Haswell):
7.7  fps
med. 1366x768
HD Graphics (Haswell):
5.7  fps
The Crew

The Crew

2014
low 1280x720
HD Graphics (Haswell):
9.7  fps
med. 1366x768
HD Graphics (Haswell):
8.4  fps
low 1024x768
HD Graphics (Haswell):
10.9  fps
med. 1366x768
HD Graphics (Haswell):
7  fps
F1 2014

F1 2014

2014
low 1024x768
HD Graphics (Haswell):
31  fps
med. 1366x768
HD Graphics (Haswell):
20  fps
low 1024x768
HD Graphics (Haswell):
9  fps
med. 1366x768
HD Graphics (Haswell):
5.8  fps
low 1024x768
HD Graphics (Haswell):
21.6  fps
med. 1366x768
HD Graphics (Haswell):
12.9  fps
low 1280x720
HD Graphics (Haswell):
13.5  fps
med. 1344x756
HD Graphics (Haswell):
8.3  fps
Fifa 15

Fifa 15

2014
low 1280x720
HD Graphics (Haswell):
16.4  fps
high 1366x768
HD Graphics (Haswell):
11.3  fps
Sims 4

Sims 4

2014
low 1024x768
HD Graphics (Haswell):
123.6  fps
med. 1366x768
HD Graphics (Haswell):
26.2  fps
low 1024x768
HD Graphics (Haswell):
13.3  fps
med. 1366x768
HD Graphics (Haswell):
9.7  fps
low 1024x768
HD Graphics (Haswell):
58.2  fps
med. 1366x768
HD Graphics (Haswell):
19.6  fps
low 1024x768
HD Graphics (Haswell):
2.2  fps
low 1280x720
HD Graphics (Haswell):
19.9  fps
med. 1280x720
HD Graphics (Haswell):
14  fps
low 1024x768
HD Graphics (Haswell):
35.2  fps
med. 1366x768
HD Graphics (Haswell):
13.6  fps
high 1366x768
HD Graphics (Haswell):
9  fps
Titanfall

Titanfall

2014
low 1024x768
HD Graphics (Haswell):
23.1  fps
med. 1366x768
HD Graphics (Haswell):
13.7  fps
Thief

Thief

2014
low 1024x768
HD Graphics (Haswell):
10.1  fps
med. 1366x768
HD Graphics (Haswell):
5.7  fps
low 1024x768
HD Graphics (Haswell):
22.1  fps
med. 1366x768
HD Graphics (Haswell):
13  fps
low 1024x768
HD Graphics (Haswell):
11.1  fps
low 1024x768
HD Graphics (Haswell):
12.8 27.8 ~ 20 fps
med. 1366x768
HD Graphics (Haswell):
10 18.2 ~ 14 fps
high 1366x768
HD Graphics (Haswell):
11.8  fps
ultra 1920x1080
HD Graphics (Haswell):
3.9  fps
low 1024x768
HD Graphics (Haswell):
21  fps
med. 1366x768
HD Graphics (Haswell):
12  fps
F1 2013

F1 2013

2013
low 1024x768
HD Graphics (Haswell):
27  fps
med. 1366x768
HD Graphics (Haswell):
18  fps
high 1366x768
HD Graphics (Haswell):
14  fps
Fifa 14

Fifa 14

2013
med. 1366x768
HD Graphics (Haswell):
57.7  fps
high 1366x768
HD Graphics (Haswell):
37  fps
low 1024x768
HD Graphics (Haswell):
22.4  fps
med. 1366x768
HD Graphics (Haswell):
16.9  fps
low 1280x720
HD Graphics (Haswell):
14  fps
med. 1366x768
HD Graphics (Haswell):
7.8  fps
low 1024x768
HD Graphics (Haswell):
15.9  fps
med. 1366x768
HD Graphics (Haswell):
8.9  fps
low 1024x768
HD Graphics (Haswell):
14.2  fps
med. 1366x768
HD Graphics (Haswell):
11.5  fps
Dota 2

Dota 2

2013
low 1024x768
HD Graphics (Haswell):
36.9  fps
med. 1366x768
HD Graphics (Haswell):
24.2  fps
low 1024x768
HD Graphics (Haswell):
7.2  fps
GRID 2

GRID 2

2013
low 1024x768
HD Graphics (Haswell):
38 38.5 ~ 38 fps
med. 1366x768
HD Graphics (Haswell):
18.6 19.6 ~ 19 fps
high 1366x768
HD Graphics (Haswell):
13.2  fps
low 1024x768
HD Graphics (Haswell):
11.2  fps
low 1280x720
HD Graphics (Haswell):
23 32.8 ~ 28 fps
med. 1366x768
HD Graphics (Haswell):
10.3 14.2 ~ 12 fps
high 1366x768
HD Graphics (Haswell):
11.9  fps
ultra 1920x1080
HD Graphics (Haswell):
3.7  fps
low 1024x768
HD Graphics (Haswell):
96.5  fps
med. 1366x768
HD Graphics (Haswell):
28.3  fps
high 1366x768
HD Graphics (Haswell):
15  fps
SimCity

SimCity

2013
low 1024x768
HD Graphics (Haswell):
59.6  fps
med. 1366x768
HD Graphics (Haswell):
11.2  fps
low 1024x768
HD Graphics (Haswell):
28.9 30.2 30.3 30.3 31.8 ~ 30 fps
med. 1366x768
HD Graphics (Haswell):
13.8 14.2 14.3 14.3 14.6 ~ 14 fps
high 1366x768
HD Graphics (Haswell):
8.1 8.2 8.2 8.4 ~ 8 fps
Crysis 3

Crysis 3

2013
low 1024x768
HD Graphics (Haswell):
12.2  fps
med. 1366x768
HD Graphics (Haswell):
7.6  fps
low 1024x768
HD Graphics (Haswell):
38.7  fps
med. 1366x768
HD Graphics (Haswell):
17.7  fps
high 1366x768
HD Graphics (Haswell):
13.1  fps
Far Cry 3

Far Cry 3

2012
low 1024x768
HD Graphics (Haswell):
18.7  fps
med. 1366x768
HD Graphics (Haswell):
11.4  fps
low 1024x768
HD Graphics (Haswell):
12.3  fps
med. 1366x768
HD Graphics (Haswell):
9.9  fps
low 1024x768
HD Graphics (Haswell):
25.6  fps
med. 1366x768
HD Graphics (Haswell):
17.6  fps
low 1024x768
HD Graphics (Haswell):
22.3  fps
med. 1366x768
HD Graphics (Haswell):
16.8  fps
low 1024x768
HD Graphics (Haswell):
46.2  fps
med. 1366x768
HD Graphics (Haswell):
34.7  fps
high 1366x768
HD Graphics (Haswell):
22.5  fps
low 1024x768
HD Graphics (Haswell):
31  fps
med. 1366x768
HD Graphics (Haswell):
18.8  fps
high 1366x768
HD Graphics (Haswell):
11.7  fps
low 1024x768
HD Graphics (Haswell):
36.9  fps
med. 1366x768
HD Graphics (Haswell):
23  fps
high 1366x768
HD Graphics (Haswell):
19.5  fps
low 1024x768
HD Graphics (Haswell):
12.5  fps
Anno 2070

Anno 2070

2011
low 1024x768
HD Graphics (Haswell):
36  fps
med. 1366x768
HD Graphics (Haswell):
16  fps
high 1366x768
HD Graphics (Haswell):
9.8  fps
low 1280x720
HD Graphics (Haswell):
21.7 22.2 ~ 22 fps
med. 1366x768
HD Graphics (Haswell):
11.2 11.3 ~ 11 fps
high 1366x768
HD Graphics (Haswell):
6.8  fps
low 1024x768
HD Graphics (Haswell):
36.8  fps
high 1366x768
HD Graphics (Haswell):
16.7  fps
Dirt 3

Dirt 3

2011
low 800x600
HD Graphics (Haswell):
51.9  fps
med. 1024x768
HD Graphics (Haswell):
27.4  fps
high 1360x768
HD Graphics (Haswell):
14.8  fps
Total War: Shogun 2

Total War: Shogun 2

2011
low 1024x768
HD Graphics (Haswell):
49.2  fps
low 1024x768
HD Graphics (Haswell):
28  fps
med. 1366x768
HD Graphics (Haswell):
21.2  fps
Resident Evil 5

Resident Evil 5

2009
low 800x600
HD Graphics (Haswell):
42.6  fps
high 1360x768
HD Graphics (Haswell):
17.8  fps
Trackmania Nations Forever

Trackmania Nations Forever

2008
low 640x480
HD Graphics (Haswell):
113  fps
high 1024x768
HD Graphics (Haswell):
45.1  fps
World of Warcraft

World of Warcraft

2005
low 800x600
HD Graphics (Haswell):
93.7  fps
med. 1024x768
HD Graphics (Haswell):
39.2  fps

Average Gaming AMD Radeon Graphics (Ryzen 7000) → 100%

Average Gaming 30-70 fps → 100%

Average Gaming Intel HD Graphics (Haswell) → 32%

AMD Radeon Graphics (Ryzen 7000)Intel HD Graphics (Haswell)
lowmed.highultraQHD4Klowmed.highultraQHD4K
F1 202146.318.3155.66
F1 202049.718.713.78.67
Strange Brigade5417.411.49
X-Plane 11.1143262314.38
Final Fantasy XV Benchmark23167
Dota 2 Reborn189763229
AMD Radeon Graphics (Ryzen 7000)Intel HD Graphics (Haswell)
lowmed.highultraQHD4Klowmed.highultraQHD4K
< 30 fps
< 60 fps
< 120 fps
≥ 120 fps
1
4

1
5

1
5
1

4


< 30 fps
< 60 fps
< 120 fps
≥ 120 fps
1


1


For more games that might be playable and a list of all games and graphics cards visit our Gaming List

Add one or more devices and compare

In the following list you can select (and also search for) devices that should be added to the comparison. You can select more than one device.

restrict list:
v1.33
log 05. 03:04:17

#0 ran 0s before starting gpusingle class +0s ... 0s

#1 checking url part for id 11422 +0s ... 0s

#2 checking url part for id 4622 +0s ... 0s

#3 redirected to Ajax server, took 1754355856s time from redirect:0 +0s ... 0s

#4 did not recreate cache, as it is less than 5 days old! Created at Mon, 04 Aug 2025 18:06:45 +0200 +0s ... 0s

#5 composed specs +0.033s ... 0.033s

#6 did output specs +0s ... 0.033s

#7 start showIntegratedCPUs +0s ... 0.033s

#8 getting avg benchmarks for device 11422 +0.022s ... 0.055s

#9 got single benchmarks 11422 +0.007s ... 0.062s

#10 getting avg benchmarks for device 4622 +0.004s ... 0.066s

#11 got single benchmarks 4622 +0.012s ... 0.078s

#12 got avg benchmarks for devices +0s ... 0.078s

#13 min, max, avg, median took s +0.024s ... 0.102s

#14 before gaming benchmark output +0s ... 0.102s

#15 Got 211 rows for game benchmarks. +0.006s ... 0.109s

#16 composed SQL query for gamebenchmarks +0s ... 0.109s

#17 got data and put it in $dataArray +0.005s ... 0.113s

#18 benchmarks composed for output. +0.026s ... 0.14s

#19 calculated avg scores. +0s ... 0.14s

#20 return log +0.001s ... 0.141s

Please share our article, every link counts!
Mail Logo
> Expert Reviews and News on Laptops, Smartphones and Tech Innovations > Benchmarks / Tech > Graphics Card Comparison - Head 2 Head
Redaktion, 2017-09- 8 (Update: 2023-07- 1)