Notebookcheck Logo

Intel HD Graphics (Cherry Trail) vs AMD Radeon RX 5300M vs Intel HD Graphics (Skylake)

Intel HD Graphics (Cherry Trail)

► remove from comparison Intel HD Graphics (Cherry Trail)

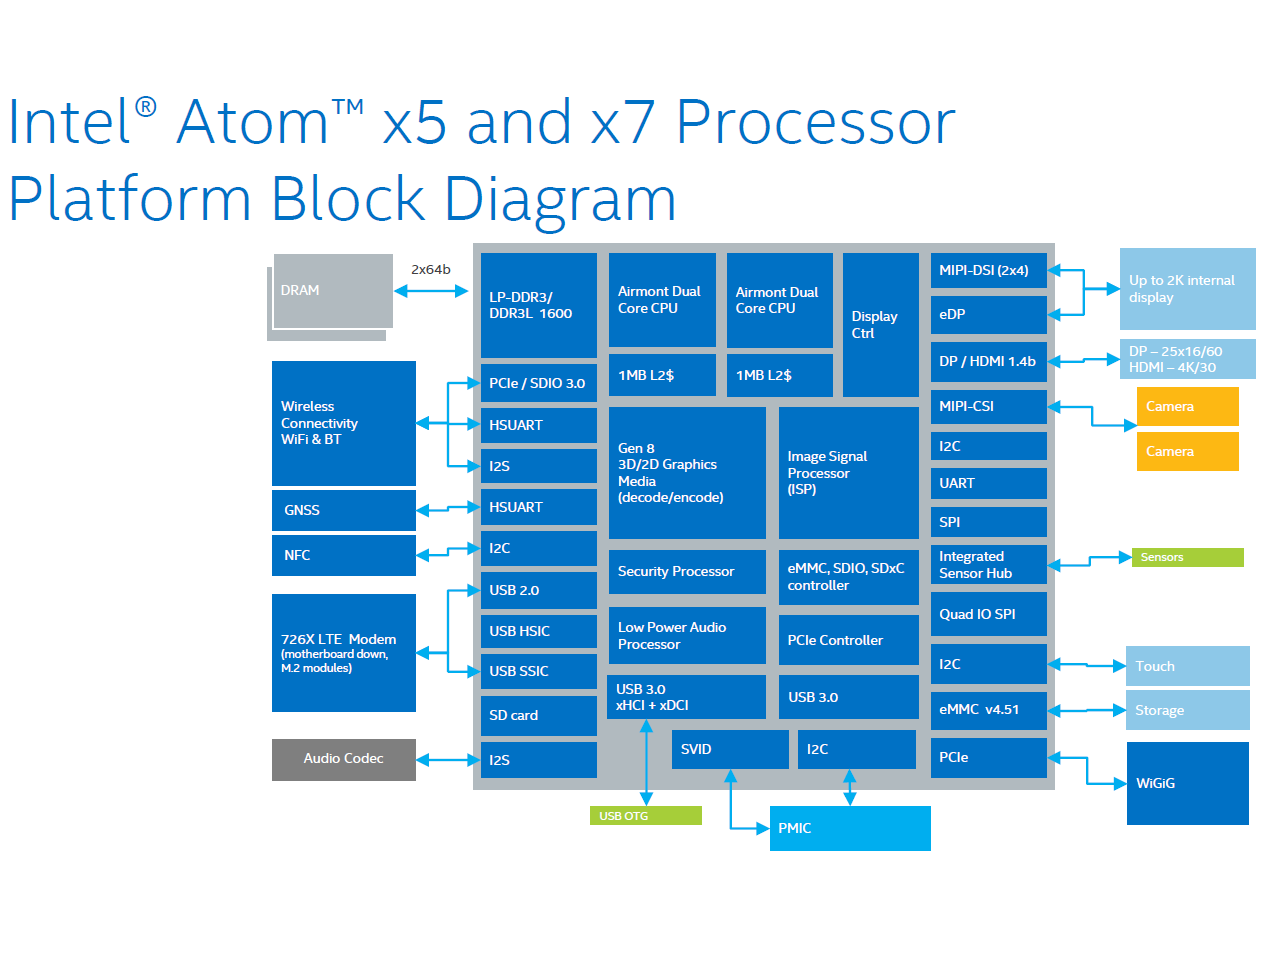
The Intel HD Graphics (Cherry Trail) is an integrated graphics card in the Cherry-Trail SoCs (e.g. Atom x7-Z8700). Based on a Broadwell GPU (Intel Gen8) and supports DirectX 11.2. Depending on the SoC offers 12 or 16 EUs.

Atom x7-Z8700: 16 EUs @ 200 - 600 MHz, dual-channel memory
Atom x5-Z8500: 12 EUs @ 200 - 600 MHz, dual-channel memory
Atom x5-Z8300: 12 EUs @ 200 - 500 MHz, single-channel memory

In Windows, gaming is limited to less demanding or quite old games. Using Android, even high end 3D games should run fluently. For example Team Fortress 2 was running on the Surface 3 (x7-Z8700) only in lowest settings and 1280x720 fluently (11 - 69 fps range).

The integrated video decoder is able to display even 4K videos (H.264 tested) fluently.

The Intel HD Graphics GPU in our review sample of the MS Surface 3 (Atom x7-Z8700) only supported DisplayPort 1.1 as it seems, as 4K (3840x2160) with 30 Hz was the maximum Refresh Rate we could achieve (no 60 Hz selectable with the pre-installed drivers).

AMD Radeon RX 5300M

► remove from comparison AMD Radeon RX 5300M

The AMD Radeon RX 5300M is a dedicated mobile mid-range graphics card for laptops. It uses the new Navi 14 chip (RDNA architecture) which is produced in 7nm. Is supports fast and expensive GDDR6 VRAM and when using it, it should be faster than a GeForce GTX 1650 (according to leaked benchmarks from AMD).

The Navi 14 chip uses the new RDNA (Radeon DNA) microarchitecture which is a successor the the GCN instruction set. It features a new processor design, a multi-level cache hierarchy and an improved rendering pipeline with support for GDDR6 memory.

The performance should be around the GeForce GTX 1650 according to AMD. Therefore, it is most suited for medium to high detail settings in full HD for demanding games in 2019.

The RX5300M uses the same amount of compute cores as the faster 5500M but at a lower clock rate that leads to a lower TDP of the chip of 65 Watt (versus 85W of the 5500M).

Intel HD Graphics (Skylake)

► remove from comparison Intel HD Graphics (Skylake)

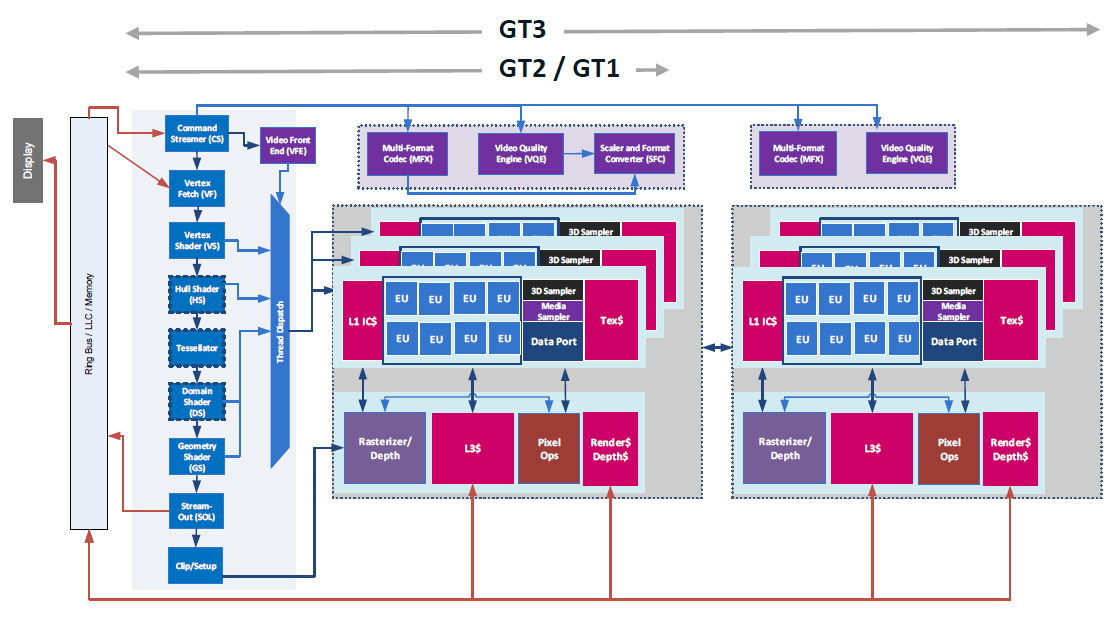
The Intel HD Graphics (Skylake) (GT1) is an integrated graphics unit, which can be found in low-end ULV (Ultra Low Voltage) processors of the Skylake generation. In most CPUs, this GPU was named Intel HD Graphics 510 or Intel HD Graphics 515 (see both pages for benchmarks and information).

This "GT1" version of the Skylake GPU offers 12 Execution Units (EUs) clocked at up to 800 MHz (depending on the CPU model). Due to its lack of dedicated graphics memory or eDRAM cache, the HD Graphics has to access the main memory (2x 64bit DDR3L-1600 / DDR4-2133).

Performance

Depending on various factors like memory configuration, the HD Graphics should perform similar to the older HD Graphics 4200 and will handle only some older and less demanding games in lowest settings.

Features

The revised video engine now decodes H.265/HEVC completely in hardware and thereby much more efficiently than before. Displays can be connected via DP 1.2 / eDP 1.3 (max. 3840 x 2160 @ 60 Hz), whereas HDMI is limited to the older version 1.4a (max. 3840 x 2160 @ 30 Hz). However, HDMI 2.0 can be added using a DisplayPort converter. Up to three displays can be controlled simultaneously.

Power Consumption

The HD Graphics (Skylake) can be found in mobile processors specified at 6 W TDP and is therefore suited for passively cooled 2-in-1 laptops and tablets.

Intel HD Graphics (Cherry Trail)AMD Radeon RX 5300MIntel HD Graphics (Skylake)
HD Graphics Series
HD Graphics P530 24 @ 0.35 - 1.05 GHz64/128 Bit
HD Graphics 5600 24 @ 0.3 - 1.05 GHz64/128 Bit
HD Graphics 6000 48 @ 0.3 - 1 GHz64/128 Bit
HD Graphics 4600 20 @ 0.2 - 1.35 GHz64/128 Bit
HD Graphics 5500 24 @ 0.3 - 0.95 GHz64/128 Bit
HD Graphics 5000 40 @ 0.2 - 1.1 GHz64/128 Bit
HD Graphics 4400 20 @ 0.2 - 1.1 GHz64/128 Bit
HD Graphics 5300 24 @ 0.1 - 0.9 GHz64/128 Bit
HD Graphics 4000 16 @ 0.35 - 1.35 GHz64/128 Bit
HD Graphics (Broadwell) 12 @ 0.1 - 0.85 GHz64/128 Bit
HD Graphics 4200 20 @ 0.2 - 0.85 GHz64/128 Bit
HD Graphics (Skylake) 12 @ 0.3 - 0.8 GHz64/128 Bit
HD Graphics 405 (Braswell) 16 @ 0.32 - 0.7 GHz64/128 Bit
HD Graphics (Braswell) 16 @ 0.32 - 0.7 GHz64/128 Bit
HD Graphics 400 (Braswell) 12 @ 0.32 - 0.64 GHz64/128 Bit
HD Graphics (Haswell) 10 @ 0.2 - 1 GHz64/128 Bit
HD Graphics (Cherry Trail) 16 @ 0.2 - 0.6 GHz64/128 Bit
HD Graphics 3000 12 @ 0.35 - 1.35 GHz64/128 Bit
HD Graphics 2500 6 @ 0.65 - 1.15 GHz64/128 Bit
HD Graphics (Ivy Bridge) 6 @ 0.35 - 1.1 GHz64/128 Bit
HD Graphics 2000 6 @ 0.85 - 1.35 GHz64/128 Bit
HD Graphics (Sandy Bridge) 6 @ 0.35 - 1.1 GHz64/128 Bit
HD Graphics (Bay Trail) 4 @ 0.31 - 0.9 GHz32/64/128 Bit
Radeon RX 5700M 2304 @ 1.47 - 1.72 GHz256 Bit @ 12000 MHz
Radeon RX 5600M 2304 @ 1.27 GHz192 Bit @ 12000 MHz
Radeon RX 5500M 1408 @ 1.33 - 1.65 GHz128 Bit @ 14000 MHz
Radeon RX 5300M 1408 @ 1.04 - 1.45 GHz96 Bit @ 14000 MHz
HD Graphics P530 24 @ 0.35 - 1.05 GHz64/128 Bit
HD Graphics 5600 24 @ 0.3 - 1.05 GHz64/128 Bit
HD Graphics 6000 48 @ 0.3 - 1 GHz64/128 Bit
HD Graphics 4600 20 @ 0.2 - 1.35 GHz64/128 Bit
HD Graphics 5500 24 @ 0.3 - 0.95 GHz64/128 Bit
HD Graphics 5000 40 @ 0.2 - 1.1 GHz64/128 Bit
HD Graphics 4400 20 @ 0.2 - 1.1 GHz64/128 Bit
HD Graphics 5300 24 @ 0.1 - 0.9 GHz64/128 Bit
HD Graphics 4000 16 @ 0.35 - 1.35 GHz64/128 Bit
HD Graphics (Broadwell) 12 @ 0.1 - 0.85 GHz64/128 Bit
HD Graphics 4200 20 @ 0.2 - 0.85 GHz64/128 Bit
HD Graphics (Skylake) 12 @ 0.3 - 0.8 GHz64/128 Bit
HD Graphics 405 (Braswell) 16 @ 0.32 - 0.7 GHz64/128 Bit
HD Graphics (Braswell) 16 @ 0.32 - 0.7 GHz64/128 Bit
HD Graphics 400 (Braswell) 12 @ 0.32 - 0.64 GHz64/128 Bit
HD Graphics (Haswell) 10 @ 0.2 - 1 GHz64/128 Bit
HD Graphics (Cherry Trail) 16 @ 0.2 - 0.6 GHz64/128 Bit
HD Graphics 3000 12 @ 0.35 - 1.35 GHz64/128 Bit
HD Graphics 2500 6 @ 0.65 - 1.15 GHz64/128 Bit
HD Graphics (Ivy Bridge) 6 @ 0.35 - 1.1 GHz64/128 Bit
HD Graphics 2000 6 @ 0.85 - 1.35 GHz64/128 Bit
HD Graphics (Sandy Bridge) 6 @ 0.35 - 1.1 GHz64/128 Bit
HD Graphics (Bay Trail) 4 @ 0.31 - 0.9 GHz32/64/128 Bit
CodenameCherry TrailNavi 14 / E19M-E65Skylake GT1
ArchitectureGen. 8Navi / RDNAGen. 9 Skylake
Pipelines16 - unified1408 - unified12 - unified
Core Speed200 - 600 (Boost) MHz1036 - 1445 (Boost) MHz300 - 800 (Boost) MHz
Memory Bus Width64/128 Bit96 Bit64/128 Bit
Shared Memoryyesnoyes
APIDirectX 12 (FL 11_1), Shader 5.0, OpenGL 4.3DirectX 12, Shader 6.4, OpenGL 4.6DirectX 12_1, OpenGL 4.4
technology14 nm7 nm14 nm
Date of Announcement02.03.2015 29.09.2019 01.09.2015
Memory Speed14000 MHz
Memory TypeGDDR6DDR3L/LPDDR3
Max. Amount of Memory3 GB
Power Consumption65 Watt
FeaturesDisplayPort 1.4 w/DFSC, HDMI 2.0b, Radeon Media Engine (H.264 4K150 decode, 4K90 encode / H.265 4K90 decode, 4K60 encode / VP9 4K90 decode)QuickSync
Notebook Sizemedium sized
CPU in HD Graphics (Cherry Trail)GPU Base SpeedGPU Boost / Turbo
Intel Atom x7-Z87004 x 1600 MHz200 MHz600 MHz
Intel Atom x5-Z85004 x 1440 MHz200 MHz600 MHz
Intel Atom x5-Z83504 x 1440 MHz200 MHz500 MHz
min. - max.200 - 320 MHz? - 600 MHz

Benchmarks

Performance Rating - 3DMark 11 + Fire Strike + Time Spy - HD Graphics (Cherry Trail)
0.1 pt (0%)
Restrict / Search: Model: Max. age: years
3DMark - 3DMark Time Spy Score
min: 3861     avg: 3867     median: 3866.5 (10%)     max: 3872 Points
3DMark - 3DMark Time Spy Graphics
min: 3539     avg: 3567     median: 3566.5 (7%)     max: 3594 Points
3DMark - 3DMark Ice Storm Unlimited Graphics
min: 18563     avg: 20873     median: 19303 (2%)     max: 27537 Points
32417 Points (31%)
55837 Points (14%)
3DMark - 3DMark Fire Strike Standard Score
min: 174     avg: 390.4     median: 248 (0%)     max: 1059 Points
min: 8782     avg: 9120     median: 9093 (14%)     max: 9510 Points
3DMark - 3DMark Fire Strike Standard Graphics
min: 193     avg: 233     median: 225 (0%)     max: 281 Points
min: 10306     avg: 10387     median: 10306 (9%)     max: 10550 Points
3DMark - 3DMark Ice Storm Graphics
min: 7544     avg: 16078     median: 17063.5 (2%)     max: 23395 Points
3DMark - 3DMark Sling Shot (ES 3.0) Unlimited
min: 1445     avg: 1525     median: 1525 (7%)     max: 1605 Points
3DMark - 3DMark Sling Shot (ES 3.0) Unlimited Graphics
min: 1598     avg: 1684     median: 1684 (4%)     max: 1770 Points
3DMark - 3DMark Sling Shot Extreme (ES 3.1) Unlimited
min: 1072     avg: 1215     median: 1159 (5%)     max: 1414 Points
3DMark - 3DMark Sling Shot Extreme (ES 3.1) Unlimited Graphics
min: 1058     avg: 1251     median: 1142 (3%)     max: 1554 Points
3DMark - 3DMark Sling Shot (ES 3.0)
min: 1353     avg: 1429     median: 1398 (12%)     max: 1593 Points
3DMark - 3DMark Sling Shot (ES 3.0) Graphics
min: 1300     avg: 1505     median: 1530 (9%)     max: 1732 Points
3DMark - 3DMark Sling Shot Extreme (ES 3.1)
min: 1037     avg: 1133     median: 1070 (5%)     max: 1319 Points
3DMark - 3DMark Sling Shot Extreme (ES 3.1) Graphics
min: 973     avg: 1102     median: 1054 (4%)     max: 1261 Points
3DMark 11 - 3DM11 Performance Score
min: 314     avg: 359.4     median: 343 (0%)     max: 562 Points
min: 11869     avg: 12889     median: 12818.5 (16%)     max: 14048 Points
3DMark 11 - 3DM11 Performance GPU
min: 278     avg: 319.9     median: 298 (0%)     max: 494 Points
min: 14265     avg: 14412     median: 14351 (11%)     max: 14680 Points
3DMark Vantage
3DM Vant. Perf. total + AMD Radeon RX 5300M
3DMark Vantage - 3DM Vant. Perf. total
39264 Points (11%)
3DM Vant. Perf. GPU no PhysX + AMD Radeon RX 5300M
3DMark Vantage - 3DM Vant. Perf. GPU no PhysX
36391 Points (20%)
3DMark 06 3DMark 06 - Standard 1280x1024 + Intel HD Graphics (Cherry Trail)
3DMark 06
min: 2403     avg: 2833     median: 2595 (3%)     max: 3330 Points
3DMark 06 - Standard 1280x1024 + AMD Radeon RX 5300M
36032 Points (47%)
3DMark 06 - Standard 1024x768 + Intel HD Graphics (Cherry Trail)
3DMark 06
2877 Points (4%)
Unigine Valley 1.0 - Unigine Valley 1.0 DX
1.2 fps (0%)
Unigine Heaven 2.1 - Heaven 2.1 high
5.7 fps (1%)
SPECviewperf 13 specvp13 sw-04 + AMD Radeon RX 5300M
SPECviewperf 13 - specvp13 sw-04
71.5 fps (19%)
specvp13 showcase-02 + AMD Radeon RX 5300M
SPECviewperf 13 - specvp13 showcase-02
49.8 fps (8%)
specvp13 medical-02 + AMD Radeon RX 5300M
SPECviewperf 13 - specvp13 medical-02
40.6 fps (7%)
specvp13 maya-05 + AMD Radeon RX 5300M
SPECviewperf 13 - specvp13 maya-05
93.2 fps (11%)
specvp13 energy-02 + AMD Radeon RX 5300M
SPECviewperf 13 - specvp13 energy-02
1.1 fps (0%)
specvp13 creo-02 + AMD Radeon RX 5300M
SPECviewperf 13 - specvp13 creo-02
66.2 fps (10%)
specvp13 catia-05 + AMD Radeon RX 5300M
SPECviewperf 13 - specvp13 catia-05
97.3 fps (11%)
specvp13 3dsmax-06 + AMD Radeon RX 5300M
SPECviewperf 13 - specvp13 3dsmax-06
58.7 fps (9%)
Cinebench R10 Cinebench R10 Shading (32bit) + Intel HD Graphics (Cherry Trail)
Cinebench R11.5 Cinebench R11.5 OpenGL 64 Bit + Intel HD Graphics (Cherry Trail)
Cinebench R15
Cinebench R15 OpenGL 64 Bit + Intel HD Graphics (Cherry Trail)
Cinebench R15 OpenGL 64 Bit + AMD Radeon RX 5300M
111 fps (6%)
Cinebench R15 OpenGL Ref. Match 64 Bit + Intel HD Graphics (Cherry Trail)
Cinebench R15 OpenGL Ref. Match 64 Bit + AMD Radeon RX 5300M
98 % (98%)
GFXBench - GFXBench Car Chase Offscreen
min: 6.3     avg: 7.3     median: 7 (1%)     max: 9 fps
166.9 fps (16%)
GFXBench 3.1 - GFXBench Manhattan ES 3.1 Offscreen
min: 9.2     avg: 10.8     median: 11 (0%)     max: 13 fps
GFXBench 3.0 - GFXBench 3.0 Manhattan Offscreen
min: 8.4     avg: 13.8     median: 13.5 (1%)     max: 18 fps
GFXBench (DX / GLBenchmark) 2.7
GFXBench T-Rex HD Offscreen C24Z16 + Intel HD Graphics (Cherry Trail)
GFXBench (DX / GLBenchmark) 2.7 - GFXBench T-Rex HD Offscreen C24Z16
min: 22     avg: 30.5     median: 32 (0%)     max: 38.5 fps
LuxMark v2.0 64Bit - LuxMark v2.0 Room GPU
min: 48     avg: 58.7     median: 59 (0%)     max: 69 Samples/s
1509 Samples/s (5%)
LuxMark v2.0 64Bit - LuxMark v2.0 Sala GPU
min: 69     avg: 87.7     median: 89 (0%)     max: 105 Samples/s
3395 Samples/s (6%)
ComputeMark v2.1 - ComputeMark v2.1 Result
277 Points (0%)
7843 Points (7%)
Power Consumption - Witcher 3 Power Consumption *
100 Watt (22%)
Power Consumption - Power Efficiency - Witcher 3 ultra
0.4 fps per Watt (35%)
Emissions Witcher 3 Fan Noise + AMD Radeon RX 5300M
Emissions - Witcher 3 Fan Noise
48 dB(A) (69%)
Clock Speed - GPU Clock Witcher 3 ultra
1445 MHz (57%)

Average Benchmarks Intel HD Graphics (Cherry Trail) → 0% n=0

Average Benchmarks AMD Radeon RX 5300M → 0% n=0

- Range of benchmark values for this graphics card
red legend - Average benchmark values for this graphics card
* Smaller numbers mean a higher performance
1 This benchmark is not used for the average calculation

Game Benchmarks

The following benchmarks stem from our benchmarks of review laptops. The performance depends on the used graphics memory, clock rate, processor, system settings, drivers, and operating systems. So the results don't have to be representative for all laptops with this GPU. For detailed information on the benchmark results, click on the fps number.

low 1280x720
Radeon RX 5300M:
231  fps
med. 1920x1080
Radeon RX 5300M:
100  fps
high 1920x1080
Radeon RX 5300M:
66.4  fps
ultra 1920x1080
Radeon RX 5300M:
47.5  fps
low 1280x720
Radeon RX 5300M:
0 (!)  fps
med. 1920x1080
Radeon RX 5300M:
0 (!)  fps
high 1920x1080
Radeon RX 5300M:
0 (!)  fps
ultra 1920x1080
Radeon RX 5300M:
0 (!)  fps
low 1280x720
Radeon RX 5300M:
137  fps
med. 1920x1080
Radeon RX 5300M:
53  fps
high 1920x1080
Radeon RX 5300M:
43.2  fps
low 1280x720
Radeon RX 5300M:
121  fps
med. 1920x1080
Radeon RX 5300M:
80.5  fps
high 1920x1080
Radeon RX 5300M:
70.1  fps
ultra 1920x1080
Radeon RX 5300M:
56.7  fps
low 1280x720
Radeon RX 5300M:
95.4  fps
med. 1920x1080
Radeon RX 5300M:
41.2  fps
high 1920x1080
Radeon RX 5300M:
32.1  fps
med. 1920x1080
Radeon RX 5300M:
71.2  fps
high 1920x1080
Radeon RX 5300M:
61.1  fps
ultra 1920x1080
Radeon RX 5300M:
53.1  fps
low 1280x720
Radeon RX 5300M:
78.6  fps
med. 1920x1080
Radeon RX 5300M:
67.9  fps
high 1920x1080
Radeon RX 5300M:
58.6  fps
ultra 1920x1080
Radeon RX 5300M:
52.9  fps
low 1280x720
Radeon RX 5300M:
127  fps
med. 1920x1080
Radeon RX 5300M:
72.2  fps
high 1920x1080
Radeon RX 5300M:
57.9  fps
ultra 1920x1080
Radeon RX 5300M:
47  fps
GRID 2019

GRID 2019

2019
low 1280x720
Radeon RX 5300M:
164  fps
med. 1920x1080
Radeon RX 5300M:
76.8  fps
high 1920x1080
Radeon RX 5300M:
54.8  fps
ultra 1920x1080
Radeon RX 5300M:
25.5  fps
low 1280x720
Radeon RX 5300M:
82  fps
med. 1920x1080
Radeon RX 5300M:
51  fps
high 1920x1080
Radeon RX 5300M:
41  fps
ultra 1920x1080
Radeon RX 5300M:
22  fps
FIFA 20

FIFA 20

2019
low 1280x720
Radeon RX 5300M:
190  fps
med. 1920x1080
Radeon RX 5300M:
172  fps
high 1920x1080
Radeon RX 5300M:
160  fps
ultra 1920x1080
Radeon RX 5300M:
153  fps
low 1280x720
Radeon RX 5300M:
97.3  fps
med. 1920x1080
Radeon RX 5300M:
63.6  fps
high 1920x1080
Radeon RX 5300M:
40.9  fps
ultra 1920x1080
Radeon RX 5300M:
29.5 36 ~ 33 fps
Control

Control

2019
low 1280x720
Radeon RX 5300M:
132  fps
med. 1920x1080
Radeon RX 5300M:
41.8  fps
high 1920x1080
Radeon RX 5300M:
29.4  fps
F1 2019

F1 2019

2019
low 1280x720
Radeon RX 5300M:
176  fps
med. 1920x1080
Radeon RX 5300M:
106  fps
high 1920x1080
Radeon RX 5300M:
94  fps
ultra 1920x1080
Radeon RX 5300M:
81  fps
Rage 2

Rage 2

2019
low 1280x720
Radeon RX 5300M:
121  fps
med. 1920x1080
Radeon RX 5300M:
54.8  fps
high 1920x1080
Radeon RX 5300M:
30.4  fps
ultra 1920x1080
Radeon RX 5300M:
29.8  fps
Anno 1800

Anno 1800

2019
low 1280x720
Radeon RX 5300M:
83.4  fps
med. 1920x1080
Radeon RX 5300M:
60.3  fps
high 1920x1080
Radeon RX 5300M:
39.7  fps
ultra 1920x1080
Radeon RX 5300M:
20.6  fps
low 1280x720
Radeon RX 5300M:
120  fps
med. 1920x1080
Radeon RX 5300M:
75  fps
high 1920x1080
Radeon RX 5300M:
63  fps
ultra 1920x1080
Radeon RX 5300M:
42  fps
low 1280x720
Radeon RX 5300M:
190  fps
med. 1920x1080
Radeon RX 5300M:
110  fps
high 1920x1080
Radeon RX 5300M:
89.9  fps
ultra 1920x1080
Radeon RX 5300M:
49.5  fps
low 1280x720
Radeon RX 5300M:
88  fps
med. 1920x1080
Radeon RX 5300M:
69  fps
high 1920x1080
Radeon RX 5300M:
64  fps
ultra 1920x1080
Radeon RX 5300M:
58  fps
low 1280x720
Radeon RX 5300M:
105  fps
med. 1920x1080
Radeon RX 5300M:
51.2  fps
high 1920x1080
Radeon RX 5300M:
36.1  fps
ultra 1920x1080
Radeon RX 5300M:
28.6  fps
low 1280x720
Radeon RX 5300M:
143  fps
med. 1920x1080
Radeon RX 5300M:
87.2  fps
high 1920x1080
Radeon RX 5300M:
68.6  fps
ultra 1920x1080
Radeon RX 5300M:
67.6  fps
low 1280x720
Radeon RX 5300M:
108  fps
med. 1920x1080
Radeon RX 5300M:
79.1  fps
high 1920x1080
Radeon RX 5300M:
56  fps
ultra 1920x1080
Radeon RX 5300M:
52.5  fps
low 1280x720
Radeon RX 5300M:
155  fps
med. 1920x1080
Radeon RX 5300M:
76.8  fps
high 1920x1080
Radeon RX 5300M:
62.2  fps
ultra 1920x1080
Radeon RX 5300M:
54.9  fps
low 1280x720
Radeon RX 5300M:
140  fps
med. 1920x1080
Radeon RX 5300M:
91.8  fps
high 1920x1080
Radeon RX 5300M:
79.4  fps
ultra 1920x1080
Radeon RX 5300M:
70.8  fps
Hitman 2

Hitman 2

2018
low 1280x720
Radeon RX 5300M:
74.5  fps
med. 1920x1080
Radeon RX 5300M:
65.7  fps
high 1920x1080
Radeon RX 5300M:
55.8  fps
ultra 1920x1080
Radeon RX 5300M:
48.8  fps
low 1280x720
Radeon RX 5300M:
72  fps
med. 1920x1080
Radeon RX 5300M:
59  fps
high 1920x1080
Radeon RX 5300M:
42  fps
ultra 1920x1080
Radeon RX 5300M:
25  fps
low 1280x720
Radeon RX 5300M:
114  fps
med. 1920x1080
Radeon RX 5300M:
60  fps
high 1920x1080
Radeon RX 5300M:
48  fps
ultra 1920x1080
Radeon RX 5300M:
34 36 ~ 35 fps
low 1280x720
Radeon RX 5300M:
80.6  fps
med. 1920x1080
Radeon RX 5300M:
60.1  fps
high 1920x1080
Radeon RX 5300M:
52.2  fps
ultra 1920x1080
Radeon RX 5300M:
42.6  fps
low 1280x720
Radeon RX 5300M:
51.5  fps
med. 1920x1080
Radeon RX 5300M:
39.5  fps
high 1920x1080
Radeon RX 5300M:
34.9  fps
low 1280x720
Radeon RX 5300M:
118  fps
med. 1920x1080
Radeon RX 5300M:
70.4  fps
high 1920x1080
Radeon RX 5300M:
60.8  fps
ultra 1920x1080
Radeon RX 5300M:
38.3  fps
low 1280x720
Radeon RX 5300M:
98.4  fps
med. 1920x1080
Radeon RX 5300M:
51.6  fps
high 1920x1080
Radeon RX 5300M:
29.3  fps
Fortnite

Fortnite

2018
low 1280x720
Radeon RX 5300M:
131  fps
med. 1920x1080
Radeon RX 5300M:
114  fps
high 1920x1080
Radeon RX 5300M:
81.8  fps
ultra 1920x1080
Radeon RX 5300M:
58.2  fps
low 1280x720
100%
HD Graphics (Cherry Trail):
21.4  fps
low 1280x720
100%
HD Graphics (Cherry Trail):
15.5  fps
low 1280x720
100%
HD Graphics (Cherry Trail):
22.6  fps
low 1024x768
100%
HD Graphics (Cherry Trail):
11.5  fps
med. 1366x768
100%
HD Graphics (Cherry Trail):
7  fps
low 1024x768
100%
HD Graphics (Cherry Trail):
8.8  fps
med. 1366x768
100%
HD Graphics (Cherry Trail):
4.8  fps
Anno 2205

Anno 2205

2015
low 1024x768
100%
HD Graphics (Cherry Trail):
8.1  fps
med. 1366x768
100%
HD Graphics (Cherry Trail):
3.9  fps
low 1366x768
100%
HD Graphics (Cherry Trail):
13.9 16.8 ~ 15 fps
low 1024x768
100%
HD Graphics (Cherry Trail):
15.1  fps
med. 1366x768
100%
HD Graphics (Cherry Trail):
9.8  fps
low 1280x720
100%
HD Graphics (Cherry Trail):
20  fps
565%
Radeon RX 5300M:
113  fps
med. 1366x768
100%
HD Graphics (Cherry Trail):
15.2  fps
711%
Radeon RX 5300M:
108  fps
high 1920x1080
100%
HD Graphics (Cherry Trail):
7.2  fps
1360%
Radeon RX 5300M:
97.9  fps
ultra 1920x1080
Radeon RX 5300M:
94.7  fps
low 1024x768
Radeon RX 5300M:
178  fps
med. 1366x768
Radeon RX 5300M:
122  fps
high 1920x1080
Radeon RX 5300M:
60  fps
ultra 1920x1080
Radeon RX 5300M:
38.3  fps
low 1024x768
100%
HD Graphics (Cherry Trail):
20.1  fps
med. 1366x768
100%
HD Graphics (Cherry Trail):
12.5  fps
GTA V

GTA V

2015
low 1024x768
100%
HD Graphics (Cherry Trail):
10.8 (!)  fps
1509%
Radeon RX 5300M:
163  fps
high 1920x1080
Radeon RX 5300M:
86.1  fps
ultra 1920x1080
Radeon RX 5300M:
42.6  fps
low 1024x768
100%
HD Graphics (Cherry Trail):
9.5  fps
med. 1366x768
100%
HD Graphics (Cherry Trail):
5.7  fps
low 1024x768
100%
HD Graphics (Cherry Trail):
16.2  fps
med. 1366x768
100%
HD Graphics (Cherry Trail):
6.1  fps
F1 2014

F1 2014

2014
low 1024x768
100%
HD Graphics (Cherry Trail):
16  fps
med. 1366x768
100%
HD Graphics (Cherry Trail):
12  fps
Fifa 15

Fifa 15

2014
low 1280x720
100%
HD Graphics (Cherry Trail):
15.6  fps
Sims 4

Sims 4

2014
low 1024x768
100%
HD Graphics (Cherry Trail):
65.6 66.6 81.4 ~ 71 fps
med. 1366x768
100%
HD Graphics (Cherry Trail):
9.4 16.9 21.2 ~ 16 fps
high 1920x1080
100%
HD Graphics (Cherry Trail):
5.5 10 ~ 8 fps
low 1024x768
100%
HD Graphics (Cherry Trail):
22 27.3 ~ 25 fps
med. 1366x768
100%
HD Graphics (Cherry Trail):
12.5 13.5 ~ 13 fps
low 1024x768
100%
HD Graphics (Cherry Trail):
13.3  fps
Asphalt 8: Airborne

Asphalt 8: Airborne

2013
low
100%
HD Graphics (Cherry Trail):
58  fps
high
100%
HD Graphics (Cherry Trail):
47  fps
Dota 2

Dota 2

2013
low 1024x768
100%
HD Graphics (Cherry Trail):
29.7  fps
med. 1366x768
100%
HD Graphics (Cherry Trail):
16.5  fps
GRID 2

GRID 2

2013
low 1024x768
100%
HD Graphics (Cherry Trail):
24  fps
med. 1366x768
100%
HD Graphics (Cherry Trail):
13.5  fps
low 1280x720
100%
HD Graphics (Cherry Trail):
16 18 18.9 19.8 20.1 20.5 ~ 19 fps
med. 1366x768
100%
HD Graphics (Cherry Trail):
6.4 7.9 9.3 9.8 10 10 ~ 9 fps
high 1366x768
100%
HD Graphics (Cherry Trail):
5.6 5.7 6.7 7.6 7.9 8.4 ~ 7 fps
ultra 1920x1080
100%
HD Graphics (Cherry Trail):
2.4 2.6 ~ 2 fps
low 1024x768
100%
HD Graphics (Cherry Trail):
19.7 25.7 27.8 30.2 33.6 ~ 27 fps
med. 1366x768
100%
HD Graphics (Cherry Trail):
10.5 12 13.2 13.5 14.8 ~ 13 fps
high 1366x768
100%
HD Graphics (Cherry Trail):
7 8.3 9 ~ 8 fps
ultra 1920x1080
100%
HD Graphics (Cherry Trail):
3.7 3.8 ~ 4 fps
Temple Run 2

Temple Run 2

2013
high
100%
HD Graphics (Cherry Trail):
34  fps
low 1024x768
100%
HD Graphics (Cherry Trail):
15.2  fps
med. 1366x768
100%
HD Graphics (Cherry Trail):
11.6  fps
low 1024x768
HD Graphics (Cherry Trail):
0 (!)  fps
med. 1366x768
HD Graphics (Cherry Trail):
0 (!)  fps
low 1024x768
100%
HD Graphics (Cherry Trail):
14.1 21.6 41.1 ~ 26 fps
med. 1366x768
100%
HD Graphics (Cherry Trail):
4.8 18.6 35.1 ~ 20 fps
high 1366x768
100%
HD Graphics (Cherry Trail):
20.3  fps
ultra 1920x1080
100%
HD Graphics (Cherry Trail):
11.4  fps
low 1024x768
100%
HD Graphics (Cherry Trail):
24.3 31.9 ~ 28 fps
med. 1366x768
100%
HD Graphics (Cherry Trail):
16 19 ~ 18 fps
Anno 2070

Anno 2070

2011
low 1024x768
100%
HD Graphics (Cherry Trail):
15.3 28.1 33.1 ~ 26 fps
med. 1366x768
100%
HD Graphics (Cherry Trail):
12.8 13.4 13.7 ~ 13 fps
high 1366x768
100%
HD Graphics (Cherry Trail):
8  fps
low 1280x720
100%
HD Graphics (Cherry Trail):
15.5 18.9 ~ 17 fps
med. 1366x768
100%
HD Graphics (Cherry Trail):
7.2 8.5 ~ 8 fps
low 1024x768
100%
HD Graphics (Cherry Trail):
25.6  fps
high 1366x768
100%
HD Graphics (Cherry Trail):
12  fps
Dirt 3

Dirt 3

2011
low 800x600
100%
HD Graphics (Cherry Trail):
28.1  fps
med. 1024x768
100%
HD Graphics (Cherry Trail):
12.5  fps
Civilization 5

Civilization 5

2010
low 1024x768
100%
HD Graphics (Cherry Trail):
18.7  fps
low 1024x768
100%
HD Graphics (Cherry Trail):
63.2 64 ~ 64 fps
med. 1360x768
100%
HD Graphics (Cherry Trail):
18 18.8 ~ 18 fps
high 1360x768
100%
HD Graphics (Cherry Trail):
14  fps
ultra 1920x1080
100%
HD Graphics (Cherry Trail):
7  fps
Trackmania Nations Forever

Trackmania Nations Forever

2008
low 640x480
100%
HD Graphics (Cherry Trail):
77.3 92.6 96.1 97.8 99.7 105 128 ~ 100 fps
high 1024x768
100%
HD Graphics (Cherry Trail):
18.2 21.3 22.9 24.4 24.7 25 29.2 ~ 24 fps
ultra 1920x1080
100%
HD Graphics (Cherry Trail):
9.6 15.5 16.8 ~ 14 fps
World of Warcraft

World of Warcraft

2005
low 800x600
100%
HD Graphics (Cherry Trail):
44 50.9 ~ 47 fps
med. 1024x768
100%
HD Graphics (Cherry Trail):
18.3  fps

Average Gaming Intel HD Graphics (Cherry Trail) → 100%

Average Gaming 30-70 fps → 100%

Average Gaming AMD Radeon RX 5300M → 1036%

Intel HD Graphics (Cherry Trail)AMD Radeon RX 5300MIntel HD Graphics (Skylake)
lowmed.highultraQHD4Klowmed.highultraQHD4Klowmed.highultraQHD4K
Gears Tactics23110066.447.5
Doom Eternal
Hunt Showdown1375343.2
Escape from Tarkov12180.570.156.7
Red Dead Redemption 295.441.232.1
Star Wars Jedi Fallen Order71.261.153.1
Need for Speed Heat78.667.958.652.9
Call of Duty Modern Warfare 201912772.257.947
GRID 201916476.854.825.5
Ghost Recon Breakpoint82514122
FIFA 20190172160153
Borderlands 397.363.640.933
Control13241.829.4
F1 20191761069481
Rage 212154.830.429.8
Anno 180083.460.339.720.6
The Division 2120756342
Dirt Rally 2.019011089.949.5
Far Cry New Dawn88696458
Metro Exodus10551.236.128.6
Apex Legends14387.268.667.6
Just Cause 410879.15652.5
Darksiders III15576.862.254.9
Battlefield V14091.879.470.8
Hitman 274.565.755.848.8
Assassin´s Creed Odyssey72594225
Shadow of the Tomb Raider114604835
Monster Hunter World80.660.152.242.6
X-Plane 11.1151.539.534.9
Kingdom Come: Deliverance11870.460.838.3
Final Fantasy XV Benchmark98.451.629.3
Fortnite13111481.858.2
Dota 2 Reborn2015.27.211310897.994.7
The Witcher 31781226038.3
GTA V10.816386.142.6
Intel HD Graphics (Cherry Trail)AMD Radeon RX 5300MIntel HD Graphics (Skylake)
lowmed.highultraQHD4Klowmed.highultraQHD4Klowmed.highultraQHD4K
< 30 fps
< 60 fps
< 120 fps
≥ 120 fps
2


1


1


< 30 fps
< 60 fps
< 120 fps
≥ 120 fps

1
15
17

9
22
2
2
16
15
1
6
18
4
1


< 30 fps
< 60 fps
< 120 fps
≥ 120 fps


For more games that might be playable and a list of all games and graphics cards visit our Gaming List

v1.33
log 17. 06:41:18

#0 ran 0s before starting gpusingle class +0s ... 0s

#1 checking url part for id 6197 +0s ... 0s

#2 checking url part for id 9945 +0s ... 0s

#3 checking url part for id 6474 +0s ... 0s

#4 redirected to Ajax server, took 1755405677s time from redirect:0 +0s ... 0s

#5 did not recreate cache, as it is less than 5 days old! Created at Sat, 16 Aug 2025 05:18:43 +0200 +0s ... 0s

#6 composed specs +0.019s ... 0.019s

#7 did output specs +0s ... 0.019s

#8 start showIntegratedCPUs +0s ... 0.019s

#9 getting avg benchmarks for device 6197 +0.02s ... 0.039s

#10 got single benchmarks 6197 +0.023s ... 0.063s

#11 getting avg benchmarks for device 9945 +0s ... 0.063s

#12 got single benchmarks 9945 +0.005s ... 0.068s

#13 getting avg benchmarks for device 6474 +0s ... 0.068s

#14 got single benchmarks 6474 +0s ... 0.069s

#15 got avg benchmarks for devices +0s ... 0.069s

#16 min, max, avg, median took s +0.025s ... 0.094s

#17 before gaming benchmark output +0s ... 0.094s

#18 Got 274 rows for game benchmarks. +0.011s ... 0.105s

#19 composed SQL query for gamebenchmarks +0s ... 0.105s

#20 got data and put it in $dataArray +0.003s ... 0.108s

#21 benchmarks composed for output. +0.021s ... 0.129s

#22 calculated avg scores. +0s ... 0.129s

#23 return log +0.001s ... 0.13s

Please share our article, every link counts!
Mail Logo
> Expert Reviews and News on Laptops, Smartphones and Tech Innovations > Benchmarks / Tech > Graphics Card Comparison - Head 2 Head
Redaktion, 2017-09- 8 (Update: 2023-07- 1)