Notebookcheck Logo

Intel HD Graphics (Broadwell) vs AMD Radeon R2 (Mullins/Beema/Carrizo-L) vs Intel HD Graphics (Haswell)

Intel HD Graphics (Broadwell)

► remove from comparison Intel HD Graphics (Broadwell)

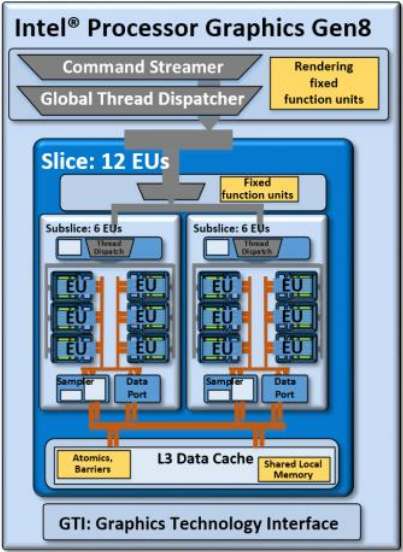
The Intel HD Graphics (Broadwell) (GT1) is an integrated Broadwell graphics card revealed in Q1 2015. It can be found in several low-end CPUs such as the Pentium 3805U or Celeron 3755U. The so-called GT1 GPU offers 12 EUs (Execution Units) and therefore somewhat more shader power than the previous HD Graphics (Haswell). The clock range may depend on the specific model it is built into.

Architecture and Features

Broadwell features a GPU based on the Intel Gen8 architecture, which has been optimized in various aspects compared to the previous Gen7.5 (Haswell). In case of the GT1 version, the shader arrays called "subslice" have been reorganized and now offer 6 Execution Units (EUs) each. Two subslices form a "slice" for a total of 12 EUs. Combined with other improvements such as larger L1 caches and an optimized frontend, the integrated GPU has become faster and more efficient than its predecessor.

The HD Graphics (Broadwell) represents the low-end version of the Broadwell GPU family and consists of one slice with 12 EUs. Beyond that, there is also a mid-range variant (GT2, 24 EUs) as well as higher-end models (GT3/GT3e + eDRAM, 48 EUs).

All Broadwell GPUs support OpenCL 2.0 and DirectX 12 (FL 11_1). The video engine can now decode H.265 using both fixed function hardware as well as available GPU shaders. Up to three displays can be connected via DP 1.2/eDP 1.3 (max. 3840 x 2160 @ 60 Hz) or HDMI 1.4a (max. 3840 x 2160 @ 24 Hz). HDMI 2.0, however, is not supported.

Performance

Even though the HD Graphics (Broadwell) is clocked a bit lower, the performance should be clearly above the HD Graphics (Haswell) and similar to the HD Graphics 4000. Nevertheless, only a few games as of 2014/2015 will run fluently at (very) low settings, e.g. Dota 2 or Sims 4.

Power Consumption

Utilizing a new 14 nm process, the HD Graphics (Broadwell) can be found in ULV models (15 W) as well as regular dual core CPUs (37 W, not yet presented). The TDP is flexible and can be further reduced, which has a significant impact on performance.

AMD Radeon R2 (Mullins/Beema/Carrizo-L)

► remove from comparison AMD Radeon R2 (Mullins/Beema/Carrizo-L)

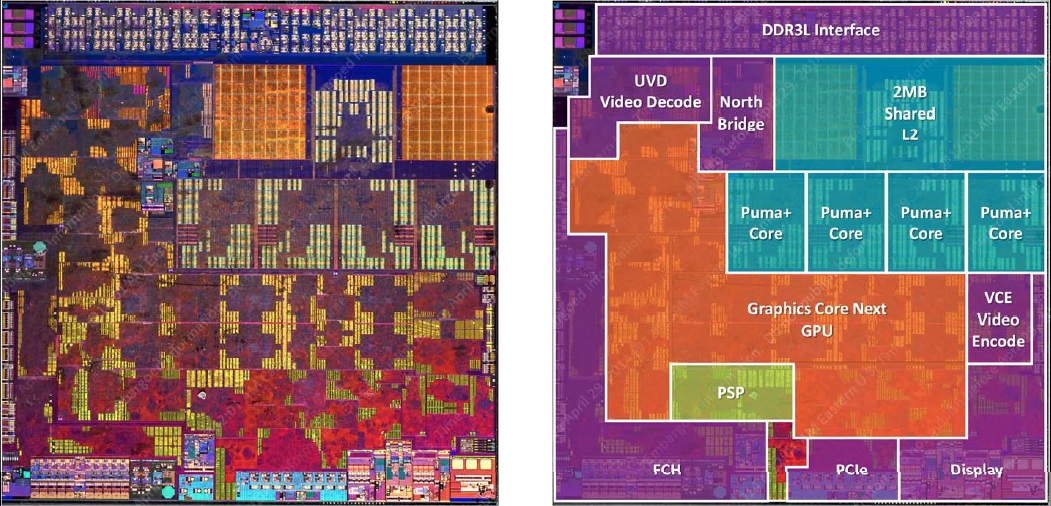
The AMD Radeon R2 is an integrated DirectX 12 graphics card found in some AMD APUs (for example, E1-6010, E2-6110, and E1 Micro-6200T). It offers 128 shader cores across two Compute Units and is based on the GCN architecture. Clock speeds can be up to 300 MHz on a Mullins APU or 500 MHz on a Beema APU. The GPU does not have dedicated VRAM and will access main system memory (depending on the APU: single-channel DDR3L-1066/1333/1600).

Using its UVD (Unified Video Decoder), the GPU can support the CPU when decoding videos up to 4K. In addition, the chip integrates a specialized video encoder called VCE. Video streams can output via VGA, DVI, HDMI 1.4a and DisplayPort 1.2 to up to two external monitors.

The performance of the Radeon R2 varies greatly between different APUs as there is a very wide range of clock speeds. While the fastest models may reach speeds similar to a Radeon HD 8330, slower versions should offer a performance closer to a Radeon HD 8210. Typically, only older and very undemanding games like World of Warcraft will play fluently at low settings.

Intel HD Graphics (Haswell)

► remove from comparison Intel HD Graphics (Haswell)

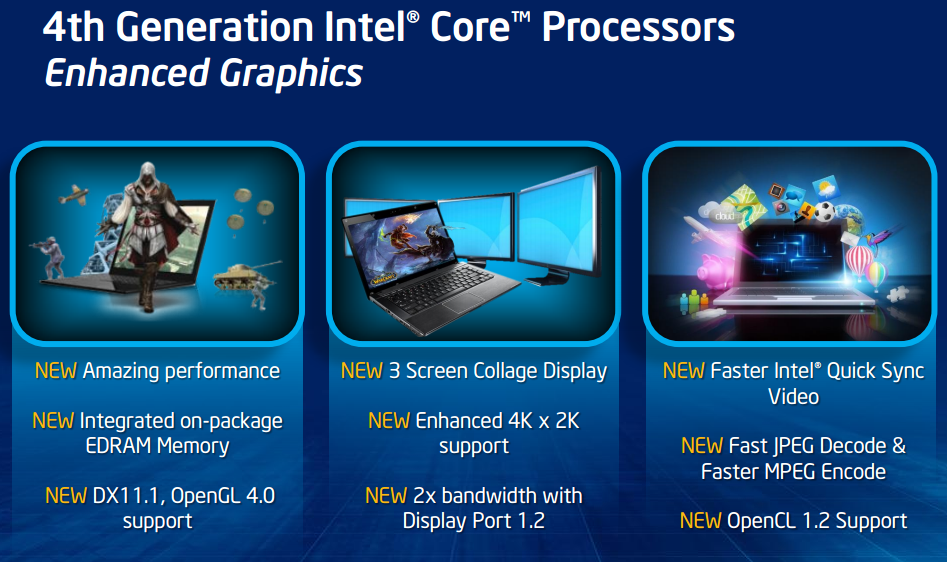
The Intel HD Graphics (Haswell) is an integrated graphics card in the Haswell codenamed processors (Celeron and Pentium). It is the successor the the Intel HD Graphics in the Ivy Bridge CPUs and performs slightly better. Depending on the processor model, the base and turbo clock rates may differ, resulting in varying graphics performance between CPU models.

In comparison to the HD 4000, the graphics core has been modified extensively. The GPU supports DirectX 11.1, OpenCL 1.2 and OpenGL 4.0. It also features an improved decoder for 4K videos and the fast Quick Sync encoder (deactivated in many entry level models).

The Performance of the HD Graphics (Haswell) is similar to the old HD Graphics 3000 or the AMD Radeon HD 8250. Only a few modern games like Dota 2 can be played fluently in very low details and resolutions.

Due to the 22nm 3D Tri-Gate production process, the power consumption should be relatively low (the development was focused on performance per Watt). The GPU can be found in ULV models and regular (37 W) dual core CPUs.

Intel HD Graphics (Broadwell)AMD Radeon R2 (Mullins/Beema/Carrizo-L)Intel HD Graphics (Haswell)
HD Graphics Series
HD Graphics P530 24 @ 0.35 - 1.05 GHz64/128 Bit
HD Graphics 5600 24 @ 0.3 - 1.05 GHz64/128 Bit
HD Graphics 6000 48 @ 0.3 - 1 GHz64/128 Bit
HD Graphics 4600 20 @ 0.2 - 1.35 GHz64/128 Bit
HD Graphics 5500 24 @ 0.3 - 0.95 GHz64/128 Bit
HD Graphics 5000 40 @ 0.2 - 1.1 GHz64/128 Bit
HD Graphics 4400 20 @ 0.2 - 1.1 GHz64/128 Bit
HD Graphics 5300 24 @ 0.1 - 0.9 GHz64/128 Bit
HD Graphics 4000 16 @ 0.35 - 1.35 GHz64/128 Bit
HD Graphics (Broadwell) 12 @ 0.1 - 0.85 GHz64/128 Bit
HD Graphics 4200 20 @ 0.2 - 0.85 GHz64/128 Bit
HD Graphics (Skylake) 12 @ 0.3 - 0.8 GHz64/128 Bit
HD Graphics 405 (Braswell) 16 @ 0.32 - 0.7 GHz64/128 Bit
HD Graphics (Braswell) 16 @ 0.32 - 0.7 GHz64/128 Bit
HD Graphics 400 (Braswell) 12 @ 0.32 - 0.64 GHz64/128 Bit
HD Graphics (Haswell) 10 @ 0.2 - 1 GHz64/128 Bit
HD Graphics (Cherry Trail) 16 @ 0.2 - 0.6 GHz64/128 Bit
HD Graphics 3000 12 @ 0.35 - 1.35 GHz64/128 Bit
HD Graphics 2500 6 @ 0.65 - 1.15 GHz64/128 Bit
HD Graphics (Ivy Bridge) 6 @ 0.35 - 1.1 GHz64/128 Bit
HD Graphics 2000 6 @ 0.85 - 1.35 GHz64/128 Bit
HD Graphics (Sandy Bridge) 6 @ 0.35 - 1.1 GHz64/128 Bit
HD Graphics (Bay Trail) 4 @ 0.31 - 0.9 GHz32/64/128 Bit
Radeon R5 (Beema/Carrizo-L) 128 @ 0.85 GHz64 Bit
Radeon R4 (Beema) 128 @ 0.8 GHz64 Bit
Radeon R3 (Mullins/Beema) 128 @ 0.35 - 0.69 GHz64 Bit
Radeon R2 (Mullins/Beema/Carrizo-L) 128 @ 0.3 - 0.6 GHz64 Bit
Radeon R6 (Mullins) 128 @ 0.5 GHz64 Bit
HD Graphics P530 24 @ 0.35 - 1.05 GHz64/128 Bit
HD Graphics 5600 24 @ 0.3 - 1.05 GHz64/128 Bit
HD Graphics 6000 48 @ 0.3 - 1 GHz64/128 Bit
HD Graphics 4600 20 @ 0.2 - 1.35 GHz64/128 Bit
HD Graphics 5500 24 @ 0.3 - 0.95 GHz64/128 Bit
HD Graphics 5000 40 @ 0.2 - 1.1 GHz64/128 Bit
HD Graphics 4400 20 @ 0.2 - 1.1 GHz64/128 Bit
HD Graphics 5300 24 @ 0.1 - 0.9 GHz64/128 Bit
HD Graphics 4000 16 @ 0.35 - 1.35 GHz64/128 Bit
HD Graphics (Broadwell) 12 @ 0.1 - 0.85 GHz64/128 Bit
HD Graphics 4200 20 @ 0.2 - 0.85 GHz64/128 Bit
HD Graphics (Skylake) 12 @ 0.3 - 0.8 GHz64/128 Bit
HD Graphics 405 (Braswell) 16 @ 0.32 - 0.7 GHz64/128 Bit
HD Graphics (Braswell) 16 @ 0.32 - 0.7 GHz64/128 Bit
HD Graphics 400 (Braswell) 12 @ 0.32 - 0.64 GHz64/128 Bit
HD Graphics (Haswell) 10 @ 0.2 - 1 GHz64/128 Bit
HD Graphics (Cherry Trail) 16 @ 0.2 - 0.6 GHz64/128 Bit
HD Graphics 3000 12 @ 0.35 - 1.35 GHz64/128 Bit
HD Graphics 2500 6 @ 0.65 - 1.15 GHz64/128 Bit
HD Graphics (Ivy Bridge) 6 @ 0.35 - 1.1 GHz64/128 Bit
HD Graphics 2000 6 @ 0.85 - 1.35 GHz64/128 Bit
HD Graphics (Sandy Bridge) 6 @ 0.35 - 1.1 GHz64/128 Bit
HD Graphics (Bay Trail) 4 @ 0.31 - 0.9 GHz32/64/128 Bit
CodenameBroadwell GT1Beema/MullinsHaswell GT1
ArchitectureGen. 8 BroadwellGCN 1.1Gen. 7.5 Haswell
Pipelines12 - unified128 - unified10 - unified
Core Speed100 - 850 (Boost) MHz300 - 600 (Boost) MHz200 - 1000 (Boost) MHz
Memory Bus Width64/128 Bit64 Bit64/128 Bit
Shared Memoryyesyesyes
APIDirectX 12 (FL 11_1), OpenGL 4.3DirectX 12 (FL 12_0), Shader 5.0DirectX 11.1, Shader 5.0
technology14 nm28 nm22 nm
FeaturesQuickSync
Date of Announcement05.01.2015 29.04.2014 01.10.2012
CPU in HD Graphics (Broadwell)GPU Base SpeedGPU Boost / Turbo
Intel Pentium 3825U2 x 1900 MHz, 15 W100 MHz850 MHz
Intel Celeron 3765U2 x 1900 MHz, 15 W300 MHz850 MHz
Intel Pentium 3805U2 x 1900 MHz, 15 W100 MHz800 MHz
min. - max.100 - 300 MHz800 - 850 MHz
CPU in Radeon R2 (Mullins/Beema/Carrizo-L)GPU Base SpeedGPU Boost / Turbo
AMD E2-71104 x 1800 MHz, 15 W? MHz600 MHz
AMD E2-61104 x 1500 MHz, 15 W? MHz500 MHz
AMD E1 Micro-6200T2 x 1000 MHz, 3.95 W? MHz300 MHz
AMD E1-60102 x 1350 MHz, 10 W260 MHz350 MHz
min. - max.260 - ? MHz300 - 600 MHz
CPU in HD Graphics (Haswell)GPU Base SpeedGPU Boost / Turbo
Intel Pentium 3560M2 x 2400 MHz, 37 W400 MHz1100 MHz
Intel Pentium 3550M2 x 2300 MHz, 37 W400 MHz1100 MHz
Intel Celeron 2970M2 x 2200 MHz, 37 W400 MHz1100 MHz
min. - max.200 - 400 MHz850 - 1100 MHz

Benchmarks

Performance Rating - 3DMark 11 + Fire Strike + Time Spy - HD Graphics (Broadwell)
0.2 pt (1%)
Restrict / Search: Model: Max. age: years
Performance Rating - 3DMark 11 + Fire Strike + Time Spy - Radeon R2 (Mullins/Beema/Carrizo-L)
0.1 pt (0%)
Restrict / Search: Model: Max. age: years
Performance Rating - 3DMark 11 + Fire Strike + Time Spy - HD Graphics (Haswell)
0.1 pt (0%)
Restrict / Search: Model: Max. age: years
3DMark - 3DMark Ice Storm Unlimited Graphics
43493 Points (4%)
3DMark - 3DMark Cloud Gate Score
3398 Points (3%)
min: 1319     avg: 1981     median: 1980.5 (2%)     max: 2642 Points
min: 2141     avg: 2403     median: 2335.5 (2%)     max: 3011 Points
3DMark - 3DMark Cloud Gate Graphics
4015 Points (1%)
min: 2207     avg: 2650     median: 2650 (1%)     max: 3093 Points
min: 3111     avg: 3415     median: 3278 (1%)     max: 4199 Points
3DMark - 3DMark Fire Strike Standard Score
428 Points (1%)
min: 276     avg: 350.5     median: 350.5 (1%)     max: 425 Points
min: 300     avg: 323.8     median: 314 (0%)     max: 383 Points
3DMark - 3DMark Fire Strike Standard Graphics
463 Points (0%)
min: 295     avg: 373     median: 373 (0%)     max: 451 Points
min: 340     avg: 370.8     median: 362.5 (0%)     max: 433 Points
3DMark - 3DMark Ice Storm Graphics
45539 Points (5%)
min: 22359     avg: 26820     median: 23669 (3%)     max: 34433 Points
min: 29291     avg: 34138     median: 34675 (4%)     max: 40515 Points
3DMark 11 - 3DM11 Performance Score
729 Points (1%)
min: 371     avg: 494.7     median: 434.5 (1%)     max: 693 Points
min: 435     avg: 543     median: 544 (1%)     max: 688 Points
3DMark 11 - 3DM11 Performance GPU
641 Points (0%)
min: 395     avg: 471.7     median: 397 (0%)     max: 623 Points
min: 384     avg: 479.6     median: 484 (0%)     max: 602 Points
3DMark Vantage
3DM Vant. Perf. total + Intel HD Graphics (Broadwell)
3DMark Vantage - 3DM Vant. Perf. total
2651 Points (1%)
3DM Vant. Perf. total + AMD Radeon R2 (Mullins/Beema/Carrizo-L)
3DM Vant. Perf. total + Intel HD Graphics (Haswell)
min: 2146     avg: 2163     median: 2163 (1%)     max: 2180 Points
3DM Vant. Perf. GPU no PhysX + Intel HD Graphics (Broadwell)
3DMark Vantage - 3DM Vant. Perf. GPU no PhysX
2196 Points (1%)
3DM Vant. Perf. GPU no PhysX + AMD Radeon R2 (Mullins/Beema/Carrizo-L)
3DM Vant. Perf. GPU no PhysX + Intel HD Graphics (Haswell)
min: 1848     avg: 1859     median: 1859 (1%)     max: 1870 Points
3DMark 06 3DMark 06 - Standard 1280x1024 + Intel HD Graphics (Broadwell)
3DMark 06
5077 Points (7%)
3DMark 06 - Standard 1280x1024 + AMD Radeon R2 (Mullins/Beema/Carrizo-L)
min: 2425     avg: 3242     median: 3242 (4%)     max: 4059 Points
3DMark 06 - Standard 1280x1024 + Intel HD Graphics (Haswell)
min: 2917     avg: 3274     median: 3357.5 (4%)     max: 3463 Points
Unigine Heaven 2.1 - Heaven 2.1 high
10.9 fps (2%)
Windows 7 Experience Index - Win7 Gaming graphics
6.3 Points (80%)
Windows 7 Experience Index - Win7 Graphics
4.7 Points (59%)
Cinebench R10 Cinebench R10 Shading (32bit) + Intel HD Graphics (Broadwell)
Cinebench R10 - Cinebench R10 Shading (32bit)
4886 Points (3%)
Cinebench R10 Shading (32bit) + AMD Radeon R2 (Mullins/Beema/Carrizo-L)
min: 1501     avg: 2029     median: 1616 (1%)     max: 2971 Points
Cinebench R10 Shading (32bit) + Intel HD Graphics (Haswell)
min: 3867     avg: 4235     median: 4215.5 (3%)     max: 4642 Points
Cinebench R11.5 Cinebench R11.5 OpenGL 64 Bit + Intel HD Graphics (Broadwell)
Cinebench R11.5 - Cinebench R11.5 OpenGL 64 Bit
12.8 fps (4%)
Cinebench R11.5 OpenGL 64 Bit + AMD Radeon R2 (Mullins/Beema/Carrizo-L)
min: 8.89     avg: 11.4     median: 11.4 (4%)     max: 13.9 fps
Cinebench R11.5 OpenGL 64 Bit + Intel HD Graphics (Haswell)
min: 9.38     avg: 11.4     median: 11.6 (4%)     max: 12.78 fps
Cinebench R15
Cinebench R15 OpenGL 64 Bit + Intel HD Graphics (Broadwell)
Cinebench R15 - Cinebench R15 OpenGL 64 Bit
17.8 fps (1%)
Cinebench R15 OpenGL 64 Bit + AMD Radeon R2 (Mullins/Beema/Carrizo-L)
min: 7.95     avg: 10.7     median: 9.5 (1%)     max: 14.7 fps
Cinebench R15 OpenGL 64 Bit + Intel HD Graphics (Haswell)
min: 10.28     avg: 13.2     median: 13.9 (1%)     max: 14.59 fps
Cinebench R15 OpenGL Ref. Match 64 Bit + Intel HD Graphics (Broadwell)
Cinebench R15 - Cinebench R15 OpenGL Ref. Match 64 Bit
98 % (98%)
Cinebench R15 OpenGL Ref. Match 64 Bit + AMD Radeon R2 (Mullins/Beema/Carrizo-L)
Cinebench R15 OpenGL Ref. Match 64 Bit + Intel HD Graphics (Haswell)
GFXBench - GFXBench Car Chase Offscreen
11.6 fps (1%)
GFXBench 3.1 - GFXBench Manhattan ES 3.1 Offscreen
17.4 fps (0%)
20.1 fps (0%)
GFXBench 3.0 - GFXBench 3.0 Manhattan Offscreen
21.5 fps (1%)
28.7 fps (1%)
GFXBench (DX / GLBenchmark) 2.7
GFXBench T-Rex HD Offscreen C24Z16 + Intel HD Graphics (Broadwell)
GFXBench (DX / GLBenchmark) 2.7 - GFXBench T-Rex HD Offscreen C24Z16
47.1 fps (0%)
GFXBench T-Rex HD Offscreen C24Z16 + AMD Radeon R2 (Mullins/Beema/Carrizo-L)
min: 29     avg: 36     median: 36 (0%)     max: 43 fps
GFXBench T-Rex HD Offscreen C24Z16 + Intel HD Graphics (Haswell)
53.5 fps (0%)
LuxMark v2.0 64Bit - LuxMark v2.0 Room GPU
86 Samples/s (0%)
min: 37     avg: 51     median: 51 (0%)     max: 65 Samples/s
min: 77     avg: 93     median: 93 (0%)     max: 109 Samples/s
LuxMark v2.0 64Bit - LuxMark v2.0 Sala GPU
182 Samples/s (0%)
min: 71     avg: 89     median: 89 (0%)     max: 107 Samples/s
min: 115     avg: 140     median: 140 (0%)     max: 165 Samples/s
ComputeMark v2.1 - ComputeMark v2.1 Result
374 Points (0%)
min: 254     avg: 340.5     median: 340.5 (0%)     max: 427 Points
min: 355     avg: 370     median: 370 (0%)     max: 385 Points
Power Consumption - Furmark Stress Test Power Consumption - external Monitor *
43.7 Watt (6%)
Power Consumption - The Witcher 3 Power Consumption - external Monitor *
30.5 Watt (4%)

Average Benchmarks Intel HD Graphics (Broadwell) → 100% n=20

Average Benchmarks AMD Radeon R2 (Mullins/Beema/Carrizo-L) → 65% n=20

Average Benchmarks Intel HD Graphics (Haswell) → 88% n=20

- Range of benchmark values for this graphics card
red legend - Average benchmark values for this graphics card
* Smaller numbers mean a higher performance
1 This benchmark is not used for the average calculation

Game Benchmarks

The following benchmarks stem from our benchmarks of review laptops. The performance depends on the used graphics memory, clock rate, processor, system settings, drivers, and operating systems. So the results don't have to be representative for all laptops with this GPU. For detailed information on the benchmark results, click on the fps number.

low 1280x720
HD Graphics (Haswell):
0 (!)  fps
Hitman 2

Hitman 2

2018
low 1280x720
HD Graphics (Haswell):
4.9 (!)  fps
low 1280x720
HD Graphics (Haswell):
14.3  fps
med. 1920x1080
HD Graphics (Haswell):
8  fps
low 1280x720
HD Graphics (Haswell):
5.9  fps
F1 2017

F1 2017

2017
low 1280x720
HD Graphics (Haswell):
13  fps
low 1280x720
HD Graphics (Haswell):
62  fps
med. 1366x768
HD Graphics (Haswell):
28.6  fps
Dirt 4

Dirt 4

2017
low 1280x720
HD Graphics (Haswell):
16.4  fps
low 1280x720
HD Graphics (Haswell):
45.1  fps
med. 1920x1080
HD Graphics (Haswell):
15.9  fps
low 1280x720
HD Graphics (Haswell):
0 (!)  fps
low 1280x720
HD Graphics (Haswell):
17.8  fps
low 1280x720
HD Graphics (Haswell):
38.6  fps
med. 1366x768
HD Graphics (Haswell):
21.6  fps
high 1920x1080
HD Graphics (Haswell):
6.3  fps
low 1280x720
HD Graphics (Haswell):
14.1  fps
low 1280x720
HD Graphics (Haswell):
12.4  fps
med. 1366x768
HD Graphics (Haswell):
7.1  fps
Overwatch

Overwatch

2016
low 1280x720
HD Graphics (Haswell):
26.1  fps
med. 1366x768
HD Graphics (Haswell):
16.3  fps
Doom

Doom

2016
low 1280x720
HD Graphics (Haswell):
0 (!)  fps
low 1280x720
HD Graphics (Haswell):
6  fps
low 1280x720
HD Graphics (Haswell):
8.5  fps
low 1280x720
HD Graphics (Haswell):
9  fps
low 1024x768
HD Graphics (Haswell):
9.4  fps
med. 1366x768
HD Graphics (Haswell):
5.3  fps
high 1920x1080
HD Graphics (Haswell):
2.5  fps
ultra 1920x1080
HD Graphics (Haswell):
1.8  fps
low 1024x768
HD Graphics (Haswell):
13.7  fps
med. 1366x768
HD Graphics (Haswell):
8.9  fps
low 1024x768
HD Graphics (Haswell):
11.7  fps
low 1024x768
100%
HD Graphics (Broadwell):
15.3  fps
0%
HD Graphics (Haswell):
0 (!)  fps
med. 1366x768
100%
HD Graphics (Broadwell):
8.5  fps
FIFA 16

FIFA 16

2015
low 1280x720
100%
HD Graphics (Broadwell):
38.1  fps
59%
Radeon R2 (Mullins/Beema/Carrizo-L):
22.6  fps
high 1366x768
100%
HD Graphics (Broadwell):
20.6  fps
72%
Radeon R2 (Mullins/Beema/Carrizo-L):
14.8  fps
low 1366x768
100%
HD Graphics (Broadwell):
29  fps
96%
Radeon R2 (Mullins/Beema/Carrizo-L):
27.7  fps
143%
HD Graphics (Haswell):
41.4  fps
med. 1366x768
100%
HD Graphics (Broadwell):
20.8  fps
90%
Radeon R2 (Mullins/Beema/Carrizo-L):
18.8  fps
116%
HD Graphics (Haswell):
24.1  fps
high 1920x1080
HD Graphics (Haswell):
11.4  fps
low 1024x768
HD Graphics (Haswell):
8.9  fps
med. 1366x768
HD Graphics (Haswell):
5.2 5.8 ~ 6 fps
high 1920x1080
HD Graphics (Haswell):
3.1  fps
low 1024x768
100%
HD Graphics (Broadwell):
50  fps
97%
Radeon R2 (Mullins/Beema/Carrizo-L):
48.4  fps
105%
HD Graphics (Haswell):
52.4  fps
med. 1366x768
100%
HD Graphics (Broadwell):
13.5  fps
111%
Radeon R2 (Mullins/Beema/Carrizo-L):
15  fps
95%
HD Graphics (Haswell):
12.8  fps
low 1024x768
100%
HD Graphics (Broadwell):
23.9  fps
94%
Radeon R2 (Mullins/Beema/Carrizo-L):
22.4  fps
67%
HD Graphics (Haswell):
15.9  fps
med. 1366x768
100%
HD Graphics (Broadwell):
16.4  fps
95%
Radeon R2 (Mullins/Beema/Carrizo-L):
15.6  fps
68%
HD Graphics (Haswell):
11.2  fps
Evolve

Evolve

2015
low 1024x768
HD Graphics (Haswell):
7.7  fps
med. 1366x768
HD Graphics (Haswell):
5.7  fps
The Crew

The Crew

2014
low 1280x720
HD Graphics (Haswell):
9.7  fps
med. 1366x768
HD Graphics (Haswell):
8.4  fps
low 1024x768
100%
HD Graphics (Broadwell):
13.9  fps
78%
HD Graphics (Haswell):
10.9  fps
med. 1366x768
100%
HD Graphics (Broadwell):
9.4  fps
74%
HD Graphics (Haswell):
7  fps
F1 2014

F1 2014

2014
low 1024x768
100%
HD Graphics (Broadwell):
34  fps
109%
Radeon R2 (Mullins/Beema/Carrizo-L):
37  fps
91%
HD Graphics (Haswell):
31  fps
med. 1366x768
100%
HD Graphics (Broadwell):
24  fps
108%
Radeon R2 (Mullins/Beema/Carrizo-L):
26  fps
83%
HD Graphics (Haswell):
20  fps
low 1024x768
HD Graphics (Haswell):
9  fps
med. 1366x768
HD Graphics (Haswell):
5.8  fps
low 1024x768
HD Graphics (Haswell):
21.6  fps
med. 1366x768
HD Graphics (Haswell):
12.9  fps
low 1280x720
HD Graphics (Haswell):
13.5  fps
med. 1344x756
HD Graphics (Haswell):
8.3  fps
Fifa 15

Fifa 15

2014
low 1280x720
HD Graphics (Haswell):
16.4  fps
high 1366x768
HD Graphics (Haswell):
11.3  fps
Sims 4

Sims 4

2014
low 1024x768
100%
HD Graphics (Broadwell):
113.6  fps
69%
Radeon R2 (Mullins/Beema/Carrizo-L):
78.7  fps
109%
HD Graphics (Haswell):
123.6  fps
med. 1366x768
100%
HD Graphics (Broadwell):
26.3  fps
90%
Radeon R2 (Mullins/Beema/Carrizo-L):
23.7  fps
100%
HD Graphics (Haswell):
26.2  fps
low 1024x768
HD Graphics (Haswell):
13.3  fps
med. 1366x768
HD Graphics (Haswell):
9.7  fps
low 1024x768
100%
HD Graphics (Broadwell):
57.6  fps
59%
Radeon R2 (Mullins/Beema/Carrizo-L):
12.5 55.9 ~ 34 fps
101%
HD Graphics (Haswell):
58.2  fps
med. 1366x768
100%
HD Graphics (Broadwell):
22.6  fps
104%
Radeon R2 (Mullins/Beema/Carrizo-L):
23.5  fps
87%
HD Graphics (Haswell):
19.6  fps
low 1024x768
HD Graphics (Haswell):
2.2  fps
low 1280x720
HD Graphics (Haswell):
19.9  fps
med. 1280x720
HD Graphics (Haswell):
14  fps
low 1024x768
HD Graphics (Haswell):
35.2  fps
med. 1366x768
HD Graphics (Haswell):
13.6  fps
high 1366x768
HD Graphics (Haswell):
9  fps
Titanfall

Titanfall

2014
low 1024x768
HD Graphics (Haswell):
23.1  fps
med. 1366x768
HD Graphics (Haswell):
13.7  fps
Thief

Thief

2014
low 1024x768
HD Graphics (Haswell):
10.1  fps
med. 1366x768
HD Graphics (Haswell):
5.7  fps
low 1024x768
HD Graphics (Haswell):
22.1  fps
med. 1366x768
HD Graphics (Haswell):
13  fps
low 1024x768
HD Graphics (Haswell):
11.1  fps
low 1024x768
HD Graphics (Haswell):
12.8 27.8 ~ 20 fps
med. 1366x768
HD Graphics (Haswell):
10 18.2 ~ 14 fps
high 1366x768
HD Graphics (Haswell):
11.8  fps
ultra 1920x1080
HD Graphics (Haswell):
3.9  fps
low 1024x768
HD Graphics (Haswell):
21  fps
med. 1366x768
HD Graphics (Haswell):
12  fps
F1 2013

F1 2013

2013
low 1024x768
HD Graphics (Haswell):
27  fps
med. 1366x768
HD Graphics (Haswell):
18  fps
high 1366x768
HD Graphics (Haswell):
14  fps
Fifa 14

Fifa 14

2013
med. 1366x768
HD Graphics (Haswell):
57.7  fps
high 1366x768
HD Graphics (Haswell):
37  fps
low 1024x768
HD Graphics (Haswell):
22.4  fps
med. 1366x768
HD Graphics (Haswell):
16.9  fps
low 1280x720
HD Graphics (Haswell):
14  fps
med. 1366x768
HD Graphics (Haswell):
7.8  fps
low 1024x768
HD Graphics (Haswell):
15.9  fps
med. 1366x768
HD Graphics (Haswell):
8.9  fps
low 1024x768
HD Graphics (Haswell):
14.2  fps
med. 1366x768
HD Graphics (Haswell):
11.5  fps
Dota 2

Dota 2

2013
low 1024x768
HD Graphics (Haswell):
36.9  fps
med. 1366x768
HD Graphics (Haswell):
24.2  fps
low 1024x768
HD Graphics (Haswell):
7.2  fps
GRID 2

GRID 2

2013
low 1024x768
HD Graphics (Haswell):
38 38.5 ~ 38 fps
med. 1366x768
HD Graphics (Haswell):
18.6 19.6 ~ 19 fps
high 1366x768
HD Graphics (Haswell):
13.2  fps
low 1024x768
100%
HD Graphics (Broadwell):
13.7  fps
82%
HD Graphics (Haswell):
11.2  fps
med. 1366x768
100%
HD Graphics (Broadwell):
10.7  fps
high 1366x768
100%
HD Graphics (Broadwell):
7  fps
low 1280x720
100%
HD Graphics (Broadwell):
25.3  fps
71%
Radeon R2 (Mullins/Beema/Carrizo-L):
16.9 19 ~ 18 fps
111%
HD Graphics (Haswell):
23 32.8 ~ 28 fps
med. 1366x768
100%
HD Graphics (Broadwell):
14.1  fps
71%
Radeon R2 (Mullins/Beema/Carrizo-L):
9.6 10.1 ~ 10 fps
85%
HD Graphics (Haswell):
10.3 14.2 ~ 12 fps
high 1366x768
100%
HD Graphics (Broadwell):
11.7  fps
76%
Radeon R2 (Mullins/Beema/Carrizo-L):
8.9  fps
102%
HD Graphics (Haswell):
11.9  fps
ultra 1920x1080
HD Graphics (Haswell):
3.7  fps
low 1024x768
HD Graphics (Haswell):
96.5  fps
med. 1366x768
HD Graphics (Haswell):
28.3  fps
high 1366x768
HD Graphics (Haswell):
15  fps
SimCity

SimCity

2013
low 1024x768
HD Graphics (Haswell):
59.6  fps
med. 1366x768
HD Graphics (Haswell):
11.2  fps
low 1024x768
100%
HD Graphics (Broadwell):
34.7  fps
69%
Radeon R2 (Mullins/Beema/Carrizo-L):
17.1 30.8 ~ 24 fps
86%
HD Graphics (Haswell):
28.9 30.2 30.3 30.3 31.8 ~ 30 fps
med. 1366x768
100%
HD Graphics (Broadwell):
17.7  fps
73%
Radeon R2 (Mullins/Beema/Carrizo-L):
9.8 16.2 ~ 13 fps
79%
HD Graphics (Haswell):
13.8 14.2 14.3 14.3 14.6 ~ 14 fps
high 1366x768
100%
HD Graphics (Broadwell):
11.7  fps
104%
Radeon R2 (Mullins/Beema/Carrizo-L):
12.2  fps
68%
HD Graphics (Haswell):
8.1 8.2 8.2 8.4 ~ 8 fps
Crysis 3

Crysis 3

2013
low 1024x768
HD Graphics (Haswell):
12.2  fps
med. 1366x768
HD Graphics (Haswell):
7.6  fps
low 1024x768
HD Graphics (Haswell):
38.7  fps
med. 1366x768
HD Graphics (Haswell):
17.7  fps
high 1366x768
HD Graphics (Haswell):
13.1  fps
Far Cry 3

Far Cry 3

2012
low 1024x768
HD Graphics (Haswell):
18.7  fps
med. 1366x768
HD Graphics (Haswell):
11.4  fps
low 1024x768
100%
HD Graphics (Broadwell):
15.6  fps
79%
HD Graphics (Haswell):
12.3  fps
med. 1366x768
100%
HD Graphics (Broadwell):
11.4  fps
87%
HD Graphics (Haswell):
9.9  fps
high 1366x768
100%
HD Graphics (Broadwell):
5.3  fps
low 1024x768
HD Graphics (Haswell):
25.6  fps
med. 1366x768
HD Graphics (Haswell):
17.6  fps
low 1024x768
HD Graphics (Haswell):
22.3  fps
med. 1366x768
HD Graphics (Haswell):
16.8  fps
low 1024x768
100%
HD Graphics (Broadwell):
43.7  fps
100%
Radeon R2 (Mullins/Beema/Carrizo-L):
43.6  fps
106%
HD Graphics (Haswell):
46.2  fps
med. 1366x768
100%
HD Graphics (Broadwell):
31.5  fps
110%
Radeon R2 (Mullins/Beema/Carrizo-L):
34.5  fps
110%
HD Graphics (Haswell):
34.7  fps
high 1366x768
100%
HD Graphics (Broadwell):
23.9  fps
94%
HD Graphics (Haswell):
22.5  fps
low 1024x768
HD Graphics (Haswell):
31  fps
med. 1366x768
HD Graphics (Haswell):
18.8  fps
high 1366x768
HD Graphics (Haswell):
11.7  fps
low 1024x768
100%
HD Graphics (Broadwell):
38.4  fps
59%
Radeon R2 (Mullins/Beema/Carrizo-L):
22.5  fps
96%
HD Graphics (Haswell):
36.9  fps
med. 1366x768
100%
HD Graphics (Broadwell):
24.9  fps
92%
HD Graphics (Haswell):
23  fps
high 1366x768
100%
HD Graphics (Broadwell):
19.7  fps
99%
HD Graphics (Haswell):
19.5  fps
low 1024x768
HD Graphics (Haswell):
12.5  fps
Anno 2070

Anno 2070

2011
low 1024x768
Radeon R2 (Mullins/Beema/Carrizo-L):
25.2  fps
HD Graphics (Haswell):
36  fps
med. 1366x768
Radeon R2 (Mullins/Beema/Carrizo-L):
11.9  fps
HD Graphics (Haswell):
16  fps
high 1366x768
HD Graphics (Haswell):
9.8  fps
low 1280x720
HD Graphics (Haswell):
21.7 22.2 ~ 22 fps
med. 1366x768
HD Graphics (Haswell):
11.2 11.3 ~ 11 fps
high 1366x768
HD Graphics (Haswell):
6.8  fps
low 1024x768
HD Graphics (Haswell):
36.8  fps
high 1366x768
HD Graphics (Haswell):
16.7  fps
Dirt 3

Dirt 3

2011
low 800x600
HD Graphics (Haswell):
51.9  fps
med. 1024x768
HD Graphics (Haswell):
27.4  fps
high 1360x768
HD Graphics (Haswell):
14.8  fps
Total War: Shogun 2

Total War: Shogun 2

2011
low 1024x768
HD Graphics (Haswell):
49.2  fps
low 1024x768
Radeon R2 (Mullins/Beema/Carrizo-L):
27.1  fps
med. 1360x768
Radeon R2 (Mullins/Beema/Carrizo-L):
12.4  fps
low 1024x768
HD Graphics (Haswell):
28  fps
med. 1366x768
HD Graphics (Haswell):
21.2  fps
Resident Evil 5

Resident Evil 5

2009
low 800x600
HD Graphics (Haswell):
42.6  fps
high 1360x768
HD Graphics (Haswell):
17.8  fps
Trackmania Nations Forever

Trackmania Nations Forever

2008
low 640x480
HD Graphics (Haswell):
113  fps
high 1024x768
HD Graphics (Haswell):
45.1  fps
World of Warcraft

World of Warcraft

2005
low 800x600
Radeon R2 (Mullins/Beema/Carrizo-L):
30.6  fps
HD Graphics (Haswell):
93.7  fps
med. 1024x768
Radeon R2 (Mullins/Beema/Carrizo-L):
27.8  fps
HD Graphics (Haswell):
39.2  fps
high 1280x1024
Radeon R2 (Mullins/Beema/Carrizo-L):
7  fps

Average Gaming Intel HD Graphics (Broadwell) → 100%

Average Gaming 30-70 fps → 100%

Average Gaming AMD Radeon R2 (Mullins/Beema/Carrizo-L) → 86%

Average Gaming 30-70 fps → 95%

Average Gaming Intel HD Graphics (Haswell) → 90%

Average Gaming 30-70 fps → 107%

Intel HD Graphics (Broadwell)AMD Radeon R2 (Mullins/Beema/Carrizo-L)Intel HD Graphics (Haswell)
lowmed.highultraQHD4Klowmed.highultraQHD4Klowmed.highultraQHD4K
Fallout 76
Hitman 24.9
X-Plane 11.1114.38
Ark Survival Evolved5.9
F1 201713
Team Fortress 26228.6
Dirt 416.4
Rocket League45.115.9
Mass Effect Andromeda
Resident Evil 717.8
Farming Simulator 1738.621.66.3
Battlefield 114.1
Mirror's Edge Catalyst12.47.1
Overwatch26.116.3
Doom
Hitman 20166
The Division8.5
Far Cry Primal9
Rise of the Tomb Raider9.45.32.51.8
Rainbow Six Siege13.78.9
Just Cause 311.7
Star Wars Battlefront15.38.50
World of Warships2920.827.718.841.424.111.4
The Witcher 38.963.1
Dirt Rally5013.548.41552.412.8
Battlefield Hardline23.916.422.415.615.911.2
Evolve7.75.7
The Crew9.78.4
Dragon Age: Inquisition13.99.410.97
F1 2014342437263120
Ryse: Son of Rome95.8
Alien: Isolation21.612.9
Middle-earth: Shadow of Mordor13.58.3
Fifa 1516.411.3
Sims 4113.626.378.723.7123.626.2
Risen 3: Titan Lords13.39.7
GRID: Autosport57.622.63423.558.219.6
Watch Dogs2.2
Wolfenstein: The New Order19.914
The Elder Scrolls Online35.213.69
Titanfall23.113.7
Thief10.15.7
X-Plane 10.2522.113
Need for Speed: Rivals11.1
Battlefield 4201411.83.9
Batman: Arkham Origins2112
F1 2013271814
Fifa 1457.737
Total War: Rome II22.416.9
Saints Row IV147.8
The Bureau: XCOM Declassified15.98.9
Splinter Cell: Blacklist14.211.5
Dota 236.924.2
Company of Heroes 27.2
GRID 2381913.2
Metro: Last Light13.710.7711.2
BioShock Infinite25.314.111.718108.9281211.93.7
StarCraft II: Heart of the Swarm96.528.315
SimCity59.611.2
Tomb Raider34.717.711.7241312.230148
Crysis 312.27.6
Dead Space 338.717.713.1
Far Cry 318.711.4
Hitman: Absolution15.611.45.312.39.9
Call of Duty: Black Ops 225.617.6
Dishonored22.316.8
Counter-Strike: GO43.731.523.943.634.546.234.722.5
Dirt Showdown3118.811.7
Diablo III38.424.919.722.536.92319.5
Risen 2: Dark Waters12.5
Anno 207025.211.936169.8
The Elder Scrolls V: Skyrim22116.8
Deus Ex Human Revolution36.816.7
Dirt 351.927.414.8
Total War: Shogun 249.2
Battlefield: Bad Company 22821.2
Resident Evil 542.617.8
Trackmania Nations Forever11345.1
World of Warcraft30.627.8793.739.2
Intel HD Graphics (Broadwell)AMD Radeon R2 (Mullins/Beema/Carrizo-L)Intel HD Graphics (Haswell)
lowmed.highultraQHD4Klowmed.highultraQHD4Klowmed.highultraQHD4K
< 30 fps
< 60 fps
< 120 fps
≥ 120 fps
7
6
1
13
1

6


< 30 fps
< 60 fps
< 120 fps
≥ 120 fps
6
5
1
10
1

3


< 30 fps
< 60 fps
< 120 fps
≥ 120 fps
49
20
4
1
52
3

21
2

3


For more games that might be playable and a list of all games and graphics cards visit our Gaming List

v1.33
log 25. 07:31:39

#0 ran 0s before starting gpusingle class +0s ... 0s

#1 checking url part for id 5979 +0s ... 0s

#2 checking url part for id 5498 +0s ... 0s

#3 checking url part for id 4622 +0s ... 0s

#4 redirected to Ajax server, took 1756099899s time from redirect:0 +0s ... 0s

#5 did not recreate cache, as it is less than 5 days old! Created at Mon, 25 Aug 2025 05:18:48 +0200 +0s ... 0s

#6 composed specs +0.023s ... 0.024s

#7 did output specs +0s ... 0.024s

#8 start showIntegratedCPUs +0s ... 0.024s

#9 getting avg benchmarks for device 5979 +0.025s ... 0.049s

#10 got single benchmarks 5979 +0.006s ... 0.055s

#11 getting avg benchmarks for device 5498 +0.003s ... 0.058s

#12 got single benchmarks 5498 +0.006s ... 0.065s

#13 getting avg benchmarks for device 4622 +0.003s ... 0.068s

#14 got single benchmarks 4622 +0.011s ... 0.079s

#15 got avg benchmarks for devices +0s ... 0.079s

#16 min, max, avg, median took s +0.027s ... 0.106s

#17 before gaming benchmark output +0s ... 0.106s

#18 Got 250 rows for game benchmarks. +0.007s ... 0.113s

#19 composed SQL query for gamebenchmarks +0s ... 0.113s

#20 got data and put it in $dataArray +0.01s ... 0.122s

#21 benchmarks composed for output. +0.024s ... 0.146s

#22 calculated avg scores. +0s ... 0.146s

#23 return log +0.001s ... 0.147s

Please share our article, every link counts!
Mail Logo
> Expert Reviews and News on Laptops, Smartphones and Tech Innovations > Benchmarks / Tech > Graphics Card Comparison - Head 2 Head
Redaktion, 2017-09- 8 (Update: 2023-07- 1)