

Micron 2450 1TB MTFDKBA1T0TFK vs Samsung PM9A1 MZVL2512HCJQ
Micron 2450 1TB MTFDKBA1T0TFK
► remove from comparison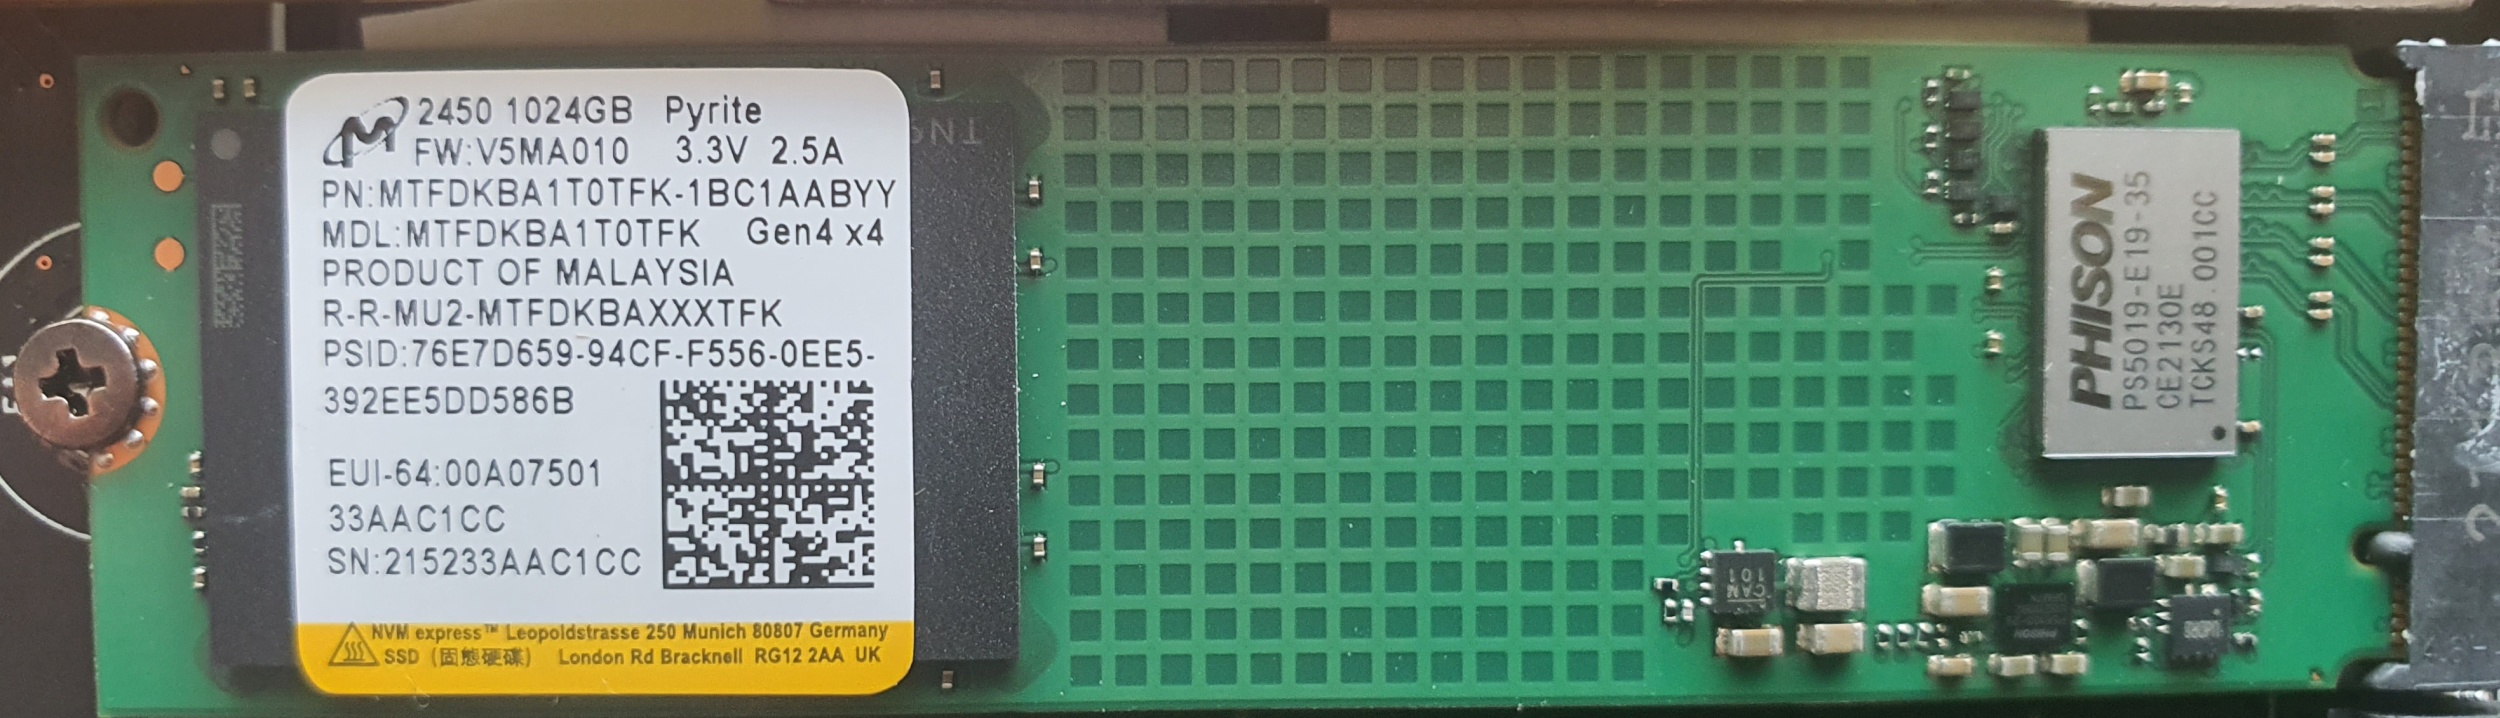
The Micron 2450 1TB (MTFDKBA1T0TFK) is a fast M.2 2280 SSD using the NVMe 1.3 protocol. The Micron 2450 SSD is built with Micron 176-layer NAND and rated at 3mW sleep power state and less than 400mW in active idle power state. It uses a Phison PS5019-E19-35 controller.
Samsung PM9A1 MZVL2512HCJQ
► remove from comparison
The Samsung OEM Client SSD PM9A1 512GB, M.2 (MZVL2512HCJQ-00B00, OEM version of the 980 Pro) is a fast M.2 2280 SSD which supports PCIe 4.0 x4. It uses the Samsung Elpis (S4LV003) Controller with 8 channels and 512 MB LPDDR4. The memory modules are from Samsung (3D-NAND TLC 136 layers). The 512 GB version is specified 6900 MB/s read and 6000 MB/s write (max. SLC cached). The power consumption is specified at 0.005 W (sleep) and 0.035W (idle).
| Micron 2450 1TB MTFDKBA1T0TFK | Samsung PM9A1 MZVL2512HCJQ | |
| Type | SSD | SSD |
| Size | M.2 2280 | M.2 2280 |
| Capacity | 1024 GB | 512 GB |
| Interface | M.2 | NVMe |
| Announced | 24.02.2022 | 26.02.2021 |
Benchmarks
| Model | CPU | GPU | RAM | Value |
|---|---|---|---|---|
| Acer Swift 3 SF314-71-56U3 | i5-12500H 80 W / 35 W | Iris Xe G7 80EUs 1.300 / 3.200 MHz | 16 GB | 932.62 |
| Acer Aspire Vero AV14-51-72DL | i7-1255U 55 W / 30 W | Iris Xe G7 96EUs 1250 / 2133 MHz | 16 GB | 1008.26 |
| MSI Katana GF66 12UGS | i7-12700H 100 W / 38 W | GeForce RTX 3070 Ti Laptop GPU 105 W 1035 / 1500 MHz 8 GB | 16 GB | 1102.79 |
| MSI Crosshair 15 R6E B12UGZ-050 | i7-12700H 121 W / 85 W | GeForce RTX 3070 Laptop GPU 140 W 1610 MHz 8 GB | 16 GB | 1270.51 |
| MSI Vector GP76 12UGS-434 | i7-12700H 65 W / 45 W | GeForce RTX 3070 Ti Laptop GPU 150 W 1585 / 1750 MHz 8 GB | 16 GB | 1299 |
| Acer Aspire 5 A515-58GM-76S8 | i7-1355U 55 W / 28 W | GeForce RTX 2050 Mobile 35 W 1155 / 1500 MHz 4 GB | 16 GB | 2150.78 |
| Model | CPU | GPU | RAM | Value |
|---|---|---|---|---|
| MSI Vector GP76 12UGS-434 | i7-12700H 65 W / 45 W | GeForce RTX 3070 Ti Laptop GPU 150 W 1585 / 1750 MHz 8 GB | 16 GB | 419 |
| MSI Katana GF66 12UGS | i7-12700H 100 W / 38 W | GeForce RTX 3070 Ti Laptop GPU 105 W 1035 / 1500 MHz 8 GB | 16 GB | 447.55 |
| MSI Crosshair 15 R6E B12UGZ-050 | i7-12700H 121 W / 85 W | GeForce RTX 3070 Laptop GPU 140 W 1610 MHz 8 GB | 16 GB | 453.12 |
| Acer Aspire Vero AV14-51-72DL | i7-1255U 55 W / 30 W | Iris Xe G7 96EUs 1250 / 2133 MHz | 16 GB | 588.48 |
| Acer Swift 3 SF314-71-56U3 | i5-12500H 80 W / 35 W | Iris Xe G7 80EUs 1.300 / 3.200 MHz | 16 GB | 726.47 |
| Acer Aspire 5 A515-58GM-76S8 | i7-1355U 55 W / 28 W | GeForce RTX 2050 Mobile 35 W 1155 / 1500 MHz 4 GB | 16 GB | 1028.01 |
| Model | CPU | GPU | RAM | Value |
|---|---|---|---|---|
| MSI Katana GF66 12UGS | i7-12700H 100 W / 38 W | GeForce RTX 3070 Ti Laptop GPU 105 W 1035 / 1500 MHz 8 GB | 16 GB | 282.68 |
| Acer Swift 3 SF314-71-56U3 | i5-12500H 80 W / 35 W | Iris Xe G7 80EUs 1.300 / 3.200 MHz | 16 GB | 1238.84 |
| MSI Vector GP76 12UGS-434 | i7-12700H 65 W / 45 W | GeForce RTX 3070 Ti Laptop GPU 150 W 1585 / 1750 MHz 8 GB | 16 GB | 1799 |
| Acer Aspire Vero AV14-51-72DL | i7-1255U 55 W / 30 W | Iris Xe G7 96EUs 1250 / 2133 MHz | 16 GB | 1835.85 |
| MSI Crosshair 15 R6E B12UGZ-050 | i7-12700H 121 W / 85 W | GeForce RTX 3070 Laptop GPU 140 W 1610 MHz 8 GB | 16 GB | 2056.4 |
| Acer Aspire 5 A515-58GM-76S8 | i7-1355U 55 W / 28 W | GeForce RTX 2050 Mobile 35 W 1155 / 1500 MHz 4 GB | 16 GB | 3028.09 |
| Model | CPU | GPU | RAM | Value |
|---|---|---|---|---|
| Asus ZenBook 14X UX3404VC | i9-13900H 115 W / 45 W | Iris Xe G7 96EUs | 16 GB | 4782 |
| Acer Swift 3 SF314-71-56U3 | i5-12500H 80 W / 35 W | Iris Xe G7 80EUs 1.300 / 3.200 MHz | 16 GB | 5089 |
| Acer Aspire Vero AV14-51-72DL | i7-1255U 55 W / 30 W | Iris Xe G7 96EUs 1250 / 2133 MHz | 16 GB | 6295 |
| Acer Aspire 5 A515-58GM-76S8 | i7-1355U 55 W / 28 W | GeForce RTX 2050 Mobile 35 W 1155 / 1500 MHz 4 GB | 16 GB | 6893 |
| Asus ROG Zephyrus G14 GA402RJ | R7 6800HS 125 W / 100 W | Radeon RX 6700S 105 W 2210 / 1750 MHz 8 GB | 16 GB | 7311 |
| MSI Katana GF66 12UGS | i7-12700H 100 W / 38 W | GeForce RTX 3070 Ti Laptop GPU 105 W 1035 / 1500 MHz 8 GB | 16 GB | 7793 |
| MSI Vector GP76 12UGS-434 | i7-12700H 65 W / 45 W | GeForce RTX 3070 Ti Laptop GPU 150 W 1585 / 1750 MHz 8 GB | 16 GB | 7830 |
| MSI Crosshair 15 R6E B12UGZ-050 | i7-12700H 121 W / 85 W | GeForce RTX 3070 Laptop GPU 140 W 1610 MHz 8 GB | 16 GB | 7839 |
| Model | CPU | GPU | RAM | Value |
|---|---|---|---|---|
| Acer Swift 3 SF314-71-56U3 | i5-12500H 80 W / 35 W | Iris Xe G7 80EUs 1.300 / 3.200 MHz | 16 GB | 2045 |
| Acer Aspire Vero AV14-51-72DL | i7-1255U 55 W / 30 W | Iris Xe G7 96EUs 1250 / 2133 MHz | 16 GB | 2404 |
| Acer Aspire 5 A515-58GM-76S8 | i7-1355U 55 W / 28 W | GeForce RTX 2050 Mobile 35 W 1155 / 1500 MHz 4 GB | 16 GB | 2821 |
| Asus ZenBook 14X UX3404VC | i9-13900H 115 W / 45 W | Iris Xe G7 96EUs | 16 GB | 2989 |
| Asus ROG Zephyrus G14 GA402RJ | R7 6800HS 125 W / 100 W | Radeon RX 6700S 105 W 2210 / 1750 MHz 8 GB | 16 GB | 3248 |
| MSI Vector GP76 12UGS-434 | i7-12700H 65 W / 45 W | GeForce RTX 3070 Ti Laptop GPU 150 W 1585 / 1750 MHz 8 GB | 16 GB | 3636 |
| MSI Katana GF66 12UGS | i7-12700H 100 W / 38 W | GeForce RTX 3070 Ti Laptop GPU 105 W 1035 / 1500 MHz 8 GB | 16 GB | 3640 |
| MSI Crosshair 15 R6E B12UGZ-050 | i7-12700H 121 W / 85 W | GeForce RTX 3070 Laptop GPU 140 W 1610 MHz 8 GB | 16 GB | 3685 |
| Model | CPU | GPU | RAM | Value |
|---|---|---|---|---|
| Asus ZenBook 14X UX3404VC | i9-13900H 115 W / 45 W | Iris Xe G7 96EUs | 16 GB | 1203 |
| Acer Swift 3 SF314-71-56U3 | i5-12500H 80 W / 35 W | Iris Xe G7 80EUs 1.300 / 3.200 MHz | 16 GB | 2030 |
| Acer Aspire Vero AV14-51-72DL | i7-1255U 55 W / 30 W | Iris Xe G7 96EUs 1250 / 2133 MHz | 16 GB | 2565 |
| Acer Aspire 5 A515-58GM-76S8 | i7-1355U 55 W / 28 W | GeForce RTX 2050 Mobile 35 W 1155 / 1500 MHz 4 GB | 16 GB | 2685 |
| Asus ROG Zephyrus G14 GA402RJ | R7 6800HS 125 W / 100 W | Radeon RX 6700S 105 W 2210 / 1750 MHz 8 GB | 16 GB | 2687 |
| MSI Crosshair 15 R6E B12UGZ-050 | i7-12700H 121 W / 85 W | GeForce RTX 3070 Laptop GPU 140 W 1610 MHz 8 GB | 16 GB | 2740 |
| MSI Katana GF66 12UGS | i7-12700H 100 W / 38 W | GeForce RTX 3070 Ti Laptop GPU 105 W 1035 / 1500 MHz 8 GB | 16 GB | 2741 |
| MSI Vector GP76 12UGS-434 | i7-12700H 65 W / 45 W | GeForce RTX 3070 Ti Laptop GPU 150 W 1585 / 1750 MHz 8 GB | 16 GB | 2766 |
| Model | CPU | GPU | RAM | Value |
|---|---|---|---|---|
| Asus ZenBook 14X UX3404VC | i9-13900H 115 W / 45 W | Iris Xe G7 96EUs | 16 GB | 0.131 |
| MSI Vector GP76 12UGS-434 | i7-12700H 65 W / 45 W | GeForce RTX 3070 Ti Laptop GPU 150 W 1585 / 1750 MHz 8 GB | 16 GB | 0.169 |
| Asus ROG Zephyrus G14 GA402RJ | R7 6800HS 125 W / 100 W | Radeon RX 6700S 105 W 2210 / 1750 MHz 8 GB | 16 GB | 0.169 |
| MSI Crosshair 15 R6E B12UGZ-050 | i7-12700H 121 W / 85 W | GeForce RTX 3070 Laptop GPU 140 W 1610 MHz 8 GB | 16 GB | 0.17 |
| Acer Swift 3 SF314-71-56U3 | i5-12500H 80 W / 35 W | Iris Xe G7 80EUs 1.300 / 3.200 MHz | 16 GB | 0.172 |
| Acer Aspire Vero AV14-51-72DL | i7-1255U 55 W / 30 W | Iris Xe G7 96EUs 1250 / 2133 MHz | 16 GB | 0.173 |
| Acer Aspire 5 A515-58GM-76S8 | i7-1355U 55 W / 28 W | GeForce RTX 2050 Mobile 35 W 1155 / 1500 MHz 4 GB | 16 GB | 0.175 |
| MSI Katana GF66 12UGS | i7-12700H 100 W / 38 W | GeForce RTX 3070 Ti Laptop GPU 105 W 1035 / 1500 MHz 8 GB | 16 GB | 0.18 |
| Model | CPU | GPU | RAM | Value |
|---|---|---|---|---|
| MSI Vector GP76 12UGS-434 | i7-12700H 65 W / 45 W | GeForce RTX 3070 Ti Laptop GPU 150 W 1585 / 1750 MHz 8 GB | 16 GB | 0.027 |
| Acer Aspire 5 A515-58GM-76S8 | i7-1355U 55 W / 28 W | GeForce RTX 2050 Mobile 35 W 1155 / 1500 MHz 4 GB | 16 GB | 0.031 |
| MSI Crosshair 15 R6E B12UGZ-050 | i7-12700H 121 W / 85 W | GeForce RTX 3070 Laptop GPU 140 W 1610 MHz 8 GB | 16 GB | 0.032 |
| Acer Aspire Vero AV14-51-72DL | i7-1255U 55 W / 30 W | Iris Xe G7 96EUs 1250 / 2133 MHz | 16 GB | 0.047 |
| Acer Swift 3 SF314-71-56U3 | i5-12500H 80 W / 35 W | Iris Xe G7 80EUs 1.300 / 3.200 MHz | 16 GB | 0.053 |
| MSI Katana GF66 12UGS | i7-12700H 100 W / 38 W | GeForce RTX 3070 Ti Laptop GPU 105 W 1035 / 1500 MHz 8 GB | 16 GB | 0.07 |
| Asus ROG Zephyrus G14 GA402RJ | R7 6800HS 125 W / 100 W | Radeon RX 6700S 105 W 2210 / 1750 MHz 8 GB | 16 GB | 0.075 |
| Asus ZenBook 14X UX3404VC | i9-13900H 115 W / 45 W | Iris Xe G7 96EUs | 16 GB | 0.082 |
| Model | CPU | GPU | RAM | Value |
|---|---|---|---|---|
| Acer Swift 3 SF314-71-56U3 | i5-12500H 80 W / 35 W | Iris Xe G7 80EUs 1.300 / 3.200 MHz | 16 GB | 1582.72 |
| Acer Aspire Vero AV14-51-72DL | i7-1255U 55 W / 30 W | Iris Xe G7 96EUs 1250 / 2133 MHz | 16 GB | 1820.97 |
| Acer Aspire 5 A515-58GM-76S8 | i7-1355U 55 W / 28 W | GeForce RTX 2050 Mobile 35 W 1155 / 1500 MHz 4 GB | 16 GB | 2157.55 |
| Asus ZenBook 14X UX3404VC | i9-13900H 115 W / 45 W | Iris Xe G7 96EUs | 16 GB | 2510 |
| Asus ROG Zephyrus G14 GA402RJ | R7 6800HS 125 W / 100 W | Radeon RX 6700S 105 W 2210 / 1750 MHz 8 GB | 16 GB | 2760.09 |
| MSI Vector GP76 12UGS-434 | i7-12700H 65 W / 45 W | GeForce RTX 3070 Ti Laptop GPU 150 W 1585 / 1750 MHz 8 GB | 16 GB | 2978 |
| MSI Katana GF66 12UGS | i7-12700H 100 W / 38 W | GeForce RTX 3070 Ti Laptop GPU 105 W 1035 / 1500 MHz 8 GB | 16 GB | 2999.99 |
| MSI Crosshair 15 R6E B12UGZ-050 | i7-12700H 121 W / 85 W | GeForce RTX 3070 Laptop GPU 140 W 1610 MHz 8 GB | 16 GB | 3047.68 |
| Model | CPU | GPU | RAM | Value |
|---|---|---|---|---|
| Asus ZenBook 14X UX3404VC | i9-13900H 115 W / 45 W | Iris Xe G7 96EUs | 16 GB | 837 |
| Acer Swift 3 SF314-71-56U3 | i5-12500H 80 W / 35 W | Iris Xe G7 80EUs 1.300 / 3.200 MHz | 16 GB | 1677.78 |
| Acer Aspire Vero AV14-51-72DL | i7-1255U 55 W / 30 W | Iris Xe G7 96EUs 1250 / 2133 MHz | 16 GB | 2163.21 |
| Acer Aspire 5 A515-58GM-76S8 | i7-1355U 55 W / 28 W | GeForce RTX 2050 Mobile 35 W 1155 / 1500 MHz 4 GB | 16 GB | 2277.61 |
| Asus ROG Zephyrus G14 GA402RJ | R7 6800HS 125 W / 100 W | Radeon RX 6700S 105 W 2210 / 1750 MHz 8 GB | 16 GB | 2313.48 |
| MSI Katana GF66 12UGS | i7-12700H 100 W / 38 W | GeForce RTX 3070 Ti Laptop GPU 105 W 1035 / 1500 MHz 8 GB | 16 GB | 2345.25 |
| MSI Vector GP76 12UGS-434 | i7-12700H 65 W / 45 W | GeForce RTX 3070 Ti Laptop GPU 150 W 1585 / 1750 MHz 8 GB | 16 GB | 2355 |
| MSI Crosshair 15 R6E B12UGZ-050 | i7-12700H 121 W / 85 W | GeForce RTX 3070 Laptop GPU 140 W 1610 MHz 8 GB | 16 GB | 2361.44 |
| Model | CPU | GPU | RAM | Value |
|---|---|---|---|---|
| Asus ROG Zephyrus G14 GA402RJ | R7 6800HS 125 W / 100 W | Radeon RX 6700S 105 W 2210 / 1750 MHz 8 GB | 16 GB | 194.83 |
| Acer Swift 3 SF314-71-56U3 | i5-12500H 80 W / 35 W | Iris Xe G7 80EUs 1.300 / 3.200 MHz | 16 GB | 239.27 |
| Asus ZenBook 14X UX3404VC | i9-13900H 115 W / 45 W | Iris Xe G7 96EUs | 16 GB | 256 |
| Acer Aspire Vero AV14-51-72DL | i7-1255U 55 W / 30 W | Iris Xe G7 96EUs 1250 / 2133 MHz | 16 GB | 272.46 |
| MSI Katana GF66 12UGS | i7-12700H 100 W / 38 W | GeForce RTX 3070 Ti Laptop GPU 105 W 1035 / 1500 MHz 8 GB | 16 GB | 339.58 |
| MSI Vector GP76 12UGS-434 | i7-12700H 65 W / 45 W | GeForce RTX 3070 Ti Laptop GPU 150 W 1585 / 1750 MHz 8 GB | 16 GB | 340.52 |
| MSI Crosshair 15 R6E B12UGZ-050 | i7-12700H 121 W / 85 W | GeForce RTX 3070 Laptop GPU 140 W 1610 MHz 8 GB | 16 GB | 343.36 |
| Acer Aspire 5 A515-58GM-76S8 | i7-1355U 55 W / 28 W | GeForce RTX 2050 Mobile 35 W 1155 / 1500 MHz 4 GB | 16 GB | 350.26 |
| Model | CPU | GPU | RAM | Value |
|---|---|---|---|---|
| Asus ZenBook 14X UX3404VC | i9-13900H 115 W / 45 W | Iris Xe G7 96EUs | 16 GB | 60 |
| Acer Swift 3 SF314-71-56U3 | i5-12500H 80 W / 35 W | Iris Xe G7 80EUs 1.300 / 3.200 MHz | 16 GB | 63.05 |
| Asus ROG Zephyrus G14 GA402RJ | R7 6800HS 125 W / 100 W | Radeon RX 6700S 105 W 2210 / 1750 MHz 8 GB | 16 GB | 73.57 |
| MSI Crosshair 15 R6E B12UGZ-050 | i7-12700H 121 W / 85 W | GeForce RTX 3070 Laptop GPU 140 W 1610 MHz 8 GB | 16 GB | 86.87 |
| Acer Aspire Vero AV14-51-72DL | i7-1255U 55 W / 30 W | Iris Xe G7 96EUs 1250 / 2133 MHz | 16 GB | 88.11 |
| MSI Katana GF66 12UGS | i7-12700H 100 W / 38 W | GeForce RTX 3070 Ti Laptop GPU 105 W 1035 / 1500 MHz 8 GB | 16 GB | 89.53 |
| Acer Aspire 5 A515-58GM-76S8 | i7-1355U 55 W / 28 W | GeForce RTX 2050 Mobile 35 W 1155 / 1500 MHz 4 GB | 16 GB | 91.08 |
| MSI Vector GP76 12UGS-434 | i7-12700H 65 W / 45 W | GeForce RTX 3070 Ti Laptop GPU 150 W 1585 / 1750 MHz 8 GB | 16 GB | 91.56 |
| Model | CPU | GPU | RAM | Value |
|---|---|---|---|---|
| Acer Swift 3 SF314-71-56U3 | i5-12500H 80 W / 35 W | Iris Xe G7 80EUs 1.300 / 3.200 MHz | 16 GB | 2232.21 |
| Asus ZenBook 14X UX3404VC | i9-13900H 115 W / 45 W | Iris Xe G7 96EUs | 16 GB | 2233 |
| Asus ROG Zephyrus G14 GA402RJ | R7 6800HS 125 W / 100 W | Radeon RX 6700S 105 W 2210 / 1750 MHz 8 GB | 16 GB | 2927.58 |
| MSI Crosshair 15 R6E B12UGZ-050 | i7-12700H 121 W / 85 W | GeForce RTX 3070 Laptop GPU 140 W 1610 MHz 8 GB | 16 GB | 2937.67 |
| MSI Katana GF66 12UGS | i7-12700H 100 W / 38 W | GeForce RTX 3070 Ti Laptop GPU 105 W 1035 / 1500 MHz 8 GB | 16 GB | 3002.92 |
| Acer Aspire Vero AV14-51-72DL | i7-1255U 55 W / 30 W | Iris Xe G7 96EUs 1250 / 2133 MHz | 16 GB | 3107.83 |
| Acer Aspire 5 A515-58GM-76S8 | i7-1355U 55 W / 28 W | GeForce RTX 2050 Mobile 35 W 1155 / 1500 MHz 4 GB | 16 GB | 3133.52 |
| MSI Vector GP76 12UGS-434 | i7-12700H 65 W / 45 W | GeForce RTX 3070 Ti Laptop GPU 150 W 1585 / 1750 MHz 8 GB | 16 GB | 3173 |
| Model | CPU | GPU | RAM | Value |
|---|---|---|---|---|
| Acer Swift 3 SF314-71-56U3 | i5-12500H 80 W / 35 W | Iris Xe G7 80EUs 1.300 / 3.200 MHz | 16 GB | 2892.22 |
| MSI Crosshair 15 R6E B12UGZ-050 | i7-12700H 121 W / 85 W | GeForce RTX 3070 Laptop GPU 140 W 1610 MHz 8 GB | 16 GB | 2919.15 |
| Asus ROG Zephyrus G14 GA402RJ | R7 6800HS 125 W / 100 W | Radeon RX 6700S 105 W 2210 / 1750 MHz 8 GB | 16 GB | 2999.71 |
| MSI Katana GF66 12UGS | i7-12700H 100 W / 38 W | GeForce RTX 3070 Ti Laptop GPU 105 W 1035 / 1500 MHz 8 GB | 16 GB | 3061.5 |
| Asus ZenBook 14X UX3404VC | i9-13900H 115 W / 45 W | Iris Xe G7 96EUs | 16 GB | 3066 |
| Acer Aspire Vero AV14-51-72DL | i7-1255U 55 W / 30 W | Iris Xe G7 96EUs 1250 / 2133 MHz | 16 GB | 3141.13 |
| Acer Aspire 5 A515-58GM-76S8 | i7-1355U 55 W / 28 W | GeForce RTX 2050 Mobile 35 W 1155 / 1500 MHz 4 GB | 16 GB | 3161.58 |
| MSI Vector GP76 12UGS-434 | i7-12700H 65 W / 45 W | GeForce RTX 3070 Ti Laptop GPU 150 W 1585 / 1750 MHz 8 GB | 16 GB | 3199 |
| Model | CPU | GPU | RAM | Value |
|---|---|---|---|---|
| Intel NUC 13 Pro Desk Edition Kit | i7-1360P 64 W / 40 W | Iris Xe G7 96EUs | 32 GB | 401.3 |
| Acer Nitro 5 AN517-55-738R | i7-12700H 115 W / 80 W | GeForce RTX 3060 Laptop GPU 80 W 1425 / 1750 MHz 6 GB | 16 GB | 436.2 |
| Intel NUC 13 Pro Kit NUC13ANK | i7-1360P 64 W / 40 W | Iris Xe G7 96EUs | 32 GB | 562 |
| Model | CPU | GPU | RAM | Value |
|---|---|---|---|---|
| Intel NUC 13 Pro Desk Edition Kit | i7-1360P 64 W / 40 W | Iris Xe G7 96EUs | 32 GB | 423.5 |
| Acer Nitro 5 AN517-55-738R | i7-12700H 115 W / 80 W | GeForce RTX 3060 Laptop GPU 80 W 1425 / 1750 MHz 6 GB | 16 GB | 535.8 |
| Intel NUC 13 Pro Kit NUC13ANK | i7-1360P 64 W / 40 W | Iris Xe G7 96EUs | 32 GB | 605.8 |
| Model | CPU | GPU | RAM | Value |
|---|---|---|---|---|
| Intel NUC 13 Pro Desk Edition Kit | i7-1360P 64 W / 40 W | Iris Xe G7 96EUs | 32 GB | 143.9 |
| Intel NUC 13 Pro Kit NUC13ANK | i7-1360P 64 W / 40 W | Iris Xe G7 96EUs | 32 GB | 175.2 |
| Acer Nitro 5 AN517-55-738R | i7-12700H 115 W / 80 W | GeForce RTX 3060 Laptop GPU 80 W 1425 / 1750 MHz 6 GB | 16 GB | 237.4 |
| Model | CPU | GPU | RAM | Value |
|---|---|---|---|---|
| Intel NUC 13 Pro Kit NUC13ANK | i7-1360P 64 W / 40 W | Iris Xe G7 96EUs | 32 GB | 51.73 |
| Intel NUC 13 Pro Desk Edition Kit | i7-1360P 64 W / 40 W | Iris Xe G7 96EUs | 32 GB | 54.85 |
| Acer Nitro 5 AN517-55-738R | i7-12700H 115 W / 80 W | GeForce RTX 3060 Laptop GPU 80 W 1425 / 1750 MHz 6 GB | 16 GB | 57.85 |
| Model | CPU | GPU | RAM | Value |
|---|---|---|---|---|
| Intel NUC 13 Pro Kit NUC13ANK | i7-1360P 64 W / 40 W | Iris Xe G7 96EUs | 32 GB | 915.7 |
| Acer Nitro 5 AN517-55-738R | i7-12700H 115 W / 80 W | GeForce RTX 3060 Laptop GPU 80 W 1425 / 1750 MHz 6 GB | 16 GB | 1122 |
| Intel NUC 13 Pro Desk Edition Kit | i7-1360P 64 W / 40 W | Iris Xe G7 96EUs | 32 GB | 1193 |
| Model | CPU | GPU | RAM | Value |
|---|---|---|---|---|
| Intel NUC 13 Pro Kit NUC13ANK | i7-1360P 64 W / 40 W | Iris Xe G7 96EUs | 32 GB | 1957 |
| Intel NUC 13 Pro Desk Edition Kit | i7-1360P 64 W / 40 W | Iris Xe G7 96EUs | 32 GB | 2579 |
| Acer Nitro 5 AN517-55-738R | i7-12700H 115 W / 80 W | GeForce RTX 3060 Laptop GPU 80 W 1425 / 1750 MHz 6 GB | 16 GB | 2695 |
| Model | CPU | GPU | RAM | Value |
|---|---|---|---|---|
| Acer Nitro 5 AN517-55-738R | i7-12700H 115 W / 80 W | GeForce RTX 3060 Laptop GPU 80 W 1425 / 1750 MHz 6 GB | 16 GB | 1127 |
| Intel NUC 13 Pro Desk Edition Kit | i7-1360P 64 W / 40 W | Iris Xe G7 96EUs | 32 GB | 3270 |
| Intel NUC 13 Pro Kit NUC13ANK | i7-1360P 64 W / 40 W | Iris Xe G7 96EUs | 32 GB | 3400 |
| Model | CPU | GPU | RAM | Value |
|---|---|---|---|---|
| Acer Nitro 5 AN517-55-738R | i7-12700H 115 W / 80 W | GeForce RTX 3060 Laptop GPU 80 W 1425 / 1750 MHz 6 GB | 16 GB | 3793 |
| Intel NUC 13 Pro Kit NUC13ANK | i7-1360P 64 W / 40 W | Iris Xe G7 96EUs | 32 GB | 3869 |
| Intel NUC 13 Pro Desk Edition Kit | i7-1360P 64 W / 40 W | Iris Xe G7 96EUs | 32 GB | 3944 |
| Model | CPU | GPU | RAM | Value |
|---|---|---|---|---|
| MSI Katana GF66 12UGS | i7-12700H 100 W / 38 W | GeForce RTX 3070 Ti Laptop GPU 105 W 1035 / 1500 MHz 8 GB | 16 GB | 50.55 |
| Acer Swift 3 SF314-71-56U3 | i5-12500H 80 W / 35 W | Iris Xe G7 80EUs 1.300 / 3.200 MHz | 16 GB | 189.6 |
| Asus ROG Zephyrus G14 GA402RJ | R7 6800HS 125 W / 100 W | Radeon RX 6700S 105 W 2210 / 1750 MHz 8 GB | 16 GB | 219 |
| Acer Aspire Vero AV14-51-72DL | i7-1255U 55 W / 30 W | Iris Xe G7 96EUs 1250 / 2133 MHz | 16 GB | 219.5 |
| MSI Crosshair 15 R6E B12UGZ-050 | i7-12700H 121 W / 85 W | GeForce RTX 3070 Laptop GPU 140 W 1610 MHz 8 GB | 16 GB | 284 |
| Model | CPU | GPU | RAM | Value |
|---|---|---|---|---|
| HP EliteBook 8 Flip G1i 13 | Ultra 7 265U 58 W / 24 W | Graphics 4-Core iGPU (Arrow Lake) 2100 MHz | 16 GB | 119.8 |
| Lenovo Yoga Slim 7i Pro 14IAP G7 | i5-1240P 64 W / 50 W | Iris Xe G7 80EUs 1300 MHz | 16 GB | 122.4 |
| HP Victus 15 fa0020nr | i7-12700H 95 W / 45 W | GeForce RTX 3050 Ti Laptop GPU 75 W 1485 / 1468 MHz 4 GB | 8 GB | 124.2 |
| Lenovo IdeaPad 5 Pro 16ARH7 | R5 6600HS 60 W / 42 W | Radeon 660M 1900 / 1067 MHz 2 GB | 16 GB | 126.8 |
| LG Gram 14Z90Q | i5-1240P 43 W / 24 W | Iris Xe G7 80EUs 1300 / 2600 MHz | 16 GB | 132.4 |
| Dell XPS 13 9305 Core i5 FHD | i5-1135G7 60 W / 15 W | Iris Xe G7 80EUs 28 W | 8 GB | 136.9 |
| Lenovo ThinkPad P1 G4-20Y4Z9DVUS 6.0.1 x64 1024 MiB [C: 16.2% (76.9/475.7 GiB)] (x5) [Interval=5 sec] | i7-11800H 100 W / 60 W | T1200 Laptop GPU 60 W 1840 / 1255 MHz 4 GB | 16 GB | 137.5 |
| Intel NUC 13 Pro Desk Edition Kit | i7-1360P 64 W / 40 W | Iris Xe G7 96EUs | 32 GB | 138.2 |
| Dell Latitude 3440 | i5-1345U 32 W / 18 W | Iris Xe G7 80EUs 1200 MHz | 16 GB | 138.6 |
| Dynabook Portégé X30L-K-139 6.0.1 x64 1024 MiB [C: 9.8% (44.9/459.0 GiB)] (x5) [Interval=5 sec] | i5-1240P 64 W / 15 W | Iris Xe G7 80EUs | 16 GB | 139.47 |
| Dell XPS 13 Plus 9320 Core i7-1360P | i7-1360P 64 W / 34 W | Iris Xe G7 96EUs 1500 / 2600 MHz | 16 GB | 140.3 |
| Honor MagicBook 16 2022 6.0.1 x64 1024 MiB [C: 44.6% (53.5/120.0 GiB)] (x5) [Interval=5 sec] | R5 5600H 65 W / 54 W | Vega 7 1800 / 1600 MHz | 16 GB | 146.48 |
| Lenovo ThinkBook 13x G1-20WJ001KGE | i7-1160G7 40 W / 20 W | Iris Xe G7 96EUs | 16 GB | 149.9 |
| Asus Zenbook Pro 14 Duo OLED UX8402ZA 6.0.1 x64 1024 MiB [C: 10.6% (50.3/475.6 GiB)] (x5) [Interval=5 sec] | i7-12700H 80 W / 60 W | Iris Xe G7 96EUs 1400 / 2400 MHz | 16 GB | 157.97 |
| Samsung Galaxy Book4 Ultra 6.0.1 x64 1024 MiB [C: 13.9% (63.1/454.8 GiB)] (x5) [Interval=5 sec] | Ultra 7 155H 65 W / 45 W | GeForce RTX 4050 Laptop GPU 80 W 2055 / 2000 MHz 6 GB | 16 GB | 164 |
| Intel NUC 13 Pro Kit NUC13ANK | i7-1360P 64 W / 40 W | Iris Xe G7 96EUs | 32 GB | 173.3 |
| Lenovo ThinkPad X1 Yoga G7 21CE002HGE 6.0.1 x64 1024 MiB [C: 10.6% (50.1/474.7 GiB)] (x5) [Interval=5 sec] | i7-1270P 64 W / 28 W | Iris Xe G7 96EUs 1400 MHz | 16 GB | 208.72 |
| Samsung Galaxy Book3 Ultra 16 | i7-13700H 75 W / 45 W | GeForce RTX 4050 Laptop GPU 60 W 1605 / 2000 MHz 6 GB | 16 GB | 211.9 |
| LG Gram 17 (2022) | i5-1240P 43 W / 25 W | Iris Xe G7 80EUs 1300 MHz | 16 GB | 212 |
| MSI Prestige 14 Evo A11MO-026US | i7-1195G7 64 W / 36 W | Iris Xe G7 96EUs | 16 GB | 214.3 |
| Uniwill GM6PX7X RTX 4070 | i7-13700HX 130 W / 122 W | GeForce RTX 4070 Laptop GPU 140 W 2275 / 2125 MHz 8 GB | 32 GB | 216.1 |
| Lenovo ThinkBook Plus Gen2 Core i5 | i5-1130G7 25 W / 12 W | Iris Xe G7 80EUs | 16 GB | 222.8 |
| Lenovo ThinkPad P1 G4-20Y30017GE 6.0.1 x64 1024 MiB [C: 9.8% (46.6/475.7 GiB)] (x5) [Interval=5 sec] | i7-11800H 54 W / 37 W | T1200 Laptop GPU 1840 / 1255 MHz 4 GB | 16 GB | 224.1 |
| Schenker Uniwill Technology GM7AG8P | i9-12900H 75 W / 75 W | GeForce RTX 3080 Ti Laptop GPU 1590 / 2000 MHz 16 GB | 32 GB | 226.7 |
| Aorus 17G YD | i7-11800H 109 W / 45 W | GeForce RTX 3080 Laptop GPU 105 W 1245 / 1500 MHz 16 GB | 32 GB | 227.4 |
| Lenovo ThinkPad X1 Carbon G9-20XW0089GE 6.0.1 x64 1024 MiB [C: 31.0% (147.7/475.7 GiB)] (x5) [Interval=5 sec] | i5-1135G7 34 W / 27 W | Iris Xe G7 80EUs | 16 GB | 229 |
| Honor MagicBook 14 2022 6.0.1 x64 1024 MiB [C: 42.2% (50.7/120.0 GiB)] (x5) [Interval=5 sec] | i5-12500H 84 W / 56 W | GeForce RTX 2050 Mobile 60 W 1732 / 1750 MHz 4 GB | 16 GB | 229.88 |
| Gigabyte Aero 17 HDR YD | i9-11980HK 109 W / 70 W | GeForce RTX 3080 Laptop GPU 105 W 1245 / 1500 MHz 16 GB | 32 GB | 230.4 |
| VAIO SX12 VJS124X1011P | i5-1155G7 58 W / 27 W | Iris Xe G7 80EUs 1350 / 2000 MHz | 16 GB | 233.2 |
| Acer Nitro 5 AN517-55-738R | i7-12700H 115 W / 80 W | GeForce RTX 3060 Laptop GPU 80 W 1425 / 1750 MHz 6 GB | 16 GB | 233.2 |
| VAIO Z VJZ141C11L | i7-11375H 64 W / 64 W | Iris Xe G7 96EUs 2000 / 1350 MHz | 16 GB | 236.7 |
| Model | CPU | GPU | RAM | Value |
|---|---|---|---|---|
| MSI Katana GF66 12UGS | i7-12700H 100 W / 38 W | GeForce RTX 3070 Ti Laptop GPU 105 W 1035 / 1500 MHz 8 GB | 16 GB | 23.69 |
| Acer Swift 3 SF314-71-56U3 | i5-12500H 80 W / 35 W | Iris Xe G7 80EUs 1.300 / 3.200 MHz | 16 GB | 50.16 |
| Asus ROG Zephyrus G14 GA402RJ | R7 6800HS 125 W / 100 W | Radeon RX 6700S 105 W 2210 / 1750 MHz 8 GB | 16 GB | 61.12 |
| Acer Aspire Vero AV14-51-72DL | i7-1255U 55 W / 30 W | Iris Xe G7 96EUs 1250 / 2133 MHz | 16 GB | 70.63 |
| MSI Crosshair 15 R6E B12UGZ-050 | i7-12700H 121 W / 85 W | GeForce RTX 3070 Laptop GPU 140 W 1610 MHz 8 GB | 16 GB | 72.44 |
| Model | CPU | GPU | RAM | Value |
|---|---|---|---|---|
| Dell XPS 13 9305 Core i5 FHD | i5-1135G7 60 W / 15 W | Iris Xe G7 80EUs 28 W | 8 GB | 47.34 |
| Samsung Galaxy Book3 Ultra 16 | i7-13700H 75 W / 45 W | GeForce RTX 4050 Laptop GPU 60 W 1605 / 2000 MHz 6 GB | 16 GB | 49.03 |
| Intel NUC 13 Pro Kit NUC13ANK | i7-1360P 64 W / 40 W | Iris Xe G7 96EUs | 32 GB | 49.3 |
| Intel NUC 13 Pro Desk Edition Kit | i7-1360P 64 W / 40 W | Iris Xe G7 96EUs | 32 GB | 51.8 |
| Acer Nitro 5 AN517-55-738R | i7-12700H 115 W / 80 W | GeForce RTX 3060 Laptop GPU 80 W 1425 / 1750 MHz 6 GB | 16 GB | 63.71 |
| Lenovo IdeaPad 5 Pro 16ARH7 | R5 6600HS 60 W / 42 W | Radeon 660M 1900 / 1067 MHz 2 GB | 16 GB | 66.19 |
| HP EliteBook 8 Flip G1i 13 | Ultra 7 265U 58 W / 24 W | Graphics 4-Core iGPU (Arrow Lake) 2100 MHz | 16 GB | 67.33 |
| Honor MagicBook 16 2022 6.0.1 x64 1024 MiB [C: 44.6% (53.5/120.0 GiB)] (x5) [Interval=5 sec] | R5 5600H 65 W / 54 W | Vega 7 1800 / 1600 MHz | 16 GB | 68.32 |
| Lenovo Yoga Slim 7i Pro 14IAP G7 | i5-1240P 64 W / 50 W | Iris Xe G7 80EUs 1300 MHz | 16 GB | 69.03 |
| HP Victus 15 fa0020nr | i7-12700H 95 W / 45 W | GeForce RTX 3050 Ti Laptop GPU 75 W 1485 / 1468 MHz 4 GB | 8 GB | 70.12 |
| Lenovo ThinkPad P1 G4-20Y4Z9DVUS 6.0.1 x64 1024 MiB [C: 16.2% (76.9/475.7 GiB)] (x5) [Interval=5 sec] | i7-11800H 100 W / 60 W | T1200 Laptop GPU 60 W 1840 / 1255 MHz 4 GB | 16 GB | 73.2 |
| Dynabook Portégé X30L-K-139 6.0.1 x64 1024 MiB [C: 9.8% (44.9/459.0 GiB)] (x5) [Interval=5 sec] | i5-1240P 64 W / 15 W | Iris Xe G7 80EUs | 16 GB | 76.33 |
| Samsung Galaxy Book4 Ultra 6.0.1 x64 1024 MiB [C: 13.9% (63.1/454.8 GiB)] (x5) [Interval=5 sec] | Ultra 7 155H 65 W / 45 W | GeForce RTX 4050 Laptop GPU 80 W 2055 / 2000 MHz 6 GB | 16 GB | 77.4 |
| Asus Zenbook Pro 14 Duo OLED UX8402ZA 6.0.1 x64 1024 MiB [C: 10.6% (50.3/475.6 GiB)] (x5) [Interval=5 sec] | i7-12700H 80 W / 60 W | Iris Xe G7 96EUs 1400 / 2400 MHz | 16 GB | 77.71 |
| VAIO Z VJZ141C11L | i7-11375H 64 W / 64 W | Iris Xe G7 96EUs 2000 / 1350 MHz | 16 GB | 78.6 |
| Lenovo ThinkBook 13x G1-20WJ001KGE | i7-1160G7 40 W / 20 W | Iris Xe G7 96EUs | 16 GB | 78.7 |
| Dell XPS 13 Plus 9320 Core i7-1360P | i7-1360P 64 W / 34 W | Iris Xe G7 96EUs 1500 / 2600 MHz | 16 GB | 78.91 |
| Dell Latitude 3440 | i5-1345U 32 W / 18 W | Iris Xe G7 80EUs 1200 MHz | 16 GB | 80.73 |
| Uniwill GM6PX7X RTX 4070 | i7-13700HX 130 W / 122 W | GeForce RTX 4070 Laptop GPU 140 W 2275 / 2125 MHz 8 GB | 32 GB | 81.22 |
| LG Gram 14Z90Q | i5-1240P 43 W / 24 W | Iris Xe G7 80EUs 1300 / 2600 MHz | 16 GB | 81.46 |
| LG Gram 17 (2022) | i5-1240P 43 W / 25 W | Iris Xe G7 80EUs 1300 MHz | 16 GB | 88.47 |
| MSI Prestige 14 Evo A11MO-026US | i7-1195G7 64 W / 36 W | Iris Xe G7 96EUs | 16 GB | 88.5 |
| Lenovo ThinkPad P1 G4-20Y30017GE 6.0.1 x64 1024 MiB [C: 9.8% (46.6/475.7 GiB)] (x5) [Interval=5 sec] | i7-11800H 54 W / 37 W | T1200 Laptop GPU 1840 / 1255 MHz 4 GB | 16 GB | 88.5 |
| Lenovo ThinkBook Plus Gen2 Core i5 | i5-1130G7 25 W / 12 W | Iris Xe G7 80EUs | 16 GB | 88.8 |
| Lenovo ThinkPad X1 Carbon G9-20XW0089GE 6.0.1 x64 1024 MiB [C: 31.0% (147.7/475.7 GiB)] (x5) [Interval=5 sec] | i5-1135G7 34 W / 27 W | Iris Xe G7 80EUs | 16 GB | 89.4 |
| Lenovo ThinkPad X1 Yoga G7 21CE002HGE 6.0.1 x64 1024 MiB [C: 10.6% (50.1/474.7 GiB)] (x5) [Interval=5 sec] | i7-1270P 64 W / 28 W | Iris Xe G7 96EUs 1400 MHz | 16 GB | 89.51 |
| Schenker Uniwill Technology GM7AG8P | i9-12900H 75 W / 75 W | GeForce RTX 3080 Ti Laptop GPU 1590 / 2000 MHz 16 GB | 32 GB | 90.5 |
| Aorus 17G YD | i7-11800H 109 W / 45 W | GeForce RTX 3080 Laptop GPU 105 W 1245 / 1500 MHz 16 GB | 32 GB | 91.3 |
| Honor MagicBook 14 2022 6.0.1 x64 1024 MiB [C: 42.2% (50.7/120.0 GiB)] (x5) [Interval=5 sec] | i5-12500H 84 W / 56 W | GeForce RTX 2050 Mobile 60 W 1732 / 1750 MHz 4 GB | 16 GB | 91.45 |
| Gigabyte Aero 17 HDR YD | i9-11980HK 109 W / 70 W | GeForce RTX 3080 Laptop GPU 105 W 1245 / 1500 MHz 16 GB | 32 GB | 91.6 |
| VAIO SX12 VJS124X1011P | i5-1155G7 58 W / 27 W | Iris Xe G7 80EUs 1350 / 2000 MHz | 16 GB | 92 |
| Model | CPU | GPU | RAM | Value |
|---|---|---|---|---|
| MSI Katana GF66 12UGS | i7-12700H 100 W / 38 W | GeForce RTX 3070 Ti Laptop GPU 105 W 1035 / 1500 MHz 8 GB | 16 GB | 416.3 |
| Acer Swift 3 SF314-71-56U3 | i5-12500H 80 W / 35 W | Iris Xe G7 80EUs 1.300 / 3.200 MHz | 16 GB | 3421 |
| Asus ROG Zephyrus G14 GA402RJ | R7 6800HS 125 W / 100 W | Radeon RX 6700S 105 W 2210 / 1750 MHz 8 GB | 16 GB | 3428 |
| Acer Aspire Vero AV14-51-72DL | i7-1255U 55 W / 30 W | Iris Xe G7 96EUs 1250 / 2133 MHz | 16 GB | 3434 |
| MSI Crosshair 15 R6E B12UGZ-050 | i7-12700H 121 W / 85 W | GeForce RTX 3070 Laptop GPU 140 W 1610 MHz 8 GB | 16 GB | 3500 |
| Model | CPU | GPU | RAM | Value |
|---|---|---|---|---|
| MSI Katana GF66 12UGS | i7-12700H 100 W / 38 W | GeForce RTX 3070 Ti Laptop GPU 105 W 1035 / 1500 MHz 8 GB | 16 GB | 864 |
| Acer Swift 3 SF314-71-56U3 | i5-12500H 80 W / 35 W | Iris Xe G7 80EUs 1.300 / 3.200 MHz | 16 GB | 1377 |
| MSI Crosshair 15 R6E B12UGZ-050 | i7-12700H 121 W / 85 W | GeForce RTX 3070 Laptop GPU 140 W 1610 MHz 8 GB | 16 GB | 2191 |
| Asus ROG Zephyrus G14 GA402RJ | R7 6800HS 125 W / 100 W | Radeon RX 6700S 105 W 2210 / 1750 MHz 8 GB | 16 GB | 2231 |
| Acer Aspire Vero AV14-51-72DL | i7-1255U 55 W / 30 W | Iris Xe G7 96EUs 1250 / 2133 MHz | 16 GB | 2291 |
| Model | CPU | GPU | RAM | Value |
|---|---|---|---|---|
| Asus ROG Zephyrus G14 GA402RJ | R7 6800HS 125 W / 100 W | Radeon RX 6700S 105 W 2210 / 1750 MHz 8 GB | 16 GB | 318.3 |
| Acer Swift 3 SF314-71-56U3 | i5-12500H 80 W / 35 W | Iris Xe G7 80EUs 1.300 / 3.200 MHz | 16 GB | 407.7 |
| Acer Aspire Vero AV14-51-72DL | i7-1255U 55 W / 30 W | Iris Xe G7 96EUs 1250 / 2133 MHz | 16 GB | 419.3 |
| MSI Crosshair 15 R6E B12UGZ-050 | i7-12700H 121 W / 85 W | GeForce RTX 3070 Laptop GPU 140 W 1610 MHz 8 GB | 16 GB | 601.4 |
| Model | CPU | GPU | RAM | Value |
|---|---|---|---|---|
| LG Gram 14Z90Q | i5-1240P 43 W / 24 W | Iris Xe G7 80EUs 1300 / 2600 MHz | 16 GB | 277.3 |
| Lenovo ThinkPad P1 G4-20Y4Z9DVUS 6.0.1 x64 1024 MiB [C: 16.2% (76.9/475.7 GiB)] (x5) [Interval=5 sec] | i7-11800H 100 W / 60 W | T1200 Laptop GPU 60 W 1840 / 1255 MHz 4 GB | 16 GB | 290 |
| Lenovo IdeaPad 5 Pro 16ARH7 | R5 6600HS 60 W / 42 W | Radeon 660M 1900 / 1067 MHz 2 GB | 16 GB | 292.2 |
| Lenovo Yoga Slim 7i Pro 14IAP G7 | i5-1240P 64 W / 50 W | Iris Xe G7 80EUs 1300 MHz | 16 GB | 292.7 |
| HP EliteBook 8 Flip G1i 13 | Ultra 7 265U 58 W / 24 W | Graphics 4-Core iGPU (Arrow Lake) 2100 MHz | 16 GB | 295.4 |
| Dynabook Portégé X30L-K-139 6.0.1 x64 1024 MiB [C: 9.8% (44.9/459.0 GiB)] (x5) [Interval=5 sec] | i5-1240P 64 W / 15 W | Iris Xe G7 80EUs | 16 GB | 301.8 |
| Lenovo ThinkBook 13x G1-20WJ001KGE | i7-1160G7 40 W / 20 W | Iris Xe G7 96EUs | 16 GB | 320.7 |
| HP Victus 15 fa0020nr | i7-12700H 95 W / 45 W | GeForce RTX 3050 Ti Laptop GPU 75 W 1485 / 1468 MHz 4 GB | 8 GB | 347 |
| Dell Latitude 3440 | i5-1345U 32 W / 18 W | Iris Xe G7 80EUs 1200 MHz | 16 GB | 370.9 |
| Samsung Galaxy Book4 Ultra 6.0.1 x64 1024 MiB [C: 13.9% (63.1/454.8 GiB)] (x5) [Interval=5 sec] | Ultra 7 155H 65 W / 45 W | GeForce RTX 4050 Laptop GPU 80 W 2055 / 2000 MHz 6 GB | 16 GB | 400 |
| LG Gram 17 (2022) | i5-1240P 43 W / 25 W | Iris Xe G7 80EUs 1300 MHz | 16 GB | 402.6 |
| Intel NUC 13 Pro Desk Edition Kit | i7-1360P 64 W / 40 W | Iris Xe G7 96EUs | 32 GB | 412.4 |
| Asus Zenbook Pro 14 Duo OLED UX8402ZA 6.0.1 x64 1024 MiB [C: 10.6% (50.3/475.6 GiB)] (x5) [Interval=5 sec] | i7-12700H 80 W / 60 W | Iris Xe G7 96EUs 1400 / 2400 MHz | 16 GB | 412.65 |
| Acer Nitro 5 AN517-55-738R | i7-12700H 115 W / 80 W | GeForce RTX 3060 Laptop GPU 80 W 1425 / 1750 MHz 6 GB | 16 GB | 427.1 |
| Lenovo ThinkPad X1 Yoga G7 21CE002HGE 6.0.1 x64 1024 MiB [C: 10.6% (50.1/474.7 GiB)] (x5) [Interval=5 sec] | i7-1270P 64 W / 28 W | Iris Xe G7 96EUs 1400 MHz | 16 GB | 428.78 |
| Dell XPS 13 Plus 9320 Core i7-1360P | i7-1360P 64 W / 34 W | Iris Xe G7 96EUs 1500 / 2600 MHz | 16 GB | 429.5 |
| Dell XPS 13 9305 Core i5 FHD | i5-1135G7 60 W / 15 W | Iris Xe G7 80EUs 28 W | 8 GB | 433 |
| Lenovo ThinkBook Plus Gen2 Core i5 | i5-1130G7 25 W / 12 W | Iris Xe G7 80EUs | 16 GB | 467.1 |
| Schenker Uniwill Technology GM7AG8P | i9-12900H 75 W / 75 W | GeForce RTX 3080 Ti Laptop GPU 1590 / 2000 MHz 16 GB | 32 GB | 485.5 |
| Samsung Galaxy Book3 Ultra 16 | i7-13700H 75 W / 45 W | GeForce RTX 4050 Laptop GPU 60 W 1605 / 2000 MHz 6 GB | 16 GB | 499 |
| Lenovo ThinkPad X1 Carbon G9-20XW0089GE 6.0.1 x64 1024 MiB [C: 31.0% (147.7/475.7 GiB)] (x5) [Interval=5 sec] | i5-1135G7 34 W / 27 W | Iris Xe G7 80EUs | 16 GB | 507 |
| MSI Prestige 14 Evo A11MO-026US | i7-1195G7 64 W / 36 W | Iris Xe G7 96EUs | 16 GB | 511 |
| Honor MagicBook 16 2022 6.0.1 x64 1024 MiB [C: 44.6% (53.5/120.0 GiB)] (x5) [Interval=5 sec] | R5 5600H 65 W / 54 W | Vega 7 1800 / 1600 MHz | 16 GB | 520.61 |
| Intel NUC 13 Pro Kit NUC13ANK | i7-1360P 64 W / 40 W | Iris Xe G7 96EUs | 32 GB | 551.2 |
| VAIO SX12 VJS124X1011P | i5-1155G7 58 W / 27 W | Iris Xe G7 80EUs 1350 / 2000 MHz | 16 GB | 565 |
| Honor MagicBook 14 2022 6.0.1 x64 1024 MiB [C: 42.2% (50.7/120.0 GiB)] (x5) [Interval=5 sec] | i5-12500H 84 W / 56 W | GeForce RTX 2050 Mobile 60 W 1732 / 1750 MHz 4 GB | 16 GB | 627.94 |
| VAIO Z VJZ141C11L | i7-11375H 64 W / 64 W | Iris Xe G7 96EUs 2000 / 1350 MHz | 16 GB | 646 |
| Aorus 17G YD | i7-11800H 109 W / 45 W | GeForce RTX 3080 Laptop GPU 105 W 1245 / 1500 MHz 16 GB | 32 GB | 661 |
| Lenovo ThinkPad P1 G4-20Y30017GE 6.0.1 x64 1024 MiB [C: 9.8% (46.6/475.7 GiB)] (x5) [Interval=5 sec] | i7-11800H 54 W / 37 W | T1200 Laptop GPU 1840 / 1255 MHz 4 GB | 16 GB | 664 |
| Gigabyte Aero 17 HDR YD | i9-11980HK 109 W / 70 W | GeForce RTX 3080 Laptop GPU 105 W 1245 / 1500 MHz 16 GB | 32 GB | 667 |
| Uniwill GM6PX7X RTX 4070 | i7-13700HX 130 W / 122 W | GeForce RTX 4070 Laptop GPU 140 W 2275 / 2125 MHz 8 GB | 32 GB | 710.1 |
| Model | CPU | GPU | RAM | Value |
|---|---|---|---|---|
| Asus ROG Zephyrus G14 GA402RJ | R7 6800HS 125 W / 100 W | Radeon RX 6700S 105 W 2210 / 1750 MHz 8 GB | 16 GB | 593.5 |
| Acer Swift 3 SF314-71-56U3 | i5-12500H 80 W / 35 W | Iris Xe G7 80EUs 1.300 / 3.200 MHz | 16 GB | 600.6 |
| Acer Aspire Vero AV14-51-72DL | i7-1255U 55 W / 30 W | Iris Xe G7 96EUs 1250 / 2133 MHz | 16 GB | 684.4 |
| MSI Crosshair 15 R6E B12UGZ-050 | i7-12700H 121 W / 85 W | GeForce RTX 3070 Laptop GPU 140 W 1610 MHz 8 GB | 16 GB | 865.4 |
| Model | CPU | GPU | RAM | Value |
|---|---|---|---|---|
| Dell XPS 13 9305 Core i5 FHD | i5-1135G7 60 W / 15 W | Iris Xe G7 80EUs 28 W | 8 GB | 293 |
| LG Gram 14Z90Q | i5-1240P 43 W / 24 W | Iris Xe G7 80EUs 1300 / 2600 MHz | 16 GB | 348.8 |
| Lenovo Yoga Slim 7i Pro 14IAP G7 | i5-1240P 64 W / 50 W | Iris Xe G7 80EUs 1300 MHz | 16 GB | 360.8 |
| Lenovo IdeaPad 5 Pro 16ARH7 | R5 6600HS 60 W / 42 W | Radeon 660M 1900 / 1067 MHz 2 GB | 16 GB | 365.8 |
| Lenovo ThinkPad P1 G4-20Y4Z9DVUS 6.0.1 x64 1024 MiB [C: 16.2% (76.9/475.7 GiB)] (x5) [Interval=5 sec] | i7-11800H 100 W / 60 W | T1200 Laptop GPU 60 W 1840 / 1255 MHz 4 GB | 16 GB | 404.9 |
| Lenovo ThinkBook 13x G1-20WJ001KGE | i7-1160G7 40 W / 20 W | Iris Xe G7 96EUs | 16 GB | 408.6 |
| Dell Latitude 3440 | i5-1345U 32 W / 18 W | Iris Xe G7 80EUs 1200 MHz | 16 GB | 412.8 |
| Dynabook Portégé X30L-K-139 6.0.1 x64 1024 MiB [C: 9.8% (44.9/459.0 GiB)] (x5) [Interval=5 sec] | i5-1240P 64 W / 15 W | Iris Xe G7 80EUs | 16 GB | 421.41 |
| HP Victus 15 fa0020nr | i7-12700H 95 W / 45 W | GeForce RTX 3050 Ti Laptop GPU 75 W 1485 / 1468 MHz 4 GB | 8 GB | 429.2 |
| HP EliteBook 8 Flip G1i 13 | Ultra 7 265U 58 W / 24 W | Graphics 4-Core iGPU (Arrow Lake) 2100 MHz | 16 GB | 429.8 |
| Asus Zenbook Pro 14 Duo OLED UX8402ZA 6.0.1 x64 1024 MiB [C: 10.6% (50.3/475.6 GiB)] (x5) [Interval=5 sec] | i7-12700H 80 W / 60 W | Iris Xe G7 96EUs 1400 / 2400 MHz | 16 GB | 438.12 |
| Dell XPS 13 Plus 9320 Core i7-1360P | i7-1360P 64 W / 34 W | Iris Xe G7 96EUs 1500 / 2600 MHz | 16 GB | 455.9 |
| Intel NUC 13 Pro Desk Edition Kit | i7-1360P 64 W / 40 W | Iris Xe G7 96EUs | 32 GB | 493.1 |
| Acer Nitro 5 AN517-55-738R | i7-12700H 115 W / 80 W | GeForce RTX 3060 Laptop GPU 80 W 1425 / 1750 MHz 6 GB | 16 GB | 519.9 |
| MSI Prestige 14 Evo A11MO-026US | i7-1195G7 64 W / 36 W | Iris Xe G7 96EUs | 16 GB | 575 |
| Honor MagicBook 16 2022 6.0.1 x64 1024 MiB [C: 44.6% (53.5/120.0 GiB)] (x5) [Interval=5 sec] | R5 5600H 65 W / 54 W | Vega 7 1800 / 1600 MHz | 16 GB | 588.03 |
| LG Gram 17 (2022) | i5-1240P 43 W / 25 W | Iris Xe G7 80EUs 1300 MHz | 16 GB | 595.6 |
| Lenovo ThinkPad X1 Yoga G7 21CE002HGE 6.0.1 x64 1024 MiB [C: 10.6% (50.1/474.7 GiB)] (x5) [Interval=5 sec] | i7-1270P 64 W / 28 W | Iris Xe G7 96EUs 1400 MHz | 16 GB | 599.21 |
| Samsung Galaxy Book4 Ultra 6.0.1 x64 1024 MiB [C: 13.9% (63.1/454.8 GiB)] (x5) [Interval=5 sec] | Ultra 7 155H 65 W / 45 W | GeForce RTX 4050 Laptop GPU 80 W 2055 / 2000 MHz 6 GB | 16 GB | 613 |
| Intel NUC 13 Pro Kit NUC13ANK | i7-1360P 64 W / 40 W | Iris Xe G7 96EUs | 32 GB | 613.4 |
| Lenovo ThinkBook Plus Gen2 Core i5 | i5-1130G7 25 W / 12 W | Iris Xe G7 80EUs | 16 GB | 628 |
| Samsung Galaxy Book3 Ultra 16 | i7-13700H 75 W / 45 W | GeForce RTX 4050 Laptop GPU 60 W 1605 / 2000 MHz 6 GB | 16 GB | 641.8 |
| Lenovo ThinkPad X1 Carbon G9-20XW0089GE 6.0.1 x64 1024 MiB [C: 31.0% (147.7/475.7 GiB)] (x5) [Interval=5 sec] | i5-1135G7 34 W / 27 W | Iris Xe G7 80EUs | 16 GB | 659 |
| Schenker Uniwill Technology GM7AG8P | i9-12900H 75 W / 75 W | GeForce RTX 3080 Ti Laptop GPU 1590 / 2000 MHz 16 GB | 32 GB | 705 |
| Aorus 17G YD | i7-11800H 109 W / 45 W | GeForce RTX 3080 Laptop GPU 105 W 1245 / 1500 MHz 16 GB | 32 GB | 712 |
| VAIO Z VJZ141C11L | i7-11375H 64 W / 64 W | Iris Xe G7 96EUs 2000 / 1350 MHz | 16 GB | 717 |
| Lenovo ThinkPad P1 G4-20Y30017GE 6.0.1 x64 1024 MiB [C: 9.8% (46.6/475.7 GiB)] (x5) [Interval=5 sec] | i7-11800H 54 W / 37 W | T1200 Laptop GPU 1840 / 1255 MHz 4 GB | 16 GB | 720 |
| Gigabyte Aero 17 HDR YD | i9-11980HK 109 W / 70 W | GeForce RTX 3080 Laptop GPU 105 W 1245 / 1500 MHz 16 GB | 32 GB | 728 |
| VAIO SX12 VJS124X1011P | i5-1155G7 58 W / 27 W | Iris Xe G7 80EUs 1350 / 2000 MHz | 16 GB | 733 |
| Honor MagicBook 14 2022 6.0.1 x64 1024 MiB [C: 42.2% (50.7/120.0 GiB)] (x5) [Interval=5 sec] | i5-12500H 84 W / 56 W | GeForce RTX 2050 Mobile 60 W 1732 / 1750 MHz 4 GB | 16 GB | 868.92 |
| Uniwill GM6PX7X RTX 4070 | i7-13700HX 130 W / 122 W | GeForce RTX 4070 Laptop GPU 140 W 2275 / 2125 MHz 8 GB | 32 GB | 940.1 |
| Model | CPU | GPU | RAM | Value |
|---|---|---|---|---|
| MSI Katana GF66 12UGS | i7-12700H 100 W / 38 W | GeForce RTX 3070 Ti Laptop GPU 105 W 1035 / 1500 MHz 8 GB | 16 GB | 934.1 |
| Acer Swift 3 SF314-71-56U3 | i5-12500H 80 W / 35 W | Iris Xe G7 80EUs 1.300 / 3.200 MHz | 16 GB | 3409 |
| Asus ROG Zephyrus G14 GA402RJ | R7 6800HS 125 W / 100 W | Radeon RX 6700S 105 W 2210 / 1750 MHz 8 GB | 16 GB | 3446 |
| Acer Aspire Vero AV14-51-72DL | i7-1255U 55 W / 30 W | Iris Xe G7 96EUs 1250 / 2133 MHz | 16 GB | 3452 |
| MSI Crosshair 15 R6E B12UGZ-050 | i7-12700H 121 W / 85 W | GeForce RTX 3070 Laptop GPU 140 W 1610 MHz 8 GB | 16 GB | 3511 |
| Model | CPU | GPU | RAM | Value |
|---|---|---|---|---|
| Dell XPS 13 9305 Core i5 FHD | i5-1135G7 60 W / 15 W | Iris Xe G7 80EUs 28 W | 8 GB | 1148 |
| Aorus 17G YD | i7-11800H 109 W / 45 W | GeForce RTX 3080 Laptop GPU 105 W 1245 / 1500 MHz 16 GB | 32 GB | 1540 |
| Dynabook Portégé X30L-K-139 6.0.1 x64 1024 MiB [C: 9.8% (44.9/459.0 GiB)] (x5) [Interval=5 sec] | i5-1240P 64 W / 15 W | Iris Xe G7 80EUs | 16 GB | 3449.6 |
| Honor MagicBook 16 2022 6.0.1 x64 1024 MiB [C: 44.6% (53.5/120.0 GiB)] (x5) [Interval=5 sec] | R5 5600H 65 W / 54 W | Vega 7 1800 / 1600 MHz | 16 GB | 3504.1 |
| Dell Latitude 3440 | i5-1345U 32 W / 18 W | Iris Xe G7 80EUs 1200 MHz | 16 GB | 3908 |
| Lenovo ThinkBook 13x G1-20WJ001KGE | i7-1160G7 40 W / 20 W | Iris Xe G7 96EUs | 16 GB | 3955 |
| LG Gram 14Z90Q | i5-1240P 43 W / 24 W | Iris Xe G7 80EUs 1300 / 2600 MHz | 16 GB | 3973 |
| Lenovo ThinkPad P1 G4-20Y4Z9DVUS 6.0.1 x64 1024 MiB [C: 16.2% (76.9/475.7 GiB)] (x5) [Interval=5 sec] | i7-11800H 100 W / 60 W | T1200 Laptop GPU 60 W 1840 / 1255 MHz 4 GB | 16 GB | 4035 |
| Lenovo Yoga Slim 7i Pro 14IAP G7 | i5-1240P 64 W / 50 W | Iris Xe G7 80EUs 1300 MHz | 16 GB | 4092 |
| MSI Prestige 14 Evo A11MO-026US | i7-1195G7 64 W / 36 W | Iris Xe G7 96EUs | 16 GB | 4118 |
| VAIO Z VJZ141C11L | i7-11375H 64 W / 64 W | Iris Xe G7 96EUs 2000 / 1350 MHz | 16 GB | 4396 |
| VAIO SX12 VJS124X1011P | i5-1155G7 58 W / 27 W | Iris Xe G7 80EUs 1350 / 2000 MHz | 16 GB | 4442 |
| HP EliteBook 8 Flip G1i 13 | Ultra 7 265U 58 W / 24 W | Graphics 4-Core iGPU (Arrow Lake) 2100 MHz | 16 GB | 4469 |
| Lenovo ThinkPad X1 Carbon G9-20XW0089GE 6.0.1 x64 1024 MiB [C: 31.0% (147.7/475.7 GiB)] (x5) [Interval=5 sec] | i5-1135G7 34 W / 27 W | Iris Xe G7 80EUs | 16 GB | 4808 |
| Lenovo IdeaPad 5 Pro 16ARH7 | R5 6600HS 60 W / 42 W | Radeon 660M 1900 / 1067 MHz 2 GB | 16 GB | 4984 |
| HP Victus 15 fa0020nr | i7-12700H 95 W / 45 W | GeForce RTX 3050 Ti Laptop GPU 75 W 1485 / 1468 MHz 4 GB | 8 GB | 4993 |
| Schenker Uniwill Technology GM7AG8P | i9-12900H 75 W / 75 W | GeForce RTX 3080 Ti Laptop GPU 1590 / 2000 MHz 16 GB | 32 GB | 5012 |
| Lenovo ThinkBook Plus Gen2 Core i5 | i5-1130G7 25 W / 12 W | Iris Xe G7 80EUs | 16 GB | 5023 |
| Acer Nitro 5 AN517-55-738R | i7-12700H 115 W / 80 W | GeForce RTX 3060 Laptop GPU 80 W 1425 / 1750 MHz 6 GB | 16 GB | 5030.5 |
| Asus Zenbook Pro 14 Duo OLED UX8402ZA 6.0.1 x64 1024 MiB [C: 10.6% (50.3/475.6 GiB)] (x5) [Interval=5 sec] | i7-12700H 80 W / 60 W | Iris Xe G7 96EUs 1400 / 2400 MHz | 16 GB | 5038.4 |
| Gigabyte Aero 17 HDR YD | i9-11980HK 109 W / 70 W | GeForce RTX 3080 Laptop GPU 105 W 1245 / 1500 MHz 16 GB | 32 GB | 5043 |
| Intel NUC 13 Pro Desk Edition Kit | i7-1360P 64 W / 40 W | Iris Xe G7 96EUs | 32 GB | 5045.3 |
| Dell XPS 13 Plus 9320 Core i7-1360P | i7-1360P 64 W / 34 W | Iris Xe G7 96EUs 1500 / 2600 MHz | 16 GB | 5057 |
| Lenovo ThinkPad P1 G4-20Y30017GE 6.0.1 x64 1024 MiB [C: 9.8% (46.6/475.7 GiB)] (x5) [Interval=5 sec] | i7-11800H 54 W / 37 W | T1200 Laptop GPU 1840 / 1255 MHz 4 GB | 16 GB | 5089 |
| Uniwill GM6PX7X RTX 4070 | i7-13700HX 130 W / 122 W | GeForce RTX 4070 Laptop GPU 140 W 2275 / 2125 MHz 8 GB | 32 GB | 5098 |
| Intel NUC 13 Pro Kit NUC13ANK | i7-1360P 64 W / 40 W | Iris Xe G7 96EUs | 32 GB | 5113 |
| Samsung Galaxy Book3 Ultra 16 | i7-13700H 75 W / 45 W | GeForce RTX 4050 Laptop GPU 60 W 1605 / 2000 MHz 6 GB | 16 GB | 5115 |
| Honor MagicBook 14 2022 6.0.1 x64 1024 MiB [C: 42.2% (50.7/120.0 GiB)] (x5) [Interval=5 sec] | i5-12500H 84 W / 56 W | GeForce RTX 2050 Mobile 60 W 1732 / 1750 MHz 4 GB | 16 GB | 5118.5 |
| Lenovo ThinkPad X1 Yoga G7 21CE002HGE 6.0.1 x64 1024 MiB [C: 10.6% (50.1/474.7 GiB)] (x5) [Interval=5 sec] | i7-1270P 64 W / 28 W | Iris Xe G7 96EUs 1400 MHz | 16 GB | 5118.6 |
| LG Gram 17 (2022) | i5-1240P 43 W / 25 W | Iris Xe G7 80EUs 1300 MHz | 16 GB | 5121 |
| Samsung Galaxy Book4 Ultra 6.0.1 x64 1024 MiB [C: 13.9% (63.1/454.8 GiB)] (x5) [Interval=5 sec] | Ultra 7 155H 65 W / 45 W | GeForce RTX 4050 Laptop GPU 80 W 2055 / 2000 MHz 6 GB | 16 GB | 5123 |
| Model | CPU | GPU | RAM | Value |
|---|---|---|---|---|
| MSI Katana GF66 12UGS | i7-12700H 100 W / 38 W | GeForce RTX 3070 Ti Laptop GPU 105 W 1035 / 1500 MHz 8 GB | 16 GB | 957.6 |
| Acer Swift 3 SF314-71-56U3 | i5-12500H 80 W / 35 W | Iris Xe G7 80EUs 1.300 / 3.200 MHz | 16 GB | 3099 |
| Asus ROG Zephyrus G14 GA402RJ | R7 6800HS 125 W / 100 W | Radeon RX 6700S 105 W 2210 / 1750 MHz 8 GB | 16 GB | 3592 |
| Acer Aspire Vero AV14-51-72DL | i7-1255U 55 W / 30 W | Iris Xe G7 96EUs 1250 / 2133 MHz | 16 GB | 3597 |
| MSI Crosshair 15 R6E B12UGZ-050 | i7-12700H 121 W / 85 W | GeForce RTX 3070 Laptop GPU 140 W 1610 MHz 8 GB | 16 GB | 3664 |
| Model | CPU | GPU | RAM | Value |
|---|---|---|---|---|
| Lenovo ThinkBook 13x G1-20WJ001KGE | i7-1160G7 40 W / 20 W | Iris Xe G7 96EUs | 16 GB | 1770 |
| Dell XPS 13 9305 Core i5 FHD | i5-1135G7 60 W / 15 W | Iris Xe G7 80EUs 28 W | 8 GB | 3427 |
| Honor MagicBook 16 2022 6.0.1 x64 1024 MiB [C: 44.6% (53.5/120.0 GiB)] (x5) [Interval=5 sec] | R5 5600H 65 W / 54 W | Vega 7 1800 / 1600 MHz | 16 GB | 3569.5 |
| Dynabook Portégé X30L-K-139 6.0.1 x64 1024 MiB [C: 9.8% (44.9/459.0 GiB)] (x5) [Interval=5 sec] | i5-1240P 64 W / 15 W | Iris Xe G7 80EUs | 16 GB | 5936.9 |
| Dell XPS 13 Plus 9320 Core i7-1360P | i7-1360P 64 W / 34 W | Iris Xe G7 96EUs 1500 / 2600 MHz | 16 GB | 6072 |
| Lenovo ThinkPad P1 G4-20Y30017GE 6.0.1 x64 1024 MiB [C: 9.8% (46.6/475.7 GiB)] (x5) [Interval=5 sec] | i7-11800H 54 W / 37 W | T1200 Laptop GPU 1840 / 1255 MHz 4 GB | 16 GB | 6088 |
| Dell Latitude 3440 | i5-1345U 32 W / 18 W | Iris Xe G7 80EUs 1200 MHz | 16 GB | 6560 |
| Lenovo Yoga Slim 7i Pro 14IAP G7 | i5-1240P 64 W / 50 W | Iris Xe G7 80EUs 1300 MHz | 16 GB | 6673 |
| Lenovo IdeaPad 5 Pro 16ARH7 | R5 6600HS 60 W / 42 W | Radeon 660M 1900 / 1067 MHz 2 GB | 16 GB | 6711 |
| Lenovo ThinkPad P1 G4-20Y4Z9DVUS 6.0.1 x64 1024 MiB [C: 16.2% (76.9/475.7 GiB)] (x5) [Interval=5 sec] | i7-11800H 100 W / 60 W | T1200 Laptop GPU 60 W 1840 / 1255 MHz 4 GB | 16 GB | 6725 |
| MSI Prestige 14 Evo A11MO-026US | i7-1195G7 64 W / 36 W | Iris Xe G7 96EUs | 16 GB | 6737 |
| HP EliteBook 8 Flip G1i 13 | Ultra 7 265U 58 W / 24 W | Graphics 4-Core iGPU (Arrow Lake) 2100 MHz | 16 GB | 6763 |
| LG Gram 14Z90Q | i5-1240P 43 W / 24 W | Iris Xe G7 80EUs 1300 / 2600 MHz | 16 GB | 6771 |
| HP Victus 15 fa0020nr | i7-12700H 95 W / 45 W | GeForce RTX 3050 Ti Laptop GPU 75 W 1485 / 1468 MHz 4 GB | 8 GB | 6781 |
| Schenker Uniwill Technology GM7AG8P | i9-12900H 75 W / 75 W | GeForce RTX 3080 Ti Laptop GPU 1590 / 2000 MHz 16 GB | 32 GB | 6790 |
| Asus Zenbook Pro 14 Duo OLED UX8402ZA 6.0.1 x64 1024 MiB [C: 10.6% (50.3/475.6 GiB)] (x5) [Interval=5 sec] | i7-12700H 80 W / 60 W | Iris Xe G7 96EUs 1400 / 2400 MHz | 16 GB | 6799.6 |
| VAIO Z VJZ141C11L | i7-11375H 64 W / 64 W | Iris Xe G7 96EUs 2000 / 1350 MHz | 16 GB | 6804 |
| Aorus 17G YD | i7-11800H 109 W / 45 W | GeForce RTX 3080 Laptop GPU 105 W 1245 / 1500 MHz 16 GB | 32 GB | 6806 |
| Lenovo ThinkPad X1 Yoga G7 21CE002HGE 6.0.1 x64 1024 MiB [C: 10.6% (50.1/474.7 GiB)] (x5) [Interval=5 sec] | i7-1270P 64 W / 28 W | Iris Xe G7 96EUs 1400 MHz | 16 GB | 6819.6 |
| Gigabyte Aero 17 HDR YD | i9-11980HK 109 W / 70 W | GeForce RTX 3080 Laptop GPU 105 W 1245 / 1500 MHz 16 GB | 32 GB | 6821 |
| Lenovo ThinkBook Plus Gen2 Core i5 | i5-1130G7 25 W / 12 W | Iris Xe G7 80EUs | 16 GB | 6822 |
| VAIO SX12 VJS124X1011P | i5-1155G7 58 W / 27 W | Iris Xe G7 80EUs 1350 / 2000 MHz | 16 GB | 6834 |
| Lenovo ThinkPad X1 Carbon G9-20XW0089GE 6.0.1 x64 1024 MiB [C: 31.0% (147.7/475.7 GiB)] (x5) [Interval=5 sec] | i5-1135G7 34 W / 27 W | Iris Xe G7 80EUs | 16 GB | 6838 |
| Acer Nitro 5 AN517-55-738R | i7-12700H 115 W / 80 W | GeForce RTX 3060 Laptop GPU 80 W 1425 / 1750 MHz 6 GB | 16 GB | 6841.3 |
| LG Gram 17 (2022) | i5-1240P 43 W / 25 W | Iris Xe G7 80EUs 1300 MHz | 16 GB | 6846 |
| Uniwill GM6PX7X RTX 4070 | i7-13700HX 130 W / 122 W | GeForce RTX 4070 Laptop GPU 140 W 2275 / 2125 MHz 8 GB | 32 GB | 6850 |
| Samsung Galaxy Book3 Ultra 16 | i7-13700H 75 W / 45 W | GeForce RTX 4050 Laptop GPU 60 W 1605 / 2000 MHz 6 GB | 16 GB | 6850 |
| Intel NUC 13 Pro Kit NUC13ANK | i7-1360P 64 W / 40 W | Iris Xe G7 96EUs | 32 GB | 6854.1 |
| Samsung Galaxy Book4 Ultra 6.0.1 x64 1024 MiB [C: 13.9% (63.1/454.8 GiB)] (x5) [Interval=5 sec] | Ultra 7 155H 65 W / 45 W | GeForce RTX 4050 Laptop GPU 80 W 2055 / 2000 MHz 6 GB | 16 GB | 6862 |
| Honor MagicBook 14 2022 6.0.1 x64 1024 MiB [C: 42.2% (50.7/120.0 GiB)] (x5) [Interval=5 sec] | i5-12500H 84 W / 56 W | GeForce RTX 2050 Mobile 60 W 1732 / 1750 MHz 4 GB | 16 GB | 6866.5 |
| Intel NUC 13 Pro Desk Edition Kit | i7-1360P 64 W / 40 W | Iris Xe G7 96EUs | 32 GB | 6867.3 |
| Model | CPU | GPU | RAM | Value |
|---|---|---|---|---|
| MSI Katana GF66 12UGS | i7-12700H 100 W / 38 W | GeForce RTX 3070 Ti Laptop GPU 105 W 1035 / 1500 MHz 8 GB | 16 GB | 215 |
| MSI Crosshair 15 R6E B12UGZ-050 | i7-12700H 121 W / 85 W | GeForce RTX 3070 Laptop GPU 140 W 1610 MHz 8 GB | 16 GB | 2128.6 |
| Model | CPU | GPU | RAM | Value |
|---|---|---|---|---|
| Dynabook Portégé X30L-K-139 6.0.1 x64 1024 MiB [C: 9.8% (44.9/459.0 GiB)] (x5) [Interval=5 sec] | i5-1240P 64 W / 15 W | Iris Xe G7 80EUs | 16 GB | 267.03 |
| Lenovo ThinkPad P1 G4-20Y4Z9DVUS 6.0.1 x64 1024 MiB [C: 16.2% (76.9/475.7 GiB)] (x5) [Interval=5 sec] | i7-11800H 100 W / 60 W | T1200 Laptop GPU 60 W 1840 / 1255 MHz 4 GB | 16 GB | 293.7 |
| Asus Zenbook Pro 14 Duo OLED UX8402ZA 6.0.1 x64 1024 MiB [C: 10.6% (50.3/475.6 GiB)] (x5) [Interval=5 sec] | i7-12700H 80 W / 60 W | Iris Xe G7 96EUs 1400 / 2400 MHz | 16 GB | 429.44 |
| Intel NUC 13 Pro Desk Edition Kit | i7-1360P 64 W / 40 W | Iris Xe G7 96EUs | 32 GB | 438.8 |
| Intel NUC 13 Pro Kit NUC13ANK | i7-1360P 64 W / 40 W | Iris Xe G7 96EUs | 32 GB | 618.5 |
| Lenovo ThinkPad X1 Yoga G7 21CE002HGE 6.0.1 x64 1024 MiB [C: 10.6% (50.1/474.7 GiB)] (x5) [Interval=5 sec] | i7-1270P 64 W / 28 W | Iris Xe G7 96EUs 1400 MHz | 16 GB | 1488.7 |
| Samsung Galaxy Book4 Ultra 6.0.1 x64 1024 MiB [C: 13.9% (63.1/454.8 GiB)] (x5) [Interval=5 sec] | Ultra 7 155H 65 W / 45 W | GeForce RTX 4050 Laptop GPU 80 W 2055 / 2000 MHz 6 GB | 16 GB | 1679 |
| Acer Nitro 5 AN517-55-738R | i7-12700H 115 W / 80 W | GeForce RTX 3060 Laptop GPU 80 W 1425 / 1750 MHz 6 GB | 16 GB | 1777.3 |
| Lenovo ThinkPad X1 Carbon G9-20XW0089GE 6.0.1 x64 1024 MiB [C: 31.0% (147.7/475.7 GiB)] (x5) [Interval=5 sec] | i5-1135G7 34 W / 27 W | Iris Xe G7 80EUs | 16 GB | 2015 |
| Lenovo ThinkPad P1 G4-20Y30017GE 6.0.1 x64 1024 MiB [C: 9.8% (46.6/475.7 GiB)] (x5) [Interval=5 sec] | i7-11800H 54 W / 37 W | T1200 Laptop GPU 1840 / 1255 MHz 4 GB | 16 GB | 2021 |
| Honor MagicBook 16 2022 6.0.1 x64 1024 MiB [C: 44.6% (53.5/120.0 GiB)] (x5) [Interval=5 sec] | R5 5600H 65 W / 54 W | Vega 7 1800 / 1600 MHz | 16 GB | 2328.65 |
| Honor MagicBook 14 2022 6.0.1 x64 1024 MiB [C: 42.2% (50.7/120.0 GiB)] (x5) [Interval=5 sec] | i5-12500H 84 W / 56 W | GeForce RTX 2050 Mobile 60 W 1732 / 1750 MHz 4 GB | 16 GB | 2910.25 |
| Model | CPU | GPU | RAM | Value |
|---|---|---|---|---|
| MSI Katana GF66 12UGS | i7-12700H 100 W / 38 W | GeForce RTX 3070 Ti Laptop GPU 105 W 1035 / 1500 MHz 8 GB | 16 GB | 214.2 |
| MSI Crosshair 15 R6E B12UGZ-050 | i7-12700H 121 W / 85 W | GeForce RTX 3070 Laptop GPU 140 W 1610 MHz 8 GB | 16 GB | 1665.4 |
| Model | CPU | GPU | RAM | Value |
|---|---|---|---|---|
| Dynabook Portégé X30L-K-139 6.0.1 x64 1024 MiB [C: 9.8% (44.9/459.0 GiB)] (x5) [Interval=5 sec] | i5-1240P 64 W / 15 W | Iris Xe G7 80EUs | 16 GB | 598.73 |
| Intel NUC 13 Pro Desk Edition Kit | i7-1360P 64 W / 40 W | Iris Xe G7 96EUs | 32 GB | 813.5 |
| Asus Zenbook Pro 14 Duo OLED UX8402ZA 6.0.1 x64 1024 MiB [C: 10.6% (50.3/475.6 GiB)] (x5) [Interval=5 sec] | i7-12700H 80 W / 60 W | Iris Xe G7 96EUs 1400 / 2400 MHz | 16 GB | 1000.09 |
| Lenovo ThinkPad P1 G4-20Y4Z9DVUS 6.0.1 x64 1024 MiB [C: 16.2% (76.9/475.7 GiB)] (x5) [Interval=5 sec] | i7-11800H 100 W / 60 W | T1200 Laptop GPU 60 W 1840 / 1255 MHz 4 GB | 16 GB | 1077 |
| Intel NUC 13 Pro Kit NUC13ANK | i7-1360P 64 W / 40 W | Iris Xe G7 96EUs | 32 GB | 1204.6 |
| Lenovo ThinkPad X1 Yoga G7 21CE002HGE 6.0.1 x64 1024 MiB [C: 10.6% (50.1/474.7 GiB)] (x5) [Interval=5 sec] | i7-1270P 64 W / 28 W | Iris Xe G7 96EUs 1400 MHz | 16 GB | 1961.89 |
| Acer Nitro 5 AN517-55-738R | i7-12700H 115 W / 80 W | GeForce RTX 3060 Laptop GPU 80 W 1425 / 1750 MHz 6 GB | 16 GB | 2125.4 |
| Samsung Galaxy Book4 Ultra 6.0.1 x64 1024 MiB [C: 13.9% (63.1/454.8 GiB)] (x5) [Interval=5 sec] | Ultra 7 155H 65 W / 45 W | GeForce RTX 4050 Laptop GPU 80 W 2055 / 2000 MHz 6 GB | 16 GB | 2248 |
| Lenovo ThinkPad P1 G4-20Y30017GE 6.0.1 x64 1024 MiB [C: 9.8% (46.6/475.7 GiB)] (x5) [Interval=5 sec] | i7-11800H 54 W / 37 W | T1200 Laptop GPU 1840 / 1255 MHz 4 GB | 16 GB | 2328 |
| Lenovo ThinkPad X1 Carbon G9-20XW0089GE 6.0.1 x64 1024 MiB [C: 31.0% (147.7/475.7 GiB)] (x5) [Interval=5 sec] | i5-1135G7 34 W / 27 W | Iris Xe G7 80EUs | 16 GB | 2414 |
| Honor MagicBook 16 2022 6.0.1 x64 1024 MiB [C: 44.6% (53.5/120.0 GiB)] (x5) [Interval=5 sec] | R5 5600H 65 W / 54 W | Vega 7 1800 / 1600 MHz | 16 GB | 2497.74 |
| Honor MagicBook 14 2022 6.0.1 x64 1024 MiB [C: 42.2% (50.7/120.0 GiB)] (x5) [Interval=5 sec] | i5-12500H 84 W / 56 W | GeForce RTX 2050 Mobile 60 W 1732 / 1750 MHz 4 GB | 16 GB | 2687.03 |
| Model | CPU | GPU | RAM | Value |
|---|---|---|---|---|
| Acer Swift 3 SF314-71-56U3 | i5-12500H 80 W / 35 W | Iris Xe G7 80EUs 1.300 / 3.200 MHz | 16 GB | 5102 |
| Model | CPU | GPU | RAM | Value |
|---|---|---|---|---|
| Lenovo Yoga Slim 7i Pro 14IAP G7 | i5-1240P 64 W / 50 W | Iris Xe G7 80EUs 1300 MHz | 16 GB | 5049 |
| Model | CPU | GPU | RAM | Value |
|---|---|---|---|---|
| Asus ZenBook 14X UX3404VC | i9-13900H 115 W / 45 W | Iris Xe G7 96EUs | 16 GB | 182.1 |
| Acer Swift 3 SF314-71-56U3 | i5-12500H 80 W / 35 W | Iris Xe G7 80EUs 1.300 / 3.200 MHz | 16 GB | 210 |
| Acer Aspire Vero AV14-51-72DL | i7-1255U 55 W / 30 W | Iris Xe G7 96EUs 1250 / 2133 MHz | 16 GB | 215 |
| Asus ROG Zephyrus G14 GA402RJ | R7 6800HS 125 W / 100 W | Radeon RX 6700S 105 W 2210 / 1750 MHz 8 GB | 16 GB | 225 |
| MSI Vector GP76 12UGS-434 | i7-12700H 65 W / 45 W | GeForce RTX 3070 Ti Laptop GPU 150 W 1585 / 1750 MHz 8 GB | 16 GB | 386 |
| MSI Katana GF66 12UGS | i7-12700H 100 W / 38 W | GeForce RTX 3070 Ti Laptop GPU 105 W 1035 / 1500 MHz 8 GB | 16 GB | 403 |
| MSI Crosshair 15 R6E B12UGZ-050 | i7-12700H 121 W / 85 W | GeForce RTX 3070 Laptop GPU 140 W 1610 MHz 8 GB | 16 GB | 421 |
| Acer Aspire 5 A515-58GM-76S8 | i7-1355U 55 W / 28 W | GeForce RTX 2050 Mobile 35 W 1155 / 1500 MHz 4 GB | 16 GB | 429 |
| Model | CPU | GPU | RAM | Value |
|---|---|---|---|---|
| Asus ROG Zephyrus G14 GA402RJ | R7 6800HS 125 W / 100 W | Radeon RX 6700S 105 W 2210 / 1750 MHz 8 GB | 16 GB | 59.7 |
| Asus ZenBook 14X UX3404VC | i9-13900H 115 W / 45 W | Iris Xe G7 96EUs | 16 GB | 64 |
| MSI Crosshair 15 R6E B12UGZ-050 | i7-12700H 121 W / 85 W | GeForce RTX 3070 Laptop GPU 140 W 1610 MHz 8 GB | 16 GB | 66.5 |
| Acer Swift 3 SF314-71-56U3 | i5-12500H 80 W / 35 W | Iris Xe G7 80EUs 1.300 / 3.200 MHz | 16 GB | 69.4 |
| Acer Aspire Vero AV14-51-72DL | i7-1255U 55 W / 30 W | Iris Xe G7 96EUs 1250 / 2133 MHz | 16 GB | 70.3 |
| Acer Aspire 5 A515-58GM-76S8 | i7-1355U 55 W / 28 W | GeForce RTX 2050 Mobile 35 W 1155 / 1500 MHz 4 GB | 16 GB | 70.3 |
| MSI Vector GP76 12UGS-434 | i7-12700H 65 W / 45 W | GeForce RTX 3070 Ti Laptop GPU 150 W 1585 / 1750 MHz 8 GB | 16 GB | 70.9 |
| MSI Katana GF66 12UGS | i7-12700H 100 W / 38 W | GeForce RTX 3070 Ti Laptop GPU 105 W 1035 / 1500 MHz 8 GB | 16 GB | 70.9 |
| Model | CPU | GPU | RAM | Value |
|---|---|---|---|---|
| Asus ZenBook 14X UX3404VC | i9-13900H 115 W / 45 W | Iris Xe G7 96EUs | 16 GB | 503 |
| Asus ROG Zephyrus G14 GA402RJ | R7 6800HS 125 W / 100 W | Radeon RX 6700S 105 W 2210 / 1750 MHz 8 GB | 16 GB | 2074 |
| Acer Aspire Vero AV14-51-72DL | i7-1255U 55 W / 30 W | Iris Xe G7 96EUs 1250 / 2133 MHz | 16 GB | 2202 |
| Acer Swift 3 SF314-71-56U3 | i5-12500H 80 W / 35 W | Iris Xe G7 80EUs 1.300 / 3.200 MHz | 16 GB | 2502 |
| MSI Katana GF66 12UGS | i7-12700H 100 W / 38 W | GeForce RTX 3070 Ti Laptop GPU 105 W 1035 / 1500 MHz 8 GB | 16 GB | 2571 |
| Acer Aspire 5 A515-58GM-76S8 | i7-1355U 55 W / 28 W | GeForce RTX 2050 Mobile 35 W 1155 / 1500 MHz 4 GB | 16 GB | 3254 |
| MSI Vector GP76 12UGS-434 | i7-12700H 65 W / 45 W | GeForce RTX 3070 Ti Laptop GPU 150 W 1585 / 1750 MHz 8 GB | 16 GB | 3361 |
| MSI Crosshair 15 R6E B12UGZ-050 | i7-12700H 121 W / 85 W | GeForce RTX 3070 Laptop GPU 140 W 1610 MHz 8 GB | 16 GB | 3373 |
| Model | CPU | GPU | RAM | Value |
|---|---|---|---|---|
| Asus ZenBook 14X UX3404VC | i9-13900H 115 W / 45 W | Iris Xe G7 96EUs | 16 GB | 677 |
| Asus ROG Zephyrus G14 GA402RJ | R7 6800HS 125 W / 100 W | Radeon RX 6700S 105 W 2210 / 1750 MHz 8 GB | 16 GB | 1846 |
| Acer Aspire 5 A515-58GM-76S8 | i7-1355U 55 W / 28 W | GeForce RTX 2050 Mobile 35 W 1155 / 1500 MHz 4 GB | 16 GB | 1846 |
| MSI Katana GF66 12UGS | i7-12700H 100 W / 38 W | GeForce RTX 3070 Ti Laptop GPU 105 W 1035 / 1500 MHz 8 GB | 16 GB | 1849 |
| MSI Vector GP76 12UGS-434 | i7-12700H 65 W / 45 W | GeForce RTX 3070 Ti Laptop GPU 150 W 1585 / 1750 MHz 8 GB | 16 GB | 1860 |
| MSI Crosshair 15 R6E B12UGZ-050 | i7-12700H 121 W / 85 W | GeForce RTX 3070 Laptop GPU 140 W 1610 MHz 8 GB | 16 GB | 1860 |
| Acer Swift 3 SF314-71-56U3 | i5-12500H 80 W / 35 W | Iris Xe G7 80EUs 1.300 / 3.200 MHz | 16 GB | 1861 |
| Acer Aspire Vero AV14-51-72DL | i7-1255U 55 W / 30 W | Iris Xe G7 96EUs 1250 / 2133 MHz | 16 GB | 1864 |
| Model | CPU | GPU | RAM | Value |
|---|---|---|---|---|
| Asus ZenBook 14X UX3404VC | i9-13900H 115 W / 45 W | Iris Xe G7 96EUs | 16 GB | 3024 |
| Asus ROG Zephyrus G14 GA402RJ | R7 6800HS 125 W / 100 W | Radeon RX 6700S 105 W 2210 / 1750 MHz 8 GB | 16 GB | 3237 |
| Acer Swift 3 SF314-71-56U3 | i5-12500H 80 W / 35 W | Iris Xe G7 80EUs 1.300 / 3.200 MHz | 16 GB | 3364 |
| MSI Katana GF66 12UGS | i7-12700H 100 W / 38 W | GeForce RTX 3070 Ti Laptop GPU 105 W 1035 / 1500 MHz 8 GB | 16 GB | 3365 |
| Acer Aspire Vero AV14-51-72DL | i7-1255U 55 W / 30 W | Iris Xe G7 96EUs 1250 / 2133 MHz | 16 GB | 3385 |
| Acer Aspire 5 A515-58GM-76S8 | i7-1355U 55 W / 28 W | GeForce RTX 2050 Mobile 35 W 1155 / 1500 MHz 4 GB | 16 GB | 3392 |
| MSI Crosshair 15 R6E B12UGZ-050 | i7-12700H 121 W / 85 W | GeForce RTX 3070 Laptop GPU 140 W 1610 MHz 8 GB | 16 GB | 3395 |
| MSI Vector GP76 12UGS-434 | i7-12700H 65 W / 45 W | GeForce RTX 3070 Ti Laptop GPU 150 W 1585 / 1750 MHz 8 GB | 16 GB | 3446 |
| Model | CPU | GPU | RAM | Value |
|---|---|---|---|---|
| MSI Katana GF66 12UGS | i7-12700H 100 W / 38 W | GeForce RTX 3070 Ti Laptop GPU 105 W 1035 / 1500 MHz 8 GB | 16 GB | 2031 |
| Asus ROG Zephyrus G14 GA402RJ | R7 6800HS 125 W / 100 W | Radeon RX 6700S 105 W 2210 / 1750 MHz 8 GB | 16 GB | 2083 |
| MSI Crosshair 15 R6E B12UGZ-050 | i7-12700H 121 W / 85 W | GeForce RTX 3070 Laptop GPU 140 W 1610 MHz 8 GB | 16 GB | 2156 |
| Acer Swift 3 SF314-71-56U3 | i5-12500H 80 W / 35 W | Iris Xe G7 80EUs 1.300 / 3.200 MHz | 16 GB | 2172 |
| Asus ZenBook 14X UX3404VC | i9-13900H 115 W / 45 W | Iris Xe G7 96EUs | 16 GB | 2203 |
| Acer Aspire 5 A515-58GM-76S8 | i7-1355U 55 W / 28 W | GeForce RTX 2050 Mobile 35 W 1155 / 1500 MHz 4 GB | 16 GB | 2253 |
| Acer Aspire Vero AV14-51-72DL | i7-1255U 55 W / 30 W | Iris Xe G7 96EUs 1250 / 2133 MHz | 16 GB | 2257 |
| MSI Vector GP76 12UGS-434 | i7-12700H 65 W / 45 W | GeForce RTX 3070 Ti Laptop GPU 150 W 1585 / 1750 MHz 8 GB | 16 GB | 2305 |
| Model | CPU | GPU | RAM | Value |
|---|---|---|---|---|
| Asus ROG Zephyrus G14 GA402RJ | R7 6800HS 125 W / 100 W | Radeon RX 6700S 105 W 2210 / 1750 MHz 8 GB | 16 GB | 3287 |
| Acer Swift 3 SF314-71-56U3 | i5-12500H 80 W / 35 W | Iris Xe G7 80EUs 1.300 / 3.200 MHz | 16 GB | 3379 |
| MSI Katana GF66 12UGS | i7-12700H 100 W / 38 W | GeForce RTX 3070 Ti Laptop GPU 105 W 1035 / 1500 MHz 8 GB | 16 GB | 3390 |
| Acer Aspire Vero AV14-51-72DL | i7-1255U 55 W / 30 W | Iris Xe G7 96EUs 1250 / 2133 MHz | 16 GB | 3410 |
| Acer Aspire 5 A515-58GM-76S8 | i7-1355U 55 W / 28 W | GeForce RTX 2050 Mobile 35 W 1155 / 1500 MHz 4 GB | 16 GB | 3410 |
| Asus ZenBook 14X UX3404VC | i9-13900H 115 W / 45 W | Iris Xe G7 96EUs | 16 GB | 3443 |
| MSI Vector GP76 12UGS-434 | i7-12700H 65 W / 45 W | GeForce RTX 3070 Ti Laptop GPU 150 W 1585 / 1750 MHz 8 GB | 16 GB | 3481 |
| MSI Crosshair 15 R6E B12UGZ-050 | i7-12700H 121 W / 85 W | GeForce RTX 3070 Laptop GPU 140 W 1610 MHz 8 GB | 16 GB | 3497 |
| Model | CPU | GPU | RAM | Value |
|---|---|---|---|---|
| Acer Swift 3 SF314-71-56U3 | i5-12500H 80 W / 35 W | Iris Xe G7 80EUs 1.300 / 3.200 MHz | 16 GB | 3355 |
| MSI Katana GF66 12UGS | i7-12700H 100 W / 38 W | GeForce RTX 3070 Ti Laptop GPU 105 W 1035 / 1500 MHz 8 GB | 16 GB | 3372 |
| Acer Aspire Vero AV14-51-72DL | i7-1255U 55 W / 30 W | Iris Xe G7 96EUs 1250 / 2133 MHz | 16 GB | 3536 |
| Acer Aspire 5 A515-58GM-76S8 | i7-1355U 55 W / 28 W | GeForce RTX 2050 Mobile 35 W 1155 / 1500 MHz 4 GB | 16 GB | 3538 |
| Asus ROG Zephyrus G14 GA402RJ | R7 6800HS 125 W / 100 W | Radeon RX 6700S 105 W 2210 / 1750 MHz 8 GB | 16 GB | 3563 |
| Asus ZenBook 14X UX3404VC | i9-13900H 115 W / 45 W | Iris Xe G7 96EUs | 16 GB | 3576 |
| MSI Vector GP76 12UGS-434 | i7-12700H 65 W / 45 W | GeForce RTX 3070 Ti Laptop GPU 150 W 1585 / 1750 MHz 8 GB | 16 GB | 3638 |
| MSI Crosshair 15 R6E B12UGZ-050 | i7-12700H 121 W / 85 W | GeForce RTX 3070 Laptop GPU 140 W 1610 MHz 8 GB | 16 GB | 3652 |
| Model | CPU | GPU | RAM | Value |
|---|---|---|---|---|
| Acer Aspire Vero AV14-51-72DL | i7-1255U 55 W / 30 W | Iris Xe G7 96EUs 1250 / 2133 MHz | 16 GB | 1823 |
| Acer Swift 3 SF314-71-56U3 | i5-12500H 80 W / 35 W | Iris Xe G7 80EUs 1.300 / 3.200 MHz | 16 GB | 2332 |
| Acer Aspire 5 A515-58GM-76S8 | i7-1355U 55 W / 28 W | GeForce RTX 2050 Mobile 35 W 1155 / 1500 MHz 4 GB | 16 GB | 3136 |
| MSI Katana GF66 12UGS | i7-12700H 100 W / 38 W | GeForce RTX 3070 Ti Laptop GPU 105 W 1035 / 1500 MHz 8 GB | 16 GB | 3338 |
| MSI Crosshair 15 R6E B12UGZ-050 | i7-12700H 121 W / 85 W | GeForce RTX 3070 Laptop GPU 140 W 1610 MHz 8 GB | 16 GB | 3477 |
| Asus ROG Zephyrus G14 GA402RJ | R7 6800HS 125 W / 100 W | Radeon RX 6700S 105 W 2210 / 1750 MHz 8 GB | 16 GB | 3540 |
| Asus ZenBook 14X UX3404VC | i9-13900H 115 W / 45 W | Iris Xe G7 96EUs | 16 GB | 3572 |
| MSI Vector GP76 12UGS-434 | i7-12700H 65 W / 45 W | GeForce RTX 3070 Ti Laptop GPU 150 W 1585 / 1750 MHz 8 GB | 16 GB | 3594 |
Average Benchmarks Micron 2450 1TB MTFDKBA1T0TFK → 100% n=34
Average Benchmarks Samsung PM9A1 MZVL2512HCJQ → 131% n=34
* Smaller numbers mean a higher performance
1 This benchmark is not used for the average calculation
#0 ran 0s before starting gpusingle class +0s ... 0s
#1 checking url part for id 3813 +0s ... 0s
#2 checking url part for id 3627 +0s ... 0s
#3 redirected to Ajax server, took 1765774891s time from redirect:0 +0s ... 0s
#4 did not recreate cache, as it is less than 5 days old! Created at Sat, 13 Dec 2025 19:29:25 +0100 +0s ... 0s
#5 composed specs +0.002s ... 0.002s
#6 did output specs +0s ... 0.002s
#7 getting avg benchmarks for device 3813 +0.006s ... 0.009s
#8 got single benchmarks 3813 +0.007s ... 0.016s
#9 getting avg benchmarks for device 3627 +0.004s ... 0.02s
#10 got single benchmarks 3627 +0.032s ... 0.051s
#11 got avg benchmarks for devices +0s ... 0.051s
#12 min, max, avg, median took s +0.144s ... 0.195s
#13 return log +0.003s ... 0.199s