Intel Core i9-14900HX vs Intel Core Ultra 7 155H
Intel Core i9-14900HX ► remove from comparison
The Intel Core i9-14900HX is a high-end CPU based on the Raptor Lake architecture for large and heavy notebooks. The CPU was introduced at the beginning of 2024 and is a slightly higher clocked variant of the older Core i9-13980HX .
The total of 32 threads are divided into P-cores and E-cores, which we already know from Alder-Lake. Here, 8 performance cores (P-cores) with hyperthreading are used and 16 efficiency cores, so that a total of 32 threads can be processed simultaneously. The P-cores clock from 2.2 GHz (base clock) to 5.8 GHz (single-core turbo) and the E-cores from 1.6 GHz to 4.1 GHz.
Performance
Due to the slightly higher maximum clock rates, the single-core performance of the 14900HX in particular increases slightly compared to the 13980HX . Compared to AMD's top model, the Ryzen 9 7945HX or 7945HX3D the 14900HX comes in just behind (on average in our benchmarks). However, the performance depends on the benchmark and the cooling and is usually very comparable.
Graphics unit
Like the Intel Core i9-12900HX , the Intel Core i9-14900HX offers an integrated graphics unit. The Intel Iris XE architecture continues to serve as the basis. In terms of performance, however, not much has changed with the Intel UHD Graphics 770 .
The 14900HX is manufactured in the improved 10nm FinFET process at Intel (Intel 7 process) and is specified with 55 watts of base power and 157 watts of turbo power.
Intel Core Ultra 7 155H ► remove from comparison
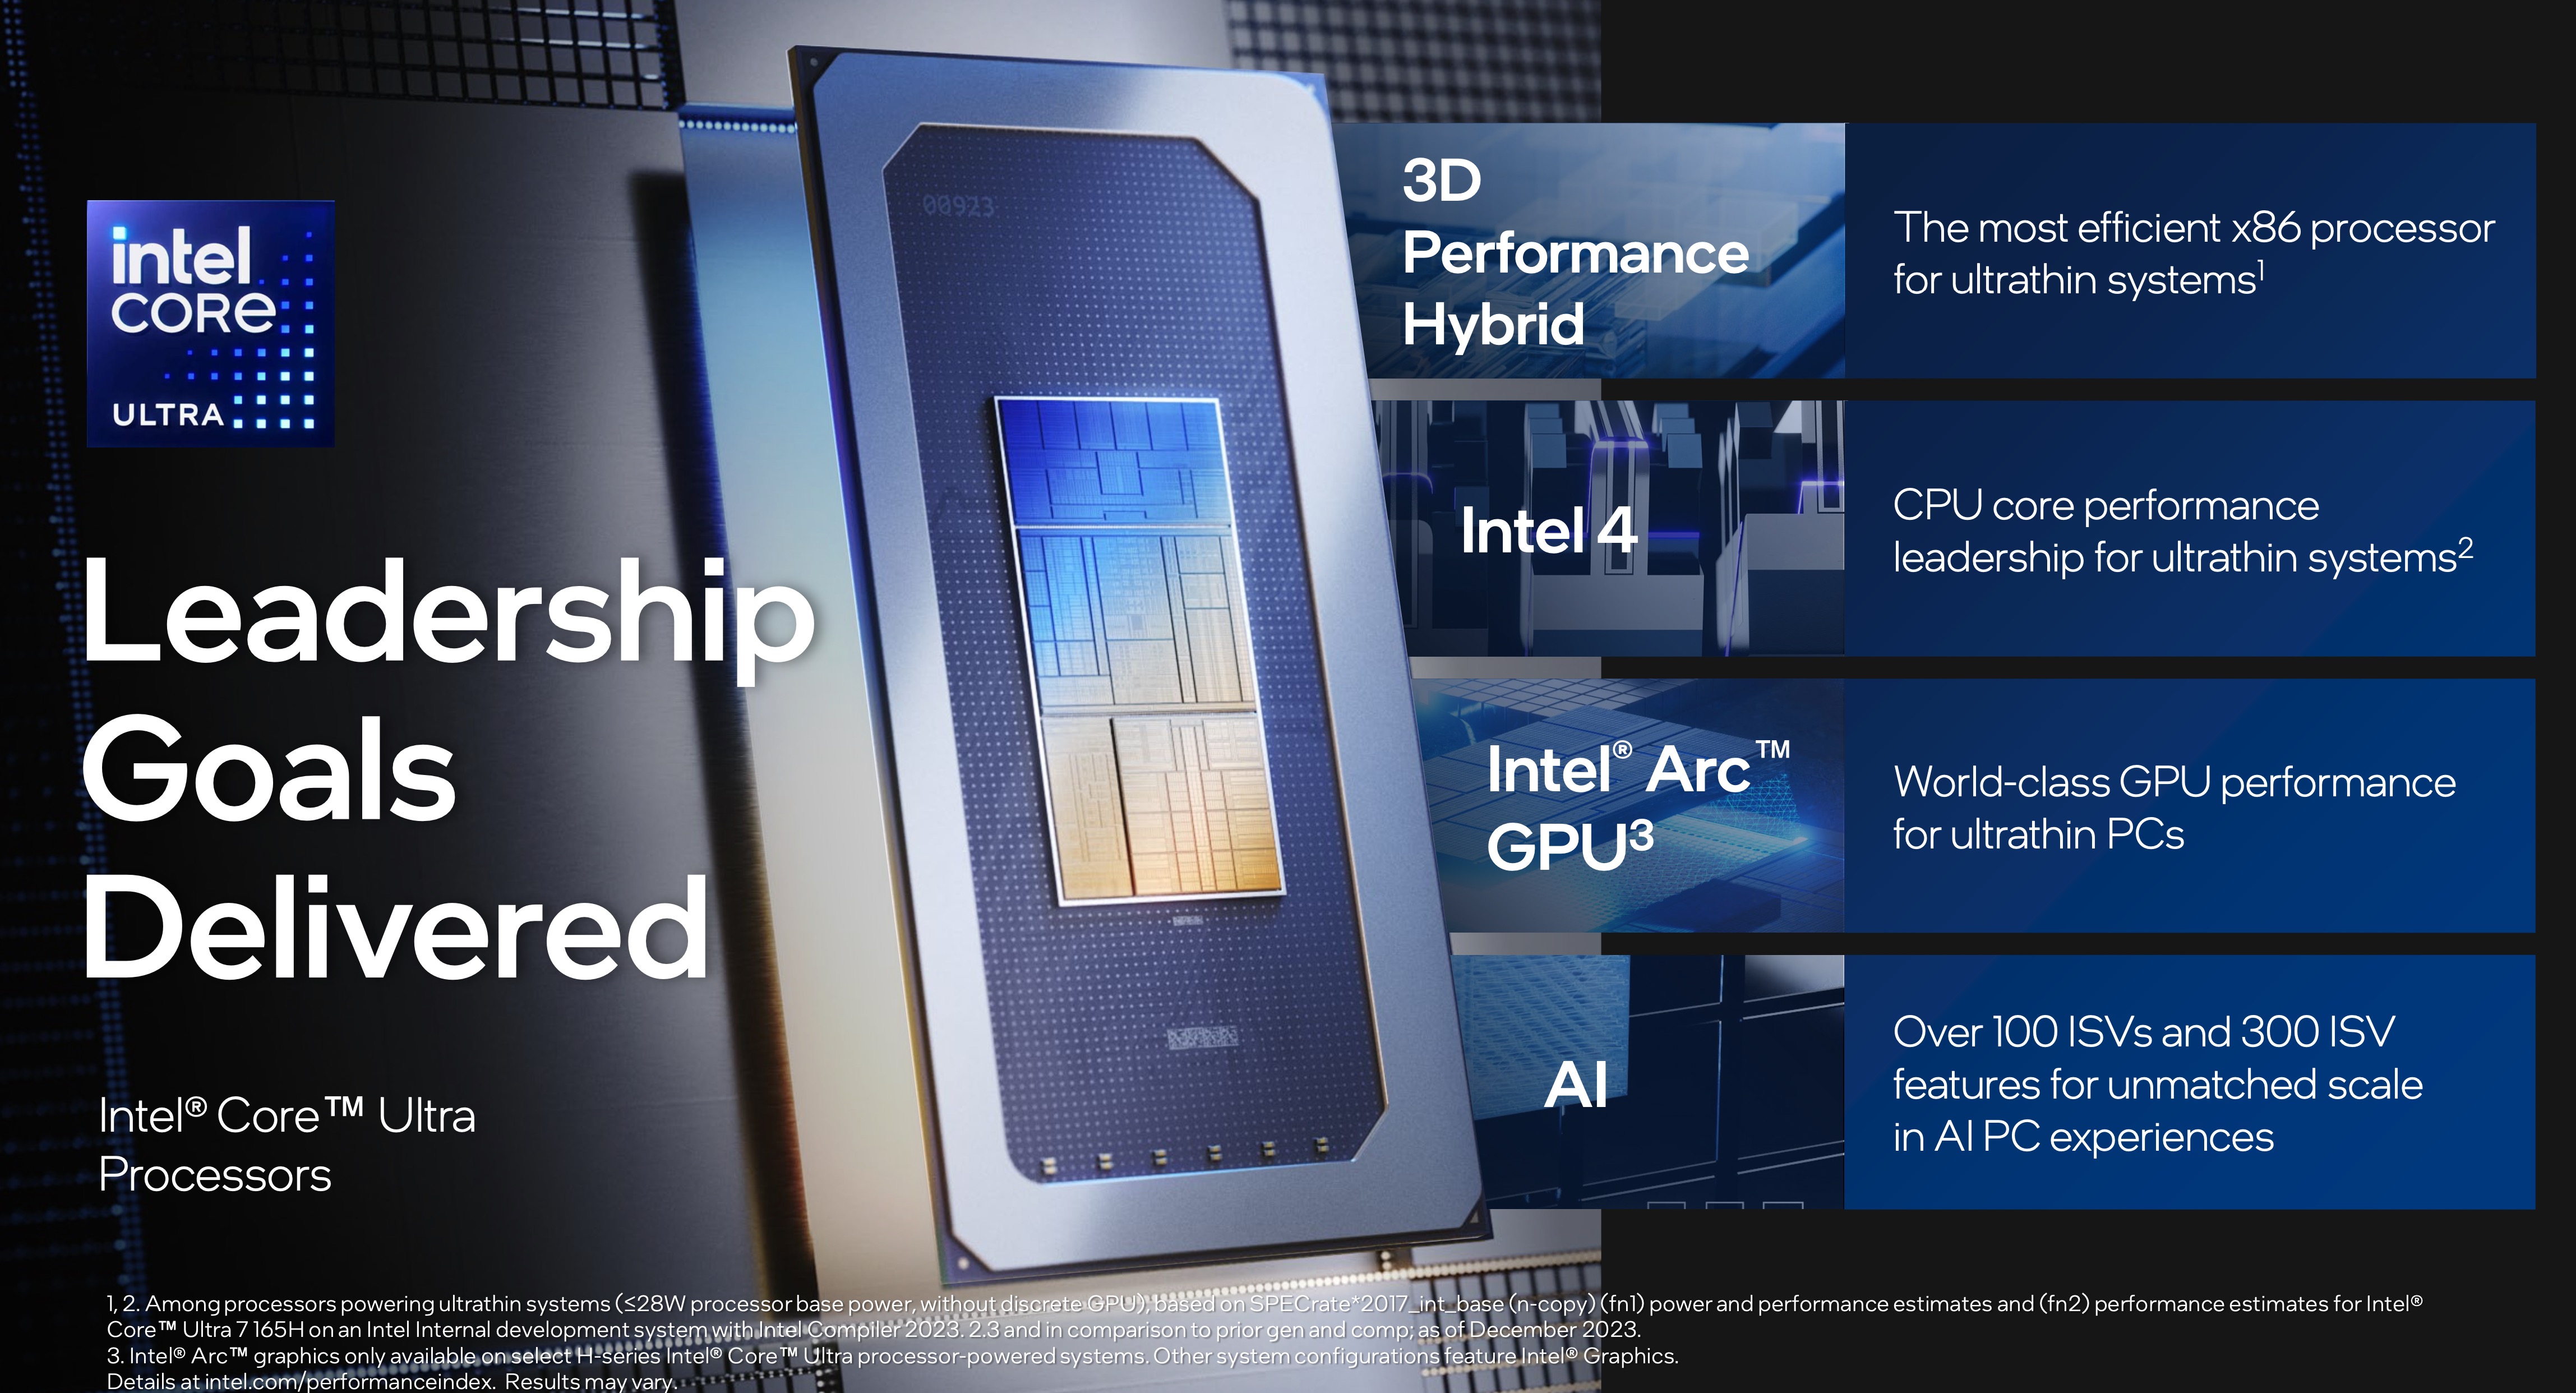
The Intel Core Ultra 7 155H is a high-end laptop processor of the Meteor Lake series that has 16 cores (6 + 8 + 2) and 22 threads at its disposal. This 1st Gen Core Ultra chip has come to replace 13th generation Core chips; its 16 cores are comprised of 6 HT-enabled P erformance cores running at up to 4.8 GHz and 10 E fficient cores (8 main cores plus 2 extra ones found in the Low Power Island) running at up to 3.8 GHz.
The 8-core Arc GPU , just out of the oven, serves as the integrated graphics adapter - this runs at up to 2.30 GHz - and there is a bevy of other brand-new technologies on offer as well, including the integrated AI Boost NPU with two Gen 3 engines for hardware AI workload acceleration.
Architecture and Features
With Meteor Lake, Intel intends to deliver higher CPU performance, higher GPU performance and at the same time, longer battery life than what Raptor Lake chips were capable of. The company also wants a large piece of the AI cake and is working with Microsoft and other partners to make that happen. As a result, Windows Defender is now AI-enabled, meaning it can use the Intel NPU to take some of the load off the main CPU cores. We also get this new Intel Device Discovery technology that is designed to give us a better hardware-based remote laptop management than ever before; and, to make things even better, Intel now offers a dedicated Arc Pro graphics driver for workstations.
This generation of Intel Core processors features Redwood architecture P-cores and Crestwood architecture E-cores. Both come with slight architectural improvements over Raptor Cove and Gracemont respectively for slightly higher performance-per-clock figures; the interesting thing is that of the 10 E-cores, two are actually a separate cluster located on what Intel calls a "Low Power Island ". Essentially, the latter is an SoC within an SoC that can stay active while most other parts of the chip are temporarily switched off to save power. The low-power E-cores run at up to 2.5 GHz. Intel hopes this approach will let it deliver unprecedentedly low power consumption figures when under low load, boosting battery life of laptops and tablets powered by Meteor Lake.
To build its Meteor Lake processors, Intel uses the Foveros technology (stacking several chips on top of each other). This is a cost-cutting measure more than anything else, as manufacturing several small dies on several different processes is so much cheaper than making a huge single die and hoping that there are no defects in it that will require disabling some parts of it.
Elsewhere, the Core Ultra 7 155H comes with 24 MB of L3 cache and a very healthy number of PCIe 5 and PCIe 4 lanes for NVMe SSD speeds up to 15.7 GB/s. It supports RAM running at up to 7467 MHz (DDR5-5600, LPDDR5-7467, LPDDR5x-7467, to be specific - which is about as good as what 8040 series Ryzen chips have). Naturally, the chip features built-in Thunderbolt 4 support and Intel CNVi Wi-Fi support; fascinatingly enough, Intel chose to keep native SATA III support that AMD had removed from its Ryzen processors quite a while ago.
The 155H is compatible with 64-bit Windows 10, 64-bit Windows 11 and with many Linux distros.
Performance
If one chooses to trust the official performance data published by Intel, then the 155H is about as fast as the Ryzen 9 6900HX (Zen 3 Plus, 8 cores, 16 threads, up to 4.9 GHz), as far as multi-thread performance is concerned. This isn't a ground-breaking result but let's just wait for our in-house testing results instead of jumping to conclusions.
Either way, real-world performance of the chip may vary significantly depending on how high the CPU power limits are and how competent the cooling solution of the system is.
Graphics
The 8-core Arc GPU running at up to 2.30 GHz is slated to be a proper alternative to the mighty Radeon 780M . The thing is almost as fast as the GTX 1650 (Laptop) and the RTX 2050 (Laptop) to represent some seriously solid performance gains over aging Xe-series integrated GPUs . If one chooses to take Intel's word for it, that is.
A proper DX12 Ultimate graphics adapter, the Arc is no stranger to ray tracing and other modern technologies including AI frame generation (XeSS). It will let you connect up to four SUHD 4320p monitors and it will both HW-encode and HW-encode the most widely used video codecs including AVC, HEVC and AV1 in a fast and efficient manner.
Your mileage may vary depending on how high the CPU power limits are, how competent the cooling solution of your system is, how fast the RAM of your system is. The latter is really important; Intel stresses that for the Arc to deliver the best results possible, multi-channel RAM configuration is a must.
Power consumption
This mighty Core Ultra 7 series processor has a Base power consumption of 28 W, while its Turbo power consumption is not supposed to exceed 115 W. Its Base power consumption is supposed to be around 64 W, however, most laptop makers will probably go for a higher value to get higher clock speeds and thus better performance. Either way, a powerful cooling solution will be needed to sort out this chip's hot temper.
The 155H is comprised of five small chips ("tiles") that are connected using Intel's Foveros technology. The tile containing main CPU cores is produced on the fairly modern 7 nm Intel process marketed as Intel 4 while most other tiles (the iGPU, the I/O die, ...) are built with TSMC's N5 and N6 processes. The base tile is built with the old Intel 22FFL process.
Model Intel Core i9-14900HX Intel Core Ultra 7 155H Series Intel Raptor Lake-HX Intel Intel Meteor Lake-H Codename Raptor Lake-HX Refresh Meteor Lake-H Series: Intel Meteor Lake-H Meteor Lake-H Clock 1600 - 5800 MHz 3800 - 4800 MHz L2 Cache 32 MB L3 Cache 36 MB 24 MB Cores / Threads 24 / 32 16 / 22 TDP 55 Watt 28 Watt TDP Turbo PL2 157 Watt Technology 10 nm 7 nm Die Size 257 mm2 max. Temp. 100 °C 110 °C Socket BGA1964 BGA2049 Features DDR4-3200/DDR5-5600 RAM, PCIe 5, Thr. Dir., DL B., GNA, MMX, SSE, SSE2, SSE3, SSSE3, SSE4.1, SSE4.2, AVX, AVX2, BMI2, ABM, FMA, ADX, VMX, SMEP, SMAP, EIST, TM1, TM2, HT, Turbo, SST, AES-NI, RDRAND, RDSEED, SHA DDR5-5600/LPDDR5-7467/LPDDR5x-7467 RAM, PCIe 5, Thr. Director, DL Boost, AI Boost, vPro Ess., MMX, SSE, SSE2, SSE3, SSSE3, SSE4.1, SSE4.2, AES, AVX, AVX2, AVX-VNNI, FMA3, SHA iGPU Intel UHD Graphics Xe 32EUs (Tiger Lake-H) ( - 1650 MHz)Intel Arc 8-Core iGPU ( - 2250 MHz)Architecture x86 x86 Announced Manufacturer ark.intel.com ark.intel.com
Benchmarks Performance Rating - CB R15 + R20 + 7-Zip + X265 + Blender + 3DM11 CPU - i9-14900HX
55.2 pt (77%)
...
max:
Performance Rating - CB R15 + R20 + 7-Zip + X265 + Blender + 3DM11 CPU - Ultra 7 155H
42.1 pt (58%)
...
...
max:
Cinebench 2024 - CB24 CPU Single Core
min: 120.1 avg: 128.3 median: 129.7 (90%) max: 130.7 Points
CPU TDP ? TDP 63 W TDP 90 W TDP 110 W TDP 130 W TDP 131 W TDP 135 W TDP 144 W TDP 160 W TDP 175 W 100% 95% 99% 96% 100% 98% 98% 100% 97% 99%
min: 2.2 avg: 87.5 median: 102.8 (71%) max: 107.2 Points
CPU TDP ? TDP 24 W TDP 28 W TDP 30 W TDP 45 W TDP 50 W TDP 63 W TDP 65 W TDP 85 W TDP 90 W TDP 102 W TDP 110 W TDP 130 W TDP 131 W TDP 135 W TDP 144 W TDP 160 W TDP 175 W 91% 77% 7% 78% 80% 81% 95% 42% 80% 99% 78% 96% 100% 98% 98% 100% 97% 99%
Cinebench 2024 - CB24 CPU Multi Core
min: 1107 avg: 1585 median: 1639 (31%) max: 1807 Points
CPU TDP ? TDP 63 W TDP 90 W TDP 110 W TDP 130 W TDP 131 W TDP 135 W TDP 144 W TDP 160 W TDP 175 W 99% 98% 81% 89% 80% 100% 91% 100% 83% 96%
min: 6.94 avg: 724 median: 773 (14%) max: 1024 Points
CPU TDP ? TDP 24 W TDP 25 W TDP 28 W TDP 30 W TDP 44 W TDP 45 W TDP 50 W TDP 63 W TDP 65 W TDP 85 W TDP 90 W TDP 102 W TDP 110 W TDP 130 W TDP 131 W TDP 135 W TDP 144 W TDP 160 W TDP 175 W 70% 38% 39% 2% 37% 47% 46% 50% 98% 29% 56% 81% 57% 89% 80% 100% 91% 100% 83% 96%
Cinebench R23 - Cinebench R23 Multi Core
min: 20702 avg: 29089 median: 30347.5 (28%) max: 32996 Points
CPU TDP ? TDP 55 W TDP 60 W TDP 63 W TDP 90 W TDP 95 W TDP 104 W TDP 110 W TDP 117 W TDP 125 W TDP 130 W TDP 131 W TDP 135 W TDP 144 W TDP 160 W TDP 175 W TDP 176 W 97% 63% 87% 95% 89% 79% 90% 86% 84% 92% 86% 100% 92% 95% 82% 96% 98%
min: 9769 avg: 14888 median: 15013 (14%) max: 19007 Points
CPU TDP ? TDP 20 W TDP 22 W TDP 24 W TDP 25 W TDP 28 W TDP 30 W TDP 39 W TDP 40 W TDP 42 W TDP 44 W TDP 45 W TDP 50 W TDP 55 W TDP 60 W TDP 63 W TDP 65 W TDP 85 W TDP 90 W TDP 95 W TDP 102 W TDP 104 W TDP 110 W TDP 117 W TDP 125 W TDP 130 W TDP 131 W TDP 135 W TDP 144 W TDP 160 W TDP 175 W TDP 176 W 63% 37% 32% 36% 44% 46% 43% 44% 44% 47% 44% 49% 53% 54% 73% 95% 53% 56% 89% 79% 56% 90% 86% 84% 92% 86% 100% 92% 95% 82% 96% 98%
Cinebench R23 - Cinebench R23 Single Core
min: 1720 avg: 2156 median: 2190.5 (93%) max: 2235 Points
CPU TDP ? TDP 55 W TDP 60 W TDP 63 W TDP 90 W TDP 95 W TDP 104 W TDP 110 W TDP 117 W TDP 125 W TDP 130 W TDP 131 W TDP 135 W TDP 144 W TDP 160 W TDP 175 W TDP 176 W 88% 98% 95% 94% 98% 97% 95% 97% 93% 99% 99% 98% 98% 100% 97% 97% 96%
min: 1496 avg: 1727 median: 1749 (74%) max: 1801 Points
CPU TDP ? TDP 20 W TDP 22 W TDP 24 W TDP 25 W TDP 28 W TDP 30 W TDP 39 W TDP 40 W TDP 42 W TDP 44 W TDP 45 W TDP 50 W TDP 55 W TDP 60 W TDP 63 W TDP 65 W TDP 85 W TDP 90 W TDP 95 W TDP 102 W TDP 104 W TDP 110 W TDP 117 W TDP 125 W TDP 130 W TDP 131 W TDP 135 W TDP 144 W TDP 160 W TDP 175 W TDP 176 W 82% 77% 69% 76% 77% 77% 79% 80% 78% 78% 77% 79% 77% 86% 87% 94% 77% 80% 98% 97% 78% 95% 97% 93% 99% 99% 98% 98% 100% 97% 97% 96%
Cinebench R20 - Cinebench R20 CPU (Single Core)
min: 657 avg: 825 median: 835 (93%) max: 859 Points
CPU TDP ? TDP 55 W TDP 60 W TDP 63 W TDP 90 W TDP 95 W TDP 104 W TDP 110 W TDP 117 W TDP 125 W TDP 130 W TDP 131 W TDP 135 W TDP 144 W TDP 160 W TDP 175 W TDP 176 W 89% 98% 95% 94% 99% 98% 95% 98% 95% 98% 99% 98% 98% 100% 97% 98% 96%
min: 620 avg: 667 median: 671.5 (75%) max: 693 Points
CPU TDP ? TDP 20 W TDP 22 W TDP 24 W TDP 25 W TDP 28 W TDP 30 W TDP 39 W TDP 40 W TDP 42 W TDP 44 W TDP 45 W TDP 50 W TDP 55 W TDP 60 W TDP 63 W TDP 65 W TDP 85 W TDP 90 W TDP 95 W TDP 102 W TDP 104 W TDP 110 W TDP 117 W TDP 125 W TDP 130 W TDP 131 W TDP 135 W TDP 144 W TDP 160 W TDP 175 W TDP 176 W 83% 77% 73% 76% 77% 78% 79% 80% 79% 79% 77% 80% 81% 88% 88% 94% 78% 79% 99% 98% 79% 95% 98% 95% 98% 99% 98% 98% 100% 97% 98% 96%
Cinebench R20 - Cinebench R20 CPU (Multi Core)
min: 8427 avg: 11057 median: 11573.5 (28%) max: 12419 Points
CPU TDP ? TDP 55 W TDP 60 W TDP 63 W TDP 90 W TDP 95 W TDP 104 W TDP 110 W TDP 117 W TDP 125 W TDP 130 W TDP 131 W TDP 135 W TDP 144 W TDP 160 W TDP 175 W TDP 176 W 99% 69% 90% 94% 92% 81% 92% 88% 89% 95% 89% 100% 95% 96% 83% 100% 99%
min: 3798 avg: 5797 median: 5706 (14%) max: 7409 Points
CPU TDP ? TDP 20 W TDP 22 W TDP 24 W TDP 25 W TDP 28 W TDP 30 W TDP 39 W TDP 40 W TDP 42 W TDP 44 W TDP 45 W TDP 50 W TDP 55 W TDP 60 W TDP 63 W TDP 65 W TDP 85 W TDP 90 W TDP 95 W TDP 102 W TDP 104 W TDP 110 W TDP 117 W TDP 125 W TDP 130 W TDP 131 W TDP 135 W TDP 144 W TDP 160 W TDP 175 W TDP 176 W 69% 39% 35% 38% 44% 47% 50% 46% 45% 51% 46% 49% 56% 57% 75% 94% 56% 58% 92% 81% 58% 92% 88% 89% 95% 89% 100% 95% 96% 83% 100% 99%
Cinebench R15 - Cinebench R15 CPU Multi 64 Bit
min: 3263 avg: 4426 median: 4574 (29%) max: 4879 Points
CPU TDP ? TDP 55 W TDP 60 W TDP 63 W TDP 90 W TDP 95 W TDP 104 W TDP 110 W TDP 117 W TDP 125 W TDP 130 W TDP 131 W TDP 135 W TDP 144 W TDP 160 W TDP 175 W TDP 176 W 100% 80% 91% 95% 92% 96% 94% 84% 87% 93% 88% 93% 99% 99% 82% 96% 98%
min: 1988.07 avg: 2465 median: 2496 (16%) max: 2857.55 Points
CPU TDP ? TDP 20 W TDP 22 W TDP 24 W TDP 25 W TDP 28 W TDP 30 W TDP 39 W TDP 40 W TDP 42 W TDP 44 W TDP 45 W TDP 50 W TDP 55 W TDP 60 W TDP 63 W TDP 65 W TDP 85 W TDP 90 W TDP 95 W TDP 102 W TDP 104 W TDP 110 W TDP 117 W TDP 125 W TDP 130 W TDP 131 W TDP 135 W TDP 144 W TDP 160 W TDP 175 W TDP 176 W 62% 46% 43% 44% 48% 50% 54% 51% 50% 54% 49% 54% 56% 67% 76% 97% 56% 59% 93% 97% 59% 95% 85% 88% 94% 89% 95% 100% 100% 83% 97% 99%
Cinebench R15 - Cinebench R15 CPU Single 64 Bit
min: 247 avg: 306 median: 311 (94%) max: 320 Points
CPU TDP ? TDP 55 W TDP 60 W TDP 63 W TDP 90 W TDP 95 W TDP 104 W TDP 110 W TDP 117 W TDP 125 W TDP 130 W TDP 131 W TDP 135 W TDP 144 W TDP 160 W TDP 175 W TDP 176 W 89% 94% 98% 94% 98% 98% 94% 95% 96% 100% 98% 97% 99% 100% 97% 96% 94%
min: 230 avg: 254.6 median: 255 (77%) max: 268 Points
CPU TDP ? TDP 20 W TDP 22 W TDP 24 W TDP 25 W TDP 28 W TDP 30 W TDP 39 W TDP 40 W TDP 42 W TDP 44 W TDP 45 W TDP 50 W TDP 55 W TDP 60 W TDP 63 W TDP 65 W TDP 85 W TDP 90 W TDP 95 W TDP 102 W TDP 104 W TDP 110 W TDP 117 W TDP 125 W TDP 130 W TDP 131 W TDP 135 W TDP 144 W TDP 160 W TDP 175 W TDP 176 W 83% 78% 72% 78% 78% 80% 80% 83% 81% 79% 80% 81% 84% 88% 91% 94% 80% 82% 98% 98% 81% 94% 95% 96% 100% 98% 97% 99% 100% 97% 96% 94%
Cinebench R11.5 - Cinebench R11.5 CPU Multi 64 Bit
min: 29.98 avg: 31.7 median: 31.7 (41%) max: 33.49 Points
CPU TDP 45 W TDP 65 W 90% 100%
Cinebench R11.5 - Cinebench R11.5 CPU Single 64 Bit
min: 3.07 avg: 3.1 median: 3.1 (77%) max: 3.13 Points
CPU TDP 45 W TDP 65 W 98% 100%
Cinebench R10 - Cinebench R10 Rend. Single (32bit)
min: 9828 avg: 9874 median: 9873.5 (60%) max: 9919 Points
CPU TDP 45 W TDP 65 W 100% 99%
Cinebench R10 - Cinebench R10 Rend. Multi (32bit)
min: 56242 avg: 58357 median: 58357 (42%) max: 60472 Points
CPU TDP 45 W TDP 65 W 93% 100%
Cinebench R10 - Cinebench R10 Rend. Multi (64bit)
min: 13726 avg: 54366 median: 54365.5 (38%) max: 95005 Points
CPU TDP 45 W TDP 65 W 14% 100%
Cinebench R10 - Cinebench R10 Rend. Single (64bit)
min: 13938 avg: 48020 median: 48020 (58%) max: 82102 Points
CPU TDP 45 W TDP 65 W 100% 17%
wPrime 2.10 - wPrime 2.0 1024m *
139.6 s (2%)
wPrime 2.10 - wPrime 2.0 32m *
3.5 s (1%)
wPrime 1.55 - wPrime 1.55 1024m *
482 s (2%)
wPrime 1.55 - wPrime 1.55 32m *
3.4 s (2%)
min: 7084 avg: 7404 median: 7403.5 (12%) max: 7723 Points
CPU TDP 45 W TDP 65 W 92% 100%
7-Zip 18.03 - 7-Zip 18.03 Multli Thread 4 runs
min: 87555 avg: 113311 median: 117144 (67%) max: 127108 MIPS
CPU TDP ? TDP 55 W TDP 60 W TDP 63 W TDP 90 W TDP 95 W TDP 104 W TDP 110 W TDP 117 W TDP 125 W TDP 130 W TDP 131 W TDP 135 W TDP 144 W TDP 160 W TDP 175 W TDP 176 W 100% 70% 92% 96% 86% 85% 91% 91% 85% 94% 84% 98% 96% 97% 86% 95% 96%
min: 42601 avg: 59135 median: 60595 (35%) max: 70074 MIPS
CPU TDP ? TDP 20 W TDP 22 W TDP 24 W TDP 25 W TDP 28 W TDP 30 W TDP 39 W TDP 40 W TDP 42 W TDP 44 W TDP 45 W TDP 50 W TDP 55 W TDP 60 W TDP 63 W TDP 65 W TDP 85 W TDP 90 W TDP 95 W TDP 102 W TDP 104 W TDP 110 W TDP 117 W TDP 125 W TDP 130 W TDP 131 W TDP 135 W TDP 144 W TDP 160 W TDP 175 W TDP 176 W 73% 41% 35% 42% 43% 49% 44% 40% 45% 50% 49% 51% 56% 62% 75% 98% 53% 57% 88% 87% 55% 94% 93% 87% 96% 86% 100% 99% 100% 88% 97% 98%
7-Zip 18.03 - 7-Zip 18.03 Single Thread 4 runs
min: 5452 avg: 7036 median: 7192 (86%) max: 7508 MIPS
CPU TDP ? TDP 55 W TDP 60 W TDP 63 W TDP 90 W TDP 95 W TDP 104 W TDP 110 W TDP 117 W TDP 125 W TDP 130 W TDP 131 W TDP 135 W TDP 144 W TDP 160 W TDP 175 W TDP 176 W 86% 96% 94% 89% 97% 83% 91% 96% 87% 99% 98% 96% 100% 95% 99% 96% 87%
min: 5037 avg: 5350 median: 5405.5 (65%) max: 5540 MIPS
CPU TDP ? TDP 20 W TDP 22 W TDP 24 W TDP 25 W TDP 28 W TDP 30 W TDP 39 W TDP 40 W TDP 42 W TDP 44 W TDP 45 W TDP 50 W TDP 55 W TDP 60 W TDP 63 W TDP 65 W TDP 85 W TDP 90 W TDP 95 W TDP 102 W TDP 104 W TDP 110 W TDP 117 W TDP 125 W TDP 130 W TDP 131 W TDP 135 W TDP 144 W TDP 160 W TDP 175 W TDP 176 W 79% 71% 70% 73% 73% 71% 72% 73% 71% 70% 71% 72% 73% 85% 84% 89% 71% 74% 97% 83% 68% 91% 96% 87% 99% 98% 96% 100% 95% 99% 96% 87%
X264 HD Benchmark 4.0 - x264 Pass 2
min: 128.04 avg: 141.1 median: 141.1 (49%) max: 154.15 fps
CPU TDP 45 W TDP 65 W 83% 100%
X264 HD Benchmark 4.0 - x264 Pass 1
min: 282.57 avg: 303.8 median: 303.8 (70%) max: 325 fps
CPU TDP 45 W TDP 65 W 87% 100%
HWBOT x265 Benchmark v2.2 - HWBOT x265 4k Preset
min: 22.7 avg: 29.7 median: 30.4 (53%) max: 34.4 fps
CPU TDP ? TDP 55 W TDP 60 W TDP 63 W TDP 90 W TDP 95 W TDP 104 W TDP 110 W TDP 117 W TDP 125 W TDP 130 W TDP 131 W TDP 135 W TDP 144 W TDP 160 W TDP 175 W TDP 176 W 93% 67% 89% 100% 83% 87% 89% 86% 82% 94% 83% 95% 95% 95% 85% 97% 91%
min: 9.93 avg: 16.5 median: 16.6 (29%) max: 21.2 fps
CPU TDP ? TDP 20 W TDP 22 W TDP 24 W TDP 25 W TDP 28 W TDP 30 W TDP 39 W TDP 40 W TDP 42 W TDP 44 W TDP 45 W TDP 50 W TDP 55 W TDP 60 W TDP 63 W TDP 65 W TDP 85 W TDP 90 W TDP 95 W TDP 102 W TDP 104 W TDP 110 W TDP 117 W TDP 125 W TDP 130 W TDP 131 W TDP 135 W TDP 144 W TDP 160 W TDP 175 W TDP 176 W 68% 38% 29% 39% 48% 49% 46% 40% 46% 51% 48% 52% 59% 60% 75% 100% 58% 62% 83% 87% 63% 89% 86% 82% 94% 83% 95% 95% 95% 85% 97% 91%
TrueCrypt - TrueCrypt Serpent
min: 0.944 avg: 1 median: 1 (0%) max: 1 GB/s
CPU TDP 45 W TDP 65 W 94% 100%
TrueCrypt - TrueCrypt Twofish
1.7 GB/s (29%)
CPU TDP 45 W TDP 65 W 100% 100%
TrueCrypt - TrueCrypt AES
min: 10.2 avg: 10.4 median: 10.4 (27%) max: 10.6 GB/s
CPU TDP 45 W TDP 65 W 96% 100%
Blender - Blender 3.3 Classroom CPU *
min: 179 avg: 209.2 median: 202 (3%) max: 298 Seconds
CPU TDP ? TDP 55 W TDP 60 W TDP 63 W TDP 90 W TDP 95 W TDP 104 W TDP 110 W TDP 117 W TDP 125 W TDP 130 W TDP 131 W TDP 135 W TDP 144 W TDP 160 W TDP 175 W TDP 176 W 101% 100% 101% 101% 101% 101% 101% 101% 101% 101% 101% 102% 101% 102% 101% 101% 102%
min: 296 avg: 417.3 median: 397 (5%) max: 637 Seconds
CPU TDP ? TDP 20 W TDP 22 W TDP 24 W TDP 25 W TDP 28 W TDP 30 W TDP 39 W TDP 40 W TDP 42 W TDP 44 W TDP 45 W TDP 50 W TDP 55 W TDP 60 W TDP 63 W TDP 65 W TDP 85 W TDP 90 W TDP 95 W TDP 102 W TDP 104 W TDP 110 W TDP 117 W TDP 125 W TDP 130 W TDP 131 W TDP 135 W TDP 144 W TDP 160 W TDP 175 W TDP 176 W 104% 101% 100% 101% 103% 103% 103% 102% 103% 103% 103% 104% 104% 104% 105% 106% 104% 104% 106% 106% 105% 106% 106% 106% 106% 105% 106% 106% 106% 106% 106% 106%
Blender - Blender 2.79 BMW27 CPU *
min: 102 avg: 118.3 median: 112 (1%) max: 164 Seconds
CPU TDP ? TDP 55 W TDP 60 W TDP 63 W TDP 90 W TDP 95 W TDP 104 W TDP 110 W TDP 117 W TDP 125 W TDP 130 W TDP 131 W TDP 135 W TDP 144 W TDP 160 W TDP 175 W TDP 176 W 100% 100% 100% 100% 100% 100% 100% 100% 100% 100% 100% 100% 100% 100% 100% 100% 100%
min: 178 avg: 234 median: 224.5 (2%) max: 349 Seconds
CPU TDP ? TDP 20 W TDP 22 W TDP 24 W TDP 25 W TDP 28 W TDP 30 W TDP 39 W TDP 40 W TDP 42 W TDP 44 W TDP 45 W TDP 50 W TDP 55 W TDP 60 W TDP 63 W TDP 65 W TDP 85 W TDP 90 W TDP 95 W TDP 104 W TDP 110 W TDP 117 W TDP 125 W TDP 130 W TDP 131 W TDP 135 W TDP 144 W TDP 160 W TDP 175 W TDP 176 W 101% 100% 100% 100% 101% 101% 101% 101% 101% 101% 101% 101% 101% 101% 101% 102% 101% 101% 102% 102% 102% 102% 102% 102% 102% 102% 102% 102% 102% 102% 102%
R Benchmark 2.5 - R Benchmark 2.5 *
min: 0.3609 avg: 0.4 median: 0.4 (8%) max: 0.4859 sec
CPU TDP ? TDP 55 W TDP 60 W TDP 63 W TDP 90 W TDP 95 W TDP 104 W TDP 110 W TDP 117 W TDP 125 W TDP 130 W TDP 131 W TDP 135 W TDP 144 W TDP 160 W TDP 175 W TDP 176 W 100% 101% 101% 101% 101% 100% 101% 101% 101% 101% 101% 101% 101% 101% 101% 101% 101%
min: 0.4609 avg: 0.5 median: 0.5 (10%) max: 0.516 sec
CPU TDP ? TDP 20 W TDP 22 W TDP 24 W TDP 25 W TDP 28 W TDP 30 W TDP 39 W TDP 40 W TDP 42 W TDP 44 W TDP 45 W TDP 50 W TDP 55 W TDP 60 W TDP 63 W TDP 65 W TDP 85 W TDP 90 W TDP 95 W TDP 102 W TDP 104 W TDP 110 W TDP 117 W TDP 125 W TDP 130 W TDP 131 W TDP 135 W TDP 144 W TDP 160 W TDP 175 W TDP 176 W 102% 100% 100% 101% 101% 101% 101% 101% 101% 101% 101% 101% 101% 101% 102% 103% 101% 101% 103% 102% 101% 103% 103% 103% 103% 103% 103% 104% 103% 104% 103% 103%
3DMark 06 - CPU - 3DMark 06 - CPU
19451 Points (41%)
13097 Points (28%)
CPU TDP 65 W TDP 160 W 67% 100%
Super Pi mod 1.5 XS 1M - Super Pi mod 1.5 XS 1M *
min: 7.046 avg: 7.1 median: 7.1 (2%) max: 7.168 s
CPU TDP 45 W TDP 65 W 100% 100%
Super Pi mod 1.5 XS 2M - Super Pi mod 1.5 XS 2M *
min: 15.767 avg: 16 median: 15.9 (1%) max: 16.125 s
CPU TDP 45 W TDP 65 W 100% 100%
Super Pi Mod 1.5 XS 32M - Super Pi mod 1.5 XS 32M *
min: 394.754 avg: 397.5 median: 397.5 (2%) max: 400.292 s
CPU TDP 45 W TDP 65 W 100% 100%
3DMark Vantage - 3DM Vant. Perf. CPU no Physx
min: 62245 avg: 68433 median: 68432.5 (60%) max: 74620 Points
CPU TDP 45 W TDP 65 W 83% 100%
3DMark 11 - 3DM11 Performance Physics
min: 16205 avg: 23548 median: 24087 (65%) max: 26390 Points
CPU TDP ? TDP 55 W TDP 60 W TDP 63 W TDP 90 W TDP 95 W TDP 104 W TDP 110 W TDP 117 W TDP 130 W TDP 131 W TDP 135 W TDP 144 W TDP 160 W TDP 176 W 82% 80% 84% 100% 94% 96% 91% 83% 93% 87% 98% 89% 98% 87% 99%
min: 6531 avg: 18287 median: 20008 (54%) max: 23598 Points
CPU TDP ? TDP 20 W TDP 24 W TDP 25 W TDP 28 W TDP 30 W TDP 39 W TDP 40 W TDP 42 W TDP 44 W TDP 45 W TDP 50 W TDP 55 W TDP 60 W TDP 63 W TDP 65 W TDP 85 W TDP 90 W TDP 95 W TDP 102 W TDP 104 W TDP 110 W TDP 117 W TDP 130 W TDP 131 W TDP 135 W TDP 144 W TDP 160 W TDP 176 W 76% 32% 43% 58% 53% 71% 84% 68% 75% 75% 79% 85% 81% 84% 100% 82% 88% 94% 96% 89% 91% 83% 93% 87% 98% 89% 98% 87% 99%
3DMark - 3DMark Ice Storm Physics
92919 Points (76%)
min: 68032 avg: 75732 median: 74730 (61%) max: 85435 Points
CPU TDP 45 W TDP 55 W TDP 65 W TDP 135 W 83% 87% 73% 100%
3DMark - 3DMark Ice Storm Extreme Physics
94249 Points (76%)
66925 Points (54%)
CPU TDP 65 W TDP 135 W 71% 100%
3DMark - 3DMark Ice Storm Unlimited Physics
94081 Points (79%)
3DMark - 3DMark Cloud Gate Physics
min: 16565 avg: 21097 median: 22021 (56%) max: 24768 Points
CPU TDP ? TDP 55 W TDP 60 W TDP 95 W TDP 110 W TDP 130 W TDP 135 W 94% 76% 89% 79% 91% 67% 100%
min: 7073 avg: 15232 median: 16405 (42%) max: 19549 Points
CPU TDP ? TDP 22 W TDP 25 W TDP 39 W TDP 40 W TDP 42 W TDP 44 W TDP 45 W TDP 55 W TDP 60 W TDP 65 W TDP 95 W TDP 110 W TDP 130 W TDP 135 W 81% 29% 50% 66% 56% 74% 62% 57% 76% 89% 79% 79% 91% 67% 100%
3DMark - 3DMark Fire Strike Standard Physics
min: 32683 avg: 38458 median: 38532 (69%) max: 43767 Points
CPU TDP ? TDP 55 W TDP 60 W TDP 63 W TDP 90 W TDP 95 W TDP 104 W TDP 110 W TDP 117 W TDP 130 W TDP 131 W TDP 135 W TDP 144 W TDP 160 W TDP 176 W 92% 78% 82% 100% 88% 85% 82% 88% 89% 85% 88% 94% 96% 86% 95%
min: 5249 avg: 21979 median: 23400 (42%) max: 28337 Points
CPU TDP ? TDP 20 W TDP 22 W TDP 24 W TDP 25 W TDP 28 W TDP 30 W TDP 39 W TDP 40 W TDP 42 W TDP 44 W TDP 45 W TDP 50 W TDP 55 W TDP 60 W TDP 63 W TDP 65 W TDP 85 W TDP 90 W TDP 95 W TDP 102 W TDP 104 W TDP 110 W TDP 117 W TDP 130 W TDP 131 W TDP 135 W TDP 144 W TDP 160 W TDP 176 W 56% 35% 29% 38% 53% 43% 12% 59% 54% 56% 56% 58% 64% 69% 69% 100% 59% 63% 88% 85% 62% 82% 88% 89% 85% 88% 94% 96% 86% 95%
3DMark - 3DMark Time Spy CPU
min: 13797 avg: 16856 median: 16908 (71%) max: 18847 Points
CPU TDP ? TDP 55 W TDP 60 W TDP 63 W TDP 90 W TDP 95 W TDP 104 W TDP 110 W TDP 117 W TDP 130 W TDP 131 W TDP 135 W TDP 144 W TDP 160 W TDP 176 W 92% 83% 75% 99% 95% 91% 89% 89% 92% 90% 73% 96% 100% 86% 90%
min: 3922 avg: 8609 median: 9584.5 (40%) max: 12145 Points
CPU TDP ? TDP 20 W TDP 22 W TDP 24 W TDP 25 W TDP 28 W TDP 30 W TDP 39 W TDP 40 W TDP 42 W TDP 44 W TDP 45 W TDP 50 W TDP 55 W TDP 60 W TDP 63 W TDP 65 W TDP 85 W TDP 90 W TDP 95 W TDP 102 W TDP 104 W TDP 110 W TDP 117 W TDP 130 W TDP 131 W TDP 135 W TDP 144 W TDP 160 W TDP 176 W 64% 29% 29% 28% 50% 34% 42% 56% 54% 49% 53% 49% 55% 69% 66% 99% 56% 56% 95% 91% 64% 89% 89% 92% 90% 73% 96% 100% 86% 90%
Geekbench 6.2 - Geekbench 6.2 Single-Core
min: 2419 avg: 2971 median: 3020.5 (81%) max: 3095 Points
CPU TDP ? TDP 55 W TDP 60 W TDP 63 W TDP 90 W TDP 95 W TDP 104 W TDP 110 W TDP 117 W TDP 125 W TDP 130 W TDP 131 W TDP 135 W TDP 144 W TDP 160 W TDP 175 W TDP 176 W 89% 91% 96% 93% 98% 96% 94% 97% 92% 100% 99% 97% 98% 99% 100% 98% 92%
min: 2287 avg: 2403 median: 2414.5 (65%) max: 2459 Points
CPU TDP ? TDP 20 W TDP 22 W TDP 24 W TDP 25 W TDP 28 W TDP 30 W TDP 32 W TDP 39 W TDP 40 W TDP 42 W TDP 44 W TDP 45 W TDP 50 W TDP 55 W TDP 60 W TDP 63 W TDP 65 W TDP 85 W TDP 90 W TDP 95 W TDP 102 W TDP 104 W TDP 110 W TDP 117 W TDP 125 W TDP 130 W TDP 131 W TDP 135 W TDP 144 W TDP 160 W TDP 175 W TDP 176 W 83% 77% 75% 78% 79% 77% 79% 80% 79% 78% 77% 77% 78% 79% 85% 88% 93% 78% 78% 98% 96% 77% 94% 97% 92% 100% 99% 97% 98% 99% 100% 98% 92%
Geekbench 6.2 - Geekbench 6.2 Multi-Core
min: 15849 avg: 17561 median: 17738 (70%) max: 18643 Points
CPU TDP ? TDP 55 W TDP 60 W TDP 63 W TDP 90 W TDP 95 W TDP 104 W TDP 110 W TDP 117 W TDP 125 W TDP 130 W TDP 131 W TDP 135 W TDP 144 W TDP 160 W TDP 175 W TDP 176 W 97% 86% 94% 98% 95% 94% 98% 95% 93% 96% 92% 98% 100% 98% 92% 98% 90%
min: 10696 avg: 12558 median: 12591 (50%) max: 13656 Points
CPU TDP ? TDP 20 W TDP 22 W TDP 24 W TDP 25 W TDP 28 W TDP 30 W TDP 32 W TDP 39 W TDP 40 W TDP 42 W TDP 44 W TDP 45 W TDP 50 W TDP 55 W TDP 60 W TDP 63 W TDP 65 W TDP 85 W TDP 90 W TDP 95 W TDP 102 W TDP 104 W TDP 110 W TDP 117 W TDP 125 W TDP 130 W TDP 131 W TDP 135 W TDP 144 W TDP 160 W TDP 175 W TDP 176 W 77% 67% 62% 65% 65% 66% 72% 66% 69% 67% 68% 67% 68% 72% 79% 83% 98% 69% 73% 95% 94% 68% 98% 95% 93% 96% 92% 98% 100% 98% 92% 98% 90%
Geekbench 5.5 - Geekbench 5.1 - 5.4 64 Bit Single-Core
min: 1669 avg: 2086 median: 2123.5 (90%) max: 2210 Points
CPU TDP ? TDP 55 W TDP 60 W TDP 63 W TDP 90 W TDP 95 W TDP 104 W TDP 110 W TDP 117 W TDP 125 W TDP 130 W TDP 131 W TDP 135 W TDP 144 W TDP 160 W TDP 175 W TDP 176 W 89% 93% 96% 76% 97% 91% 93% 96% 91% 96% 96% 96% 100% 99% 97% 96% 95%
min: 1689 avg: 1764 median: 1766 (75%) max: 1824 Points
CPU TDP ? TDP 20 W TDP 22 W TDP 24 W TDP 25 W TDP 28 W TDP 30 W TDP 32 W TDP 39 W TDP 40 W TDP 42 W TDP 44 W TDP 45 W TDP 50 W TDP 55 W TDP 60 W TDP 63 W TDP 65 W TDP 85 W TDP 90 W TDP 95 W TDP 102 W TDP 104 W TDP 110 W TDP 117 W TDP 125 W TDP 130 W TDP 131 W TDP 135 W TDP 144 W TDP 160 W TDP 175 W TDP 176 W 83% 79% 76% 81% 80% 79% 79% 82% 79% 81% 79% 79% 81% 81% 87% 89% 76% 79% 80% 97% 91% 79% 93% 96% 91% 96% 96% 96% 100% 99% 97% 96% 95%
Geekbench 5.5 - Geekbench 5.1 - 5.4 64 Bit Multi-Core
min: 8618 avg: 19537 median: 20198 (36%) max: 21642 Points
CPU TDP ? TDP 55 W TDP 60 W TDP 63 W TDP 90 W TDP 95 W TDP 104 W TDP 110 W TDP 117 W TDP 125 W TDP 130 W TDP 131 W TDP 135 W TDP 144 W TDP 160 W TDP 175 W TDP 176 W 100% 81% 90% 40% 93% 93% 98% 92% 89% 94% 90% 97% 99% 98% 89% 99% 88%
min: 10017 avg: 12176 median: 12288 (22%) max: 13556 Points
CPU TDP ? TDP 20 W TDP 22 W TDP 24 W TDP 25 W TDP 28 W TDP 30 W TDP 32 W TDP 39 W TDP 40 W TDP 42 W TDP 44 W TDP 45 W TDP 50 W TDP 55 W TDP 60 W TDP 63 W TDP 65 W TDP 85 W TDP 90 W TDP 95 W TDP 102 W TDP 104 W TDP 110 W TDP 117 W TDP 125 W TDP 130 W TDP 131 W TDP 135 W TDP 144 W TDP 160 W TDP 175 W TDP 176 W 73% 55% 50% 53% 54% 57% 60% 56% 60% 56% 57% 56% 59% 61% 71% 76% 40% 60% 64% 94% 94% 58% 100% 94% 91% 95% 91% 98% 100% 100% 90% 100% 90%
Geekbench 5.0 - Geekbench 5.0 64 Bit Single-Core
2090 Points (9%)
min: 1684 avg: 1696 median: 1696 (7%) max: 1708 Points
CPU TDP 45 W TDP 65 W TDP 90 W 81% 82% 100%
Geekbench 5.0 - Geekbench 5.0 64 Bit Multi-Core
19253 Points (61%)
min: 11684 avg: 12061 median: 12061 (38%) max: 12438 Points
CPU TDP 45 W TDP 65 W TDP 90 W 61% 65% 100%
Geekbench 4.4 - Geekbench 4.1 - 4.4 64 Bit Single-Core
min: 6838 avg: 6883 median: 6882.5 (69%) max: 6927 Points
CPU TDP 45 W TDP 65 W 99% 100%
Geekbench 4.4 - Geekbench 4.1 - 4.4 64 Bit Multi-Core
min: 43897 avg: 44574 median: 44573.5 (49%) max: 45250 Points
CPU TDP 45 W TDP 65 W 97% 100%
Mozilla Kraken 1.1 - Kraken 1.1 Total Score *
min: 430 avg: 448.3 median: 443 (1%) max: 535 ms
CPU TDP ? TDP 55 W TDP 60 W TDP 63 W TDP 90 W TDP 95 W TDP 104 W TDP 110 W TDP 117 W TDP 130 W TDP 131 W TDP 135 W TDP 144 W TDP 160 W TDP 176 W 100% 100% 100% 100% 100% 100% 100% 100% 100% 100% 100% 100% 100% 100% 100%
min: 416.4 avg: 533 median: 535 (1%) max: 585 ms
CPU TDP ? TDP 20 W TDP 22 W TDP 24 W TDP 25 W TDP 28 W TDP 30 W TDP 39 W TDP 40 W TDP 42 W TDP 44 W TDP 45 W TDP 50 W TDP 55 W TDP 60 W TDP 63 W TDP 65 W TDP 90 W TDP 95 W TDP 102 W TDP 104 W TDP 110 W TDP 117 W TDP 130 W TDP 131 W TDP 135 W TDP 144 W TDP 160 W TDP 176 W 100% 100% 100% 100% 100% 100% 100% 100% 100% 100% 100% 100% 100% 100% 100% 100% 100% 100% 100% 100% 100% 100% 100% 100% 100% 100% 100% 100% 100%
Octane V2 - Octane V2 Total Score
min: 106992 avg: 109276 median: 109502 (98%) max: 111243 Points
CPU TDP 90 W TDP 110 W TDP 130 W TDP 160 W 100% 99% 97% 100%
min: 77142 avg: 87654 median: 89109 (80%) max: 93476 Points
CPU TDP ? TDP 20 W TDP 24 W TDP 28 W TDP 30 W TDP 45 W TDP 50 W TDP 60 W TDP 90 W TDP 110 W TDP 130 W TDP 160 W 74% 75% 77% 81% 80% 81% 84% 84% 100% 99% 97% 100%
WebXPRT 4 - WebXPRT 4 Score
min: 246 avg: 297.8 median: 301 (86%) max: 316 Points
CPU TDP ? TDP 63 W TDP 90 W TDP 104 W TDP 110 W TDP 130 W TDP 131 W TDP 135 W TDP 144 W TDP 160 W TDP 176 W 79% 99% 95% 93% 97% 100% 96% 99% 99% 95% 92%
min: 236 avg: 254.1 median: 256 (74%) max: 263 Points
CPU TDP ? TDP 20 W TDP 24 W TDP 25 W TDP 28 W TDP 30 W TDP 39 W TDP 40 W TDP 44 W TDP 45 W TDP 50 W TDP 60 W TDP 63 W TDP 65 W TDP 85 W TDP 90 W TDP 102 W TDP 104 W TDP 110 W TDP 130 W TDP 131 W TDP 135 W TDP 144 W TDP 160 W TDP 176 W 78% 78% 82% 83% 82% 82% 78% 84% 83% 82% 82% 84% 99% 78% 81% 95% 82% 93% 97% 100% 96% 99% 99% 95% 92%
WebXPRT 3 - WebXPRT 3 Score
min: 279 avg: 327 median: 327 (68%) max: 345 Points
CPU TDP ? TDP 55 W TDP 60 W TDP 63 W TDP 90 W TDP 104 W TDP 110 W TDP 117 W TDP 130 W TDP 131 W TDP 135 W TDP 144 W TDP 160 W TDP 176 W 82% 100% 96% 97% 98% 94% 94% 99% 98% 94% 91% 95% 98% 96%
min: 255 avg: 279.1 median: 278.5 (58%) max: 299 Points
CPU TDP ? TDP 20 W TDP 22 W TDP 24 W TDP 25 W TDP 28 W TDP 30 W TDP 39 W TDP 40 W TDP 42 W TDP 44 W TDP 45 W TDP 50 W TDP 55 W TDP 60 W TDP 63 W TDP 65 W TDP 85 W TDP 90 W TDP 102 W TDP 104 W TDP 110 W TDP 117 W TDP 130 W TDP 131 W TDP 135 W TDP 144 W TDP 160 W TDP 176 W 80% 77% 80% 83% 87% 82% 83% 79% 83% 81% 86% 83% 84% 91% 91% 98% 81% 83% 99% 87% 95% 95% 100% 99% 95% 91% 96% 99% 96%
CrossMark - CrossMark Overall
min: 1877 avg: 2146 median: 2174 (83%) max: 2334 Points
CPU TDP ? TDP 60 W TDP 63 W TDP 90 W TDP 104 W TDP 110 W TDP 117 W TDP 130 W TDP 131 W TDP 135 W TDP 144 W TDP 160 W TDP 176 W 89% 93% 97% 100% 87% 96% 89% 99% 95% 88% 90% 94% 81%
min: 1366 avg: 1671 median: 1685 (65%) max: 1903 Points
CPU TDP ? TDP 20 W TDP 22 W TDP 24 W TDP 25 W TDP 28 W TDP 30 W TDP 32 W TDP 39 W TDP 40 W TDP 42 W TDP 44 W TDP 45 W TDP 50 W TDP 60 W TDP 63 W TDP 65 W TDP 85 W TDP 90 W TDP 102 W TDP 104 W TDP 110 W TDP 117 W TDP 130 W TDP 131 W TDP 135 W TDP 144 W TDP 160 W TDP 176 W 78% 70% 65% 66% 71% 72% 73% 82% 71% 73% 78% 75% 73% 71% 84% 97% 72% 80% 100% 76% 87% 96% 89% 99% 95% 88% 90% 94% 81%
Power Consumption - Prime95 Power Consumption - external Monitor *
min: 89.1 avg: 164.5 median: 156.1 (27%) max: 283 Watt
CPU TDP ? TDP 55 W TDP 60 W TDP 90 W TDP 95 W TDP 110 W TDP 130 W TDP 131 W TDP 135 W TDP 144 W TDP 160 W TDP 176 W 138% 179% 153% 165% 177% 158% 165% 139% 147% 100% 177% 113%
min: 37.1 avg: 72.1 median: 65.9 (11%) max: 168 Watt
CPU TDP ? TDP 20 W TDP 22 W TDP 24 W TDP 25 W TDP 28 W TDP 30 W TDP 40 W TDP 42 W TDP 44 W TDP 45 W TDP 50 W TDP 55 W TDP 60 W TDP 65 W TDP 85 W TDP 90 W TDP 95 W TDP 102 W TDP 110 W TDP 130 W TDP 131 W TDP 135 W TDP 144 W TDP 160 W TDP 176 W 172% 206% 207% 205% 200% 199% 200% 193% 198% 194% 194% 186% 186% 166% 183% 178% 165% 177% 157% 158% 165% 139% 147% 100% 177% 113%
Power Consumption - Cinebench R15 Multi Power Consumption - external Monitor *
min: 185 avg: 231.8 median: 240.4 (44%) max: 258 Watt
CPU TDP ? TDP 60 W TDP 90 W TDP 131 W TDP 135 W TDP 144 W TDP 176 W 126% 147% 133% 123% 121% 100% 117%
min: 46.9 avg: 91.4 median: 90.1 (16%) max: 160.1 Watt
CPU TDP ? TDP 20 W TDP 24 W TDP 25 W TDP 30 W TDP 40 W TDP 44 W TDP 45 W TDP 50 W TDP 60 W TDP 65 W TDP 85 W TDP 90 W TDP 102 W TDP 131 W TDP 135 W TDP 144 W TDP 176 W 163% 199% 199% 195% 179% 187% 190% 182% 182% 152% 180% 173% 133% 157% 123% 121% 100% 117%
Power Consumption - Idle Power Consumption - external Monitor *
min: 15.5 avg: 24.9 median: 24.3 (16%) max: 34.6 Watt
CPU TDP ? TDP 55 W TDP 60 W TDP 90 W TDP 95 W TDP 110 W TDP 130 W TDP 131 W TDP 135 W TDP 144 W TDP 160 W TDP 176 W 104% 113% 110% 112% 100% 103% 104% 116% 104% 117% 112% 112%
min: 3.12 avg: 6.5 median: 5.5 (4%) max: 19.6 Watt
CPU TDP ? TDP 20 W TDP 22 W TDP 24 W TDP 25 W TDP 28 W TDP 30 W TDP 40 W TDP 42 W TDP 44 W TDP 45 W TDP 50 W TDP 55 W TDP 60 W TDP 65 W TDP 85 W TDP 90 W TDP 95 W TDP 102 W TDP 110 W TDP 130 W TDP 131 W TDP 135 W TDP 144 W TDP 160 W TDP 176 W 114% 125% 126% 125% 126% 125% 124% 125% 125% 127% 124% 119% 120% 117% 121% 125% 112% 100% 123% 103% 104% 116% 104% 117% 112% 112%
Power Consumption - Idle Power Consumption 150cd 1min *
min: 13.5 avg: 19.7 median: 18.2 (20%) max: 35.2 Watt
CPU TDP ? TDP 55 W TDP 60 W TDP 90 W TDP 95 W TDP 110 W TDP 130 W TDP 131 W TDP 144 W TDP 160 W TDP 176 W 118% 131% 131% 130% 100% 133% 130% 133% 133% 138% 125%
min: 4.35 avg: 11.4 median: 7.4 (8%) max: 90.3 Watt
CPU TDP ? TDP 20 W TDP 22 W TDP 24 W TDP 25 W TDP 28 W TDP 30 W TDP 40 W TDP 42 W TDP 44 W TDP 45 W TDP 50 W TDP 55 W TDP 60 W TDP 85 W TDP 90 W TDP 95 W TDP 102 W TDP 110 W TDP 130 W TDP 131 W TDP 144 W TDP 160 W TDP 176 W 0% 0% 0% 0% 0% 0% 0% 0% 0% 0% 0% 0% 0% 0% 0% 0% 0% 0% 0% 0% 0% 0% 0% 0%
Power Consumption - Cinebench R15 Multi Power Efficiency - external Monitor
min: 18.5 avg: 20.4 median: 20 (15%) max: 24.1 Points per Watt
CPU TDP ? TDP 60 W TDP 90 W TDP 131 W TDP 135 W TDP 144 W TDP 176 W 85% 100% 89% 78% 80% 66% 77%
min: 17.7 avg: 32.1 median: 29.6 (22%) max: 64.7 Points per Watt
CPU TDP ? TDP 20 W TDP 24 W TDP 25 W TDP 28 W TDP 30 W TDP 40 W TDP 44 W TDP 45 W TDP 50 W TDP 60 W TDP 85 W TDP 90 W TDP 102 W TDP 131 W TDP 135 W TDP 144 W TDP 176 W 44% 62% 59% 55% 100% 38% 46% 47% 42% 43% 33% 36% 33% 27% 29% 30% 25% 29%
Average Benchmarks Intel Core i9-14900HX → 100% n=32 Average Benchmarks Intel Core Ultra 7 155H → 74% n=32
- Range of benchmark values for this graphics card
- Average benchmark values for this graphics card
* Smaller numbers mean a higher performance
1 This benchmark is not used for the average calculation
v1.26
log 30. 05:34:00
#0 checking url part for id 17163 +0s ... 0s
#1 checking url part for id 16906 +0s ... 0s
#2 not redirecting to Ajax server +0s ... 0s
#3 did not recreate cache, as it is less than 5 days old! Created at Tue, 28 May 2024 05:33:54 +0200 +0.001s ... 0.001s
#4 composed specs +0.032s ... 0.033s
#5 did output specs +0s ... 0.033s
#6 getting avg benchmarks for device 17163 +0.014s ... 0.047s
#7 got single benchmarks 17163 +0.064s ... 0.111s
#8 getting avg benchmarks for device 16906 +0.019s ... 0.13s
#9 got single benchmarks 16906 +0.079s ... 0.21s
#10 got avg benchmarks for devices +0s ... 0.21s
#11 min, max, avg, median took s +0.333s ... 0.542s
#12 return log +0.025s ... 0.568s
Please share our article, every link counts!
Redaktion, 2017-09- 8 (Update: 2023-07- 1)
 Deutsch
 English
 Español
 Français
 Italiano
 Nederlands
 Polski
 Português
 Русский
 Türkçe
 Svenska
 Chinese
 Magyar