AMD Radeon RX Vega M GH vs Intel HD Graphics P630 vs Intel Iris Plus Graphics 655
AMD Radeon RX Vega M GH ► remove from comparison
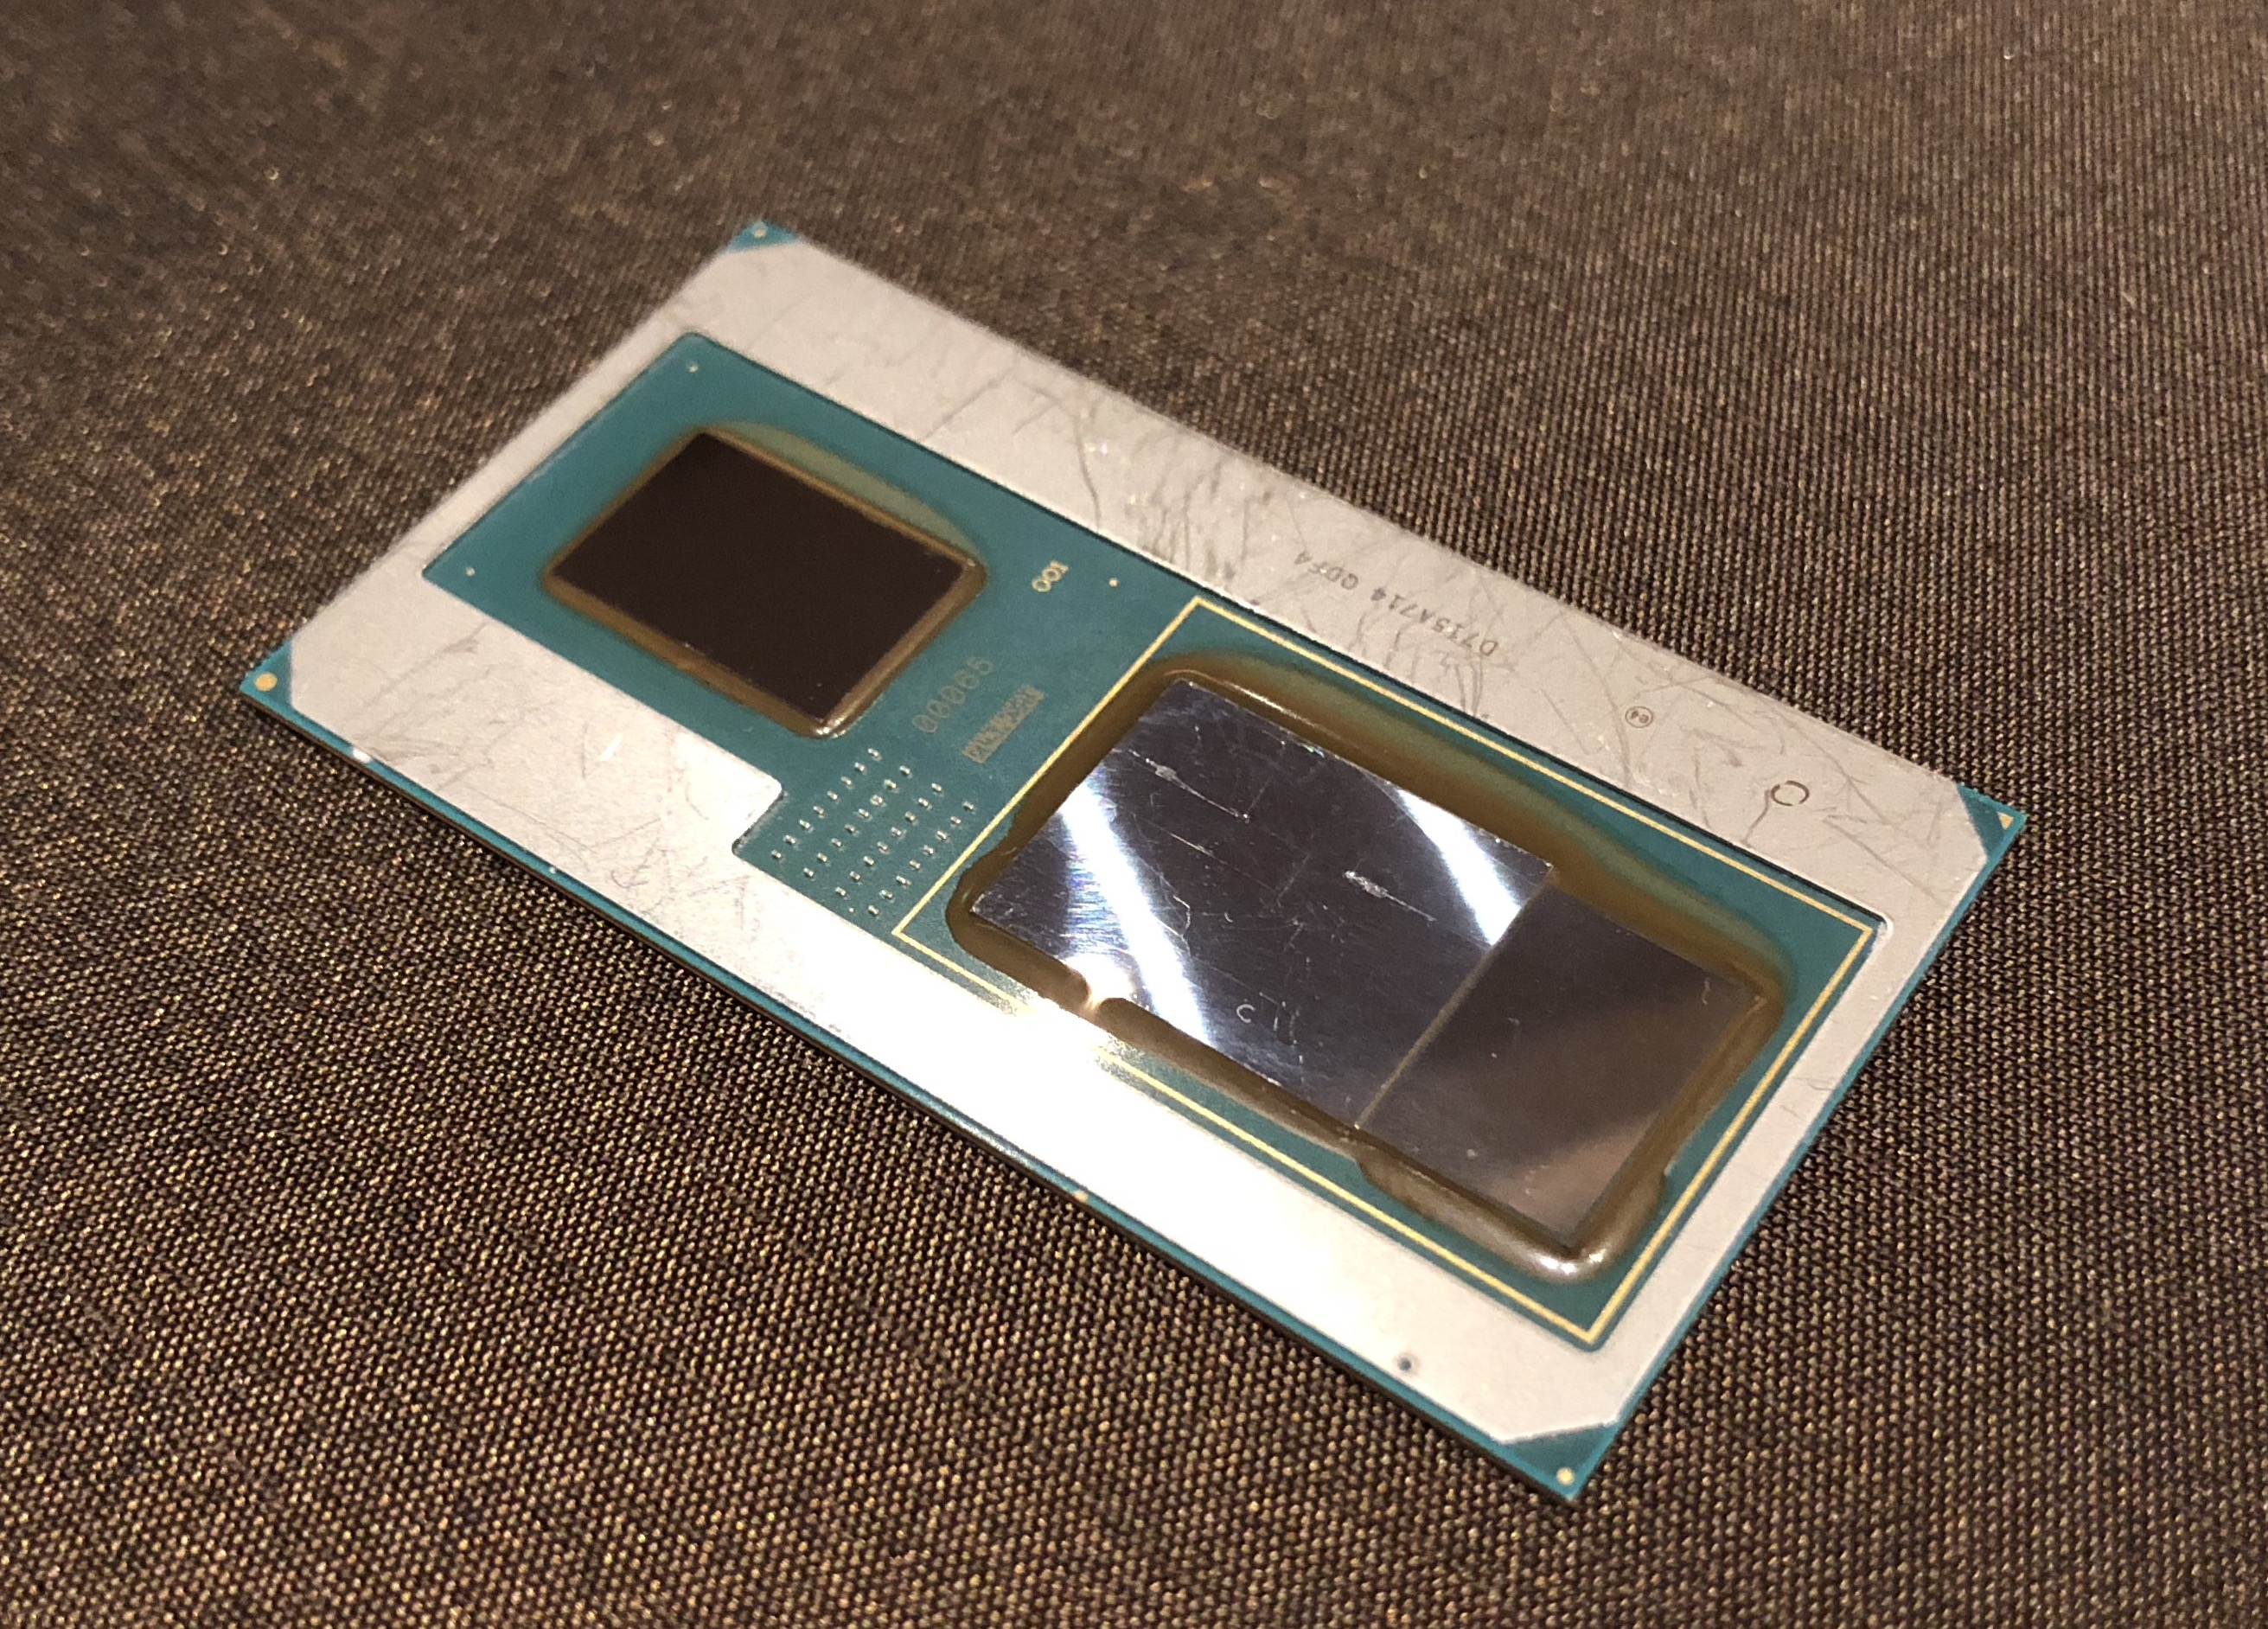
The AMD Radeon RX Vega M GH is an integrated GPU in the fastest Intel Kaby-Lake-G SoC. It combines a Kaby-Lake processor, a Vega graphics card and 4 GB HBM2 memory on a single package. The graphics card offers 24 CUs (1536 shaders) and is clocked from 1063 - 1190 MHz.
Currently it looks like the GPU is a mixture of Polaris (Shaders?) and Vega (HBM memory controller at least). E.g. the graphics card is called Polaris 22 internally. Detailed information on the Vega architecture can be found in our dedicated article about the Raven Ridge architecture .
The performance of the Vega M GH should be slightly slower than a dedicated Nvidia GeForce GTX 1060 for laptops according to benchmarks from Intel. Therefore, it should be well suited for 1080p and high resolution gaming.
The power consumption should be quite similar to a dedicated Vega Mobile GPU, but due to the small form factor, smaller laptops can be built with the Kaby-Lake-G SoC. The TDP is specified at 65 Watt for the whole package including GPU, CPU and HBM2 memory.
Intel HD Graphics P630 ► remove from comparison
The Intel HD Graphics P630 (GT2) is an integrated graphics unit, which can be found in various Xeon workstation processors of the Kaby Lake generation. The "GT2" version of the Skylake GPU offers 24 Execution Units (EUs) clocked at up to 1050 MHz (depending on the CPU model). Due to its lack of dedicated graphics memory or eDRAM cache, the P630 has to access the main memory (2x 64bit DDR3L-1600 / DDR4-2133). It uses the same silicon as the consumer HD Graphics 630 in Kaby-Lake-H processors but features optimized drivers for workstaion and CAD software. According to Intel it is certified for 15 applications (see list ).
Performance
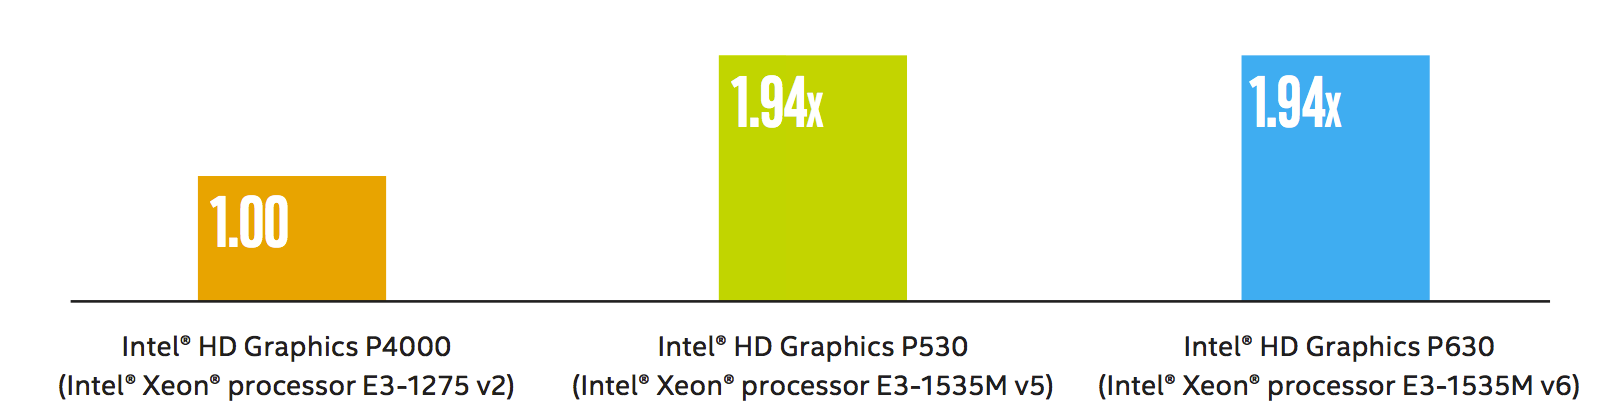
According to Intel, the performance of the P630 is identical to the Intel HD Graphis P530 (Skylake predecessor) processor graphics card and 1.94x faster than the old Intel HD Graphics P4000. Compared to consumer cards, the gaming performance should be on a similar level to the dedicated GeForce 920M and will handle old games (as of 2015) in low or medium settings.
Features
The revised video engine in the Kaby Lake chips now supports H.265/HEVC Main10 profile at 10-bit color depth and also the VP9 codec in hardware. Furthermore, HDCP 2.2 is also supported in all chips, which allows Netflix 4K videos, for instance.
Power Consumption
The HD Graphics P630 can be found in mobile quad-core Xeon processors with 45 W TDP and also desktop processors of the Xeon range with higher TDPs.
Source : http://www.intel.com/content/dam/www/public/us/en/documents/guides/hd-graphics-performance-guide.pdf
Intel Iris Plus Graphics 655 ► remove from comparison
The Intel Iris Plus Graphics 655 (GT3e) is a processor graphics card announced in September 2017. As the successor to the Intel Iris Graphics 650 (Kaby Lake), the Iris Plus Graphics 655 is used for 28-Watt Coffee Lake-U models. The biggest difference is the doubled eDRAM-cache at 128 MB. There should not be any big changes compared to the Iris Graphics 650.
The so called GT3e version of the Kaby Lake GPU still has 48 Execution Units (EUs), which can reach up to 1200 MHz (previously 1100 MHz) depending on the model. Besides eDRAM cache, the Iris 655 can also access the system memory (2x 64 Bit DDR3L-2133/DDR4-2400) via processor interface.
Compared to the Iris Plus 640 from the 15-Watt models, the Iris 655 only has a slightly higher maximum clock as well as almost twice the TDP, which allows a better utilization of the Turbo Boost potential.
The exact performance of the Iris Plus Graphics 655 depends on the CPU model, because maximum clock as well as the size of the L3 cache can differ a bit. The system memory (DDR3/DDR4) will influence the performance as well.
The fastest chips are high-clocked Core i7 models like the Core i7-8559U. Depending on the game, the Iris Plus 655 will probably be on par with a dedicated GeForce 930M or GeForce 940MX and can handle smooth gameplay in modern titles in low up to medium settings.
The reworked video engine now fully supports hardware decoding of H.265/HEVC videos. Contrary to Skylake, however, Kaby Lake can now also decode H.265/HEVC Main 10 with a 10-bit color depth as well as Google's VP9 codec. The video output is possible via DP 1.2/eDP 1.3 (up to 3840 x 2160 @60 Hz), whereas HDMI is also supported in the older 1.4a standard. An HDMI 2.0 output can be added via converter from DisplayPort. The GPU can drive up to three displays simultaneously.
The Iris Plus Graphics 655 is used for 28-Watt processor and therefore small/medium-sized notebooks.
AMD Radeon RX Vega M GH Intel HD Graphics P630 Intel Iris Plus Graphics 655 Gen. 9.5 Series Codename Vega Kaby Lake-G Kaby-Lake-H-GT2 Kaby Lake GT3e Architecture Vega Gen. 9.5 Kaby Lake Gen. 9.5 Kaby Lake Pipelines 1536 - unified 24 - unified 48 - unified Core Speed 1063 - 1190 (Boost) MHz 300 - 1200 (Boost) MHz Memory Type HBM2 DDR3/DDR4 Max. Amount of Memory 4 GB Shared Memory no yes yes API DirectX 12_1 DirectX 12_1, OpenGL 4.4 DirectX 12_1, OpenGL 4.5 Power Consumption 100 Watt technology 14 nm 14 nm 14 nm Features Tiled Rasterization, Shared Memory (up to Dual-Channel DDR4-2400) QuickSync QuickSync Notebook Size medium sized Date of Announcement 07.01.2018 05.08.2015 01.09.2017 Memory Bus Width 64/128 Bit
Benchmarks Performance Rating - 3DMark 11 + Fire Strike + Time Spy - Vega M GH
4.7 pt (14%)
...
...
max:
Performance Rating - 3DMark 11 + Fire Strike + Time Spy - Iris Plus Graphics 655
0.9 pt (3%)
...
Intel Iris Plus Graphics 655
...
max:
3DMark - 3DMark Time Spy Score
min: 2902 avg: 2999 median: 2999 (9%) max: 3096 Points
400 Points (1%)
min: 348 avg: 647 median: 684 (2%) max: 722 Points
3DMark - 3DMark Time Spy Graphics
2908 Points (8%)
min: 301 avg: 570 median: 604.5 (2%) max: 633 Points
3DMark - 3DMark Ice Storm Unlimited Graphics
357446 Points (41%)
min: 131607 avg: 139716 median: 137266 (16%) max: 152727 Points
3DMark - 3DMark Ice Storm Extreme Graphics
282345 Points (36%)
min: 57033 avg: 72655 median: 71073 (9%) max: 89859 Points
3DMark - 3DMark Cloud Gate Score
min: 24532 avg: 24989 median: 24988.5 (27%) max: 25445 Points
8280 Points (9%)
min: 6769 avg: 10798 median: 11622 (12%) max: 13037 Points
3DMark - 3DMark Cloud Gate Graphics
59162 Points (16%)
min: 6498 avg: 13736 median: 14343 (4%) max: 16698 Points
3DMark - 3DMark Fire Strike Standard Score
min: 7425 avg: 8693 median: 8506 (15%) max: 10147 Points
1040 Points (2%)
min: 852 avg: 1703 median: 1850 (3%) max: 2040 Points
3DMark - 3DMark Fire Strike Standard Graphics
10248 Points (12%)
min: 920 avg: 1836 median: 1983 (2%) max: 2260 Points
3DMark - 3DMark Ice Storm Graphics
319822 Points (38%)
min: 85405 avg: 107151 median: 110302 (13%) max: 122594 Points
3DMark 11 - 3DM11 Performance Score
13212 Points (18%)
min: 1548 avg: 2942 median: 3180.5 (4%) max: 3349 Points
3DMark 11 - 3DM11 Performance GPU
14302 Points (12%)
min: 1365 avg: 2707 median: 2894 (2%) max: 3081 Points
3DMark Vantage + Intel Iris Plus Graphics 655 3DMark Vantage - 3DM Vant. Perf. total
min: 12093 avg: 12287 median: 12287 (4%) max: 12481 Points
3DM Vant. Perf. GPU no PhysX + Intel Iris Plus Graphics 655 3DMark Vantage - 3DM Vant. Perf. GPU no PhysX
min: 10337 avg: 10514 median: 10513.5 (6%) max: 10690 Points
3DMark 05 - 3DMark 05 - Standard
22740 Points (25%)
3DMark 06 3DMark 06 - Standard 1280x1024 + AMD Radeon RX Vega M GH
33046 Points (43%)
3DMark 06 - Standard 1280x1024 + Intel Iris Plus Graphics 655
min: 17176 avg: 17885 median: 17885 (23%) max: 18594 Points
Unigine Valley 1.0 - Unigine Valley 1.0 DX
8.2 fps (3%)
SPECviewperf 12 + AMD Radeon RX Vega M GH SPECviewperf 12 - specvp12 sw-03
66.9 fps (17%)
specvp12 sw-03 + Intel Iris Plus Graphics 655
28.2 fps (7%)
specvp12 snx-02 + AMD Radeon RX Vega M GH SPECviewperf 12 - specvp12 snx-02
20.8 fps (3%)
specvp12 snx-02 + Intel Iris Plus Graphics 655 2.1 fps (0%)
specvp12 showcase-01 + AMD Radeon RX Vega M GH SPECviewperf 12 - specvp12 showcase-01
49.3 fps (11%)
specvp12 showcase-01 + Intel Iris Plus Graphics 655
10.3 fps (2%)
specvp12 mediacal-01 + AMD Radeon RX Vega M GH SPECviewperf 12 - specvp12 mediacal-01
21.4 fps (5%)
specvp12 mediacal-01 + Intel Iris Plus Graphics 655
4.6 fps (1%)
specvp12 maya-04 + AMD Radeon RX Vega M GH SPECviewperf 12 - specvp12 maya-04
54 fps (15%)
specvp12 maya-04 + Intel Iris Plus Graphics 655
20.4 fps (6%)
specvp12 energy-01 + AMD Radeon RX Vega M GH SPECviewperf 12 - specvp12 energy-01
3.5 fps (3%)
specvp12 energy-01 + Intel Iris Plus Graphics 655 0.3 fps (0%)
specvp12 creo-01 + AMD Radeon RX Vega M GH SPECviewperf 12 - specvp12 creo-01
45.6 fps (18%)
specvp12 creo-01 + Intel Iris Plus Graphics 655
14.9 fps (6%)
specvp12 catia-04 + AMD Radeon RX Vega M GH SPECviewperf 12 - specvp12 catia-04
77 fps (13%)
specvp12 catia-04 + Intel Iris Plus Graphics 655
18.8 fps (3%)
specvp12 3dsmax-05 + Intel Iris Plus Graphics 655 SPECviewperf 12 - specvp12 3dsmax-05
18.1 fps (3%)
SPECviewperf 13 specvp13 sw-04 + Intel Iris Plus Graphics 655 SPECviewperf 13 - specvp13 sw-04
34.6 fps (9%)
specvp13 snx-03 + Intel Iris Plus Graphics 655 SPECviewperf 13 - specvp13 snx-03
3.8 fps (0%)
specvp13 showcase-02 + Intel Iris Plus Graphics 655 SPECviewperf 13 - specvp13 showcase-02
10.3 fps (2%)
specvp13 medical-02 + Intel Iris Plus Graphics 655 SPECviewperf 13 - specvp13 medical-02
3.8 fps (1%)
specvp13 maya-05 + Intel Iris Plus Graphics 655 SPECviewperf 13 - specvp13 maya-05
25.9 fps (3%)
specvp13 energy-02 + Intel Iris Plus Graphics 655 SPECviewperf 13 - specvp13 energy-02
1.1 fps (0%)
specvp13 creo-02 + Intel Iris Plus Graphics 655 SPECviewperf 13 - specvp13 creo-02
19.6 fps (3%)
specvp13 catia-05 + Intel Iris Plus Graphics 655 SPECviewperf 13 - specvp13 catia-05
26.4 fps (3%)
specvp13 3dsmax-06 + Intel Iris Plus Graphics 655 SPECviewperf 13 - specvp13 3dsmax-06
18.2 fps (3%)
SPECviewperf 2020 specvp2020 solidworks-05 4k + Intel Iris Plus Graphics 655 SPECviewperf 2020 - specvp2020 solidworks-05 4k
21.2 fps (6%)
specvp2020 snx-04 4k + Intel Iris Plus Graphics 655 SPECviewperf 2020 - specvp2020 snx-04 4k
3.8 fps (0%)
specvp2020 medical-03 4k + Intel Iris Plus Graphics 655 SPECviewperf 2020 - specvp2020 medical-03 4k
1.8 fps (2%)
specvp2020 maya-06 4k + Intel Iris Plus Graphics 655 SPECviewperf 2020 - specvp2020 maya-06 4k
32.7 fps (5%)
specvp2020 energy-03 4k + Intel Iris Plus Graphics 655 SPECviewperf 2020 - specvp2020 energy-03 4k
1.1 fps (0%)
specvp2020 creo-03 4k + Intel Iris Plus Graphics 655 SPECviewperf 2020 - specvp2020 creo-03 4k
12.1 fps (6%)
specvp2020 catia-06 4k + Intel Iris Plus Graphics 655 SPECviewperf 2020 - specvp2020 catia-06 4k
6.3 fps (4%)
specvp2020 3dsmax-07 4k + Intel Iris Plus Graphics 655 SPECviewperf 2020 - specvp2020 3dsmax-07 4k
8.4 fps (3%)
Cinebench R10 Cinebench R10 Shading (32bit) + AMD Radeon RX Vega M GH Cinebench R10 - Cinebench R10 Shading (32bit)
13015 Points (9%)
Cinebench R10 Shading (32bit) + Intel Iris Plus Graphics 655
min: 7836 avg: 9544 median: 10263 (7%) max: 10533 Points
Cinebench R11.5 Cinebench R11.5 OpenGL 64 Bit + AMD Radeon RX Vega M GH Cinebench R11.5 - Cinebench R11.5 OpenGL 64 Bit
123.3 fps (43%)
Cinebench R11.5 OpenGL 64 Bit + Intel Iris Plus Graphics 655
min: 50.25 avg: 51.4 median: 51.6 (18%) max: 52.2 fps
Cinebench R15 + AMD Radeon RX Vega M GH Cinebench R15 - Cinebench R15 OpenGL 64 Bit
min: 136 avg: 144 median: 144 (8%) max: 151.9 fps
Cinebench R15 OpenGL 64 Bit + Intel Iris Plus Graphics 655
min: 33.91 avg: 67 median: 74 (4%) max: 88 fps
Cinebench R15 OpenGL Ref. Match 64 Bit + AMD Radeon RX Vega M GH Cinebench R15 - Cinebench R15 OpenGL Ref. Match 64 Bit
98 % (98%)
Cinebench R15 OpenGL Ref. Match 64 Bit + Intel Iris Plus Graphics 655
min: 97.8 avg: 98.1 median: 97.8 (98%) max: 99.3 %
GFXBench 3.1 - GFXBench Manhattan ES 3.1 Offscreen
min: 43.1 avg: 2387 median: 2387.1 (50%) max: 4731 fps
GFXBench 3.0 - GFXBench 3.0 Manhattan Offscreen
199.6 fps (12%)
GFXBench (DX / GLBenchmark) 2.7 + Intel Iris Plus Graphics 655 GFXBench (DX / GLBenchmark) 2.7 - GFXBench T-Rex HD Offscreen C24Z16
min: 199.6 avg: 6375 median: 6375.3 (51%) max: 12551 fps
LuxMark v2.0 64Bit - LuxMark v2.0 Room GPU
1491 Samples/s (7%)
min: 359 avg: 419.5 median: 419.5 (2%) max: 480 Samples/s
LuxMark v2.0 64Bit - LuxMark v2.0 Sala GPU
2867 Samples/s (5%)
min: 882 avg: 1038 median: 1038 (2%) max: 1194 Samples/s
ComputeMark v2.1 - ComputeMark v2.1 Result
6661 Points (7%)
min: 1584 avg: 1713 median: 1712.5 (2%) max: 1841 Points
Power Consumption - Furmark Stress Test Power Consumption - external Monitor *
min: 28.9 avg: 37.4 median: 39.2 (6%) max: 42.4 Watt
Power Consumption - The Witcher 3 Power Consumption - external Monitor *
min: 35.3 avg: 40.6 median: 39.4 (6%) max: 47.2 Watt
Power Consumption - Witcher 3 Power Consumption *
121.7 Watt (27%)
min: 39.4 avg: 43.3 median: 43.3 (10%) max: 47.2 Watt
Power Consumption - Witcher 3 ultra Power Efficiency
0.3 fps per Watt (28%)
0.1 fps per Watt (14%)
Power Consumption - Witcher 3 ultra Power Efficiency - external Monitor
0.2 fps per Watt (13%)
Emissions Witcher 3 Fan Noise + AMD Radeon RX Vega M GH Emissions - Witcher 3 Fan Noise
42 dB(A) (67%)
Witcher 3 Fan Noise + Intel Iris Plus Graphics 655
min: 32.5 avg: 36.2 median: 37.2 (60%) max: 39 dB(A)
Clock Speed - GPU Clock Witcher 3 ultra
1190 MHz (47%)
998 MHz (39%)
Clock Speed - GPU Clock Speed Furmark
1190 MHz (47%)
Average Benchmarks AMD Radeon RX Vega M GH → 100% n=3 Average Benchmarks Intel HD Graphics P630 → 20% n=3 Average Benchmarks Intel Iris Plus Graphics 655 → 30% n=3
- Range of benchmark values for this graphics card
- Average benchmark values for this graphics card
* Smaller numbers mean a higher performance
1 This benchmark is not used for the average calculation
Game Benchmarks The following benchmarks stem from our benchmarks of review laptops. The performance depends on the used graphics memory, clock rate, processor, system settings, drivers, and operating systems. So the results don't have to be representative for all laptops with this GPU. For detailed information on the benchmark results, click on the fps number.
Iris Plus Graphics 655:
44.6 fps
Iris Plus Graphics 655:
21.6 fps
Iris Plus Graphics 655:
16.4 fps
Iris Plus Graphics 655:
10.2 fps
20%
Iris Plus Graphics 655:
40.7 fps
18%
Iris Plus Graphics 655:
19.1 fps
18%
Iris Plus Graphics 655:
14.5 fps
17%
Iris Plus Graphics 655:
9.6 fps
41%
Iris Plus Graphics 655:
54.8 fps
20%
Iris Plus Graphics 655:
17.3 fps
24%
Iris Plus Graphics 655:
11.6 fps
Iris Plus Graphics 655:
0 (!) [X] Intel NUC8i7BE Intel Core i7-8559U 2.7GHz
Iris Plus Graphics 655
fps
Iris Plus Graphics 655:
29.1 [X] Intel NUC8i7BE Intel Core i7-8559U 2.7GHz
Iris Plus Graphics 655
min:
17 fps, max:
36 fps
fps
Iris Plus Graphics 655:
16.2 [X] Intel NUC8i7BE Intel Core i7-8559U 2.7GHz
Iris Plus Graphics 655
min:
11 fps, max:
22 fps
fps
Iris Plus Graphics 655:
14.1 [X] Intel NUC8i7BE Intel Core i7-8559U 2.7GHz
Iris Plus Graphics 655
min:
11 fps, max:
21 fps
fps
Iris Plus Graphics 655:
6.6 [X] Intel NUC8i7BE Intel Core i7-8559U 2.7GHz
Iris Plus Graphics 655
min:
3 fps, max:
9 fps
fps
Iris Plus Graphics 655:
59.8 [X] Intel NUC8i7BE Intel Core i7-8559U 2.7GHz
Iris Plus Graphics 655
min:
56 fps, max:
62 fps
fps
Iris Plus Graphics 655:
27.2 [X] Intel NUC8i7BE Intel Core i7-8559U 2.7GHz
Iris Plus Graphics 655
min:
20 fps, max:
31 fps
fps
Iris Plus Graphics 655:
15.8 [X] Intel NUC8i7BE Intel Core i7-8559U 2.7GHz
Iris Plus Graphics 655
min:
3.7 fps, P1:
6.17 fps, max:
130 fps
fps
Iris Plus Graphics 655:
0 (!) [X] Intel NUC8i7BE Intel Core i7-8559U 2.7GHz
Iris Plus Graphics 655
fps
Iris Plus Graphics 655:
36.3 (!) [X] Intel NUC8i7BE Intel Core i7-8559U 2.7GHz
Iris Plus Graphics 655
P1:
24.6 fps
fps
Iris Plus Graphics 655:
20.9 (!) [X] Intel NUC8i7BE Intel Core i7-8559U 2.7GHz
Iris Plus Graphics 655
P1:
14.5 fps
fps
0%
Iris Plus Graphics 655:
0 (!) [X] Intel NUC8i7BE Intel Core i7-8559U 2.7GHz
Iris Plus Graphics 655
fps
62%
Iris Plus Graphics 655:
92 [X] Intel NUC8i7BE DirectX 11
Intel Core i7-8559U 2.7GHz
Iris Plus Graphics 655
P1:
74.1 fps
fps
39%
Iris Plus Graphics 655:
55.9 [X] Intel NUC8i7BE DirectX 11
Intel Core i7-8559U 2.7GHz
Iris Plus Graphics 655
P1:
47.4 fps
fps
33%
Iris Plus Graphics 655:
46.3 [X] Intel NUC8i7BE DirectX 11
Intel Core i7-8559U 2.7GHz
Iris Plus Graphics 655
P1:
35.6 fps
fps
25%
Iris Plus Graphics 655:
34.9 [X] Intel NUC8i7BE DirectX 11
Intel Core i7-8559U 2.7GHz
Iris Plus Graphics 655
P1:
31.3 fps
fps
21%
Iris Plus Graphics 655:
26.5 [X] Intel NUC8i7BE DirectX 11
Intel Core i7-8559U 2.7GHz
Iris Plus Graphics 655
P1:
24 fps
fps
18%
Iris Plus Graphics 655:
13.6 [X] Intel NUC8i7BE DirectX 11
Intel Core i7-8559U 2.7GHz
Iris Plus Graphics 655
P1:
12 fps
fps
28%
Iris Plus Graphics 655:
22.5 23.5 ~ 23 fps
20%
Iris Plus Graphics 655:
10.2 10.4 ~ 10 fps
22%
Iris Plus Graphics 655:
6.4 6.7 ~ 7 fps
25%
Iris Plus Graphics 655:
25.4 (!) [X] Intel NUC8i7BE Intel Core i7-8559U 2.7GHz
Iris Plus Graphics 655
min:
20 fps, max:
31 fps
fps
38%
Iris Plus Graphics 655:
51.2 [X] Intel NUC8i7BE Intel Core i7-8559U 2.7GHz
Iris Plus Graphics 655
min:
46 fps, max:
56 fps
fps
25%
Iris Plus Graphics 655:
21.9 [X] Intel NUC8i7BE Intel Core i7-8559U 2.7GHz
Iris Plus Graphics 655
min:
19 fps, max:
23 fps
fps
26%
Iris Plus Graphics 655:
19.3 [X] Intel NUC8i7BE Intel Core i7-8559U 2.7GHz
Iris Plus Graphics 655
min:
17 fps, max:
21 fps
fps
38%
Iris Plus Graphics 655:
56.7 [X] Intel NUC8i7BE Intel Core i7-8559U 2.7GHz
Iris Plus Graphics 655
min:
51 fps, max:
63 fps
fps
37%
Iris Plus Graphics 655:
18.5 [X] Intel NUC8i7BE Intel Core i7-8559U 2.7GHz
Iris Plus Graphics 655
min:
14 fps, max:
24 fps
fps
35%
Iris Plus Graphics 655:
10.5 [X] Intel NUC8i7BE Intel Core i7-8559U 2.7GHz
Iris Plus Graphics 655
min:
8 fps, max:
13 fps
fps
24%
Iris Plus Graphics 655:
24.5 fps
Iris Plus Graphics 655:
30.2 [X] Intel NUC8i7BE Intel Core i7-8559U 2.7GHz
Iris Plus Graphics 655
min:
26 fps, max:
34 fps
fps
61%
Iris Plus Graphics 655:
35 fps
39%
Iris Plus Graphics 655:
64 [X] Intel NUC8i7BE Intel Core i7-8559U 2.7GHz
Iris Plus Graphics 655
min:
57 fps, max:
76 fps
fps
29%
Iris Plus Graphics 655:
22.8 [X] Intel NUC8i7BE Intel Core i7-8559U 2.7GHz
Iris Plus Graphics 655
min:
20 fps, max:
25 fps
fps
70%
Iris Plus Graphics 655:
16.6 [X] Intel NUC8i7BE Intel Core i7-8559U 2.7GHz
Iris Plus Graphics 655
min:
8 fps, max:
21 fps
fps
31%
Iris Plus Graphics 655:
21 22 [X] Intel NUC8i7BE Intel Core i7-8559U 2.7GHz
Iris Plus Graphics 655
min:
19 fps, max:
27 fps
~ 22 fps
20%
Iris Plus Graphics 655:
11 [X] Intel NUC8i7BE Intel Core i7-8559U 2.7GHz
Iris Plus Graphics 655
min:
10 fps, max:
14 fps
11 ~ 11 fps
20%
Iris Plus Graphics 655:
10 fps
19%
Iris Plus Graphics 655:
9 fps
22%
Iris Plus Graphics 655:
18.3 [X] Intel NUC8i7BE Intel Core i7-8559U 2.7GHz
Iris Plus Graphics 655
min:
10.36 fps, max:
31.73 fps
20.1 ~ 19 fps
23%
Iris Plus Graphics 655:
10.1 fps
26%
Iris Plus Graphics 655:
7.4 fps
12%
Iris Plus Graphics 655:
19.9 [X] Intel NUC8i7BE Intel Core i7-8559U 2.7GHz
Iris Plus Graphics 655
min:
1 fps, max:
33 fps
fps
Iris Plus Graphics 655:
0 (!) fps
Iris Plus Graphics 655:
13 18 [X] Intel NUC8i7BE Intel Core i7-8559U 2.7GHz
Iris Plus Graphics 655
min:
7 fps, max:
26 fps
~ 16 fps
Iris Plus Graphics 655:
25 fps
Iris Plus Graphics 655:
0 (!) fps
Iris Plus Graphics 655:
82 [X] Intel NUC8i7BE Intel Core i7-8559U 2.7GHz
Iris Plus Graphics 655
min:
70 fps, max:
96 fps
fps
Iris Plus Graphics 655:
45.8 [X] Intel NUC8i7BE Intel Core i7-8559U 2.7GHz
Iris Plus Graphics 655
min:
39 fps, max:
51 fps
fps
Iris Plus Graphics 655:
40.3 [X] Intel NUC8i7BE Intel Core i7-8559U 2.7GHz
Iris Plus Graphics 655
min:
32 fps, max:
48 fps
fps
Iris Plus Graphics 655:
36.7 [X] Intel NUC8i7BE Intel Core i7-8559U 2.7GHz
Iris Plus Graphics 655
min:
30 fps, max:
45 fps
fps
26%
Iris Plus Graphics 655:
11 13 ~ 12 fps
21%
Iris Plus Graphics 655:
8 10.1 ~ 9 fps
20%
Iris Plus Graphics 655:
41.4 fps
21%
Iris Plus Graphics 655:
17.6 fps
25%
Iris Plus Graphics 655:
16.9 fps
26%
Iris Plus Graphics 655:
14.5 fps
32%
Iris Plus Graphics 655:
45 fps
28%
Iris Plus Graphics 655:
23 fps
24%
Iris Plus Graphics 655:
17 fps
26%
Iris Plus Graphics 655:
12 12 ~ 12 fps
Iris Plus Graphics 655:
30.9 fps
Iris Plus Graphics 655:
20 22 23 [X] Intel NUC8i7BE Intel Core i7-8559U 2.7GHz
Iris Plus Graphics 655
min:
20 fps, max:
28 fps
~ 22 fps
Iris Plus Graphics 655:
10 11 [X] Intel NUC8i7BE Intel Core i7-8559U 2.7GHz
Iris Plus Graphics 655
min:
10 fps, max:
14 fps
11 ~ 11 fps
20%
Iris Plus Graphics 655:
10 fps
19%
Iris Plus Graphics 655:
9 fps
34%
Iris Plus Graphics 655:
15.7 250 ~ 133 fps
22%
Iris Plus Graphics 655:
40.3 fps
Iris Plus Graphics 655:
51.5 fps
Iris Plus Graphics 655:
21.6 fps
20%
Iris Plus Graphics 655:
13 fps
20%
Iris Plus Graphics 655:
30 fps
26%
Iris Plus Graphics 655:
18 fps
29%
Iris Plus Graphics 655:
14 fps
25%
Iris Plus Graphics 655:
9 fps
Iris Plus Graphics 655:
128 fps
Iris Plus Graphics 655:
125 fps
Iris Plus Graphics 655:
113 fps
Iris Plus Graphics 655:
57.8 fps
Iris Plus Graphics 655:
34.4 fps
Iris Plus Graphics 655:
20.4 22.7 [X] Intel NUC8i7BE Intel Core i7-8559U 2.7GHz
Iris Plus Graphics 655
min:
15 fps, max:
27 fps
~ 22 fps
Iris Plus Graphics 655:
10.2 fps
Iris Plus Graphics 655:
0 (!) 41.3 [X] Intel NUC8i7BE Intel Core i7-8559U 2.7GHz
Iris Plus Graphics 655
min:
31 fps, max:
65 fps
~ 21 fps
Iris Plus Graphics 655:
16.1 [X] Intel NUC8i7BE Intel Core i7-8559U 2.7GHz
Iris Plus Graphics 655
min:
13 fps, max:
21 fps
fps
Iris Plus Graphics 655:
28.7 [X] Intel NUC8i7BE Intel Core i7-8559U 2.7GHz
Iris Plus Graphics 655
min:
2.6 fps, max:
41.3 fps
fps
Iris Plus Graphics 655:
21.1 [X] Intel NUC8i7BE Intel Core i7-8559U 2.7GHz
Iris Plus Graphics 655
min:
16 fps, max:
29 fps
fps
Iris Plus Graphics 655:
91 fps
34%
Iris Plus Graphics 655:
68 fps
20%
Iris Plus Graphics 655:
29.9 fps
26%
Iris Plus Graphics 655:
18.2 fps
24%
Iris Plus Graphics 655:
19.4 fps
22%
Iris Plus Graphics 655:
11.3 fps
23%
Iris Plus Graphics 655:
10.5 fps
Iris Plus Graphics 655:
34.2 fps
Iris Plus Graphics 655:
21.2 fps
20%
Iris Plus Graphics 655:
25.9 39.2 ~ 33 fps
20%
Iris Plus Graphics 655:
17.6 22.3 ~ 20 fps
20%
Iris Plus Graphics 655:
10.8 fps
22%
Iris Plus Graphics 655:
8.9 fps
Iris Plus Graphics 655:
75.8 [X] Intel NUC8i7BE Intel Core i7-8559U 2.7GHz
Iris Plus Graphics 655
min:
12 fps, max:
128 fps
fps
Iris Plus Graphics 655:
0 (!) [X] Intel NUC8i7BE Intel Core i7-8559U 2.7GHz
Iris Plus Graphics 655
fps
Iris Plus Graphics 655:
11.6 12.2 ~ 12 fps
15%
Iris Plus Graphics 655:
14.6 17.8 ~ 16 fps
18%
Iris Plus Graphics 655:
10.1 10.9 ~ 11 fps
17%
Iris Plus Graphics 655:
5.6 5.6 ~ 6 fps
38%
Iris Plus Graphics 655:
57 61 68 [X] Intel NUC8i7BE Intel Core i7-8559U 2.7GHz
Iris Plus Graphics 655
min:
17.5 fps, P1:
40 fps, max:
131 fps
~ 62 fps
35%
Iris Plus Graphics 655:
51.2 51.8 62.1 [X] Intel NUC8i7BE Intel Core i7-8559U 2.7GHz
Iris Plus Graphics 655
min:
15.1 fps, P1:
37 fps, max:
117 fps
~ 55 fps
18%
Iris Plus Graphics 655:
13.7 14.3 15.8 [X] Intel NUC8i7BE Intel Core i7-8559U 2.7GHz
Iris Plus Graphics 655
min:
8.44 fps, P1:
11.9 fps, max:
85.5 fps
~ 15 fps
15%
Iris Plus Graphics 655:
5.2 5.5 6.2 [X] Intel NUC8i7BE Intel Core i7-8559U 2.7GHz
Iris Plus Graphics 655
min:
3.37 fps, P1:
4.2 fps, max:
28.7 fps
~ 6 fps
Iris Plus Graphics 655:
4.2 [X] Intel NUC8i7BE Intel Core i7-8559U 2.7GHz
Iris Plus Graphics 655
min:
2.38 fps, P1:
2.82 fps, max:
99 fps
fps
32%
Iris Plus Graphics 655:
78.4 116.6 ~ 98 fps
25%
Iris Plus Graphics 655:
54.3 64.8 ~ 60 fps
25%
Iris Plus Graphics 655:
49.4 55 ~ 52 fps
20%
Iris Plus Graphics 655:
15.5 17 ~ 16 fps
Iris Plus Graphics 655:
93.7 fps
Iris Plus Graphics 655:
49.6 fps
Iris Plus Graphics 655:
12.4 fps
Average Gaming AMD Radeon RX Vega M GH → 100% Average Gaming 30-70 fps → 100%
Average Gaming Intel Iris Plus Graphics 655 → 27% Average Gaming 30-70 fps → 33%
 Deutsch
 English
 Español
 Français
 Italiano
 Nederlands
 Polski
 Português
 Русский
 Türkçe
 Svenska
 Chinese
 Magyar