Notebookcheck Logo

Nvidia RTX A2000 vs NVIDIA RTX 3000 Ada Generation Laptop GPU

Nvidia RTX A2000

► remove from comparison NVIDIA RTX A2000

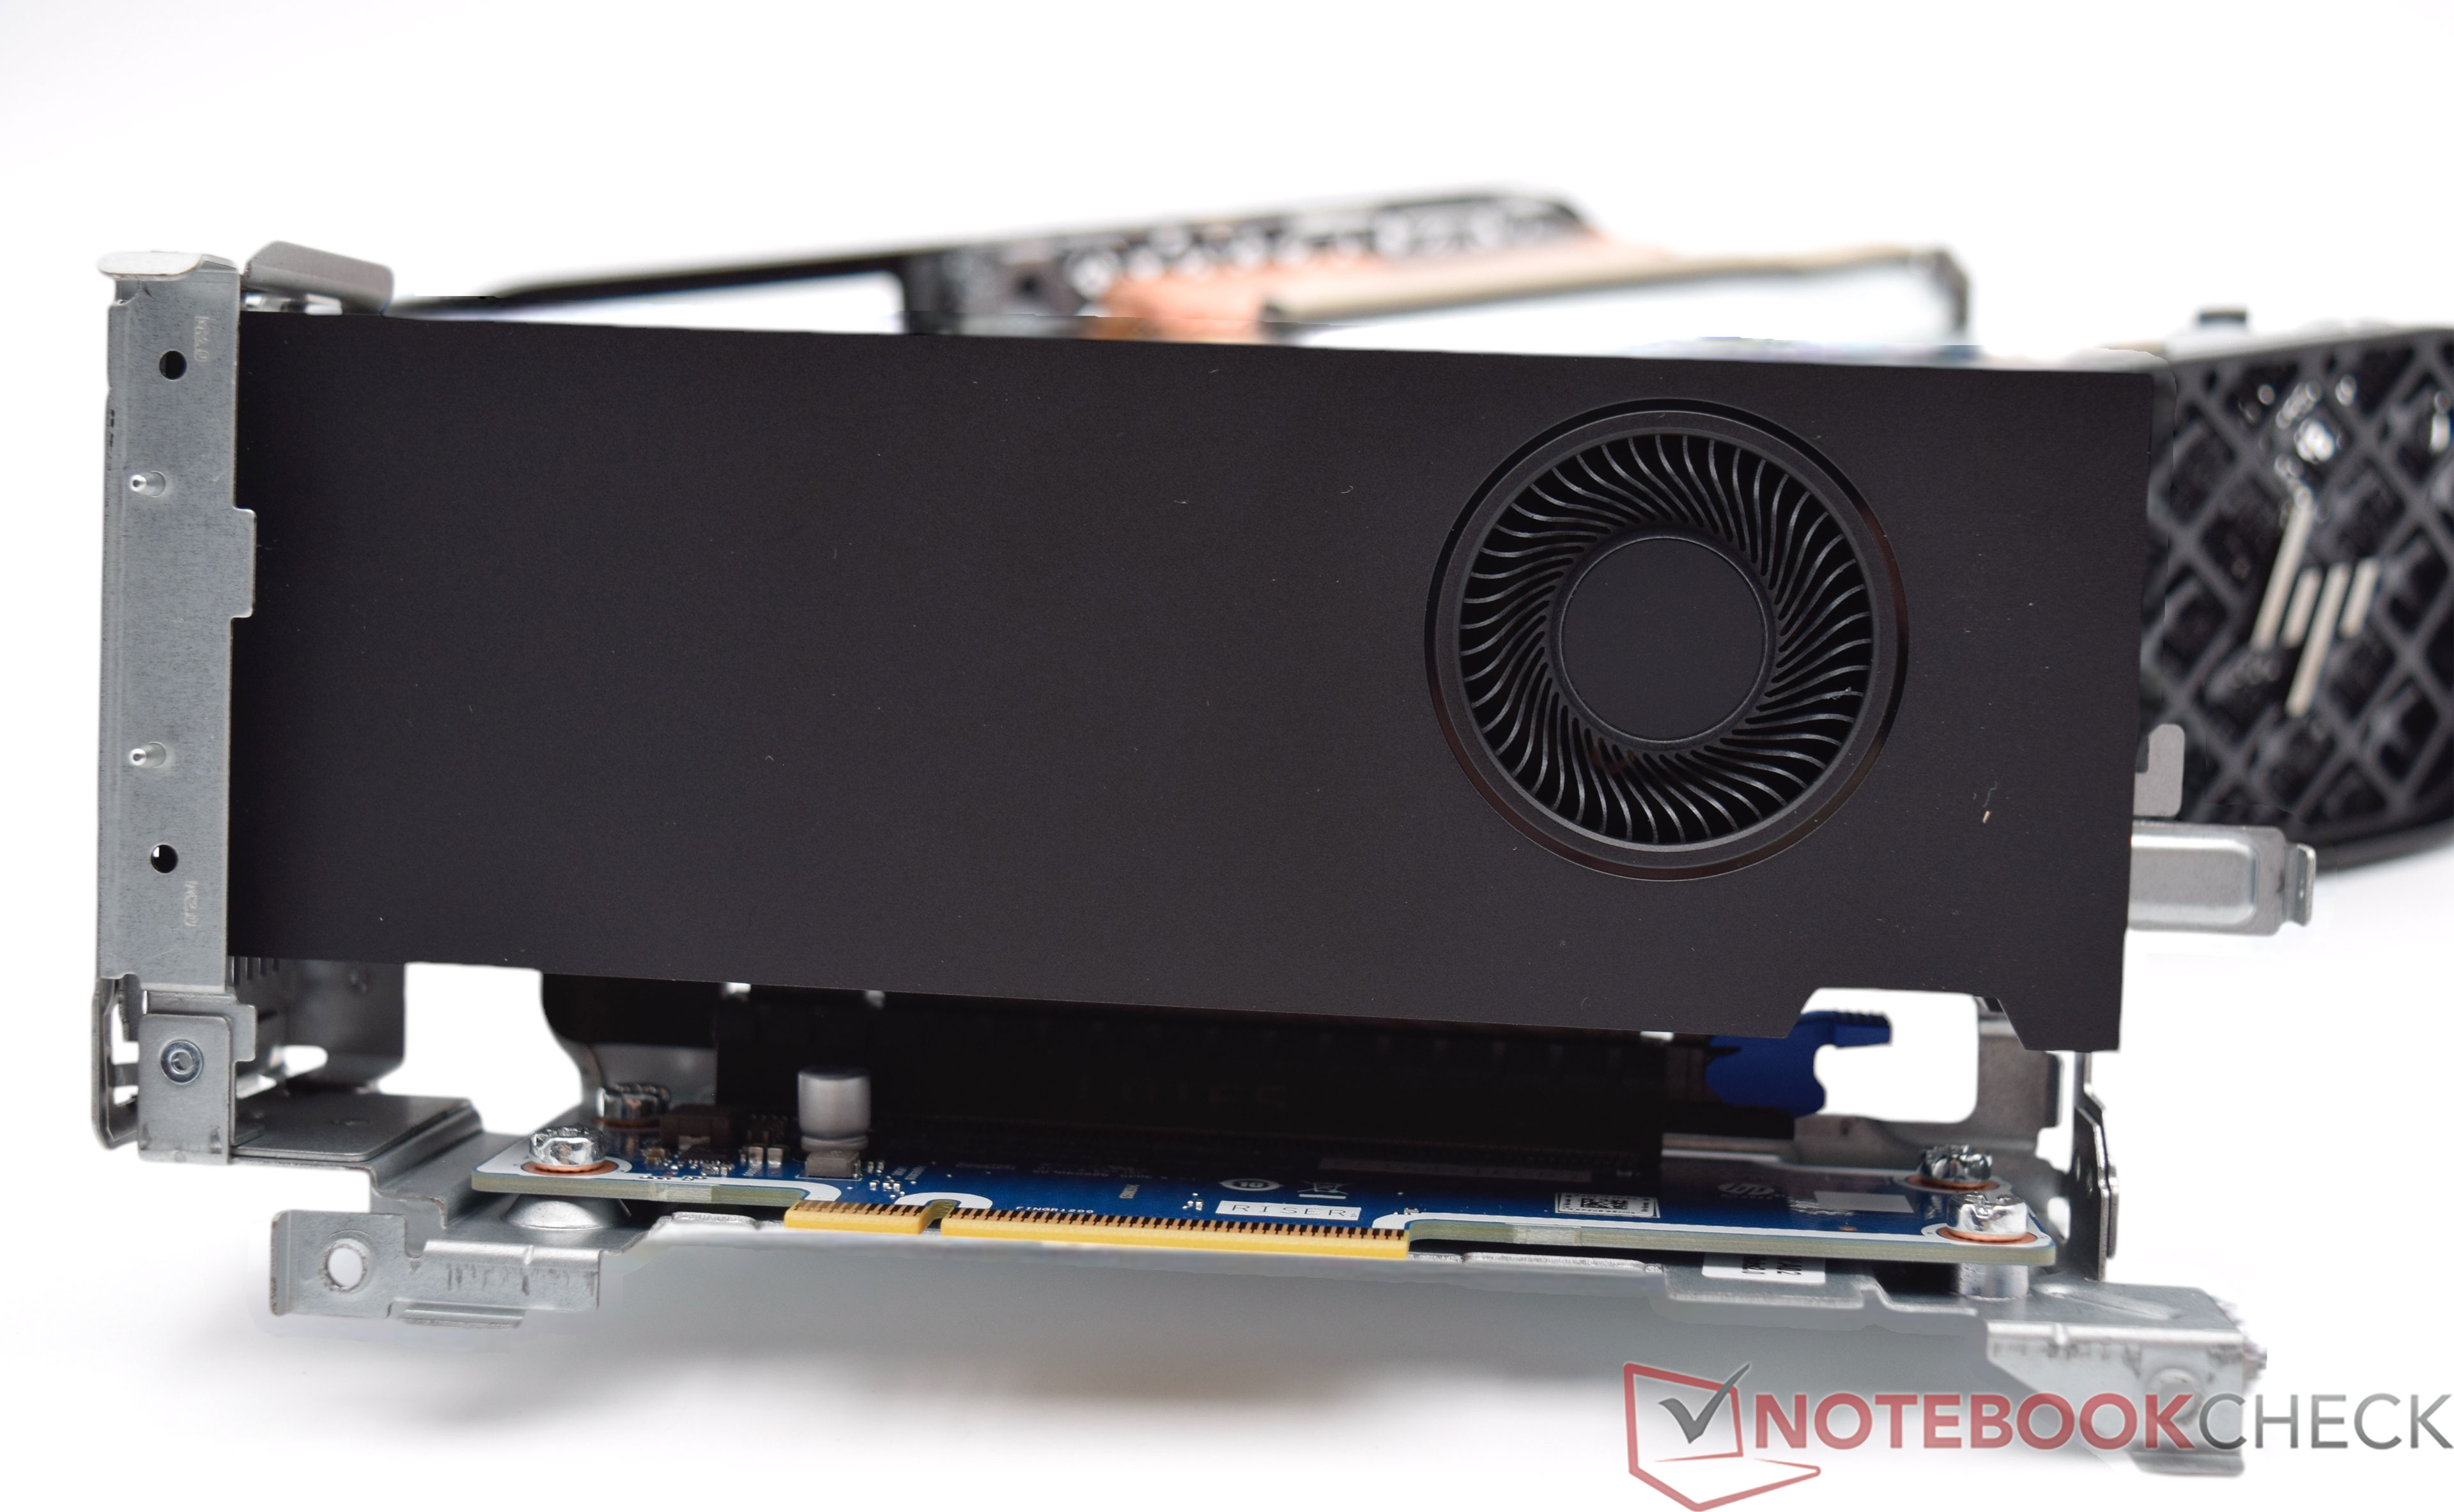
The Nvidia RTX A2000 Desktop GPU is a professional graphics card for small workstation PCs. It is based on the GA106 graphics chip, which is used in the GeForce RTX 3050 or GeForce RTX 3060 consumer graphics cards, among others. However, the GA106 only works with 3,328 active shader units, as well as 26 RT cores and 104 tensor units. The VRAM comprises 12 GB GDDR6 and communicates via a 192-bit memory interface. This results in a memory bandwidth of 288 GB/s.


The professional graphics cards from Nvidia offer certified drivers that are optimized for stability and performance in professional applications (CAD, DCC, medical, prospecting, visualization applications). This results in many advantages over consumer graphics cards.


Compact design and flexibility:


The RTX A2000 is designed in a low-profile form factor, making it ideal for smaller workstations or systems where space is a limited resource. Despite its compact size, the Nvidia RTX A2000 offers considerable computing power.


The graphics card is ideal for 3D modeling, CAD applications, video editing and visual effects where high precision and speed are paramount. Thanks to the combination of CUDA, Tensor and Raytracing cores, the Nvidia RTX A2000 offers significant performance improvements in the areas of real-time rendering and AI-supported image processing.


Energy efficiency and power consumption:


With a TDP of just 70 watts, the Nvidia RTX A2000 is one of the most energy efficient workstation GPUs on the market. This efficiency makes it possible to be more productive in workflows that require intensive graphics processing without compromising system performance or consuming excessive power.


In summary, the NVIDIA RTX A2000 is a compact, powerful and energy-efficient solution for professional users.

NVIDIA RTX 3000 Ada Generation Laptop GPU

► remove from comparison NVIDIA NVIDIA RTX 3000 Ada Generation Laptop GPU

The Nvidia RTX 3000 Ada Generation, not to be confused with the A3000, P3000 or RTX 3000 Turing Generation, is a higher-end professional graphics card for use in laptops that sports 4,608 CUDA cores and 8 GB of ECC GDDR6 VRAM (error correction can be turned off if desired). It would be fair to say that this is a GeForce RTX 4070 Laptop in disguise; consequently, the graphics card is fast enough for many games at 1440p with quality set to High. Brought into existence in 2023, the RTX 3000 leverages TSMC's 5 nm process and Nvidia's Ada Lovelace architecture to achieve very decent performance combined with moderate power consumption. The Nvidia-recommended TGP range for the card is very wide at 35 W to 140 W leading to bizarre performance differences between different systems powered by what is supposed to be the same product.

Quadro series graphics cards ship with much different BIOS and drivers than GeForce cards and are targeted at professional use rather than gaming. Commercial product design, large-scale calculations, simulation, data mining, 24 x 7 operation, certified drivers - if any of this sounds familiar, then a Quadro card will make you happy.

Architecture and Features

Ada Lovelace brings a range of improvements over older graphics cards utilizing the outgoing Ampere architecture. It's not just a better manufacturing process and a higher number of CUDA cores that we have here (up to 16,384 versus 10,752); under-the-hood refinements are plentiful, including an immensely larger L2 cache, an optimized ray tracing routine (a smarter technique is used to determine what is transparent and what isn't), and other changes. Naturally, these graphics cards can both encode and decode some of the most widely used video codecs, AVC, HEVC and AV1 included; they also support a host of Nvidia technologies, including Optimus and DLSS 3, and they can certainly be used for various AI tasks.

The RTX 3000 Ada features 36 RT cores of the 3rd generation, 144 Tensor cores of the 4th generation and 4,608 CUDA cores, making it ~11% inferior to the RTX 3500 Ada Generation as long as we disregard clock speed differences. (The 3500 also has more VRAM). The RTX 3000 comes with 8 GB of 128-bit wide ECC GDDR6 memory for throughput of ~256 GB/s. The fact that error correction is present here proves that the graphics adapter is indeed targeted at professional users, and it can be disabled if desired.

Just like Ampere-based cards, the RTX 3000 makes use of the PCI-Express 4 protocol. 8K SUHD monitors are supported, however, DP 1.4a video outputs can potentially prove to be a bottleneck down the line.

Performance

Having reviewed the Dell Precision 5480 and its 50 W RTX 3000 Ada in September 2023, we can firmly say the graphics card is in the same league as the RTX 4060 Laptop and the RTX 4050 Laptop, despite sharing most of its specifications with the RTX 4070 Laptop. 48 seconds in the Blender 3.3 Classroom CUDA test and a 3DMark 11 Performance GPU score of less than 30,000 points are nothing to write home about. The GPU's gaming talents are not mind-blowing, either, although it is certainly capable enough for 1080p gaming.

Nvidia's marketing materials mention "up to 20 TFLOPS" of performance, a very noticeable improvement over 14.5 TFLOPS delivered by the RTX 2000 Ada Generation. Your mileage may vary depending on how competent the cooling solution of your laptop is and how high the TGP power target of the graphics card is. A 100 W RTX 3000 Ada might be able to come close to the average RTX 4070 Laptop.

One other thing worth mentioning is that enabling error correction appears to reduce the amount of video memory that is available to applications and games by up to a gigabyte.

Power consumption

Nvidia no longer divides its laptop graphics cards into Max-Q and non-max-Q models. Instead, laptop makers are free to set the TGP according to their needs, and the range can sometimes be shockingly wide. This is especially the case for the RTX 3000, as the lowest value recommended for it sits at just 35 W while the highest is 300% higher at 140 W (this most likely includes Dynamic Boost). This is the kind of delta that we've be seeing on consumer-grade laptops featuring the latest GeForce RTX cards.

Last but not the least, the improved 5 nm process (TSMC 4N) the RTX 3000 Ada is built with makes for very decent energy efficiency, as of mid 2023.

Nvidia RTX A2000NVIDIA RTX 3000 Ada Generation Laptop GPU
RTX Ada Generation Laptop GPU Series
RTX A5500 Laptop GPU compare 7424 256 Bit @ 16000 MHz
RTX A4500 Laptop GPU compare 5888 @ 0.93 - 1.5 GHz256 Bit @ 16000 MHz
RTX A5000 Laptop GPU compare 6144 @ 1.22 - 1.77 GHz256 Bit @ 14000 MHz
RTX A4000 Laptop GPU compare 5120 @ 0.78 - 1.68 GHz256 Bit @ 12000 MHz
RTX A3000 Laptop GPU compare 4096 @ 1.08 - 1.56 GHz192 Bit @ 14000 MHz
RTX A2000 3328 @ 0.56 - 1.2 GHz192 Bit @ 12000 MHz
RTX A2000 Laptop GPU compare 2560 @ 0.89 - 1.69 GHz128 Bit @ 14000 MHz
RTX A1000 Laptop GPU compare 2048 128 Bit @ 14000 MHz
RTX A500 Laptop GPU compare 2048 64 Bit @ 14000 MHz
NVIDIA RTX 5000 Ada Generation Laptop GPU compare 9728 @ 0.93 - 1.68 GHz256 Bit @ 20000 MHz
NVIDIA RTX 4000 Ada Generation Laptop GPU compare 7424 192 Bit @ 16000 MHz
NVIDIA RTX 3500 Ada Generation Laptop GPU compare 5120 192 Bit @ 16000 MHz
NVIDIA RTX 3000 Ada Generation Laptop GPU 4608 128 Bit @ 16000 MHz
NVIDIA RTX 2000 Ada Generation Laptop GPU compare 3072 128 Bit @ 16000 MHz
Nvidia RTX 1000 Ada Generation Laptop GPU compare 2560 96 Bit @ 16000 MHz
Nvidia RTX 500 Ada Generation Laptop GPU compare 2048 64 Bit @ 12000 MHz
CodenameGA106
ArchitectureQuadro AmpereAda Lovelace
Pipelines3328 - unified4608 - unified
TMUs104144
ROPs4848
Raytracing Cores2636
Tensor / AI Cores104144
Core Speed562 - 1200 (Boost) MHz
Theoretical Performance7987 TFLOPS FP16, 7987 TFLOPS FP32, 0.1248 TFLOPS FP64
Memory Speed12000 effective = 1500 MHz16000 effective = 2000 MHz
Memory Bus Width192 Bit128 Bit
Memory TypeGDDR6GDDR6
Max. Amount of Memory12 GB8 GB
Shared Memorynono
Memory Bandwidth288 GB/s256 GB/s
APIDirectX 12 Ultimate (12_2), Shader 6.8, OpenGL 4.6, OpenCL 3.0, Vulkan 1.3DirectX 12 Ultimate, Shader 6.7, OpenGL 4.6, OpenCL 3.0, Vulkan 1.3
Power Consumption70 Watt115 Watt (35 - 115 Watt TGP)
Transistors12 Billion
Die Size 276 mm²
technology8 nm5 nm
PCIe4.0 x164.0 x16
Displays4 Displays (max.), DisplayPort 1.4a4 Displays (max.), HDMI 2.1, DisplayPort 1.4a
Features4x DisplayPort 1.4a, PCIe 4.0 x16
Date of Announcement23.11.2021 21.03.2023
CacheL2: 32 MB
Notebook Sizelarge
Link to Manufacturer Pageimages.nvidia.com
PredecessorQuadro RTX 3000 (Laptop)

Benchmarks

Performance Rating - 3DMark 11 + Fire Strike + Time Spy - RTX A2000
5.6 pt (17%)
Restrict / Search: Model: Max. age: years
3DMark - 3DMark Time Spy Score
6282 Points (17%)
min: 8254     avg: 9034     median: 8811 (23%)     max: 10036 Points
3DMark - 3DMark Time Spy Graphics
5675 Points (12%)
min: 7959     avg: 8689     median: 8351 (17%)     max: 9757 Points
3DMark - 3DMark Ice Storm Unlimited Graphics
561627 Points (57%)
3DMark - 3DMark Ice Storm Extreme Graphics
310737 Points (36%)
3DMark - 3DMark Cloud Gate Score
56330 Points (53%)
min: 34703     avg: 40239     median: 40238.5 (38%)     max: 45774 Points
3DMark - 3DMark Cloud Gate Graphics
94407 Points (23%)
min: 58392     avg: 70502     median: 70502 (17%)     max: 82612 Points
3DMark - 3DMark Fire Strike Standard Score
14566 Points (22%)
min: 18368     avg: 19637     median: 18847 (28%)     max: 21697 Points
3DMark - 3DMark Fire Strike Standard Graphics
14934 Points (14%)
min: 20233     avg: 21691     median: 20908 (19%)     max: 23931 Points
3DMark - 3DMark Ice Storm Graphics
369883 Points (41%)
3DMark - 3DMark Night Raid
48115 Points (45%)
3DMark - 3DMark Night Raid Graphics Score
68223 Points (26%)
3DMark 11 - 3DM11 Performance Score
20964 Points (25%)
min: 25317     avg: 27267     median: 27083 (33%)     max: 29401 Points
3DMark 11 - 3DM11 Performance GPU
19978 Points (15%)
min: 28283     avg: 30499     median: 29411 (23%)     max: 33802 Points
3DMark Vantage
3DM Vant. Perf. total + Nvidia RTX A2000
3DMark Vantage - 3DM Vant. Perf. total
76281 Points (22%)
3DM Vant. Perf. GPU no PhysX + Nvidia RTX A2000
3DMark Vantage - 3DM Vant. Perf. GPU no PhysX
71338 Points (39%)
3DMark 05 - 3DMark 05 - Standard
63697 Points (70%)
3DMark 06 3DMark 06 - Standard 1280x1024 + Nvidia RTX A2000
3DMark 06
43178 Points (56%)
Unigine Valley 1.0 - Unigine Valley 1.0 DX
72.1 fps (22%)
Blender - Blender 3.3 Classroom CUDA *
70 Seconds (10%)
min: 40     avg: 44     median: 44 (7%)     max: 48 Seconds
Blender - Blender 3.3 Classroom OPTIX *
37 Seconds (14%)
min: 23     avg: 26     median: 27 (10%)     max: 28 Seconds
SPECviewperf 12
specvp12 sw-03 + Nvidia RTX A2000
SPECviewperf 12 - specvp12 sw-03
135 fps (33%)
specvp12 sw-03 + NVIDIA RTX 3000 Ada Generation Laptop GPU
min: 159.9     avg: 176.8     median: 183.9 (46%)     max: 186.49 fps
specvp12 snx-02 + Nvidia RTX A2000
SPECviewperf 12 - specvp12 snx-02
125 fps (18%)
specvp12 snx-02 + NVIDIA RTX 3000 Ada Generation Laptop GPU
min: 163.39     avg: 173.7     median: 174.9 (26%)     max: 182.76 fps
specvp12 showcase-01 + Nvidia RTX A2000
SPECviewperf 12 - specvp12 showcase-01
79 fps (14%)
specvp12 showcase-01 + NVIDIA RTX 3000 Ada Generation Laptop GPU
min: 88.34     avg: 94.2     median: 92 (16%)     max: 102.41 fps
specvp12 mediacal-01 + Nvidia RTX A2000
SPECviewperf 12 - specvp12 mediacal-01
48 fps (12%)
specvp12 mediacal-01 + NVIDIA RTX 3000 Ada Generation Laptop GPU
84.8 fps (22%)
specvp12 maya-04 + Nvidia RTX A2000
SPECviewperf 12 - specvp12 maya-04
137 fps (37%)
specvp12 maya-04 + NVIDIA RTX 3000 Ada Generation Laptop GPU
min: 133.1     avg: 143.9     median: 143 (39%)     max: 155.73 fps
specvp12 energy-01 + Nvidia RTX A2000
SPECviewperf 12 - specvp12 energy-01
10.2 fps (9%)
specvp12 energy-01 + NVIDIA RTX 3000 Ada Generation Laptop GPU
19 fps (17%)
specvp12 creo-01 + Nvidia RTX A2000
SPECviewperf 12 - specvp12 creo-01
117 fps (47%)
specvp12 creo-01 + NVIDIA RTX 3000 Ada Generation Laptop GPU
min: 123.21     avg: 144.6     median: 150.3 (60%)     max: 160.25 fps
specvp12 catia-04 + Nvidia RTX A2000
SPECviewperf 12 - specvp12 catia-04
129 fps (21%)
specvp12 catia-04 + NVIDIA RTX 3000 Ada Generation Laptop GPU
min: 174.33     avg: 197.6     median: 198.5 (33%)     max: 220.09 fps
specvp12 3dsmax-05 + Nvidia RTX A2000
SPECviewperf 12 - specvp12 3dsmax-05
162 fps (24%)
SPECviewperf 13 specvp13 sw-04 + Nvidia RTX A2000
SPECviewperf 13 - specvp13 sw-04
138 fps (37%)
specvp13 sw-04 + NVIDIA RTX 3000 Ada Generation Laptop GPU
min: 162.23     avg: 179.5     median: 179.2 (48%)     max: 197.11 fps
specvp13 snx-03 + Nvidia RTX A2000
SPECviewperf 13 - specvp13 snx-03
239 fps (27%)
specvp13 snx-03 + NVIDIA RTX 3000 Ada Generation Laptop GPU
min: 296.88     avg: 318.8     median: 312.1 (35%)     max: 347.37 fps
specvp13 showcase-02 + Nvidia RTX A2000
SPECviewperf 13 - specvp13 showcase-02
79.2 fps (13%)
specvp13 showcase-02 + NVIDIA RTX 3000 Ada Generation Laptop GPU
min: 88.94     avg: 92.9     median: 90.7 (15%)     max: 99.04 fps
specvp13 medical-02 + Nvidia RTX A2000
SPECviewperf 13 - specvp13 medical-02
119 fps (20%)
specvp13 medical-02 + NVIDIA RTX 3000 Ada Generation Laptop GPU
min: 111.4     avg: 153.3     median: 168.5 (29%)     max: 179.9 fps
specvp13 maya-05 + Nvidia RTX A2000
SPECviewperf 13 - specvp13 maya-05
221 fps (25%)
specvp13 maya-05 + NVIDIA RTX 3000 Ada Generation Laptop GPU
min: 260.1     avg: 281.8     median: 274.5 (31%)     max: 310.61 fps
specvp13 energy-02 + Nvidia RTX A2000
SPECviewperf 13 - specvp13 energy-02
32.9 fps (11%)
specvp13 energy-02 + NVIDIA RTX 3000 Ada Generation Laptop GPU
min: 56.97     avg: 60.1     median: 58.3 (19%)     max: 64.93 fps
specvp13 creo-02 + Nvidia RTX A2000
SPECviewperf 13 - specvp13 creo-02
217 fps (32%)
specvp13 creo-02 + NVIDIA RTX 3000 Ada Generation Laptop GPU
min: 245.25     avg: 267.7     median: 255.2 (37%)     max: 302.58 fps
specvp13 3dsmax-06 + Nvidia RTX A2000
SPECviewperf 13 - specvp13 3dsmax-06
162 fps (25%)
specvp13 3dsmax-06 + NVIDIA RTX 3000 Ada Generation Laptop GPU
min: 189.32     avg: 199     median: 191.7 (30%)     max: 215.94 fps
specvp13 catia-05 + NVIDIA RTX 3000 Ada Generation Laptop GPU
SPECviewperf 13 - specvp13 catia-05
min: 273.29     avg: 308.7     median: 310.7 (35%)     max: 342.09 fps
SPECviewperf 2020 specvp2020 medical-03 1080p + Nvidia RTX A2000
SPECviewperf 2020 - specvp2020 medical-03 1080p
68.8 fps (19%)
specvp2020 medical-03 1080p + NVIDIA RTX 3000 Ada Generation Laptop GPU
min: 55.19     avg: 80.8     median: 90.4 (25%)     max: 96.95 fps
specvp2020 maya-06 1080p + Nvidia RTX A2000
SPECviewperf 2020 - specvp2020 maya-06 1080p
271 fps (29%)
specvp2020 maya-06 1080p + NVIDIA RTX 3000 Ada Generation Laptop GPU
min: 310.86     avg: 312.5     median: 312.3 (33%)     max: 314.35 fps
specvp2020 energy-03 1080p + Nvidia RTX A2000
SPECviewperf 2020 - specvp2020 energy-03 1080p
33.6 fps (5%)
specvp2020 energy-03 1080p + NVIDIA RTX 3000 Ada Generation Laptop GPU
min: 49.86     avg: 55     median: 57.2 (9%)     max: 57.85 fps
specvp2020 creo-03 1080p + Nvidia RTX A2000
SPECviewperf 2020 - specvp2020 creo-03 1080p
112 fps (38%)
specvp2020 creo-03 1080p + NVIDIA RTX 3000 Ada Generation Laptop GPU
min: 113.79     avg: 129.1     median: 136.7 (47%)     max: 136.89 fps
specvp2020 catia-06 1080p + Nvidia RTX A2000
SPECviewperf 2020 - specvp2020 catia-06 1080p
64 fps (31%)
specvp2020 catia-06 1080p + NVIDIA RTX 3000 Ada Generation Laptop GPU
min: 78     avg: 80.2     median: 78.9 (39%)     max: 83.77 fps
specvp2020 3dsmax-07 1080p + Nvidia RTX A2000
SPECviewperf 2020 - specvp2020 3dsmax-07 1080p
79.1 fps (21%)
specvp2020 3dsmax-07 1080p + NVIDIA RTX 3000 Ada Generation Laptop GPU
min: 75.05     avg: 80.7     median: 80.9 (21%)     max: 86.19 fps
specvp2020 snx-04 4k + Nvidia RTX A2000
SPECviewperf 2020 - specvp2020 snx-04 4k
159 fps (16%)
specvp2020 snx-04 4k + NVIDIA RTX 3000 Ada Generation Laptop GPU
min: 183.57     avg: 188.3     median: 189.8 (19%)     max: 191.49 fps
specvp2020 medical-03 4k + Nvidia RTX A2000
SPECviewperf 2020 - specvp2020 medical-03 4k
24.2 fps (16%)
specvp2020 medical-03 4k + NVIDIA RTX 3000 Ada Generation Laptop GPU
min: 19.91     avg: 30.1     median: 33.8 (22%)     max: 36.49 fps
specvp2020 maya-06 4k + Nvidia RTX A2000
SPECviewperf 2020 - specvp2020 maya-06 4k
126 fps (18%)
specvp2020 maya-06 4k + NVIDIA RTX 3000 Ada Generation Laptop GPU
min: 131.97     avg: 137.2     median: 138.8 (20%)     max: 140.78 fps
specvp2020 energy-03 4k + Nvidia RTX A2000
SPECviewperf 2020 - specvp2020 energy-03 4k
15.8 fps (2%)
specvp2020 energy-03 4k + NVIDIA RTX 3000 Ada Generation Laptop GPU
min: 20     avg: 37.3     median: 41.2 (6%)     max: 50.62 fps
specvp2020 creo-03 4k + Nvidia RTX A2000
SPECviewperf 2020 - specvp2020 creo-03 4k
75.1 fps (34%)
specvp2020 creo-03 4k + NVIDIA RTX 3000 Ada Generation Laptop GPU
min: 51.74     avg: 60.8     median: 55.8 (25%)     max: 74.79 fps
specvp2020 catia-06 4k + Nvidia RTX A2000
SPECviewperf 2020 - specvp2020 catia-06 4k
38.8 fps (25%)
specvp2020 catia-06 4k + NVIDIA RTX 3000 Ada Generation Laptop GPU
min: 44.03     avg: 44.7     median: 44.9 (29%)     max: 45.26 fps
specvp2020 3dsmax-07 4k + Nvidia RTX A2000
SPECviewperf 2020 - specvp2020 3dsmax-07 4k
49.8 fps (17%)
specvp2020 3dsmax-07 4k + NVIDIA RTX 3000 Ada Generation Laptop GPU
min: 47.43     avg: 50.7     median: 51.6 (17%)     max: 53 fps
specvp2020 solidworks-07 4k + NVIDIA RTX 3000 Ada Generation Laptop GPU
SPECviewperf 2020 - specvp2020 solidworks-07 4k
min: 70.11     avg: 74     median: 74 (22%)     max: 77.86 fps
specvp2020 solidworks-07 1080p + NVIDIA RTX 3000 Ada Generation Laptop GPU
SPECviewperf 2020 - specvp2020 solidworks-07 1080p
min: 177.22     avg: 185.4     median: 185.4 (39%)     max: 193.56 fps
specvp2020 solidworks-05 1080p + NVIDIA RTX 3000 Ada Generation Laptop GPU
SPECviewperf 2020 - specvp2020 solidworks-05 1080p
196.5 fps (36%)
specvp2020 snx-04 1080p + NVIDIA RTX 3000 Ada Generation Laptop GPU
SPECviewperf 2020 - specvp2020 snx-04 1080p
min: 285.92     avg: 297     median: 290.6 (35%)     max: 314.39 fps
specvp2020 solidworks-05 4k + NVIDIA RTX 3000 Ada Generation Laptop GPU
SPECviewperf 2020 - specvp2020 solidworks-05 4k
77.2 fps (19%)
Cinebench R10 Cinebench R10 Shading (32bit) + Nvidia RTX A2000
Cinebench R10 - Cinebench R10 Shading (32bit)
6827 Points (5%)
Cinebench R11.5 Cinebench R11.5 OpenGL 64 Bit + Nvidia RTX A2000
Cinebench R11.5 - Cinebench R11.5 OpenGL 64 Bit
303.9 fps (100%)
Cinebench R15
Cinebench R15 OpenGL 64 Bit + Nvidia RTX A2000
Cinebench R15 - Cinebench R15 OpenGL 64 Bit
371.8 fps (22%)
Cinebench R15 OpenGL 64 Bit + NVIDIA RTX 3000 Ada Generation Laptop GPU
min: 235     avg: 260     median: 257 (15%)     max: 288 fps
Cinebench R15 OpenGL Ref. Match 64 Bit + Nvidia RTX A2000
Cinebench R15 - Cinebench R15 OpenGL Ref. Match 64 Bit
99.6 % (100%)
Cinebench R15 OpenGL Ref. Match 64 Bit + NVIDIA RTX 3000 Ada Generation Laptop GPU
99.6 % (100%)
Basemark GPU 1.2 - Basemark GPU 1.2 Vulkan Official Medium Offscreen 1080
667 fps (16%)
min: 104.6     avg: 637     median: 900 (22%)     max: 905 fps
Basemark GPU 1.2 - Basemark GPU 1.2 Vulkan Official High Offscreen 2160
61.5 fps (11%)
3.6 fps (1%)
Geekbench 6.5 - Geekbench 6.5 GPU OpenCL
72935 Points (19%)
min: 91678     avg: 93566     median: 92413 (24%)     max: 96607 Points
Geekbench 6.5 - Geekbench 6.5 GPU Vulkan
72741 Points (18%)
min: 85312     avg: 88785     median: 88420 (22%)     max: 92623 Points
LuxMark v2.0 64Bit - LuxMark v2.0 Room GPU
3120 Samples/s (11%)
LuxMark v2.0 64Bit - LuxMark v2.0 Sala GPU
6758 Samples/s (12%)
ComputeMark v2.1 - ComputeMark v2.1 Result
15520 Points (13%)
Power Consumption - Furmark Stress Test Power Consumption - external Monitor *
119.2 Watt (16%)
min: 79.8     avg: 97.2     median: 97.2 (13%)     max: 114.6 Watt
Power Consumption - The Witcher 3 Power Consumption - external Monitor *
86.5 Watt (12%)
Power Consumption - Witcher 3 Power Consumption *
min: 90.4     avg: 91.8     median: 91.8 (20%)     max: 93.1 Watt
Power Consumption - Power Efficiency - Witcher 3 ultra
min: 0.854     avg: 0.9     median: 0.9 (78%)     max: 0.871 fps per Watt
Power Consumption - Power Efficiency - Witcher 3 ultra external Monitor
0.9 fps per Watt (75%)
Power Consumption - Cyberpunk 2077 Power Consumption 150cd *
125.4 Watt (35%)
Power Consumption - Cyberpunk 2077 Power Consumption - external Monitor *
244 Watt (31%)
120.3 Watt (15%)
Power Consumption - Power Efficiency - Cyberpunk 2077 ultra
0.2 fps per Watt (1%)
0.5 fps per Watt (2%)
Emissions Witcher 3 Fan Noise + NVIDIA RTX 3000 Ada Generation Laptop GPU
Emissions - Witcher 3 Fan Noise
min: 49.9     avg: 50     median: 50 (71%)     max: 50.1 dB(A)

Average Benchmarks Nvidia RTX A2000 → 100% n=45

Average Benchmarks NVIDIA RTX 3000 Ada Generation Laptop GPU → 127% n=45

- Range of benchmark values for this graphics card
red legend - Average benchmark values for this graphics card
* Smaller numbers mean a higher performance
1 This benchmark is not used for the average calculation

Game Benchmarks

The following benchmarks stem from our benchmarks of review laptops. The performance depends on the used graphics memory, clock rate, processor, system settings, drivers, and operating systems. So the results don't have to be representative for all laptops with this GPU. For detailed information on the benchmark results, click on the fps number.

low 1920x1080
100%
RTX A2000:
45  fps
med. 1920x1080
100%
RTX A2000:
34  fps
high 1920x1080
100%
RTX A2000:
26  fps
ultra 1920x1080
100%
RTX A2000:
13  fps
QHD 2560x1440
100%
RTX A2000:
10  fps
low 1920x1080
100%
RTX A2000:
117.7  fps
med. 1920x1080
100%
RTX A2000:
78.2  fps
high 1920x1080
100%
RTX A2000:
64  fps
ultra 1920x1080
100%
RTX A2000:
57.6  fps
QHD 2560x1440
100%
RTX A2000:
36.6  fps
4K 3840x2160
100%
RTX A2000:
18.3  fps
low 1920x1080
100%
RTX A2000:
102.6  fps
med. 1920x1080
100%
RTX A2000:
64.6  fps
high 1920x1080
100%
RTX A2000:
49.6  fps
ultra 1920x1080
100%
RTX A2000:
41.1  fps
QHD 2560x1440
100%
RTX A2000:
25.6  fps
4K 3840x2160
100%
RTX A2000:
13.3  fps
F1 24

F1 24

2024
low 1920x1080
100%
RTX A2000:
173.3  fps
med. 1920x1080
100%
RTX A2000:
144.7  fps
high 1920x1080
100%
RTX A2000:
104.6  fps
ultra 1920x1080
100%
RTX A2000:
32.5  fps
QHD 2560x1440
100%
RTX A2000:
20.2  fps
4K 3840x2160
100%
RTX A2000:
9.7  fps
4K DLSS 3840x2160
100%
RTX A2000:
17.9  fps
QHD DLSS 2560x1440
100%
RTX A2000:
34.2  fps
low 1920x1080
100%
RTX A2000:
90  fps
med. 1920x1080
100%
RTX A2000:
84  fps
high 1920x1080
100%
RTX A2000:
58  fps
ultra 1920x1080
100%
RTX A2000:
39  fps
QHD 2560x1440
100%
RTX A2000:
32  fps
4K 3840x2160
100%
RTX A2000:
22  fps
4K DLSS 3840x2160
100%
RTX A2000:
24  fps
low 1920x1080
100%
RTX A2000:
44  fps
med. 1920x1080
100%
RTX A2000:
39  fps
high 1920x1080
100%
RTX A2000:
34  fps
ultra 1920x1080
100%
RTX A2000:
25  fps
QHD 2560x1440
100%
RTX A2000:
16  fps
4K 3840x2160
100%
RTX A2000:
7  fps
4K DLSS 3840x2160
100%
RTX A2000:
14  fps
low 1920x1080
100%
RTX A2000:
85.4  fps
med. 1920x1080
100%
RTX A2000:
60.2  fps
high 1920x1080
100%
RTX A2000:
54.2  fps
ultra 1920x1080
100%
RTX A2000:
49.7  fps
QHD 2560x1440
100%
RTX A2000:
34.4  fps
4K 3840x2160
100%
RTX A2000:
18.6  fps
4K DLSS 3840x2160
100%
RTX A2000:
28.3  fps
low 1920x1080
100%
RTX A2000:
244.4  fps
med. 1920x1080
100%
RTX A2000:
155.3  fps
high 1920x1080
100%
RTX A2000:
87.3  fps
ultra 1920x1080
100%
RTX A2000:
69  fps
QHD 2560x1440
100%
RTX A2000:
46.2  fps
4K 3840x2160
100%
RTX A2000:
23.3  fps
low 1920x1080
100%
RTX A2000:
83.9  fps
114%
NVIDIA RTX 3000 Ada Generation Laptop GPU:
87.2 104.6 ~ 96 fps
med. 1920x1080
100%
RTX A2000:
61.9  fps
129%
NVIDIA RTX 3000 Ada Generation Laptop GPU:
72.7 87.9 ~ 80 fps
high 1920x1080
100%
RTX A2000:
51.8  fps
129%
NVIDIA RTX 3000 Ada Generation Laptop GPU:
60.7 74.2 ~ 67 fps
ultra 1920x1080
100%
RTX A2000:
44.7  fps
130%
NVIDIA RTX 3000 Ada Generation Laptop GPU:
52.1 64.3 ~ 58 fps
QHD 2560x1440
100%
RTX A2000:
25.5  fps
155%
NVIDIA RTX 3000 Ada Generation Laptop GPU:
39.6  fps
4K 3840x2160
100%
RTX A2000:
11  fps
low 1920x1080
100%
RTX A2000:
74.9  fps
148%
NVIDIA RTX 3000 Ada Generation Laptop GPU:
92 130.6 ~ 111 fps
med. 1920x1080
100%
RTX A2000:
58.8  fps
162%
NVIDIA RTX 3000 Ada Generation Laptop GPU:
78.8 111.8 ~ 95 fps
high 1920x1080
100%
RTX A2000:
50.8  fps
165%
NVIDIA RTX 3000 Ada Generation Laptop GPU:
70.1 98.4 ~ 84 fps
ultra 1920x1080
100%
RTX A2000:
49.9  fps
166%
NVIDIA RTX 3000 Ada Generation Laptop GPU:
68.8 96.7 ~ 83 fps
QHD 2560x1440
100%
RTX A2000:
34.4  fps
200%
NVIDIA RTX 3000 Ada Generation Laptop GPU:
68.7  fps
4K 3840x2160
100%
RTX A2000:
18.2  fps
4K DLSS 3840x2160
100%
RTX A2000:
30.2  fps
Starfield

Starfield

2023
low 1920x1080
100%
RTX A2000:
77.3  fps
med. 1920x1080
100%
RTX A2000:
61.1  fps
high 1920x1080
100%
RTX A2000:
40.5  fps
ultra 1920x1080
100%
RTX A2000:
33  fps
QHD 2560x1440
100%
RTX A2000:
26.6  fps
4K 3840x2160
100%
RTX A2000:
17.1  fps
F1 23

F1 23

2023
low 1920x1080
100%
RTX A2000:
185.1  fps
med. 1920x1080
100%
RTX A2000:
165.1  fps
high 1920x1080
100%
RTX A2000:
111.2  fps
ultra 1920x1080
100%
RTX A2000:
32.2  fps
QHD 2560x1440
100%
RTX A2000:
20  fps
4K 3840x2160
100%
RTX A2000:
9.4  fps
4K DLSS 3840x2160
100%
RTX A2000:
17.4  fps
low 1920x1080
100%
RTX A2000:
110  fps
med. 1920x1080
100%
RTX A2000:
92  fps
high 1920x1080
100%
RTX A2000:
69  fps
ultra 1920x1080
100%
RTX A2000:
68  fps
QHD 2560x1440
100%
RTX A2000:
50  fps
4K 3840x2160
100%
RTX A2000:
28  fps
Returnal

Returnal

2023
low 1920x1080
100%
RTX A2000:
65  fps
med. 1920x1080
100%
RTX A2000:
60  fps
high 1920x1080
100%
RTX A2000:
53  fps
ultra 1920x1080
100%
RTX A2000:
45  fps
QHD 2560x1440
100%
RTX A2000:
32  fps
4K 3840x2160
100%
RTX A2000:
18  fps
F1 22

F1 22

2022
low 1920x1080
100%
RTX A2000:
197.4  fps
97%
NVIDIA RTX 3000 Ada Generation Laptop GPU:
162.7 183.6 226 ~ 191 fps
med. 1920x1080
100%
RTX A2000:
181.5  fps
99%
NVIDIA RTX 3000 Ada Generation Laptop GPU:
159.6 168 212 ~ 180 fps
high 1920x1080
100%
RTX A2000:
125.3  fps
113%
NVIDIA RTX 3000 Ada Generation Laptop GPU:
127.5 133.4 161.1 ~ 141 fps
ultra 1920x1080
100%
RTX A2000:
37.5  fps
147%
NVIDIA RTX 3000 Ada Generation Laptop GPU:
50.4 51.1 62.8 ~ 55 fps
QHD 2560x1440
100%
RTX A2000:
23  fps
177%
NVIDIA RTX 3000 Ada Generation Laptop GPU:
40.7  fps
4K 3840x2160
100%
RTX A2000:
10.9  fps
low 1920x1080
100%
RTX A2000:
124  fps
135%
NVIDIA RTX 3000 Ada Generation Laptop GPU:
153.9 156 194 ~ 168 fps
med. 1920x1080
100%
RTX A2000:
99.4  fps
139%
NVIDIA RTX 3000 Ada Generation Laptop GPU:
125.4 131.4 157.7 ~ 138 fps
high 1920x1080
100%
RTX A2000:
66  fps
145%
NVIDIA RTX 3000 Ada Generation Laptop GPU:
88 88.5 110 ~ 96 fps
ultra 1920x1080
100%
RTX A2000:
51.2  fps
148%
NVIDIA RTX 3000 Ada Generation Laptop GPU:
69 70.2 87.9 ~ 76 fps
QHD 2560x1440
100%
RTX A2000:
34.3  fps
176%
NVIDIA RTX 3000 Ada Generation Laptop GPU:
60.5  fps
4K 3840x2160
100%
RTX A2000:
17.7  fps
low 1920x1080
NVIDIA RTX 3000 Ada Generation Laptop GPU:
92.3  fps
med. 1920x1080
NVIDIA RTX 3000 Ada Generation Laptop GPU:
72.4  fps
high 1920x1080
NVIDIA RTX 3000 Ada Generation Laptop GPU:
61.2  fps
ultra 1920x1080
NVIDIA RTX 3000 Ada Generation Laptop GPU:
56.2  fps
low 1920x1080
100%
RTX A2000:
198  fps
med. 1920x1080
100%
RTX A2000:
142.1  fps
high 1920x1080
100%
RTX A2000:
115.4  fps
ultra 1920x1080
100%
RTX A2000:
81.7  fps
QHD 2560x1440
100%
RTX A2000:
62  fps
4K 3840x2160
100%
RTX A2000:
36.6  fps
low 1920x1080
100%
RTX A2000:
86.1  fps
med. 1920x1080
100%
RTX A2000:
72.9  fps
high 1920x1080
100%
RTX A2000:
57.4  fps
ultra 1920x1080
100%
RTX A2000:
38.9  fps
QHD 2560x1440
100%
RTX A2000:
30.9  fps
4K 3840x2160
100%
RTX A2000:
19.9  fps
low 1280x720
100%
RTX A2000:
351  fps
med. 1920x1080
100%
RTX A2000:
181.9  fps
high 1920x1080
100%
RTX A2000:
131.5  fps
ultra 1920x1080
100%
RTX A2000:
108.5  fps
QHD 2560x1440
100%
RTX A2000:
78.7  fps
4K 3840x2160
100%
RTX A2000:
45.2  fps
low 1280x720
100%
RTX A2000:
231  fps
med. 1920x1080
100%
RTX A2000:
121  fps
high 1920x1080
100%
RTX A2000:
106  fps
ultra 1920x1080
100%
RTX A2000:
59  fps
QHD 2560x1440
100%
RTX A2000:
43  fps
4K 3840x2160
100%
RTX A2000:
29  fps
low 1280x720
100%
RTX A2000:
199  fps
med. 1920x1080
100%
RTX A2000:
142  fps
high 1920x1080
100%
RTX A2000:
143  fps
ultra 1920x1080
100%
RTX A2000:
131  fps
QHD 2560x1440
100%
RTX A2000:
98  fps
4K 3840x2160
100%
RTX A2000:
55  fps
Far Cry 6

Far Cry 6

2021
low 1280x720
100%
RTX A2000:
180.4  fps
med. 1920x1080
100%
RTX A2000:
97.6  fps
high 1920x1080
100%
RTX A2000:
83.2  fps
ultra 1920x1080
100%
RTX A2000:
68.3  fps
QHD 2560x1440
100%
RTX A2000:
48.8  fps
4K 3840x2160
100%
RTX A2000:
25.7  fps
F1 2021

F1 2021

2021
low 1280x720
100%
RTX A2000:
448  fps
med. 1920x1080
100%
RTX A2000:
204  fps
high 1920x1080
100%
RTX A2000:
157.3  fps
ultra 1920x1080
100%
RTX A2000:
75.1  fps
QHD 2560x1440
100%
RTX A2000:
53.4  fps
4K 3840x2160
100%
RTX A2000:
28.4  fps
low 1280x720
100%
RTX A2000:
184  fps
med. 1920x1080
100%
RTX A2000:
104  fps
high 1920x1080
100%
RTX A2000:
83  fps
ultra 1920x1080
100%
RTX A2000:
68  fps
QHD 2560x1440
100%
RTX A2000:
52  fps
4K 3840x2160
100%
RTX A2000:
26  fps
4K DLSS 3840x2160
100%
RTX A2000:
39  fps
F1 2020

F1 2020

2020
low 1280x720
100%
RTX A2000:
405  fps
med. 1920x1080
100%
RTX A2000:
197.2  fps
high 1920x1080
100%
RTX A2000:
149.4  fps
ultra 1920x1080
100%
RTX A2000:
101.2  fps
QHD 2560x1440
100%
RTX A2000:
72  fps
4K 3840x2160
100%
RTX A2000:
38.8  fps
low 1280x720
100%
RTX A2000:
224  fps
med. 1920x1080
100%
RTX A2000:
108.1  fps
high 1920x1080
100%
RTX A2000:
68.6  fps
ultra 1920x1080
100%
RTX A2000:
52  fps
QHD 2560x1440
100%
RTX A2000:
35.2  fps
4K 3840x2160
100%
RTX A2000:
18.7  fps
low 1280x720
100%
RTX A2000:
370.4  fps
med. 1920x1080
100%
RTX A2000:
116.2  fps
high 1920x1080
100%
RTX A2000:
70.5  fps
ultra 1920x1080
100%
RTX A2000:
48.4  fps
QHD 2560x1440
100%
RTX A2000:
28.9  fps
4K 3840x2160
100%
RTX A2000:
13.8  fps
low 1280x720
100%
RTX A2000:
181  fps
med. 1920x1080
100%
RTX A2000:
106  fps
high 1920x1080
100%
RTX A2000:
97  fps
ultra 1920x1080
100%
RTX A2000:
87  fps
QHD 2560x1440
100%
RTX A2000:
62  fps
4K 3840x2160
100%
RTX A2000:
33  fps
low 1280x720
100%
RTX A2000:
169.6  fps
med. 1920x1080
100%
RTX A2000:
79  fps
high 1920x1080
100%
RTX A2000:
56.9  fps
ultra 1920x1080
100%
RTX A2000:
44.8  fps
QHD 2560x1440
100%
RTX A2000:
34  fps
4K 3840x2160
100%
RTX A2000:
20.2  fps
low 1280x720
100%
RTX A2000:
229  fps
med. 1920x1080
100%
RTX A2000:
96.8  fps
high 1920x1080
100%
RTX A2000:
86.5  fps
ultra 1920x1080
100%
RTX A2000:
77.4  fps
QHD 2560x1440
100%
RTX A2000:
51.5  fps
4K 3840x2160
100%
RTX A2000:
26.7  fps
Strange Brigade

Strange Brigade

2018
low 1280x720
100%
RTX A2000:
407  fps
90%
NVIDIA RTX 3000 Ada Generation Laptop GPU:
282 400 415 ~ 366 fps
med. 1920x1080
100%
RTX A2000:
166.4  fps
124%
NVIDIA RTX 3000 Ada Generation Laptop GPU:
182.4 191.3 246 ~ 207 fps
high 1920x1080
100%
RTX A2000:
130.1  fps
129%
NVIDIA RTX 3000 Ada Generation Laptop GPU:
151.4 160.1 192.8 ~ 168 fps
ultra 1920x1080
100%
RTX A2000:
109.3  fps
136%
NVIDIA RTX 3000 Ada Generation Laptop GPU:
132.5 140.7 172.6 ~ 149 fps
QHD 2560x1440
100%
RTX A2000:
79  fps
150%
NVIDIA RTX 3000 Ada Generation Laptop GPU:
118.6  fps
4K 3840x2160
100%
RTX A2000:
45.2  fps
Far Cry 5

Far Cry 5

2018
low 1280x720
100%
RTX A2000:
203  fps
69%
NVIDIA RTX 3000 Ada Generation Laptop GPU:
115 154 155 ~ 141 fps
med. 1920x1080
100%
RTX A2000:
108  fps
109%
NVIDIA RTX 3000 Ada Generation Laptop GPU:
105 116 133 ~ 118 fps
high 1920x1080
100%
RTX A2000:
98  fps
115%
NVIDIA RTX 3000 Ada Generation Laptop GPU:
104 106 130 ~ 113 fps
ultra 1920x1080
100%
RTX A2000:
91  fps
115%
NVIDIA RTX 3000 Ada Generation Laptop GPU:
96 101 118 ~ 105 fps
QHD 2560x1440
100%
RTX A2000:
61  fps
152%
NVIDIA RTX 3000 Ada Generation Laptop GPU:
93  fps
4K 3840x2160
100%
RTX A2000:
30  fps
low 1280x720
100%
RTX A2000:
203  fps
65%
NVIDIA RTX 3000 Ada Generation Laptop GPU:
109.9 131.3 152 ~ 131 fps
med. 1920x1080
100%
RTX A2000:
176.4  fps
64%
NVIDIA RTX 3000 Ada Generation Laptop GPU:
102.1 109.7 126.8 ~ 113 fps
high 1920x1080
100%
RTX A2000:
136.4  fps
65%
NVIDIA RTX 3000 Ada Generation Laptop GPU:
76.7 87.1 102 ~ 89 fps
4K 3840x2160
100%
RTX A2000:
99.8  fps
low 1280x720
100%
RTX A2000:
163.1  fps
97%
NVIDIA RTX 3000 Ada Generation Laptop GPU:
128.8 155.1 189.4 ~ 158 fps
med. 1920x1080
100%
RTX A2000:
82.3  fps
134%
NVIDIA RTX 3000 Ada Generation Laptop GPU:
91.9 108 128.7 ~ 110 fps
high 1920x1080
100%
RTX A2000:
61.3  fps
135%
NVIDIA RTX 3000 Ada Generation Laptop GPU:
72.9 78.9 97 ~ 83 fps
QHD 2560x1440
100%
RTX A2000:
43.9  fps
162%
NVIDIA RTX 3000 Ada Generation Laptop GPU:
71.3  fps
4K 3840x2160
100%
RTX A2000:
24.7  fps
low 1280x720
100%
RTX A2000:
265.4  fps
65%
NVIDIA RTX 3000 Ada Generation Laptop GPU:
168 175.7 176.2 ~ 173 fps
med. 1366x768
100%
RTX A2000:
234.2  fps
67%
NVIDIA RTX 3000 Ada Generation Laptop GPU:
151.3 159.9 160.8 ~ 157 fps
high 1920x1080
100%
RTX A2000:
212  fps
68%
NVIDIA RTX 3000 Ada Generation Laptop GPU:
136 148.2 151.5 ~ 145 fps
ultra 1920x1080
100%
RTX A2000:
190.2  fps
72%
NVIDIA RTX 3000 Ada Generation Laptop GPU:
123.3 142.9 143.3 ~ 137 fps
4K 3840x2160
100%
RTX A2000:
86.6  fps
low 1024x768
100%
RTX A2000:
345  fps
103%
NVIDIA RTX 3000 Ada Generation Laptop GPU:
344 364.1 ~ 354 fps
med. 1366x768
100%
RTX A2000:
217  fps
113%
NVIDIA RTX 3000 Ada Generation Laptop GPU:
242.5 249.5 ~ 246 fps
high 1920x1080
100%
RTX A2000:
117  fps
126%
NVIDIA RTX 3000 Ada Generation Laptop GPU:
145.8 150.1 ~ 148 fps
ultra 1920x1080
100%
RTX A2000:
63.9  fps
124%
NVIDIA RTX 3000 Ada Generation Laptop GPU:
78.7 79.5 ~ 79 fps
QHD 2560x1440
100%
RTX A2000:
47.2  fps
4K 3840x2160
100%
RTX A2000:
40.1  fps
GTA V

GTA V

2015
low 1024x768
100%
RTX A2000:
187.7  fps
97%
NVIDIA RTX 3000 Ada Generation Laptop GPU:
182.2 183.2 ~ 183 fps
med. 1366x768
100%
RTX A2000:
187.5  fps
94%
NVIDIA RTX 3000 Ada Generation Laptop GPU:
176 177 ~ 177 fps
high 1920x1080
100%
RTX A2000:
174.1  fps
94%
NVIDIA RTX 3000 Ada Generation Laptop GPU:
163.2 164.1 ~ 164 fps
ultra 1920x1080
100%
RTX A2000:
82.9  fps
111%
NVIDIA RTX 3000 Ada Generation Laptop GPU:
88.2 96.6 ~ 92 fps
QHD 2560x1440
100%
RTX A2000:
57.8  fps
132%
NVIDIA RTX 3000 Ada Generation Laptop GPU:
76.1  fps
4K 3840x2160
100%
RTX A2000:
55.6  fps

Average Gaming Nvidia RTX A2000 → 100%

Average Gaming 30-70 fps → 100%

Average Gaming NVIDIA RTX 3000 Ada Generation Laptop GPU → 121%

Average Gaming 30-70 fps → 159%

Nvidia RTX A2000NVIDIA RTX 3000 Ada Generation Laptop GPU
lowmed.highultraQHD4Klowmed.highultraQHD4K
Black Myth: Wukong4534261310
Once Human117.778.26457.636.618.3
The First Descendant102.664.649.641.125.613.3
F1 24173.3144.7104.632.520.29.7
Skull & Bones908458393222
Avatar Frontiers of Pandora44393425167
EA Sports WRC85.460.254.249.734.418.6
Total War Pharaoh244.4155.387.36946.223.3
Cyberpunk 2077 2.2 Phantom Liberty83.961.951.844.725.5119680675839.6
Baldur's Gate 374.958.850.849.934.418.211195848368.7
Starfield77.361.140.53326.617.1
F1 23185.1165.1111.232.2209.4
Company of Heroes 31109269685028
Returnal656053453218
F1 22197.4181.5125.337.52310.91911801415540.7
Tiny Tina's Wonderlands12499.46651.234.317.7168138967660.5
GRID Legends198142.1115.481.76236.6
God of War86.172.957.438.930.919.9
Farming Simulator 22351181.9131.5108.578.745.2
Forza Horizon 5231121106594329
Guardians of the Galaxy1991421431319855
Far Cry 6180.497.683.268.348.825.7
F1 2021448204157.375.153.428.4
Horizon Zero Dawn18410483685226
F1 2020405197.2149.4101.27238.8
Borderlands 3224108.168.65235.218.7
Total War: Three Kingdoms370.4116.270.548.428.913.8
Far Cry New Dawn18110697876233
Metro Exodus169.67956.944.83420.2
Shadow of the Tomb Raider22996.886.577.451.526.7
Strange Brigade407166.4130.1109.37945.2366207168149118.6
Far Cry 52031089891613014111811310593
X-Plane 11.11203176.4136.499.813111389
Final Fantasy XV Benchmark163.182.361.343.924.71581108371.3
Dota 2 Reborn265.4234.2212190.286.6173157145137
The Witcher 334521711763.947.240.135424614879
GTA V187.7187.5174.182.957.855.61831771649276.1
Nvidia RTX A2000NVIDIA RTX 3000 Ada Generation Laptop GPU
lowmed.highultraQHD4Klowmed.highultraQHD4K
< 30 fps
< 60 fps
< 120 fps
≥ 120 fps

2
10
25

3
19
15
1
10
17
9
2
17
14
2
9
19
7
25
9
2
< 30 fps
< 60 fps
< 120 fps
≥ 120 fps


2
9


5
6


6
5

2
5
2

2
6


For more games that might be playable and a list of all games and graphics cards visit our Gaming List

Add one or more devices and compare

In the following list you can select (and also search for) devices that should be added to the comparison. You can select more than one device.

restrict list:
v1.33
log 26. 19:05:19

#0 ran 0s before starting gpusingle class +0s ... 0s

#1 checking url part for id 12778 +0s ... 0s

#2 checking url part for id 11603 +0s ... 0s

#3 redirected to Ajax server, took 1758906319s time from redirect:0 +0s ... 0s

#4 did not recreate cache, as it is less than 5 days old! Created at Thu, 25 Sep 2025 05:18:04 +0200 +0s ... 0s

#5 composed specs +0.006s ... 0.006s

#6 did output specs +0s ... 0.006s

#7 start showIntegratedCPUs +0s ... 0.006s

#8 getting avg benchmarks for device 12778 +0.01s ... 0.017s

#9 got single benchmarks 12778 +0.001s ... 0.017s

#10 getting avg benchmarks for device 11603 +0s ... 0.018s

#11 got single benchmarks 11603 +0.008s ... 0.026s

#12 got avg benchmarks for devices +0s ... 0.026s

#13 min, max, avg, median took s +0.043s ... 0.069s

#14 before gaming benchmark output +0s ... 0.069s

#15 Got 347 rows for game benchmarks. +0.018s ... 0.087s

#16 composed SQL query for gamebenchmarks +0s ... 0.087s

#17 got data and put it in $dataArray +0.007s ... 0.095s

#18 benchmarks composed for output. +0.016s ... 0.111s

#19 calculated avg scores. +0s ... 0.111s

#20 return log +0.002s ... 0.114s

Please share our article, every link counts!
Mail Logo
> Expert Reviews and News on Laptops, Smartphones and Tech Innovations > Benchmarks / Tech > Graphics Card Comparison - Head 2 Head
Redaktion, 2017-09- 8 (Update: 2023-07- 1)