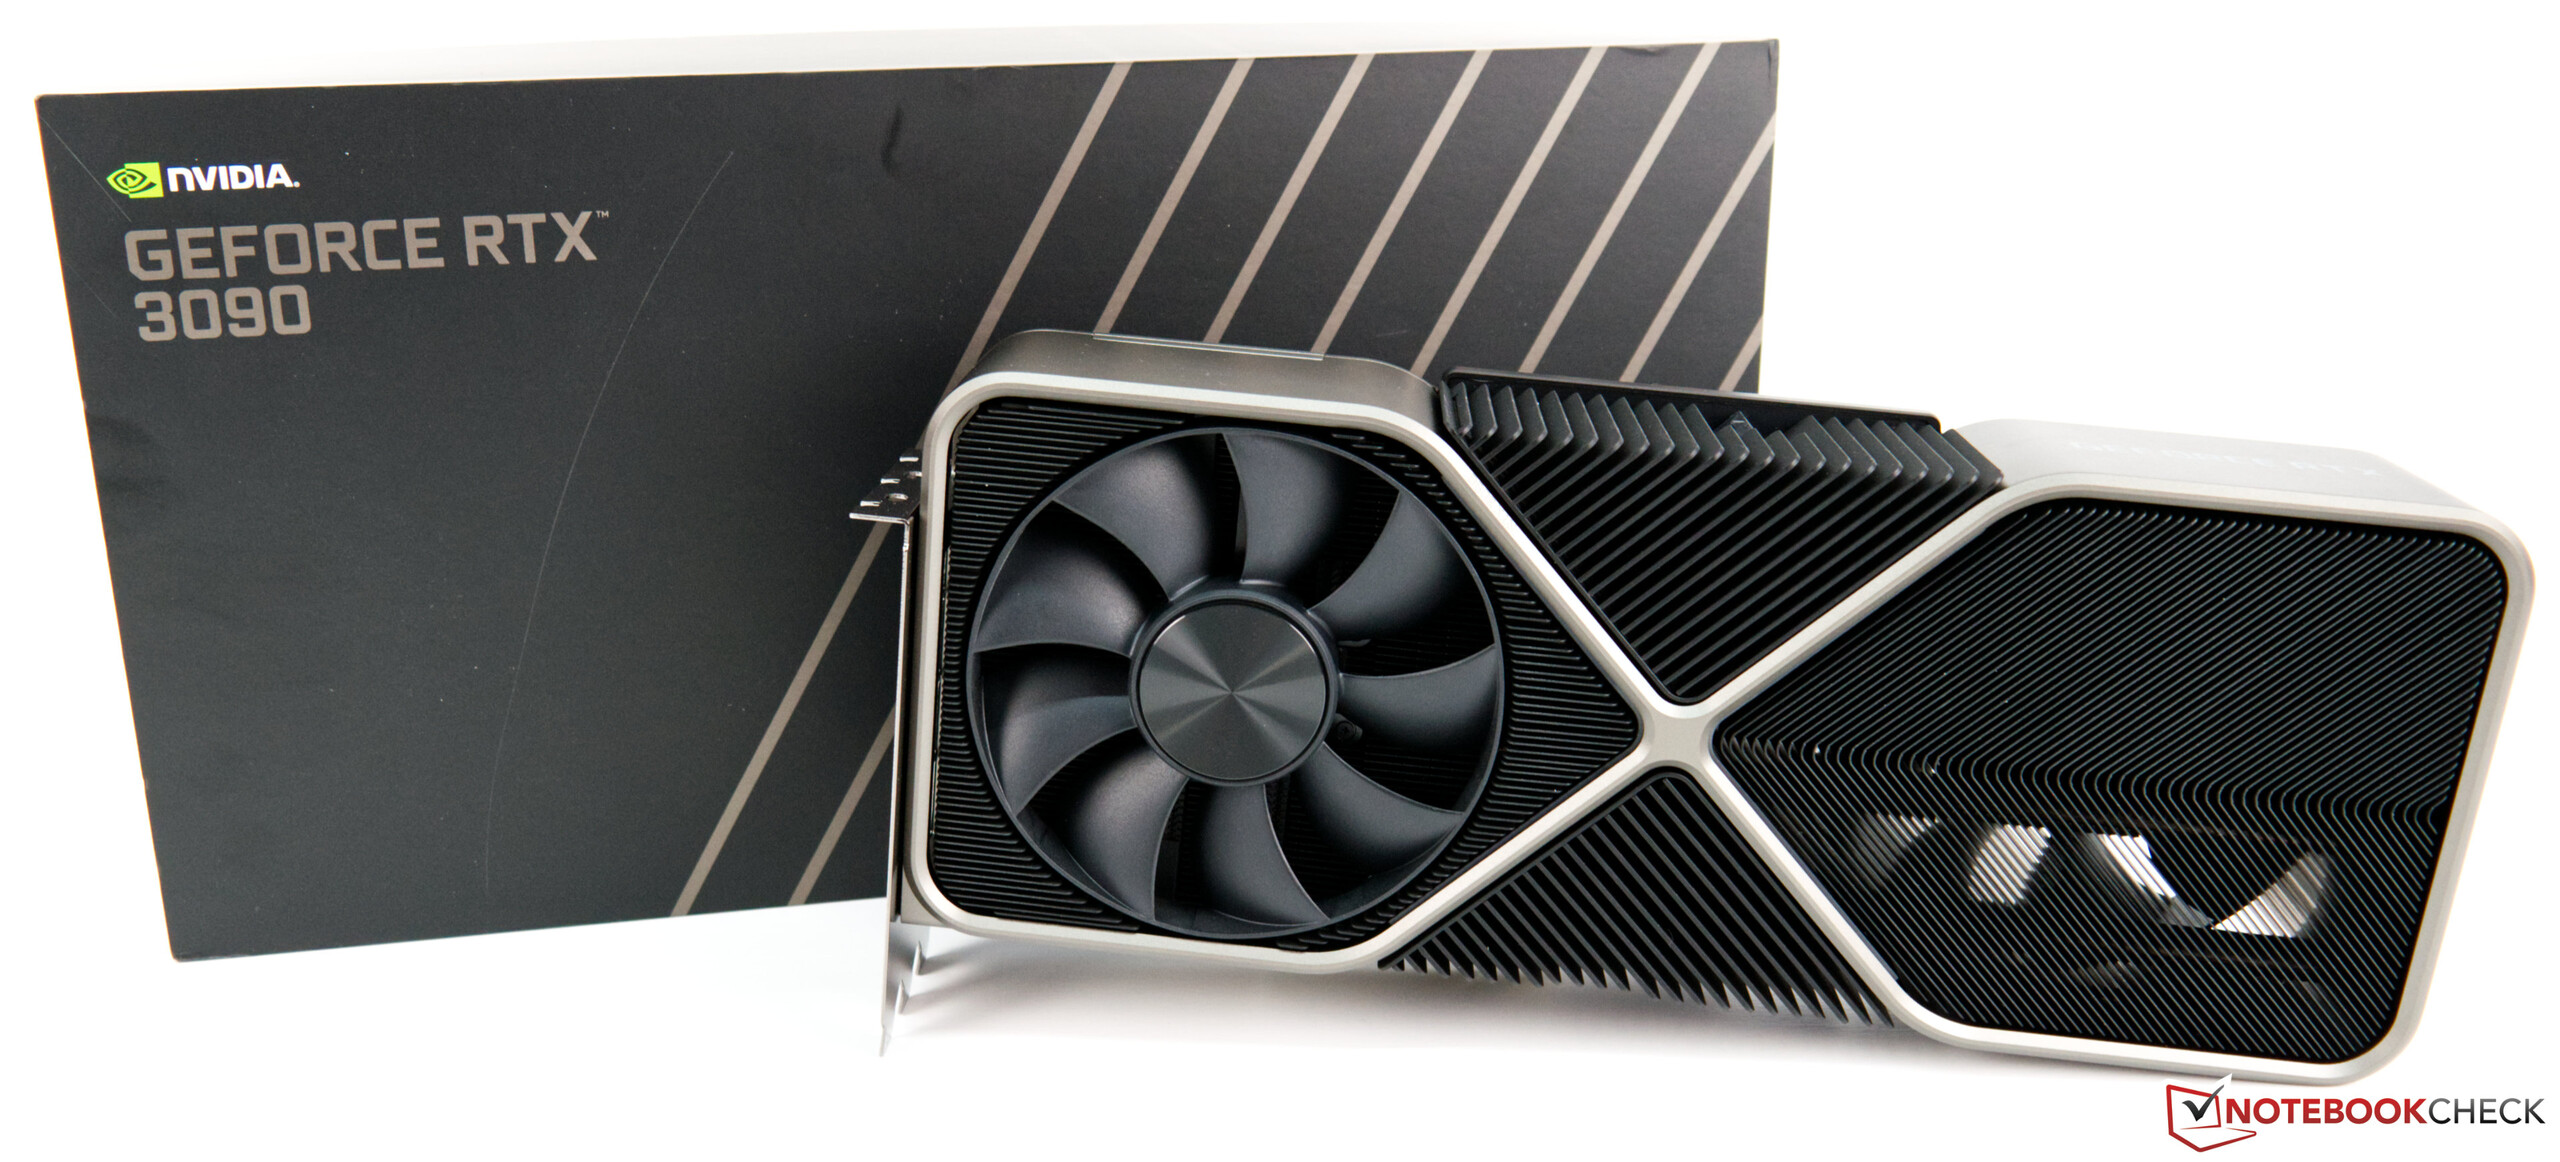
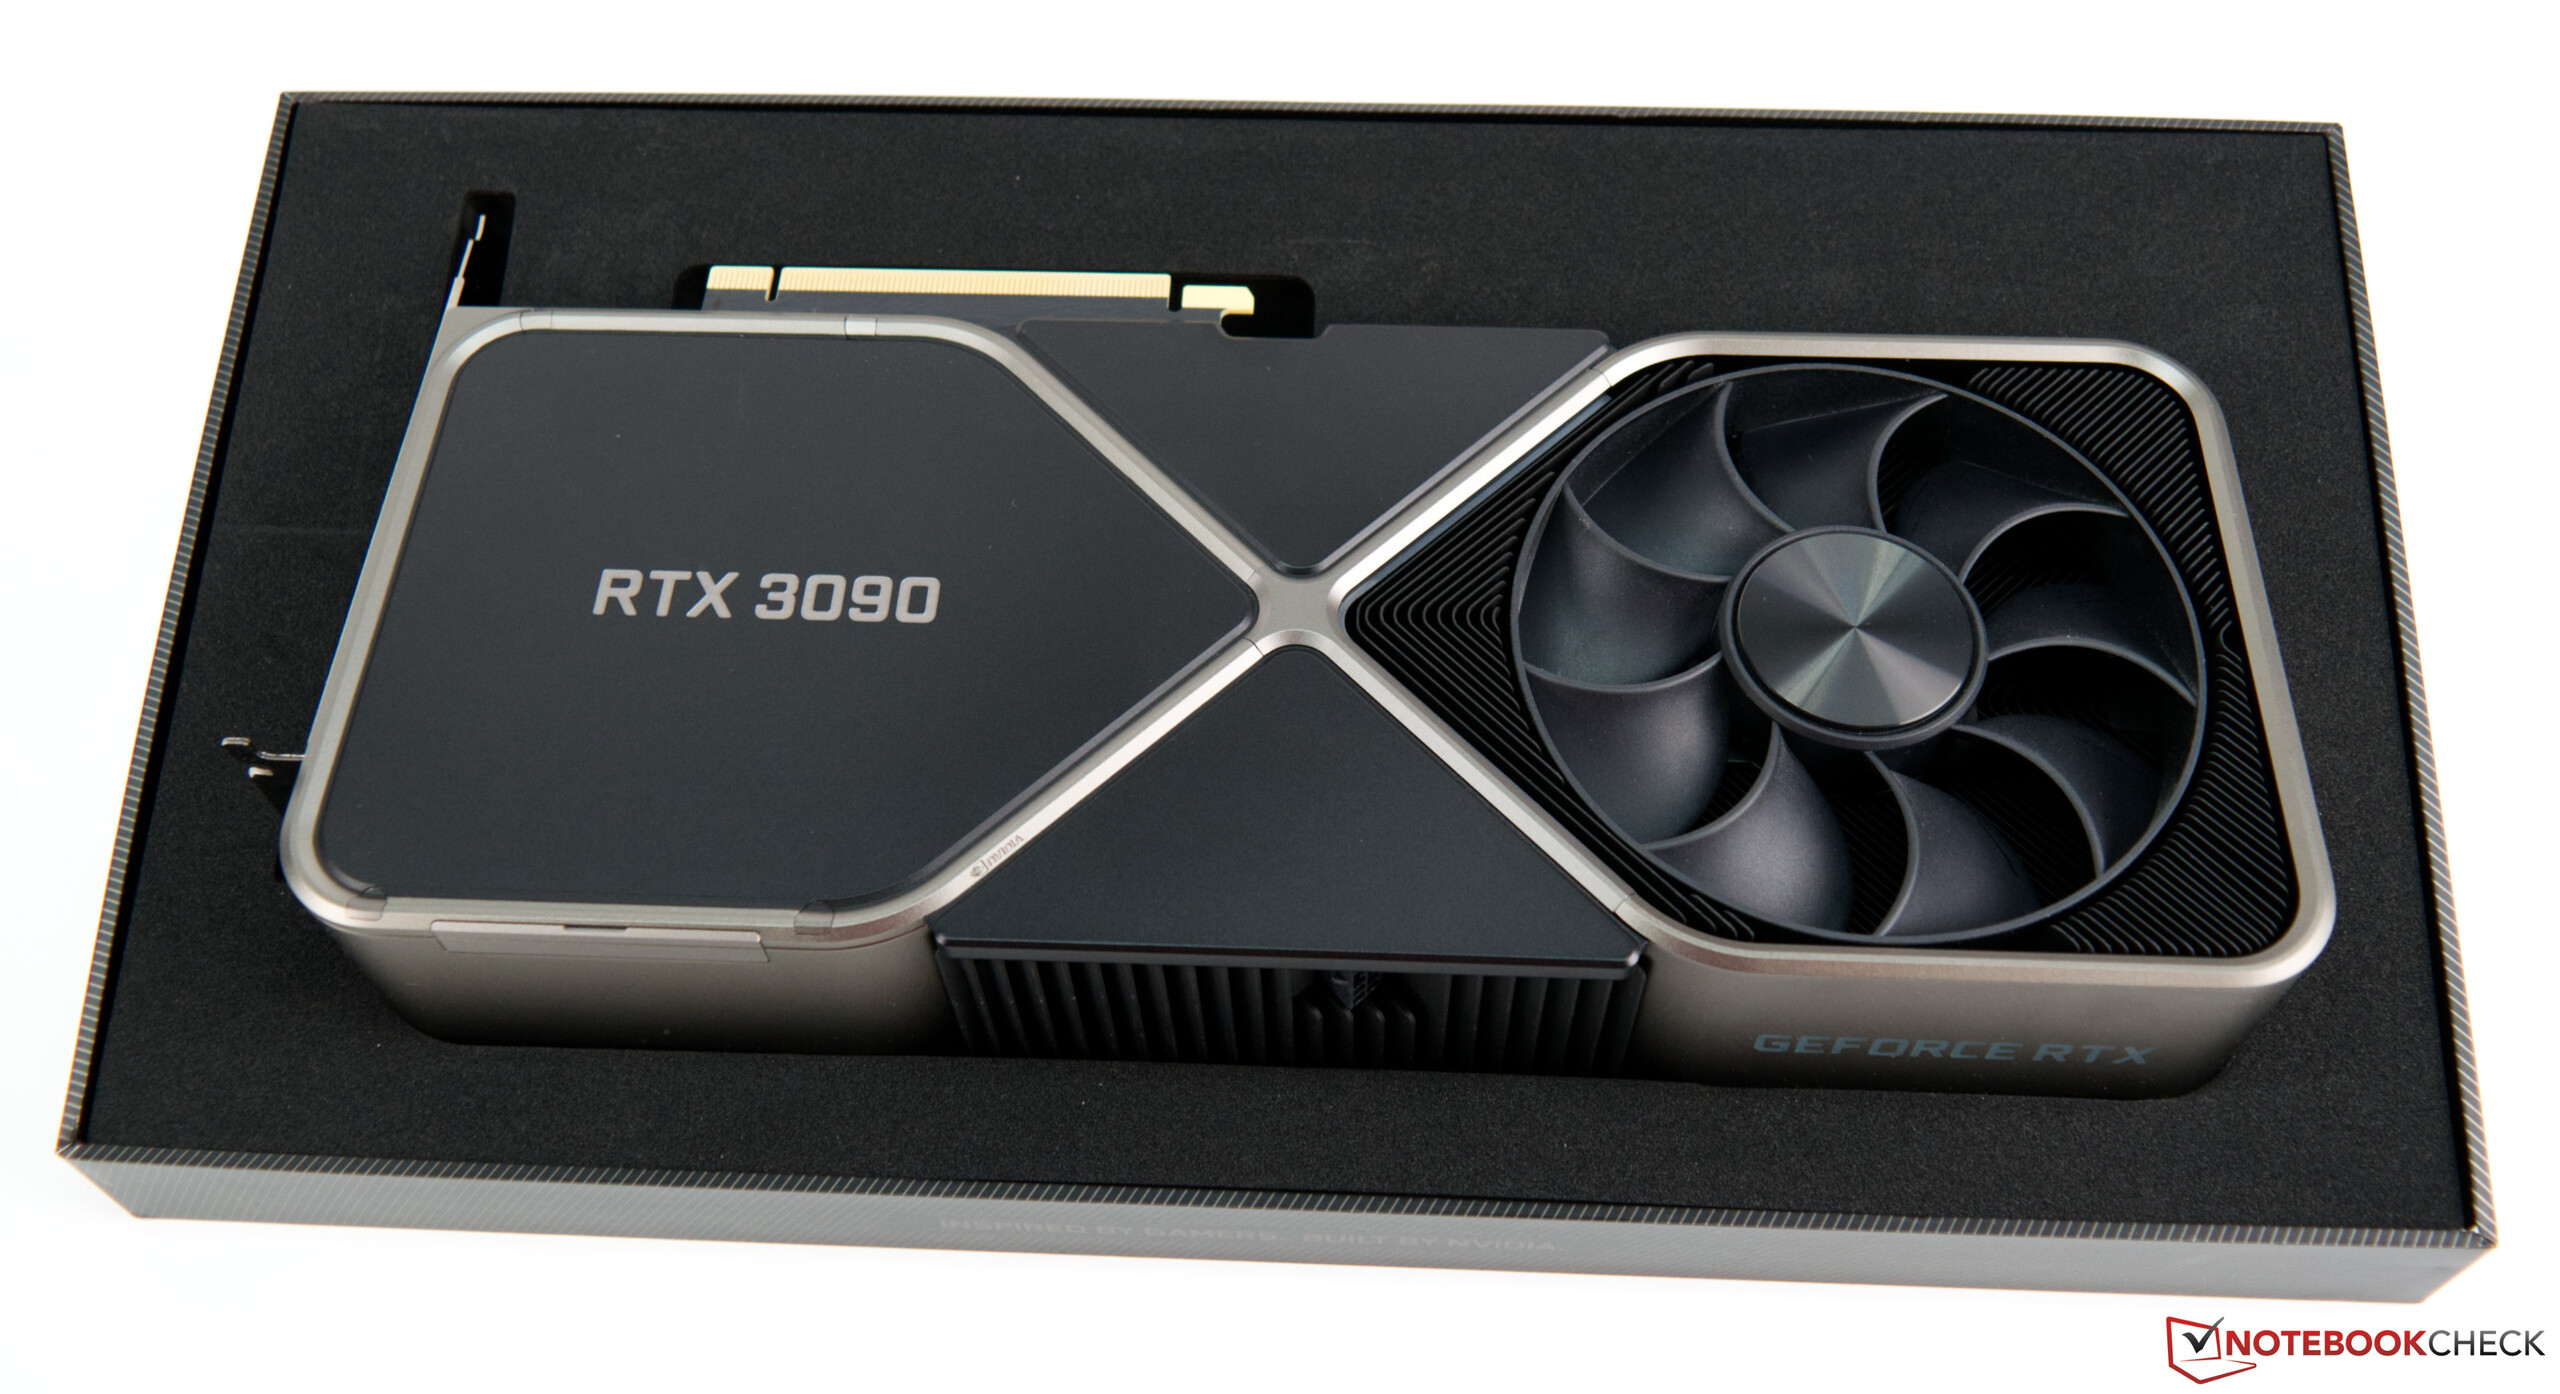
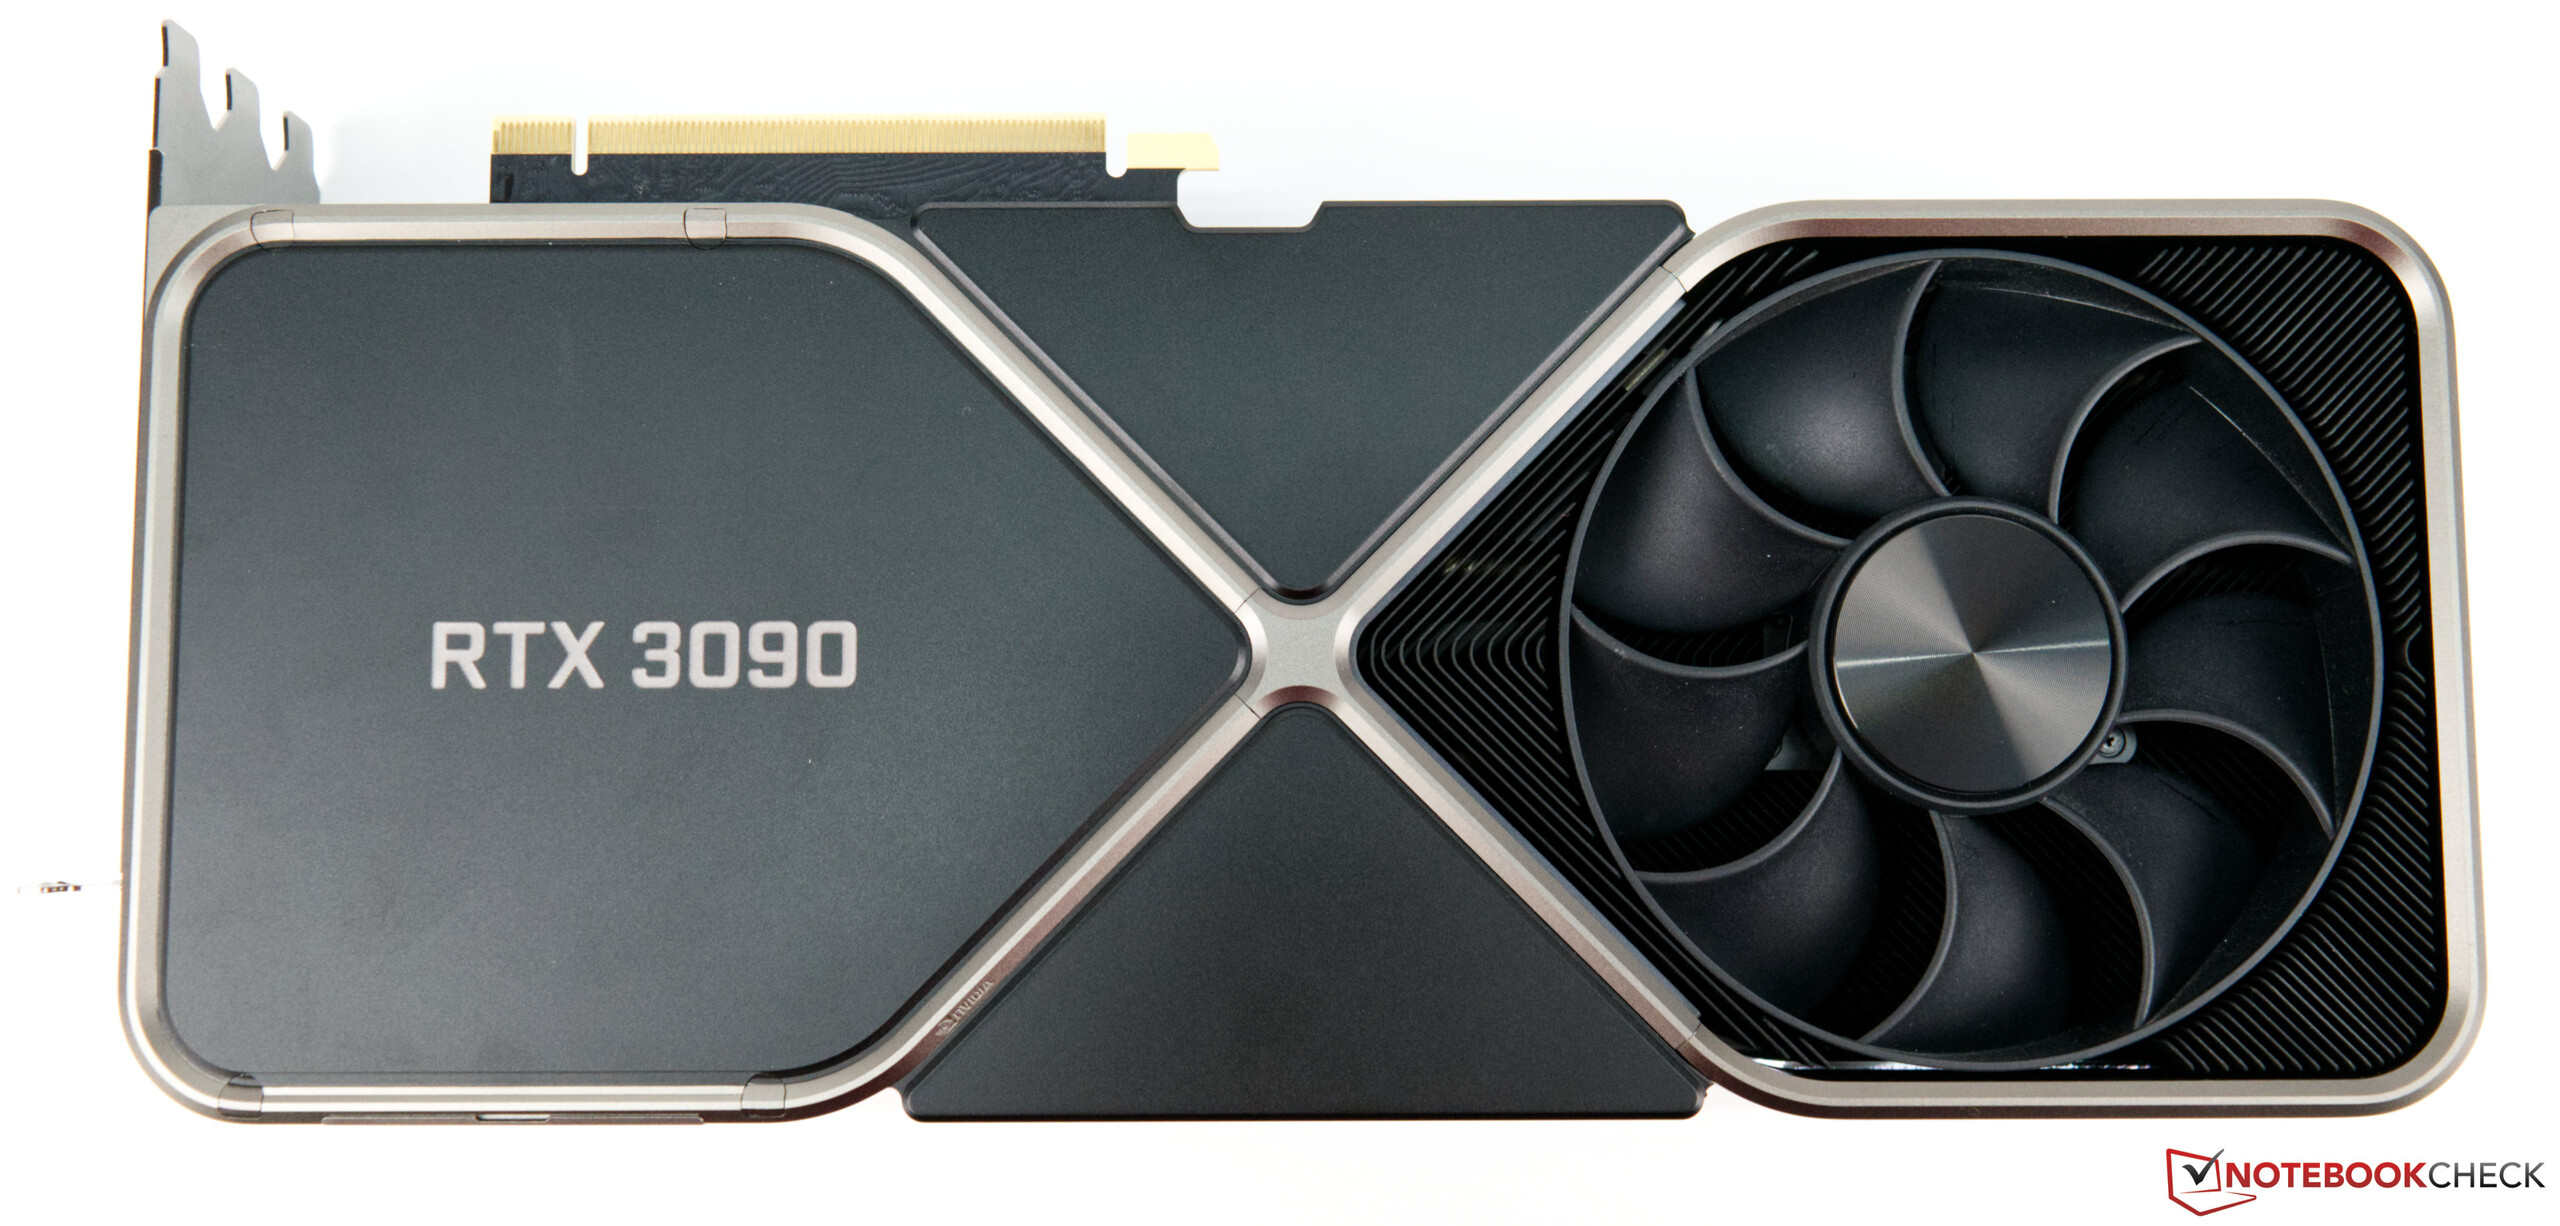
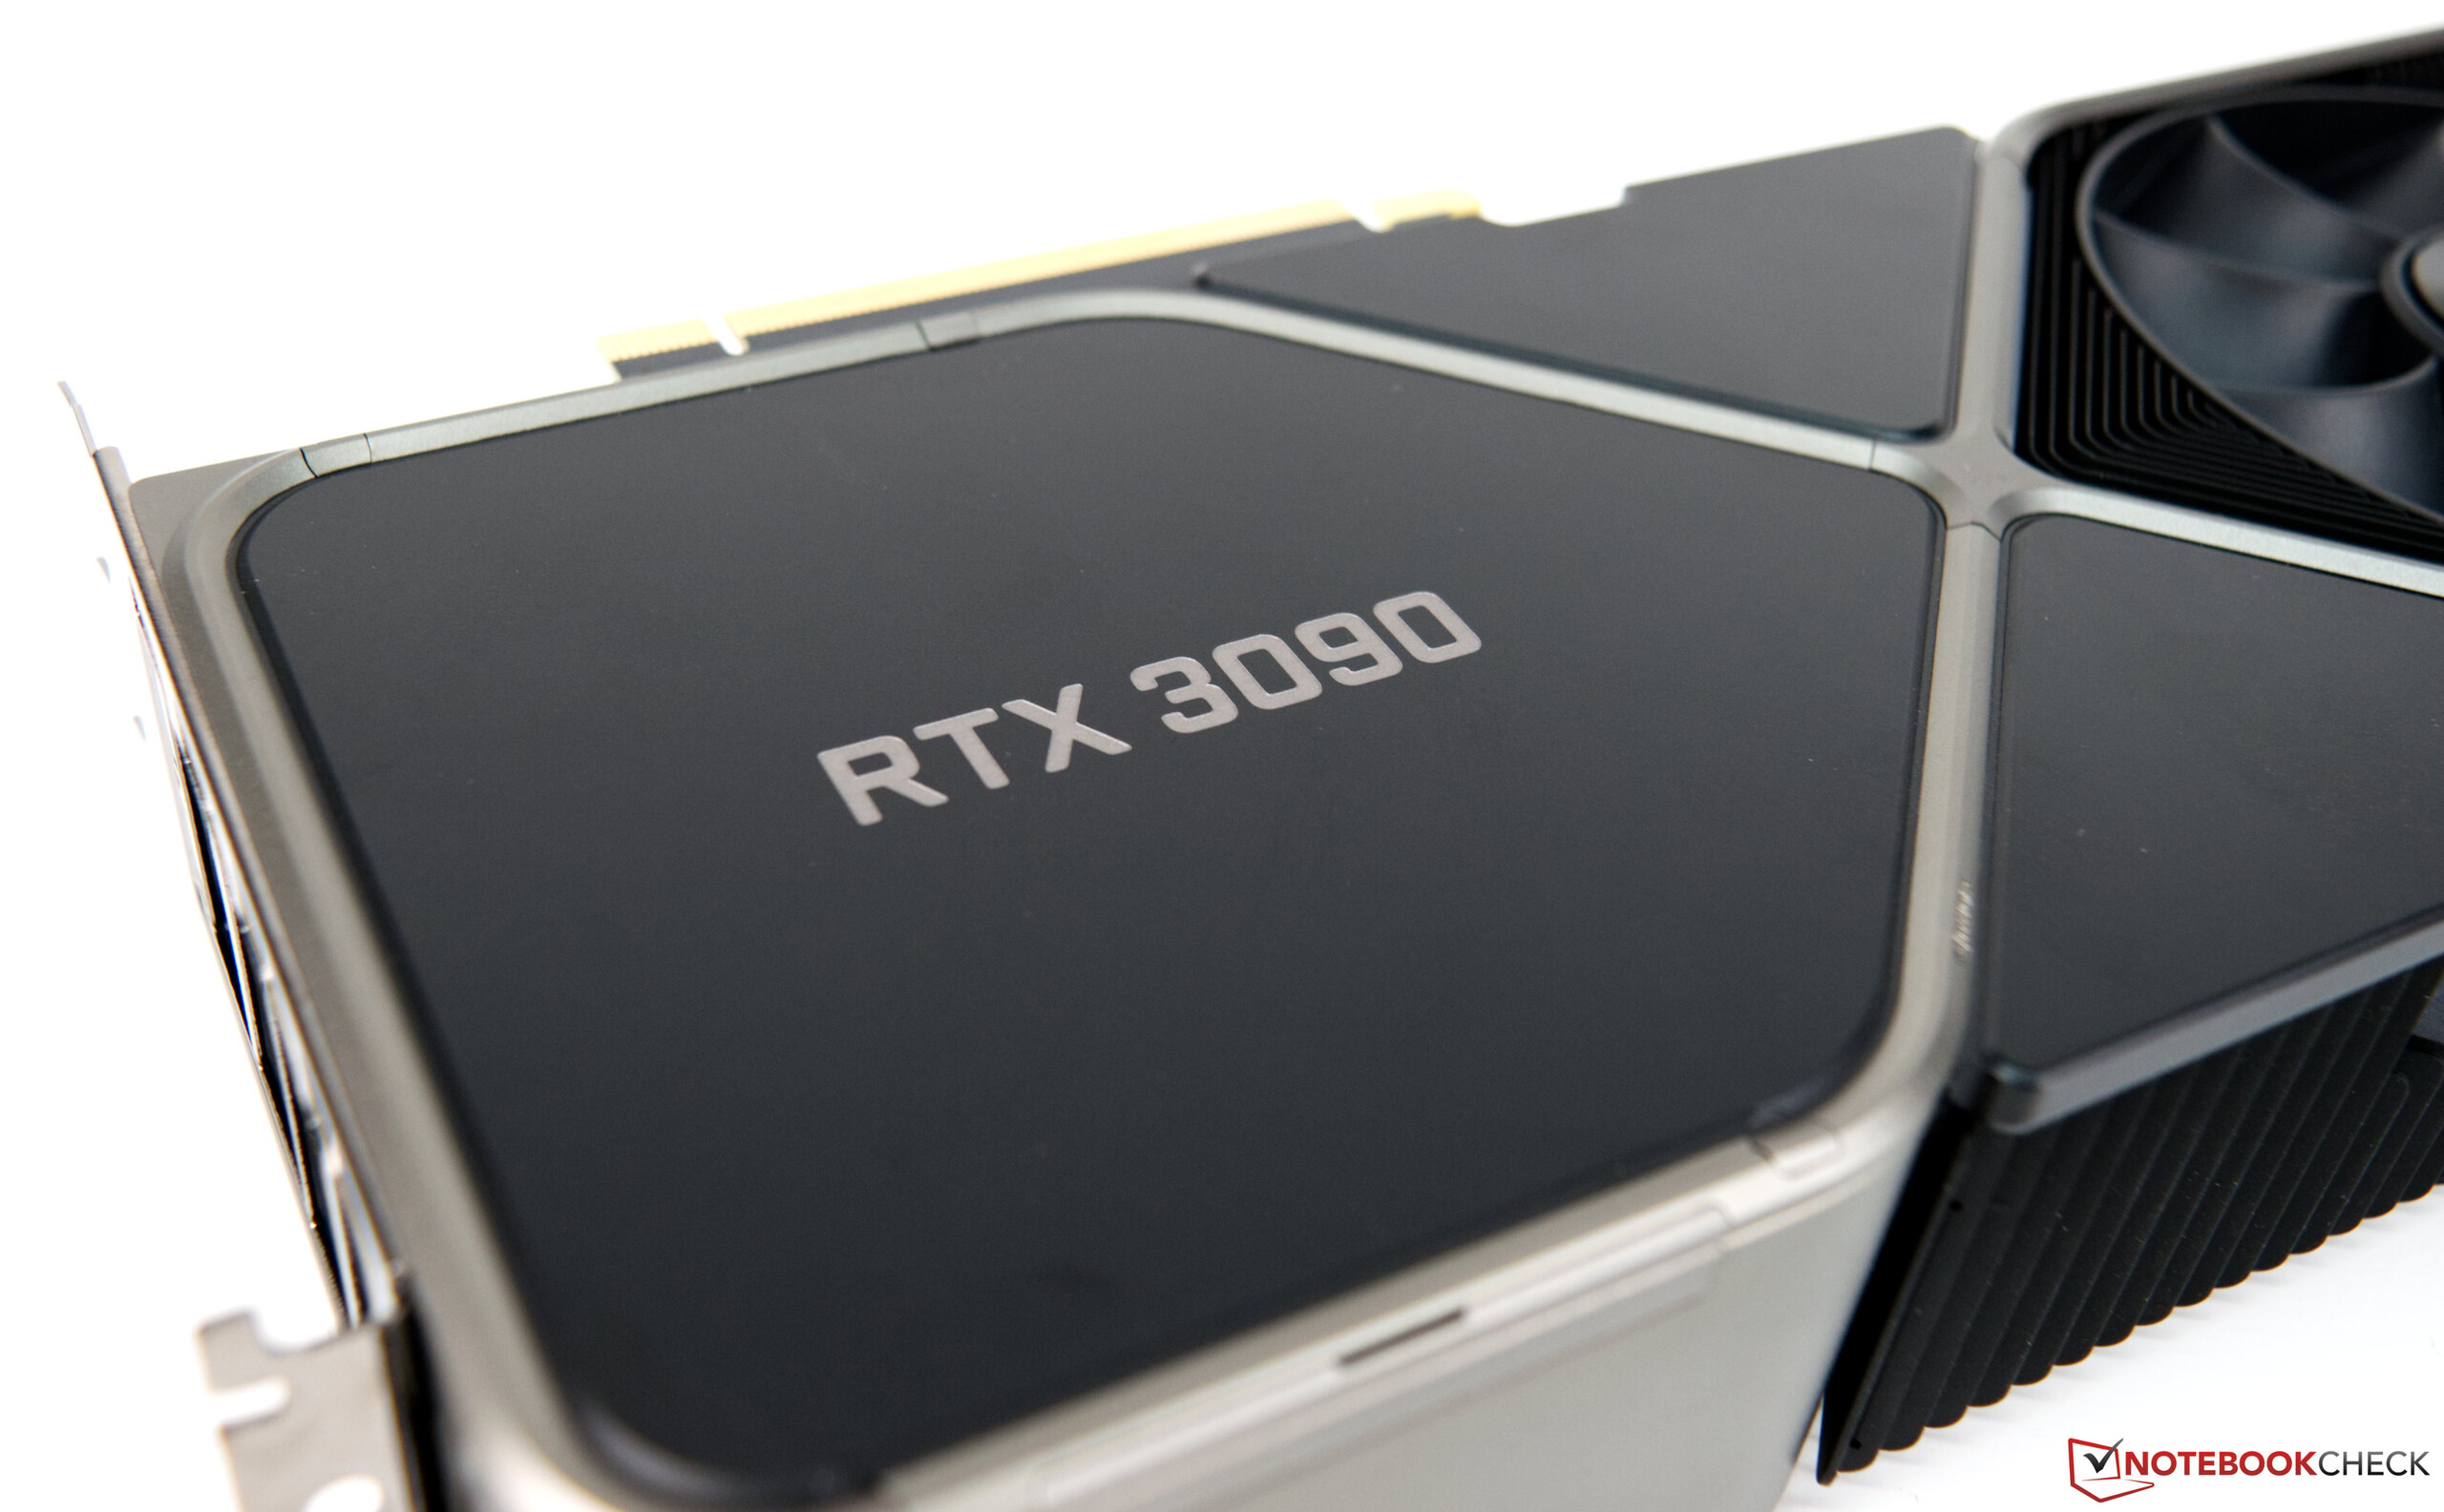
Nvidia GeForce RTX 3090 FE - High-end graphics power at a premium price!

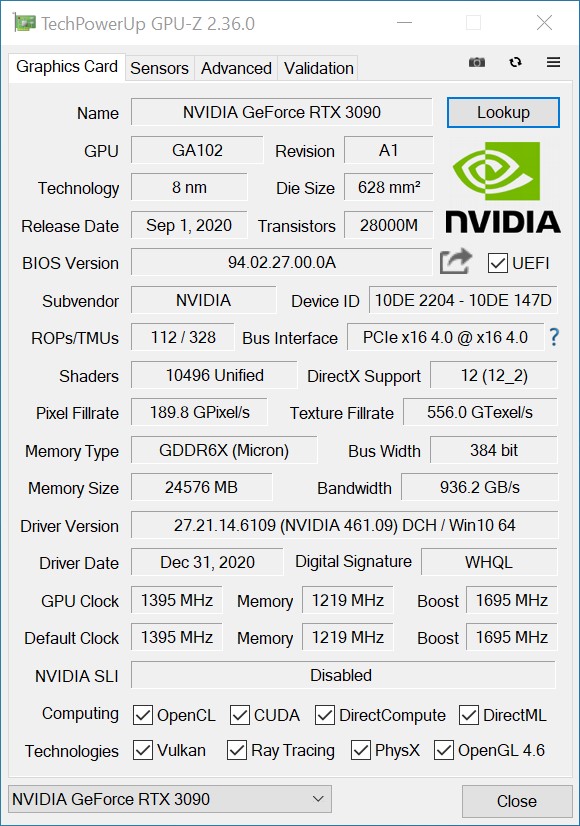
Nvidia's new flagship goes by the name of GeForce RTX 3090 and offers a whopping 24 GB of graphics memory for the consumer sector for the first time. These memory sizes were previously only available in professional graphics solutions like the Quadro or Titan models. One thing is for sure: Criticism due to too little VRAM does not apply with the RTX 3090.
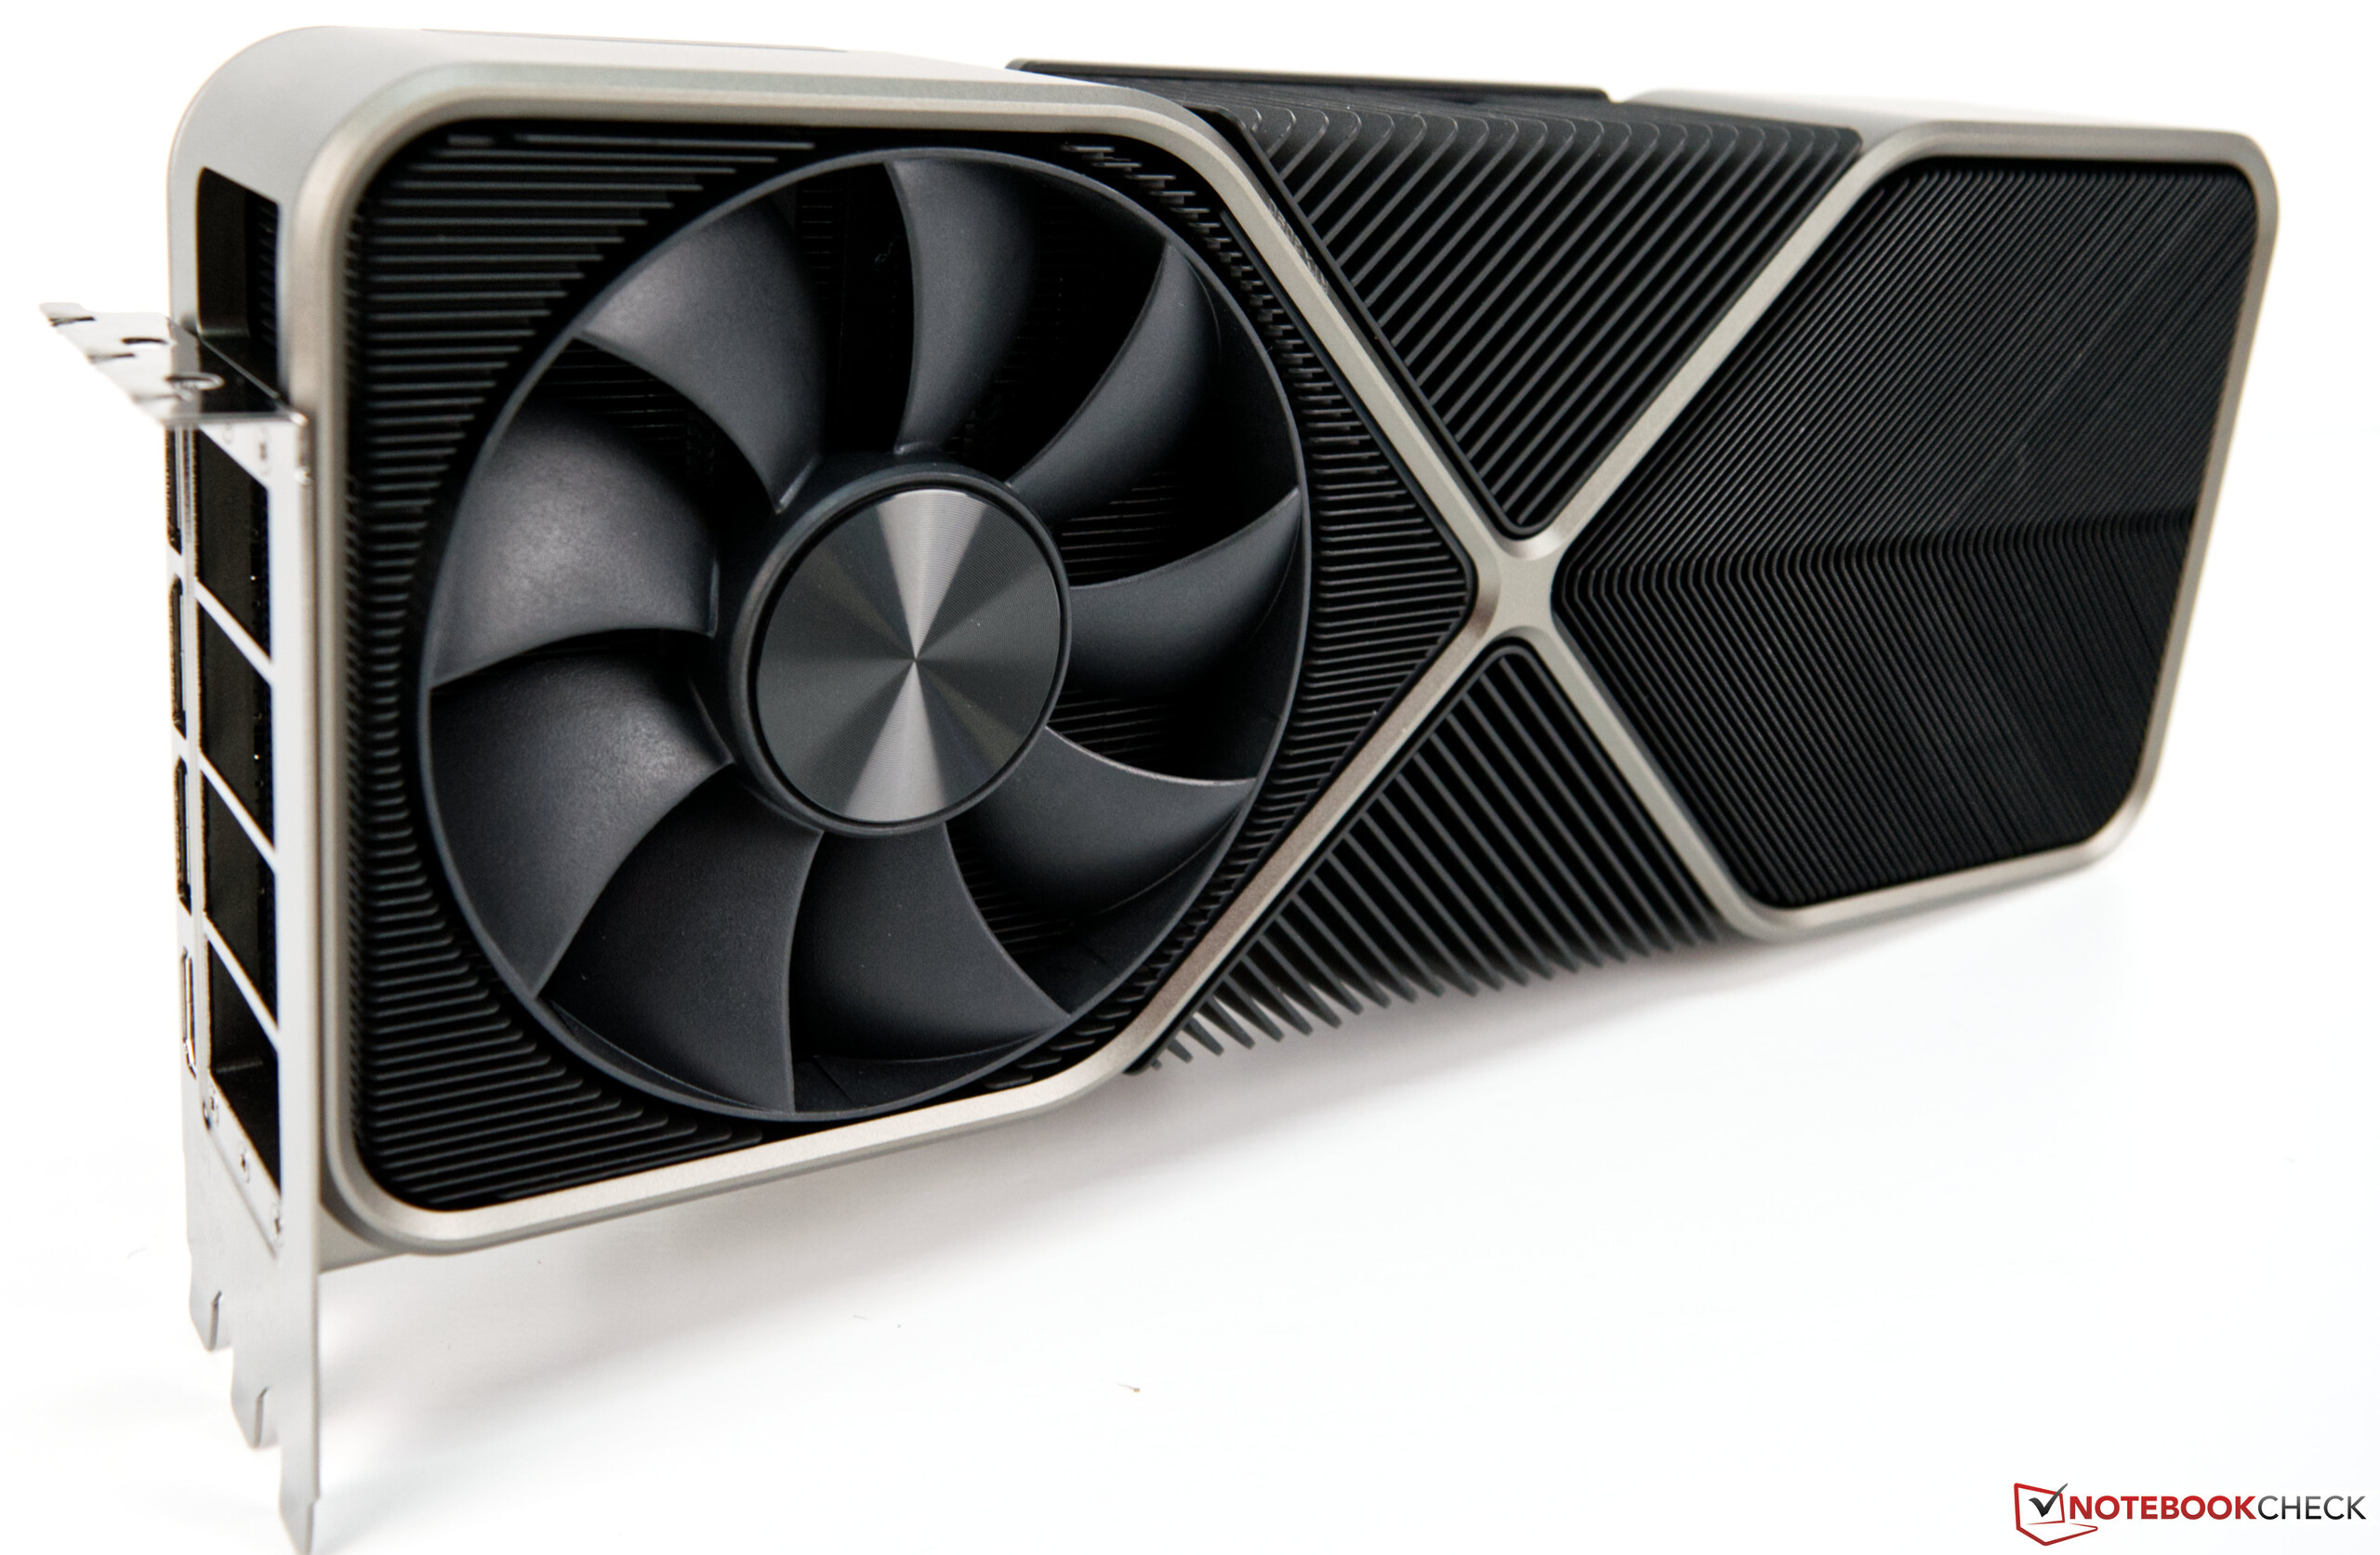
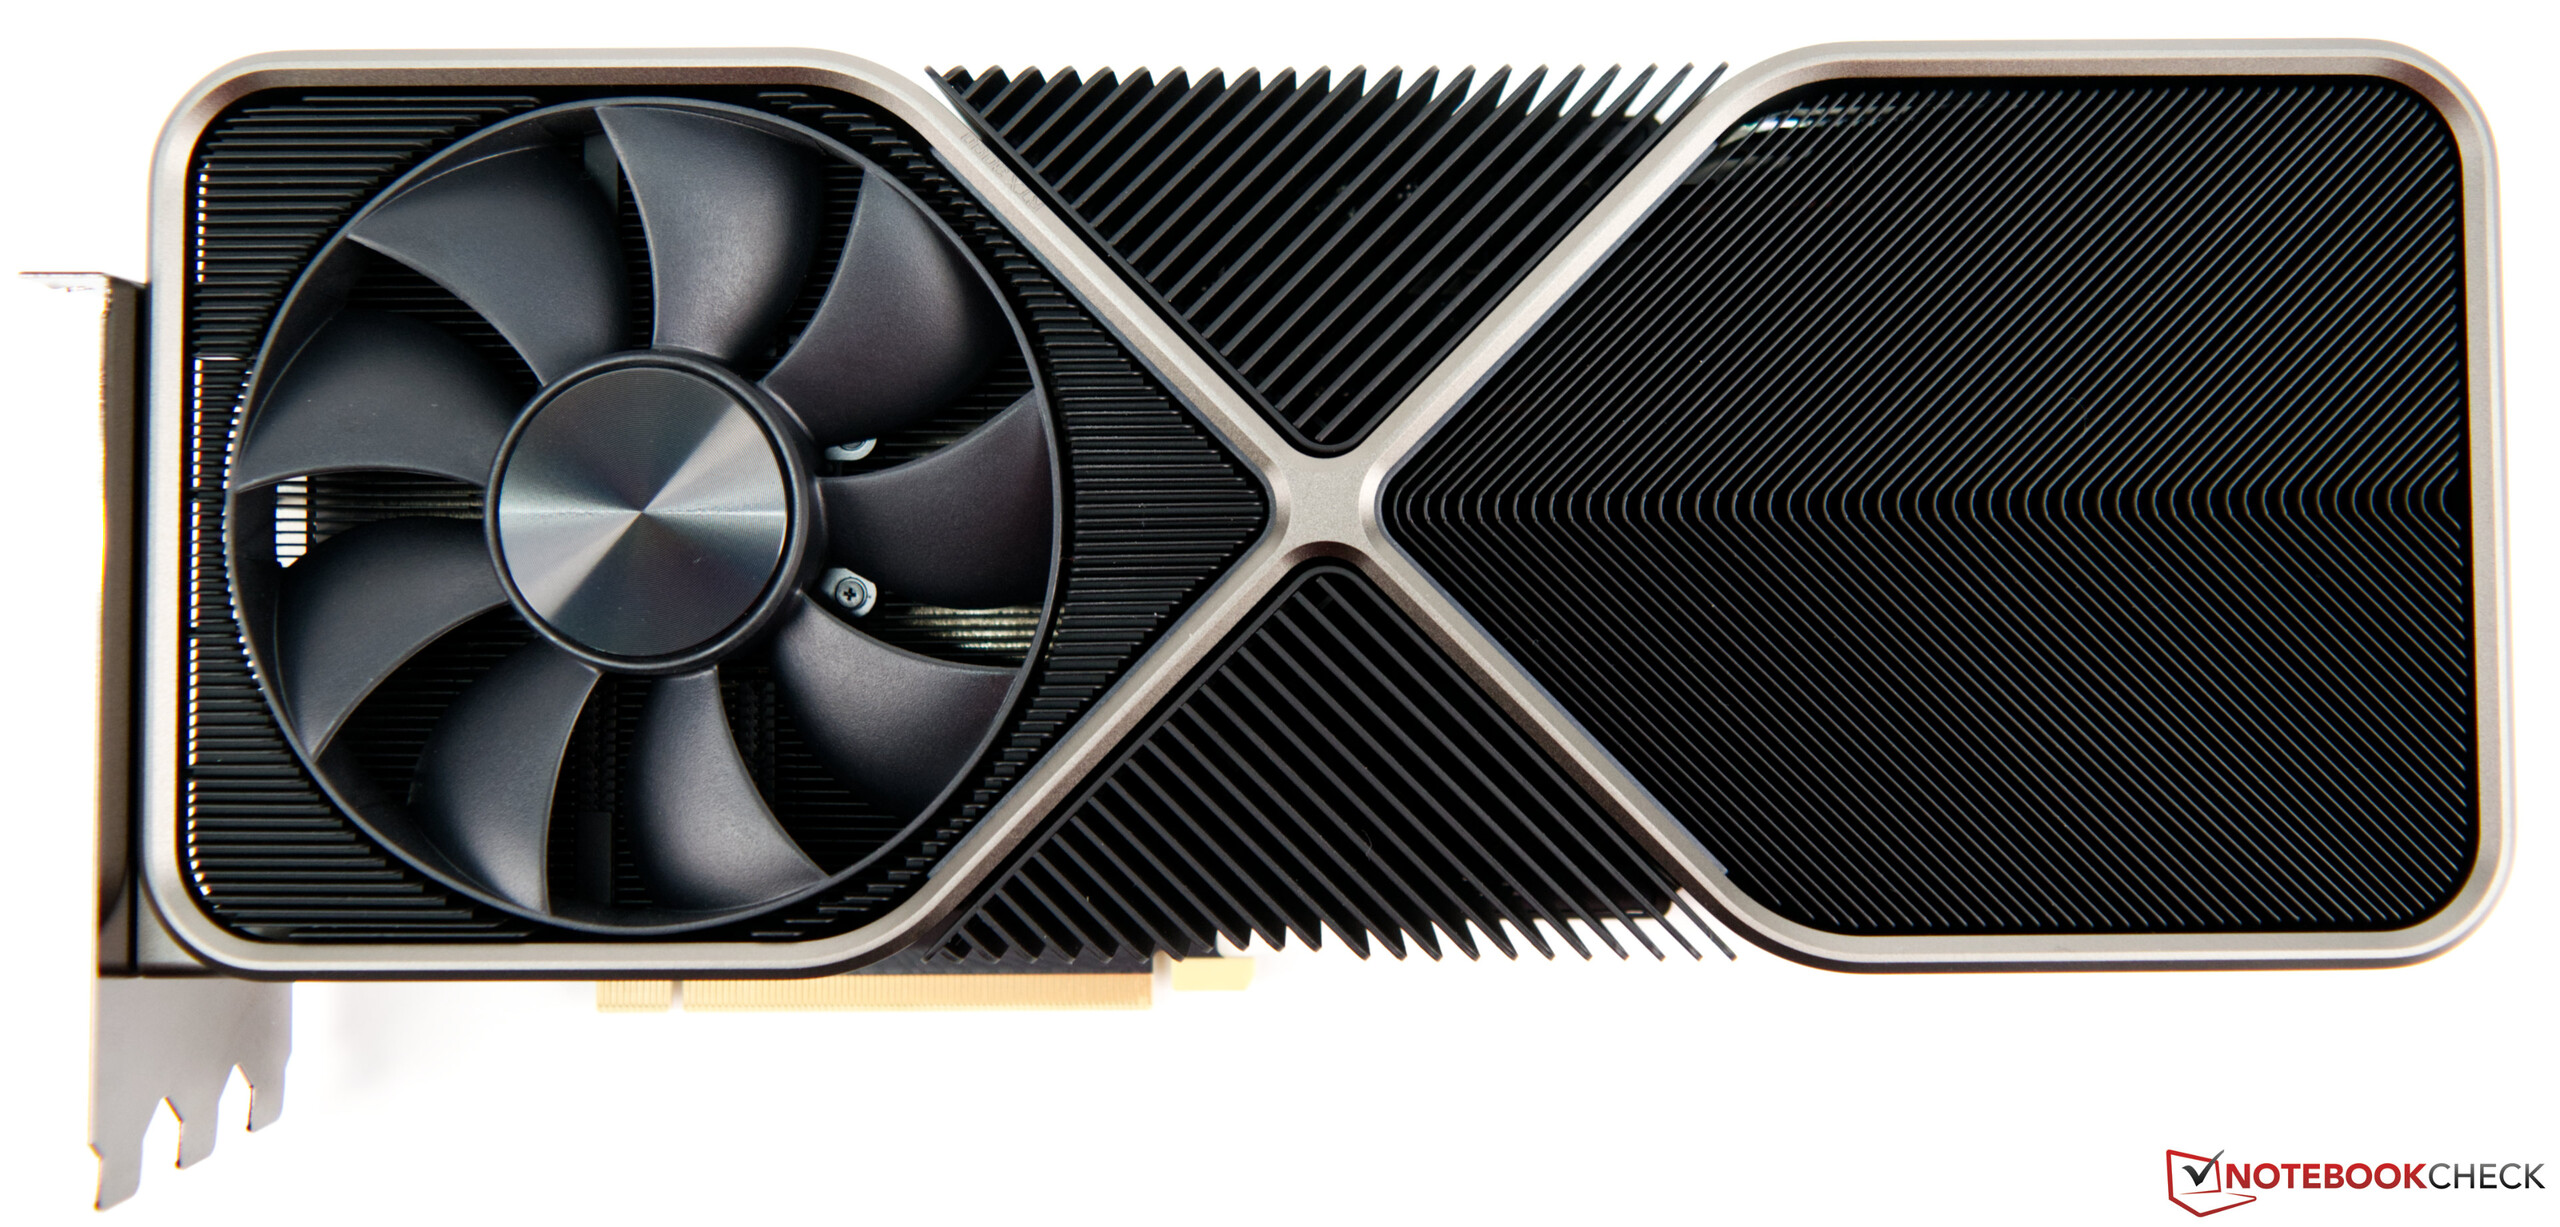
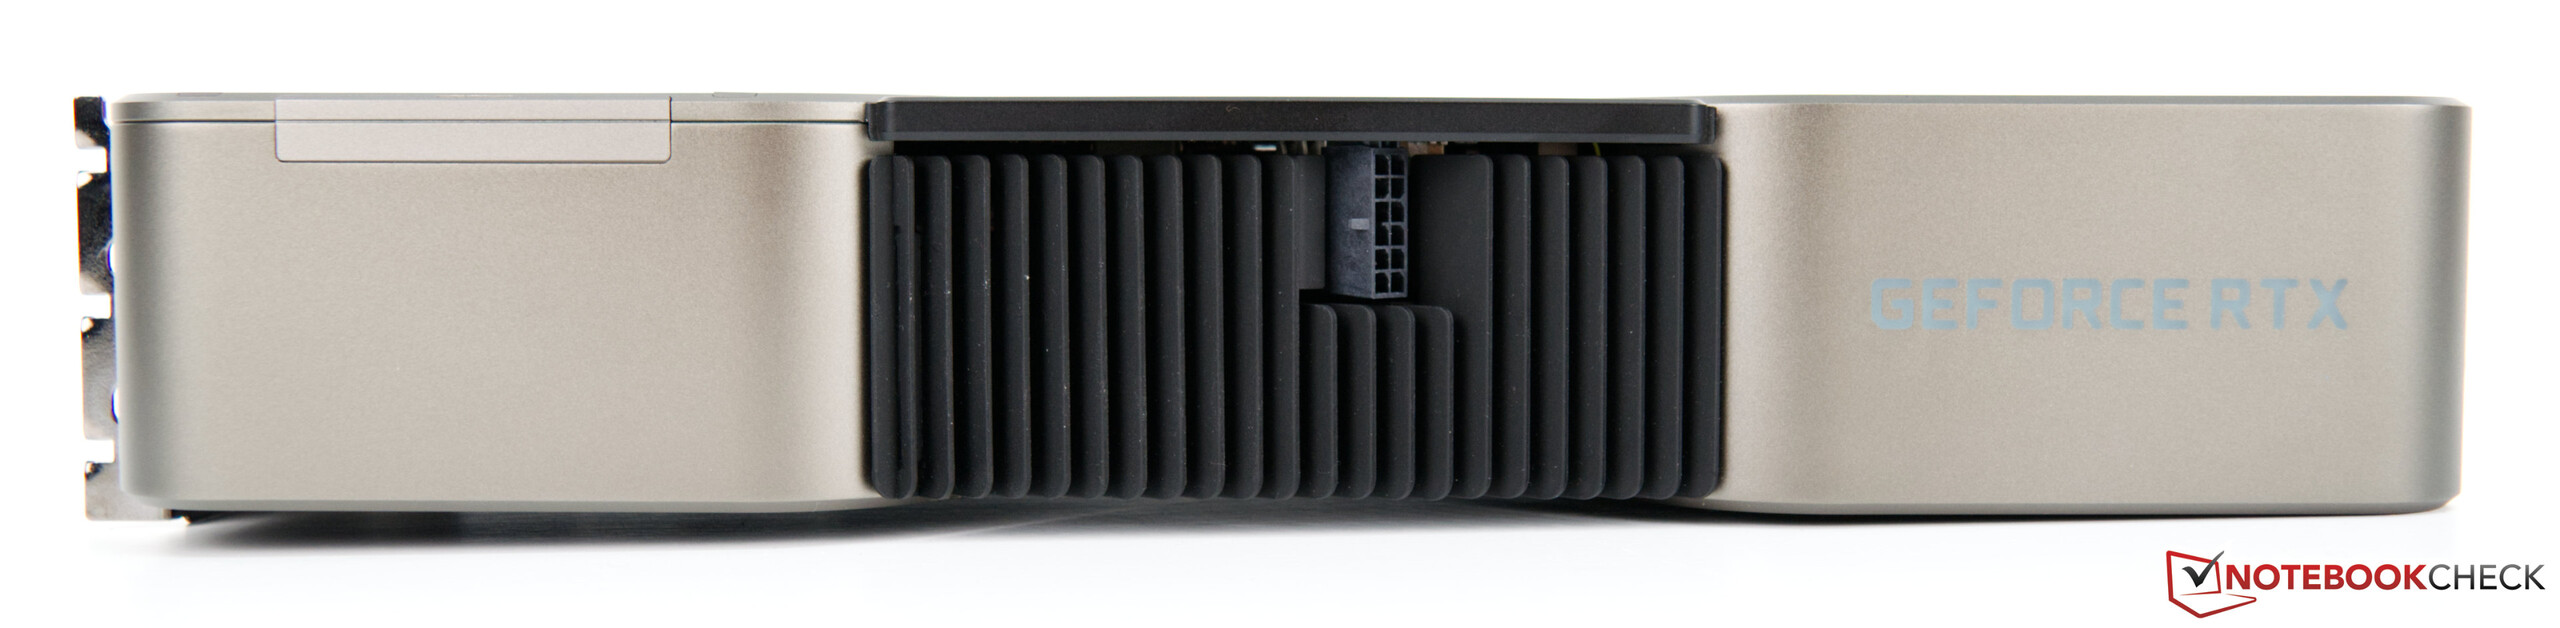
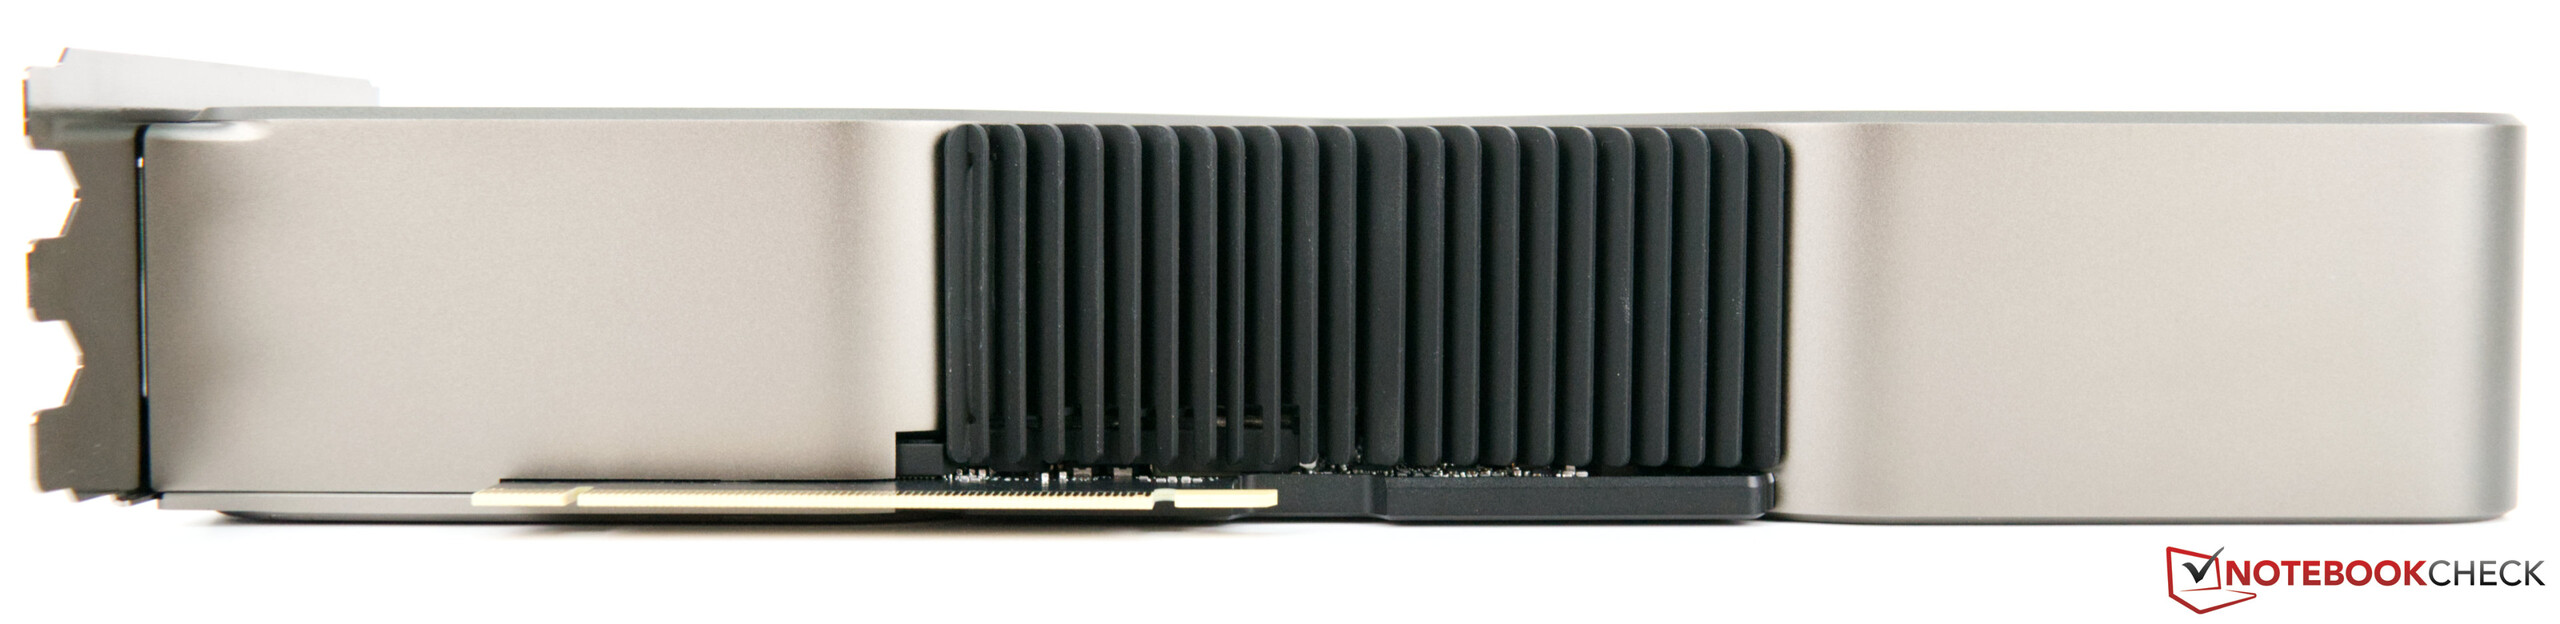
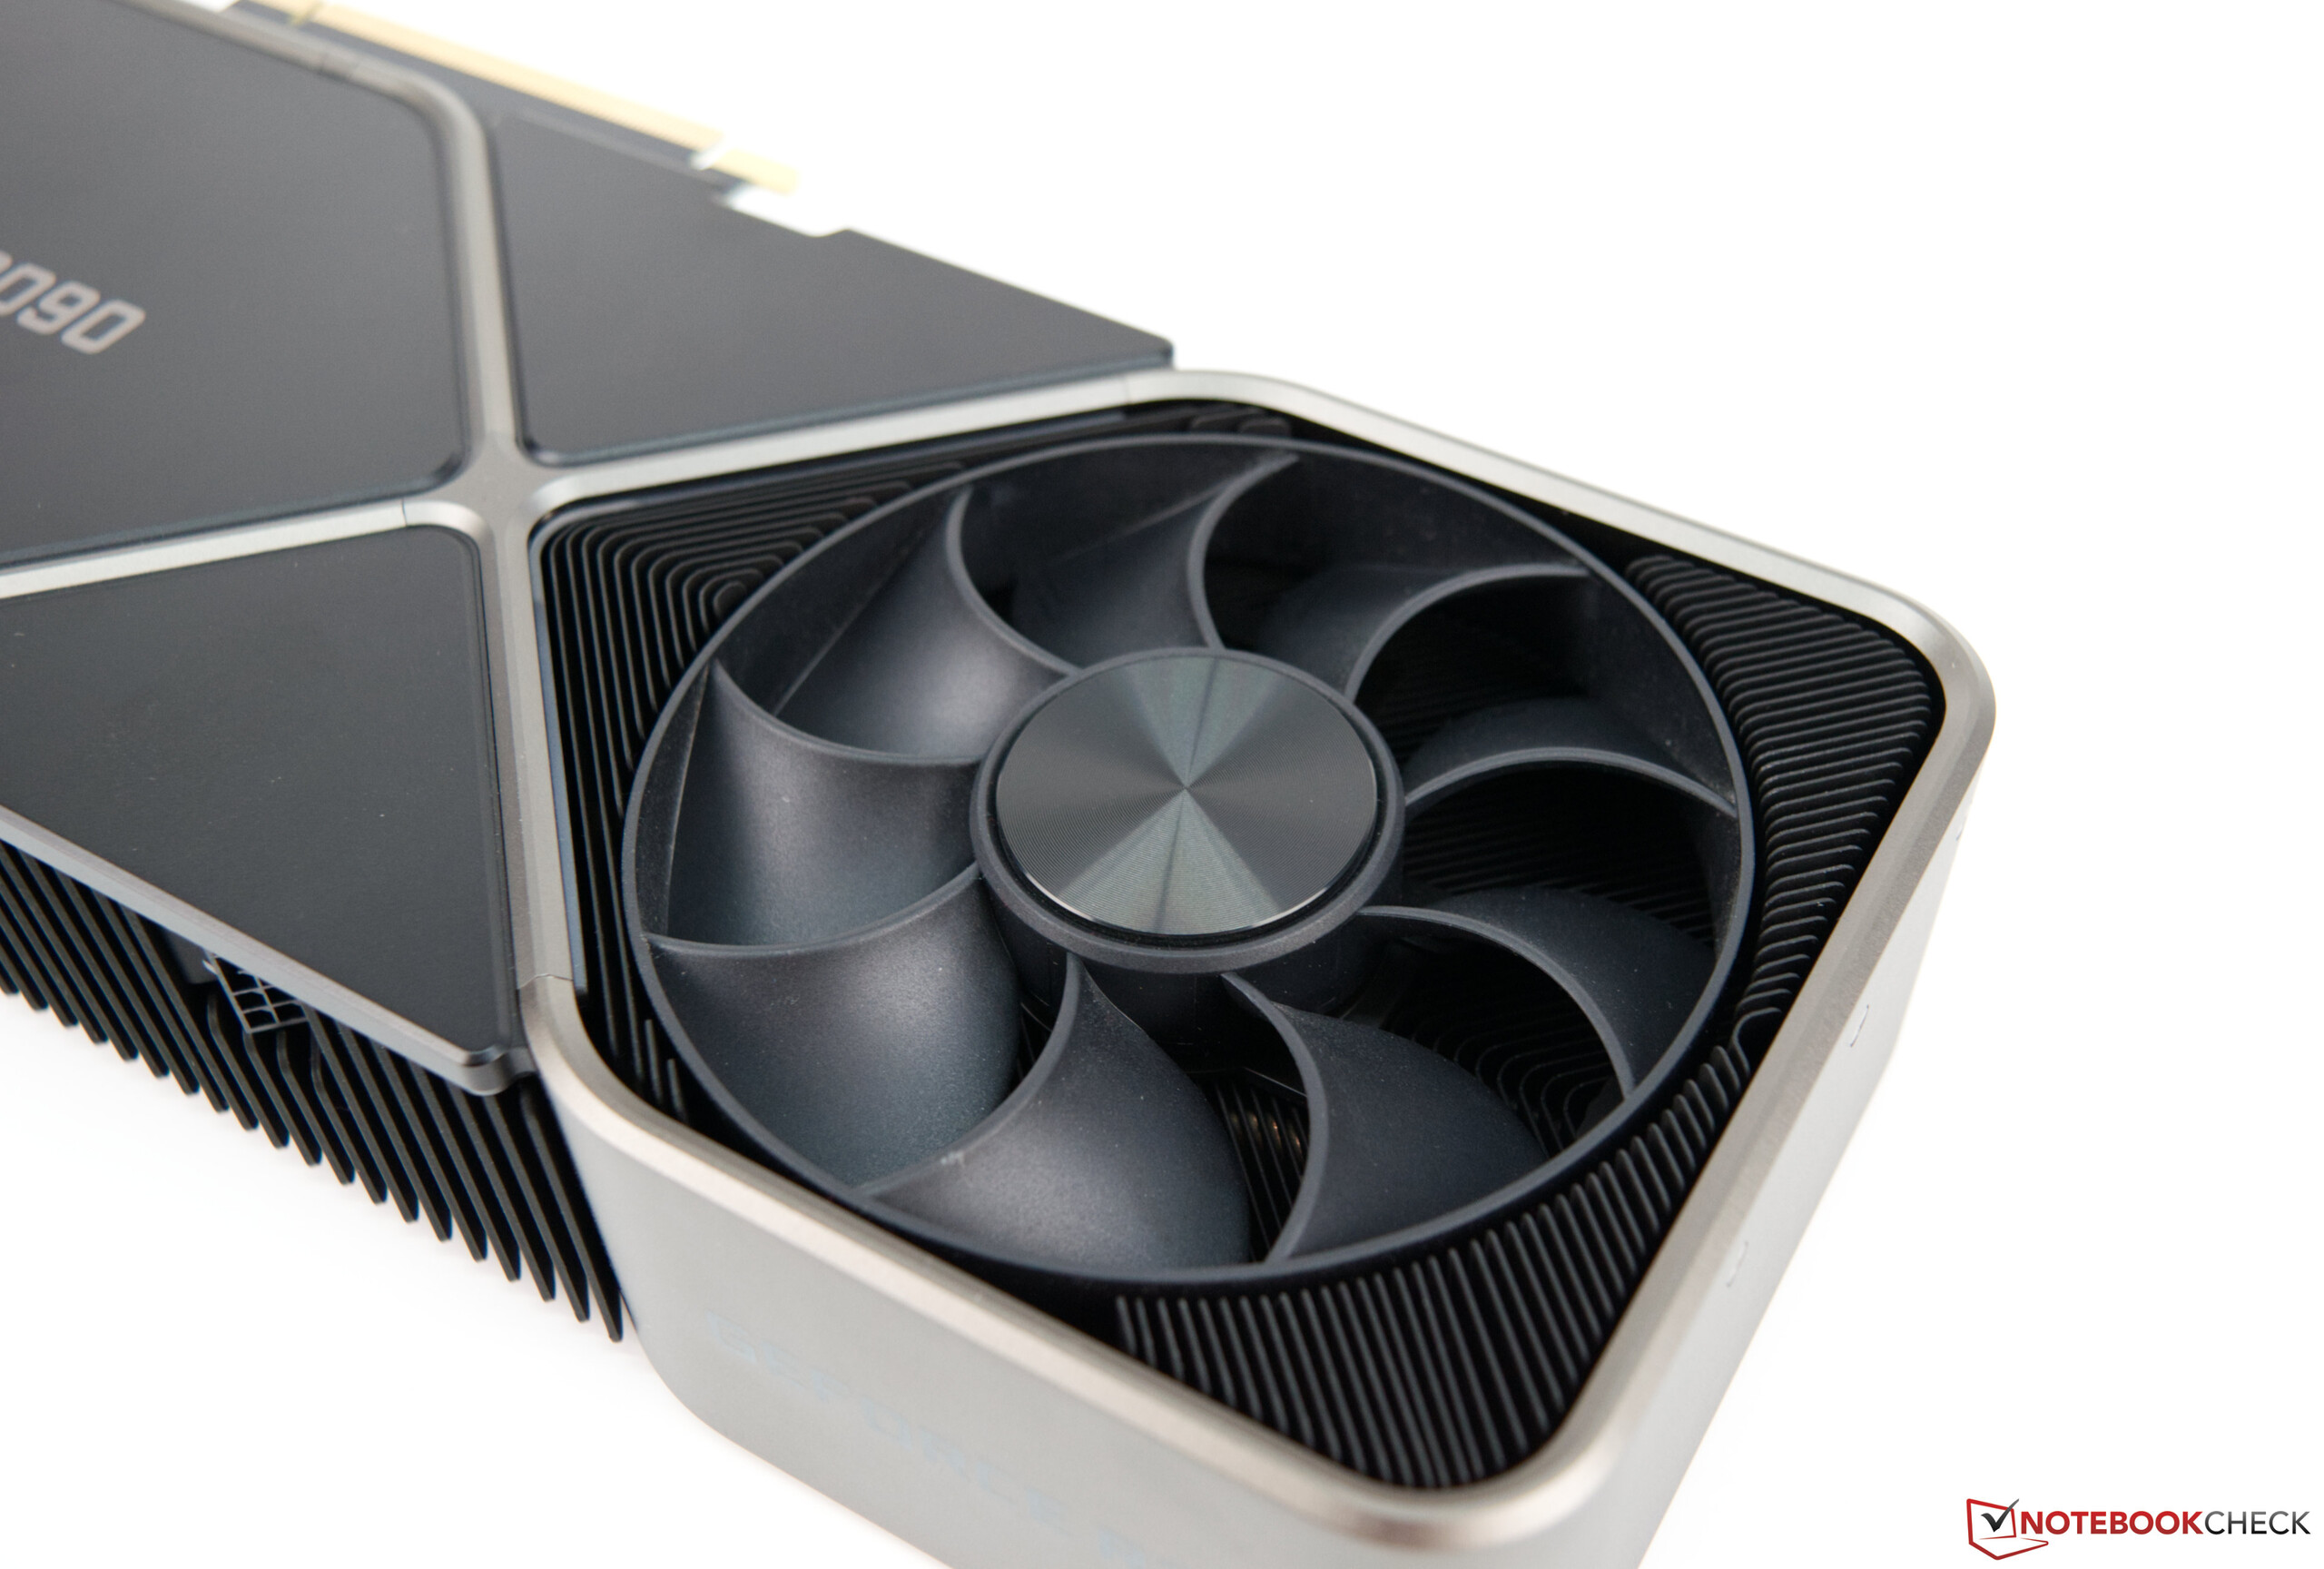
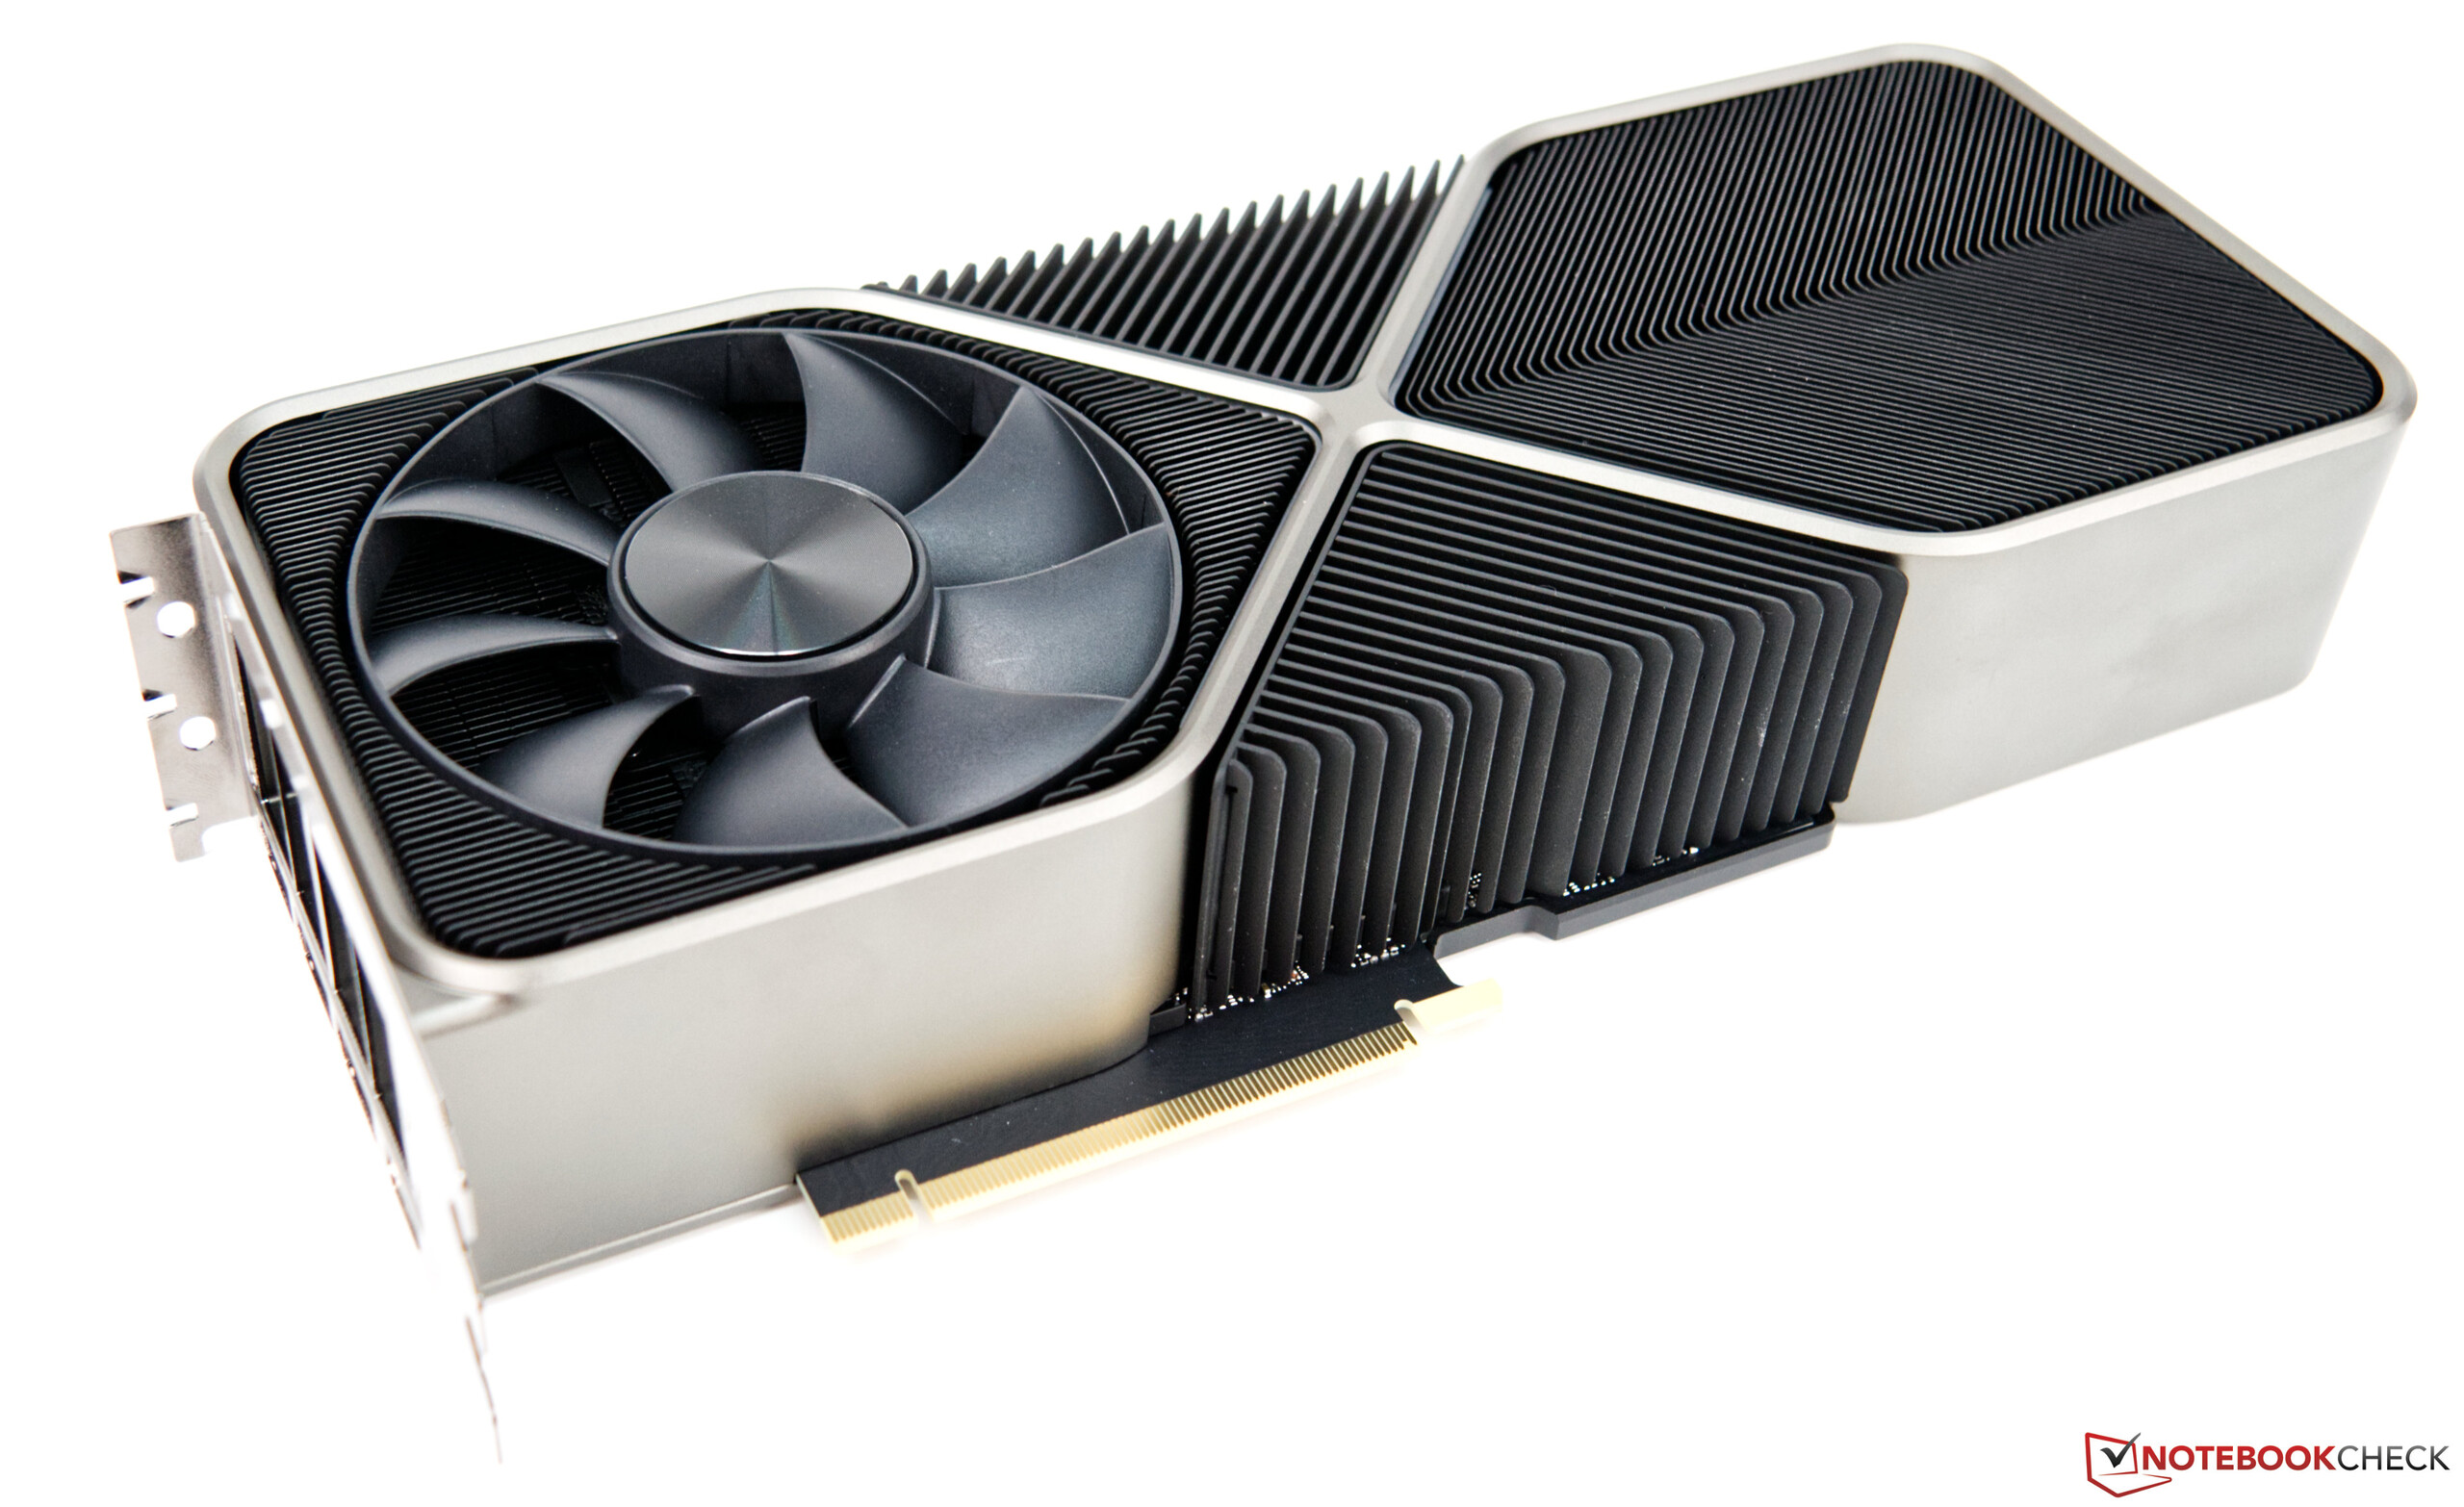
Nvidia clearly deviates from the reference design of the RTX 2000 cards in terms of cooling design. The cooling unit was developed from the ground up, and even three slots are occupied in the GeForce RTX 3090. In return, it finally offers a fan-stop mode, which reduces the noise level in 2D mode significantly. Nvidia also places one axial fan per side, something that we had not seen in this form before. The large 110-millimeter fans push a lot of air through the cooling fins that are distributed over the entire length of the graphics card. This provides a very large cooling surface to quickly dissipate the power loss of the 350 watts. The Nvidia GeForce RTX 3090 weighs a good 2 kilograms. If you install the graphics card horizontally in your system, you should consider a stand. The PCI slot will thank you in the long run. Unlike with the MSI GeForce RTX 3090 Suprim X, Nvidia does not include a graphics card support stand with its model.
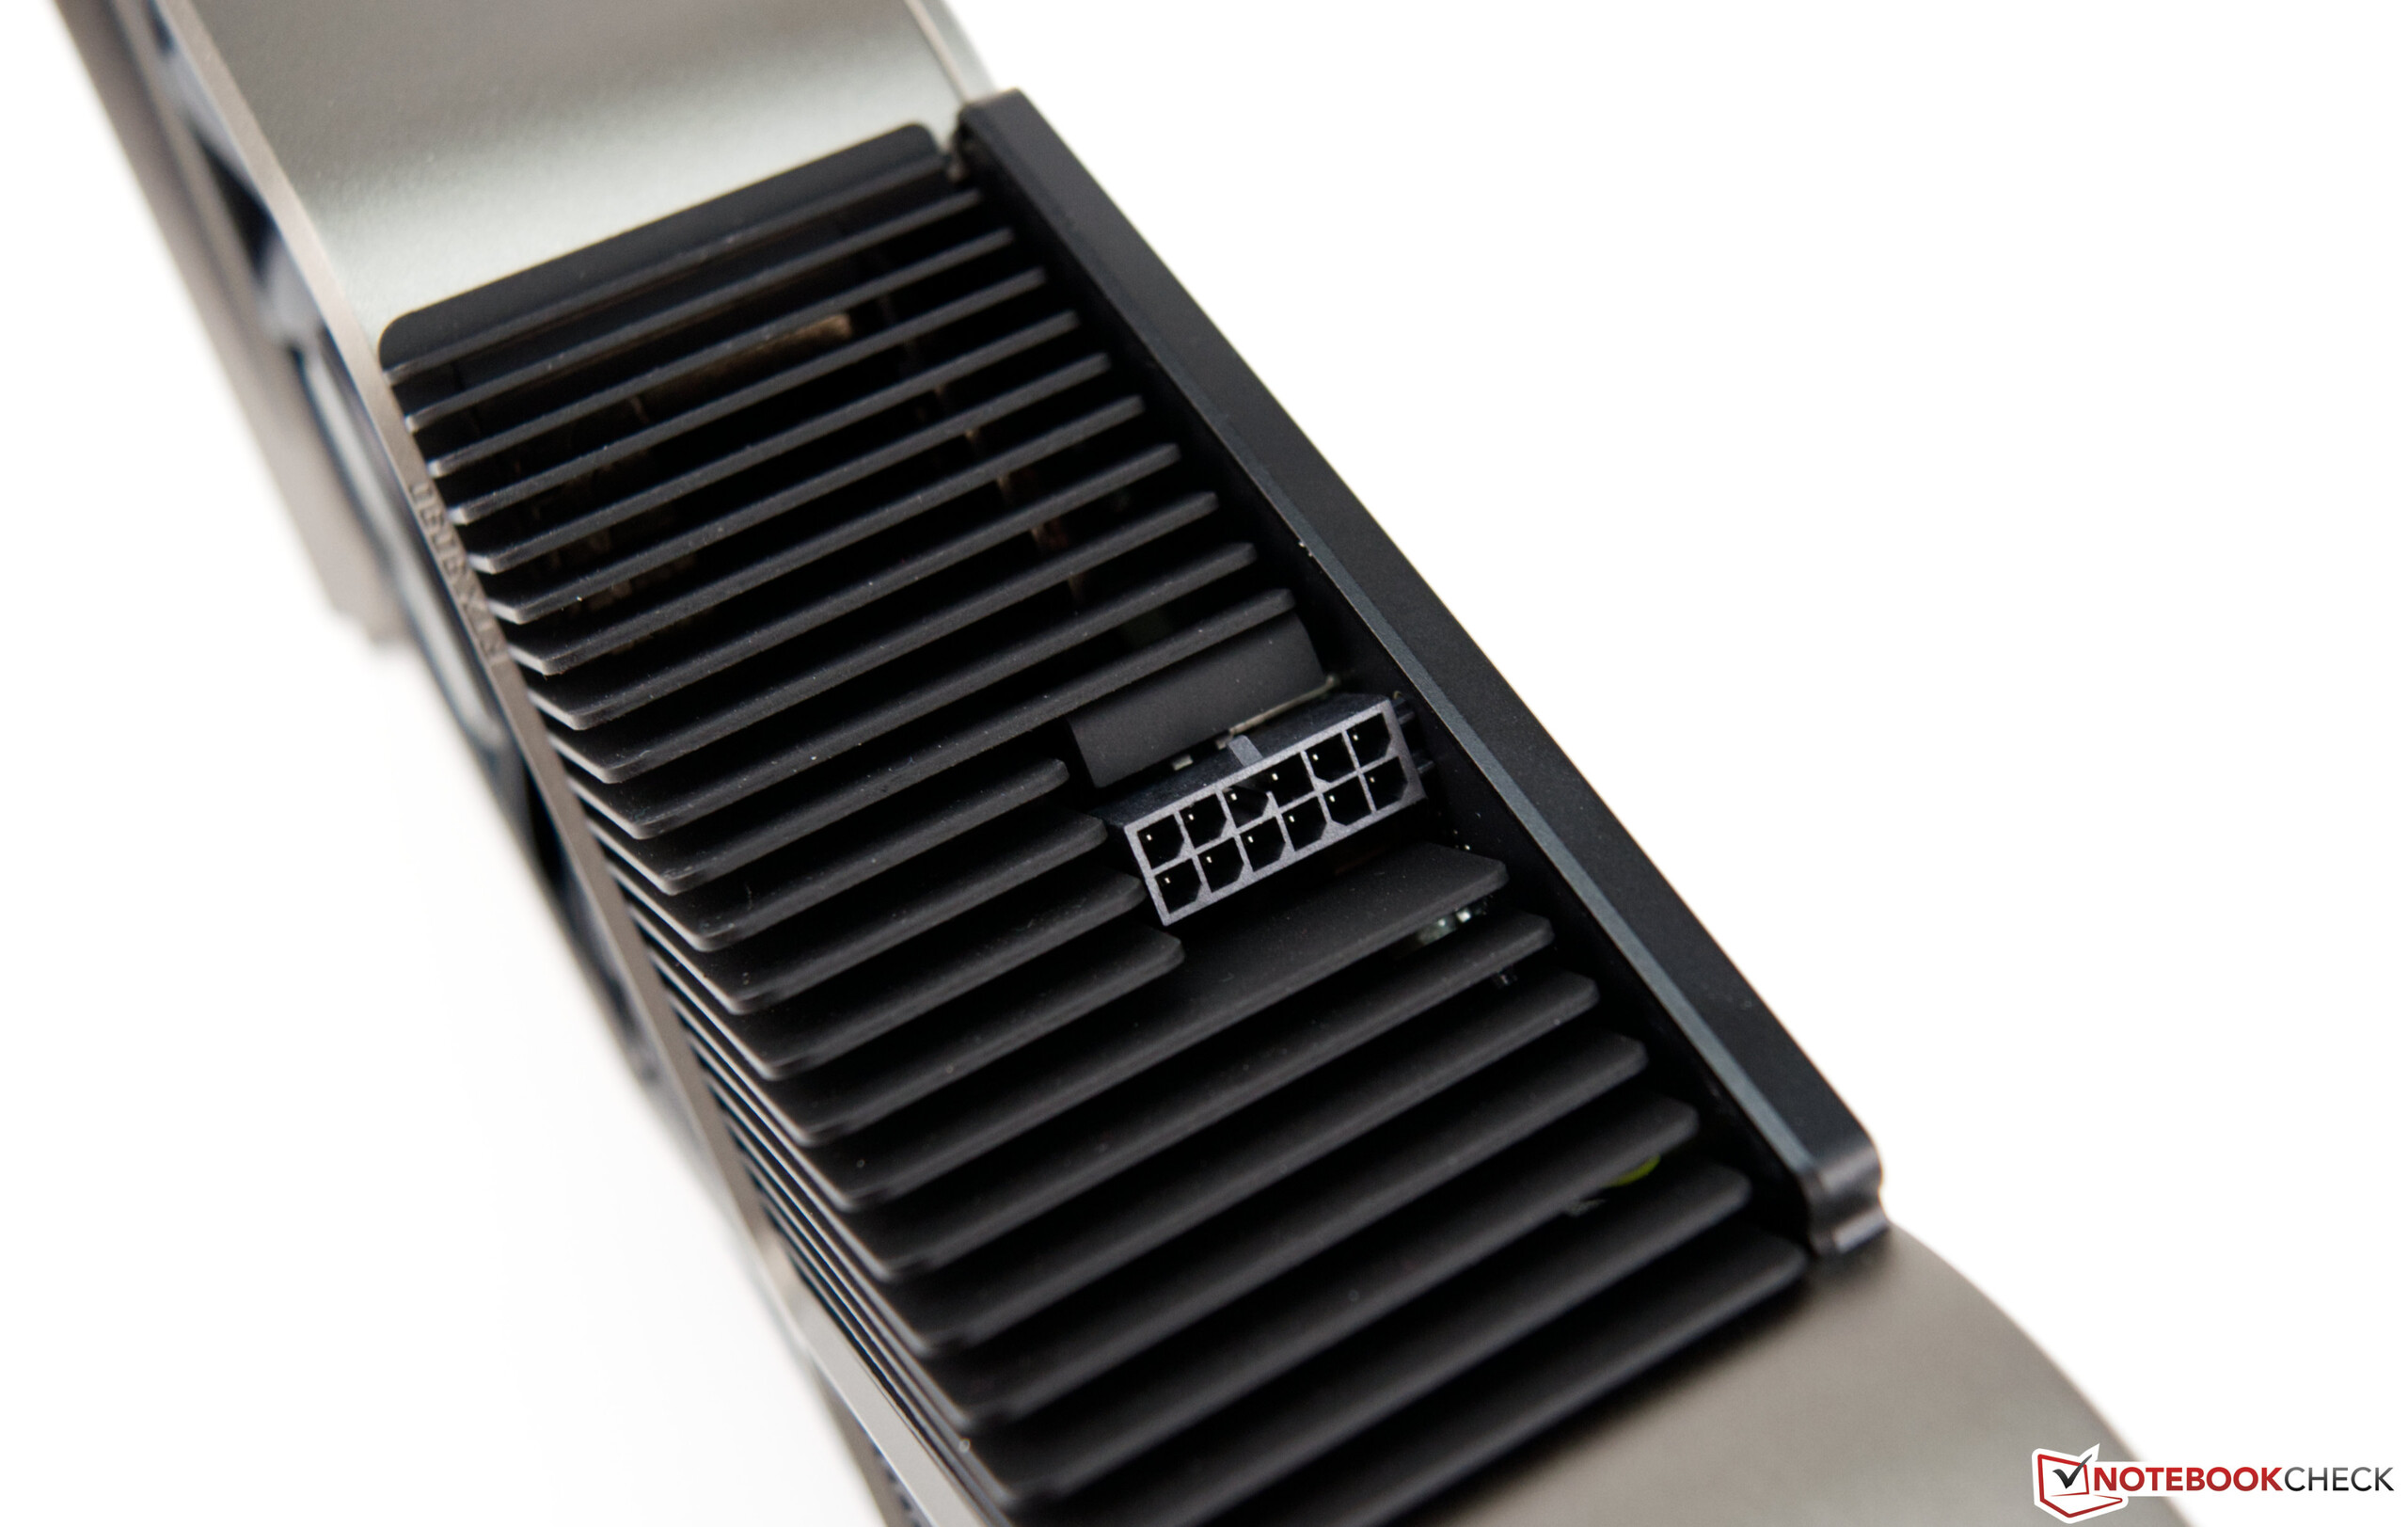
Another new feature is the 12-pin power connector. This replaces the previous 2x 8-pin connectors. However, in our opinion, its placement is not very well designed, because those who use the included adapter will always have an unsightly cable tangle in front of them in their field of vision. Various power supply manufacturers have reacted and offer suitable cables to be able to manage without the included adapter construction.
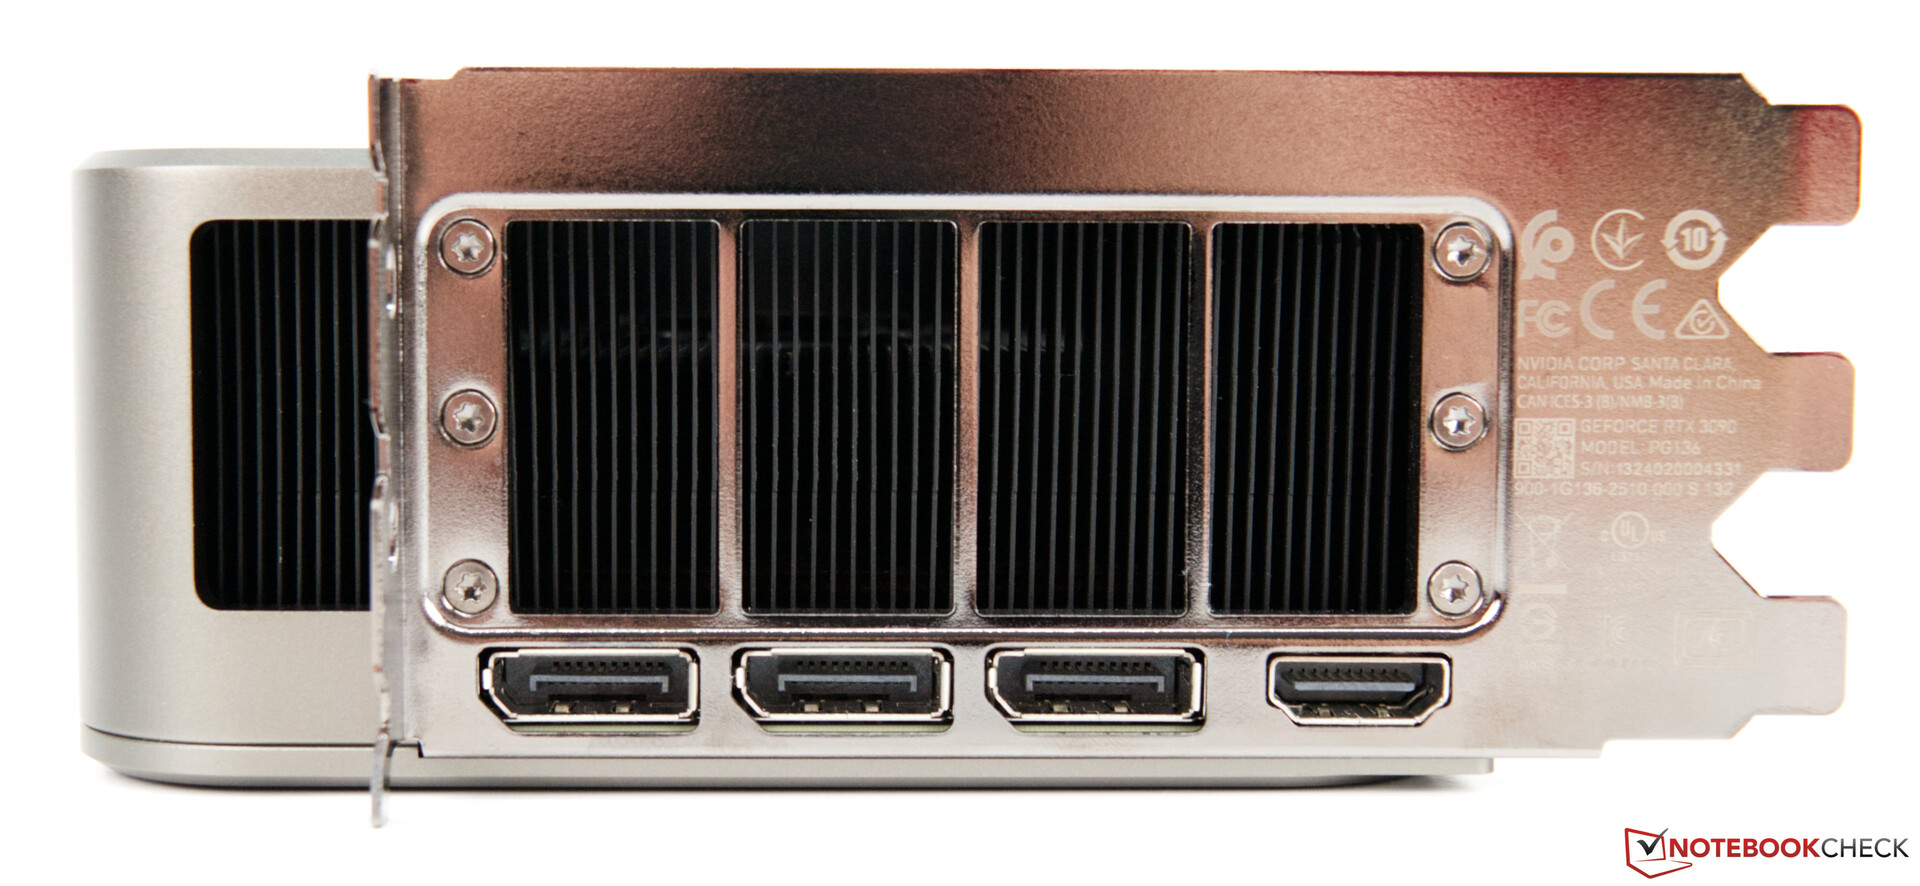
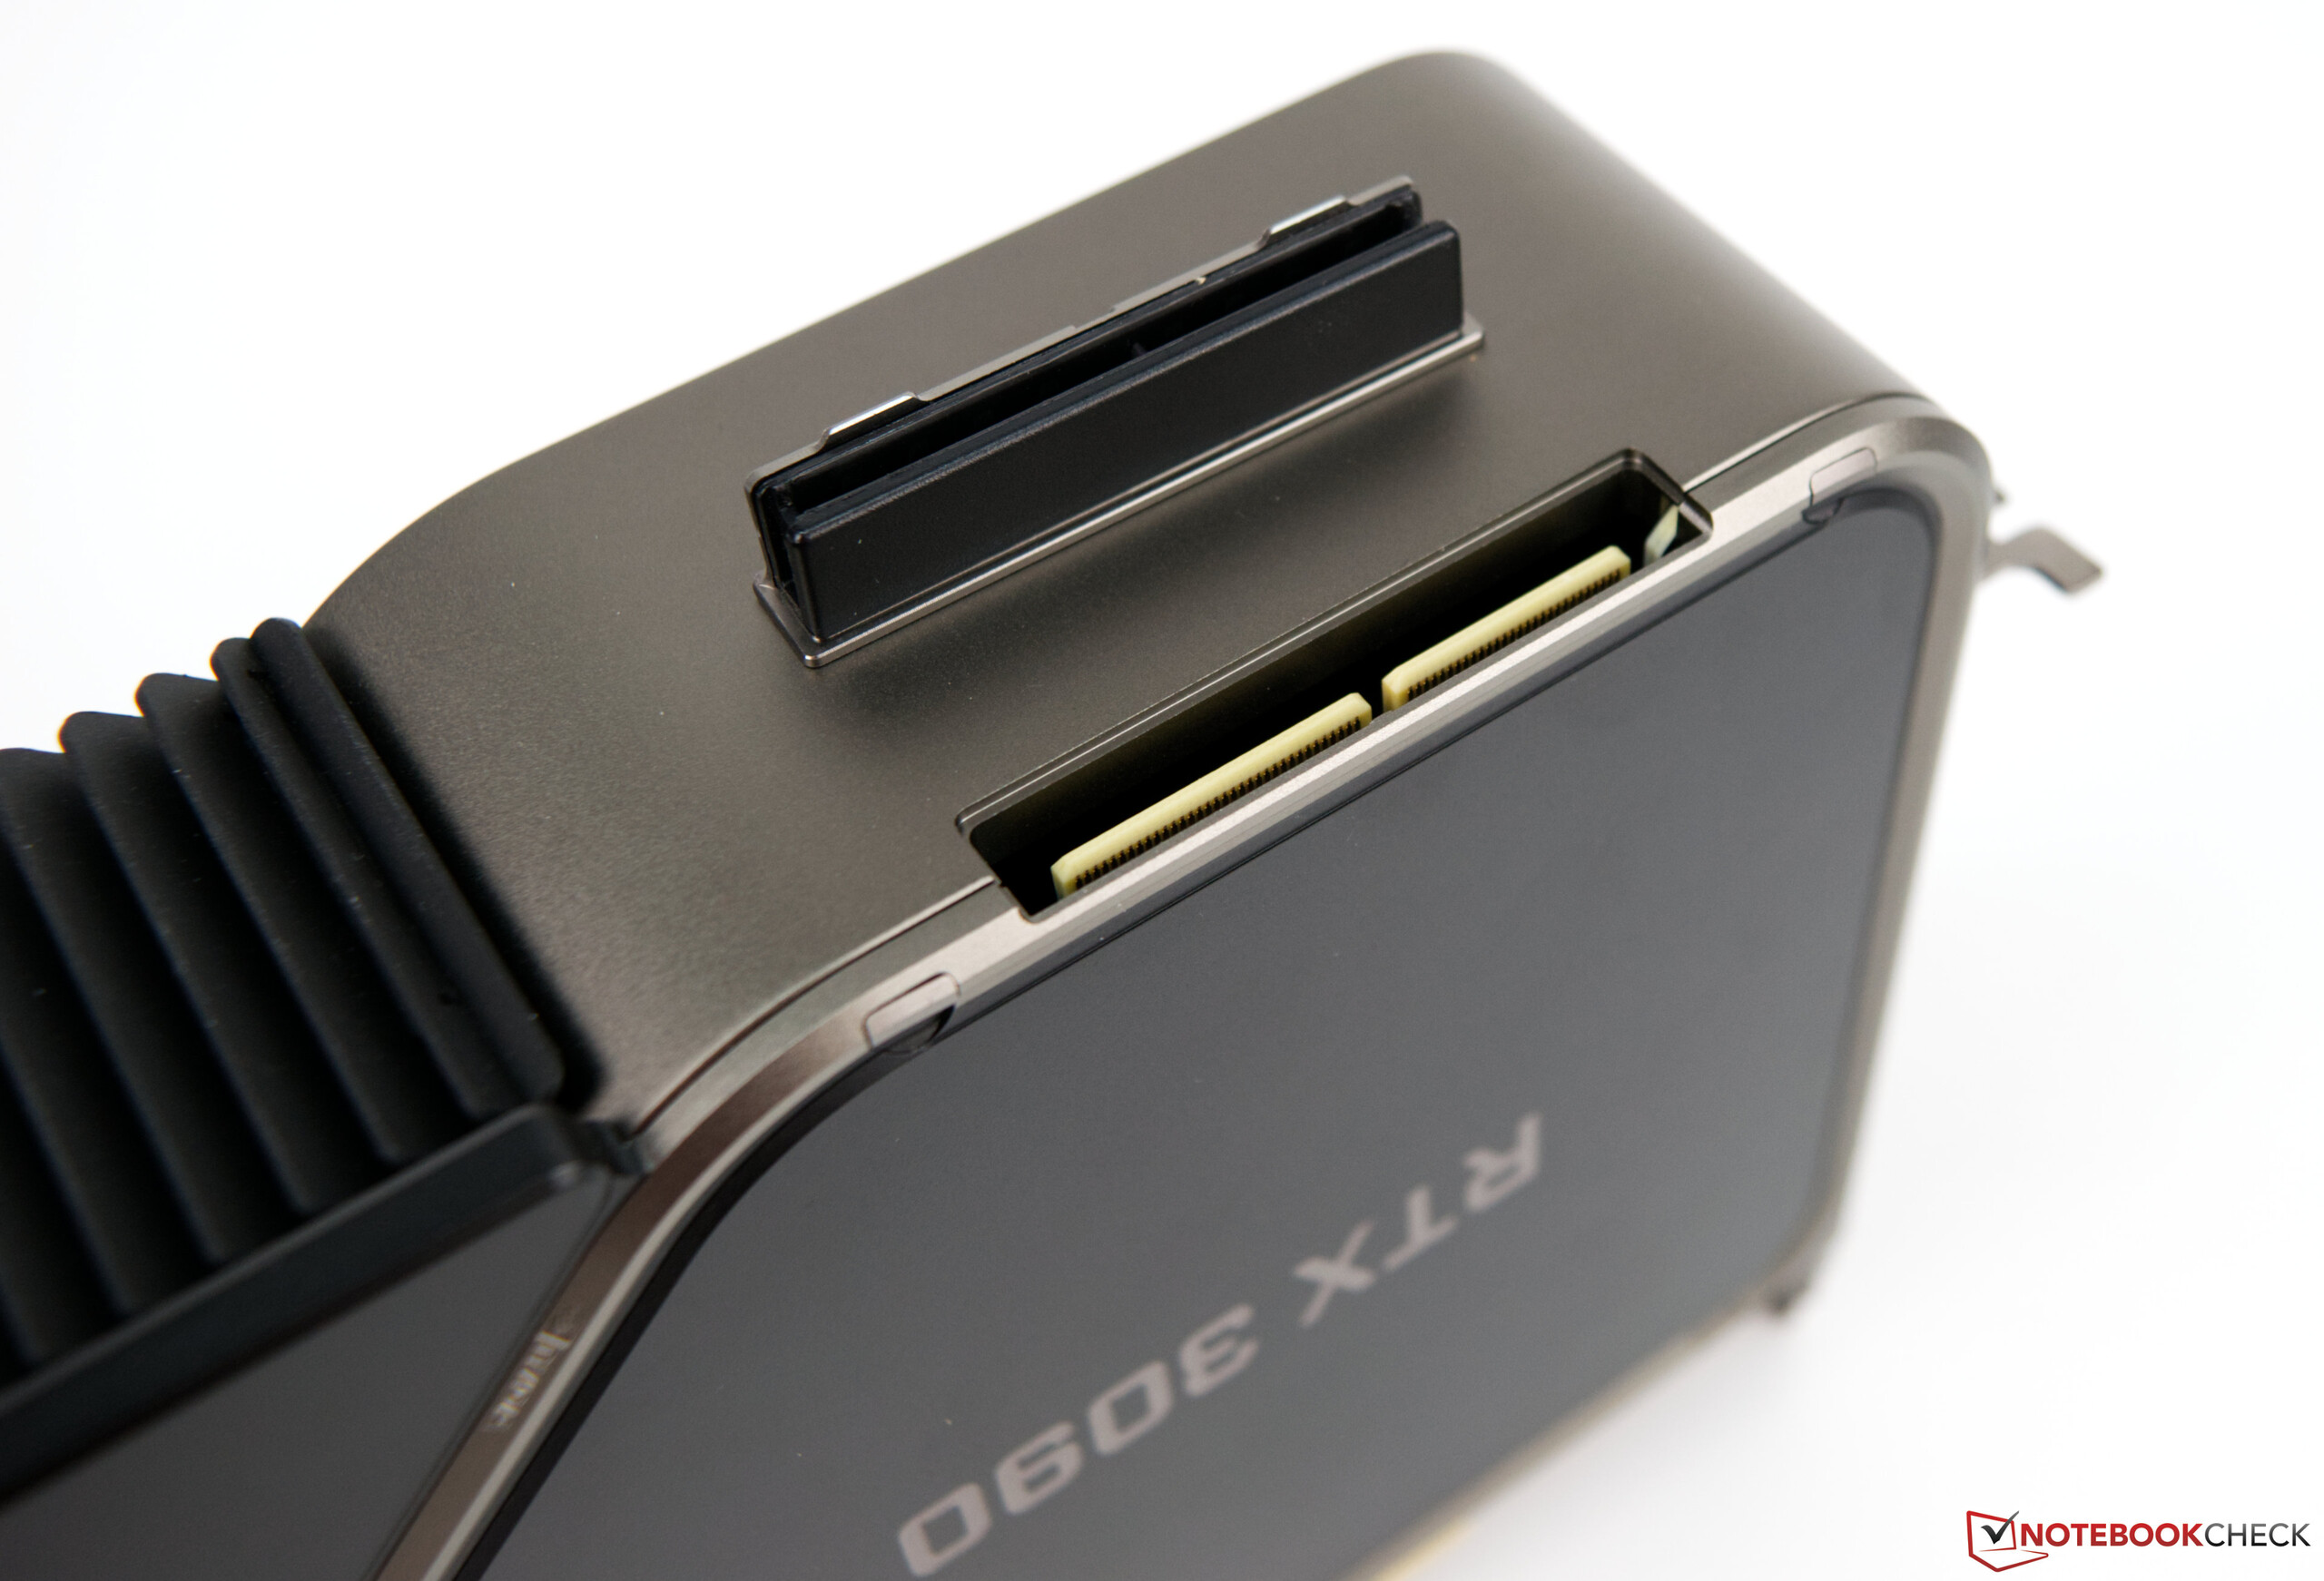
Externally, the Nvidia GeForce RTX 3090 Founders Edition offers 1x HDMI 2.1 and 3x DisplayPort 1.4a connections.
The specs of the GeForce graphics cards in comparison
| Specification | RTX 3090 (FE) | RTX 3080 FE | RTX 3070 FE | Titan RTX | TITAN X Pascal | RTX 2080 Ti | RTX 2080 |
| Chip | GA102 | GA102 | GA104 | TU102 | GP102 | TU102 | TU104 |
| FinFET process | 8 nm | 8 nm | 8 nm | 12 nm | 16 nm | 12 nm | 12 nm |
| CUDA cores | 10,496 | 8,704 | 5,888 | 4,608 | 3,584 | 4,352 | 2,944 |
| Texture units | 328 | 272 | 184 | 288 | 224 | 272 | 184 |
| Tensor cores | 328 3rd Gen | 272 3rd Gen | 184 3rd Gen | 576 2nd Gen | - | 544 2nd Gen | 368 2nd Gen |
| RT cores | 82 | 68 | 46 | 72 | - | 68 | 46 |
| GPU base clock | 1,395 MHz | 1,440 MHz | 1,500 MHz | 1,350 MHz | 1,417 MHz | 1,350 MHz | 1,515 MHz |
| GPU boost clock | 1,695 MHz | 1,710 MHz | 1,750 MHz | 1,770 MHz | 1,531 MHz | 1,545 MHz | 1,710 MHz |
| Memory bus | 384-bit | 320-bit | 256-bit | 384-bit | 384-bit | 352-bit | 256-bit |
| Memory bandwidth | 936 GB/s | 760 GB/s | 448 GB/s | 672 GB/s | 480.4 GB/s | 616 GB/s | 448 GB/s |
| Video memory | 24 GB GDDR6X | 10 GB GDDR6X | 8 GB GDDR6 | 24 GB GDDR6 | 12 GB GDDR5X | 11 GB GDDR6 | 8 GB GDDR6 |
| Power consumption | 350 W | 320 W | 220 W | 280 W | 250 W | 250 W | 215 W |
Our test system based on the AMD Ryzen 9 5900X
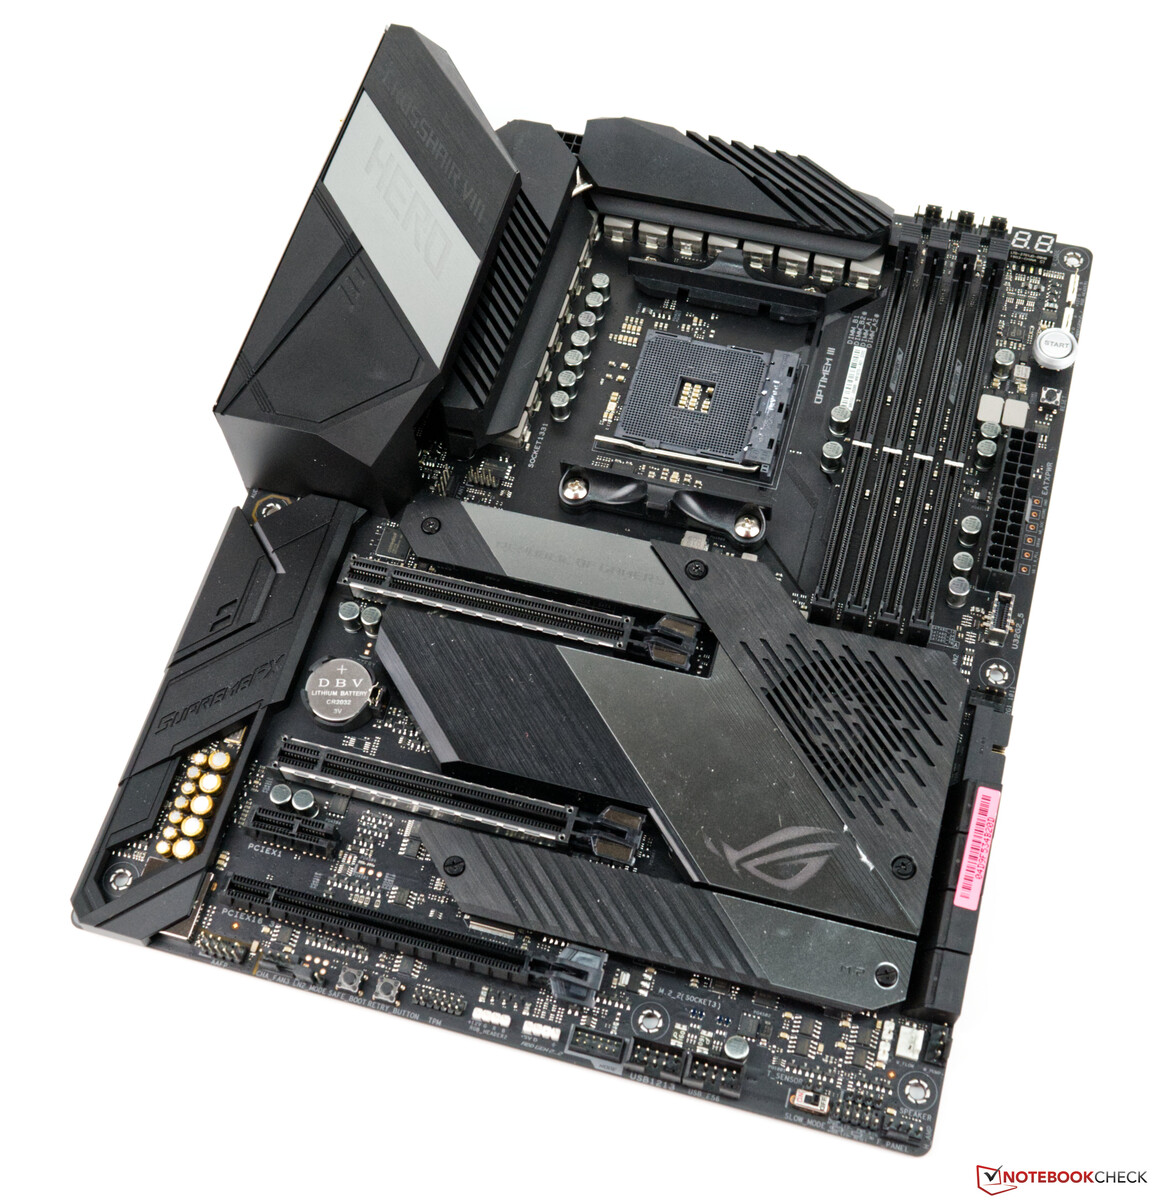
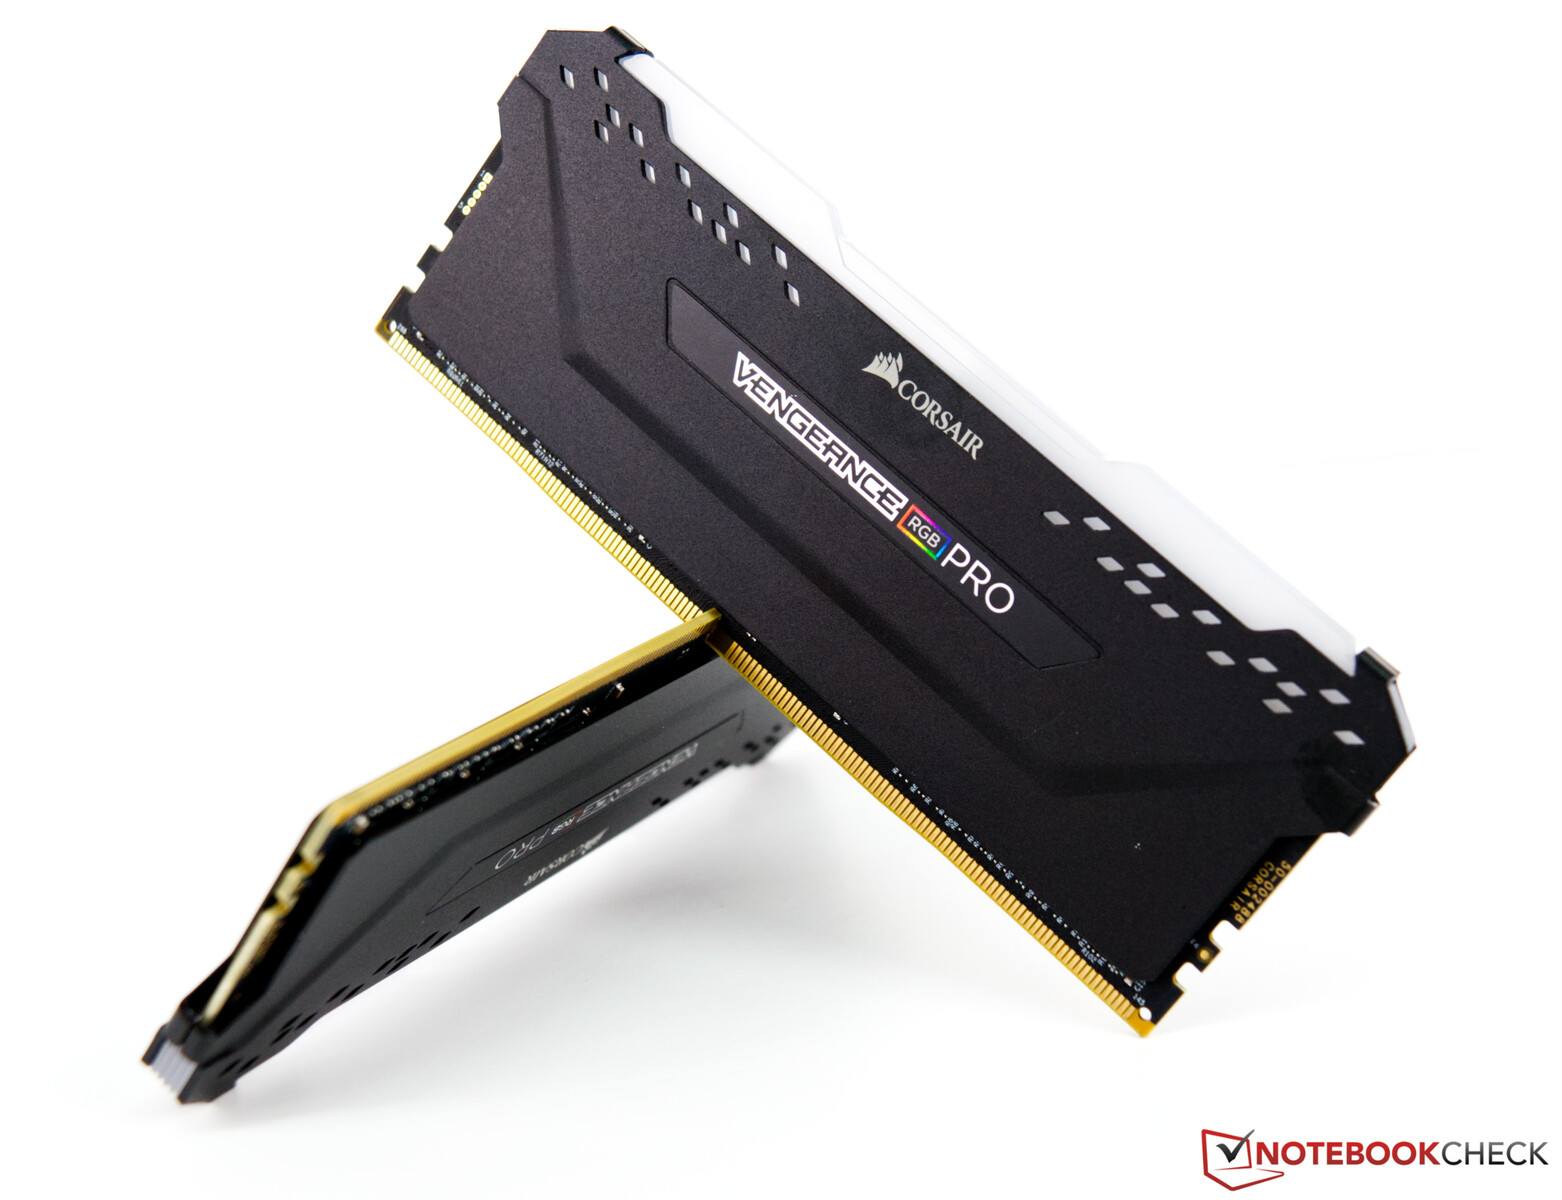
A current AMD platform based on the Asus X570 ROG Crosshair VIII Hero Wi-Fi serves as the test system. The CPU (AMD Ryzen 9 5900X) offers good CPU performance, and we use an AIO (Alphacool Eisbaer Aurora 360 mm) for cooling. The 32 GB of RAM comes from Corsair and clocks at 4,000 MHz. We use the Acer Predator XB321HK as a monitor. It doesn't limit us due to its UHD capability. At this point, we would like to thank AMD for providing the test platform as well as Corsair for the RAM kit.
For the upcoming benchmarks and tests, we use the following system:
- Lian Li O11 Dynamic
- AMD Ryzen 9 5900X
- Nvidia GeForce RTX 3090 FE (Nvidia 461.09)
- Asus X570 ROG Crosshair VIII Hero Wi-Fi (BIOS 2402, default settings, XMP 1 for DDR4-4000)
- Corsair RM1000X 1,000-watt power supply
- Corsair Vengeance RGB Pro DDR4-4000 2x 16 GB RAM kit
- Corsair MP600 2 TB M.2 PCIe 4.0 SSD
- Crucial MX500 2 TB (for games)
Synthetic benchmarks
In the synthetic tests, the Nvidia GeForce RTX 3090 FE shows a solid performance, although the AMD Radeon RX 6800 XT makes things a bit hard for Nvidia's flagship every now and then. In high resolutions with many details, the GeForce RTX 3090 can fully show its strengths as the Unigine Superposition test very well shows. However, our test sample loses the comparison with the MSI GeForce RTX 3090 Suprim X, which was to be expected as well due to the lower TDP. As a reminder, the MSI GeForce RTX 3090 Suprim X can consume up to 420 watts, which is 70 watts more than the Founders Edition that we are testing.
| 3DMark | |
| 1920x1080 Fire Strike Graphics | |
| AMD Radeon RX 6800 XT | |
| MSI GeForce RTX 3090 Suprim X | |
| Nvidia GeForce RTX 3090 Founders Edition | |
| MSI GeForce RTX 3080 Gaming X Trio | |
| AMD Ryzen 9 5900X | |
| MSI GeForce RTX 3070 Ventus 3X | |
| Fire Strike Extreme Graphics | |
| AMD Radeon RX 6800 XT | |
| MSI GeForce RTX 3090 Suprim X | |
| Nvidia GeForce RTX 3090 Founders Edition | |
| MSI GeForce RTX 3080 Gaming X Trio | |
| AMD Ryzen 9 5900X | |
| MSI GeForce RTX 3070 Ventus 3X | |
| 3840x2160 Fire Strike Ultra Graphics | |
| AMD Radeon RX 6800 XT | |
| MSI GeForce RTX 3090 Suprim X | |
| Nvidia GeForce RTX 3090 Founders Edition | |
| MSI GeForce RTX 3080 Gaming X Trio | |
| AMD Ryzen 9 5900X | |
| MSI GeForce RTX 3070 Ventus 3X | |
| 2560x1440 Time Spy Graphics | |
| MSI GeForce RTX 3090 Suprim X | |
| Nvidia GeForce RTX 3090 Founders Edition | |
| MSI GeForce RTX 3080 Gaming X Trio | |
| AMD Radeon RX 6800 XT | |
| AMD Ryzen 9 5900X | |
| MSI GeForce RTX 3070 Ventus 3X | |
| Unigine Superposition | |
| 1280x720 720p Low | |
| AMD Ryzen 9 5900X | |
| AMD Radeon RX 6800 XT | |
| Nvidia GeForce RTX 3090 Founders Edition | |
| MSI GeForce RTX 3070 Ventus 3X | |
| MSI GeForce RTX 3090 Suprim X | |
| MSI GeForce RTX 3080 Gaming X Trio | |
| 1920x1080 1080p High | |
| MSI GeForce RTX 3090 Suprim X | |
| Nvidia GeForce RTX 3090 Founders Edition | |
| AMD Radeon RX 6800 XT | |
| MSI GeForce RTX 3080 Gaming X Trio | |
| AMD Ryzen 9 5900X | |
| MSI GeForce RTX 3070 Ventus 3X | |
| 1920x1080 1080p Extreme | |
| MSI GeForce RTX 3090 Suprim X | |
| Nvidia GeForce RTX 3090 Founders Edition | |
| MSI GeForce RTX 3080 Gaming X Trio | |
| AMD Radeon RX 6800 XT | |
| AMD Ryzen 9 5900X | |
| MSI GeForce RTX 3070 Ventus 3X | |
| 3840x2160 4k Optimized | |
| MSI GeForce RTX 3090 Suprim X | |
| Nvidia GeForce RTX 3090 Founders Edition | |
| MSI GeForce RTX 3080 Gaming X Trio | |
| AMD Radeon RX 6800 XT | |
| AMD Ryzen 9 5900X | |
| MSI GeForce RTX 3070 Ventus 3X | |
| 7680x4320 8k Optimized | |
| MSI GeForce RTX 3090 Suprim X | |
| Nvidia GeForce RTX 3090 Founders Edition | |
| MSI GeForce RTX 3080 Gaming X Trio | |
| AMD Ryzen 9 5900X | |
| AMD Radeon RX 6800 XT | |
| MSI GeForce RTX 3070 Ventus 3X | |
| Unigine Heaven 4.0 | |
| Extreme Preset OpenGL | |
| MSI GeForce RTX 3090 Suprim X | |
| MSI GeForce RTX 3080 Gaming X Trio | |
| AMD Ryzen 9 5900X | |
| AMD Radeon RX 6800 XT | |
| MSI GeForce RTX 3070 Ventus 3X | |
| Nvidia GeForce RTX 3090 Founders Edition | |
| Extreme Preset DX11 | |
| MSI GeForce RTX 3090 Suprim X | |
| Nvidia GeForce RTX 3090 Founders Edition | |
| MSI GeForce RTX 3080 Gaming X Trio | |
| AMD Radeon RX 6800 XT | |
| AMD Ryzen 9 5900X | |
| MSI GeForce RTX 3070 Ventus 3X | |
| Unigine Valley 1.0 | |
| 1920x1080 Extreme HD DirectX AA:x8 | |
| MSI GeForce RTX 3090 Suprim X | |
| Nvidia GeForce RTX 3090 Founders Edition | |
| AMD Radeon RX 6800 XT | |
| MSI GeForce RTX 3080 Gaming X Trio | |
| AMD Ryzen 9 5900X | |
| MSI GeForce RTX 3070 Ventus 3X | |
| 1920x1080 Extreme HD Preset OpenGL AA:x8 | |
| MSI GeForce RTX 3090 Suprim X | |
| MSI GeForce RTX 3080 Gaming X Trio | |
| Nvidia GeForce RTX 3090 Founders Edition | |
| AMD Ryzen 9 5900X | |
| AMD Radeon RX 6800 XT | |
| MSI GeForce RTX 3070 Ventus 3X | |
| SiSoft Sandra 2016 | |
| GP Financial Analysis (FP High/Double Precision) | |
| AMD Radeon RX 6800 XT | |
| MSI GeForce RTX 3090 Suprim X | |
| Nvidia GeForce RTX 3090 Founders Edition | |
| MSI GeForce RTX 3080 Gaming X Trio | |
| MSI GeForce RTX 3070 Ventus 3X | |
| GP Cryptography (Higher Security AES256+SHA2-512) | |
| MSI GeForce RTX 3090 Suprim X | |
| Nvidia GeForce RTX 3090 Founders Edition | |
| MSI GeForce RTX 3080 Gaming X Trio | |
| AMD Radeon RX 6800 XT | |
| MSI GeForce RTX 3070 Ventus 3X | |
| Image Processing | |
| AMD Radeon RX 6800 XT | |
| MSI GeForce RTX 3090 Suprim X | |
| Nvidia GeForce RTX 3090 Founders Edition | |
| MSI GeForce RTX 3080 Gaming X Trio | |
| MSI GeForce RTX 3070 Ventus 3X | |
| LuxMark v2.0 64Bit | |
| Room GPUs-only | |
| Nvidia GeForce RTX 3090 Founders Edition | |
| MSI GeForce RTX 3090 Suprim X | |
| MSI GeForce RTX 3080 Gaming X Trio | |
| AMD Radeon RX 6800 XT | |
| MSI GeForce RTX 3070 Ventus 3X | |
| Sala GPUs-only | |
| AMD Radeon RX 6800 XT | |
| Nvidia GeForce RTX 3090 Founders Edition | |
| MSI GeForce RTX 3090 Suprim X | |
| MSI GeForce RTX 3080 Gaming X Trio | |
| MSI GeForce RTX 3070 Ventus 3X | |
Gaming benchmarks

The GeForce RTX 3090 is an extremely fast graphics card that is perfectly suited for 4K gaming. Nevertheless, users of the Founders Edition have to make do with a slightly weaker performance. The partner cards, which often offer a higher TDP, deliver slightly higher frames per second. However, games don't run noticeably faster. If we only look at the results of the Full HD benchmarks, the duel against the AMD Radeon RX 6800 XT doesn't definitely end in Nvidia's favor. The AMD Radeon RX 6800 XT can often place itself in front of the GeForce RTX 3090 FE. An AMD Radeon RX 6900 XT should even increase the lead here. However, we haven't had the chance to examine a sample of the Radeon RX 6900 XT so far, so that we can't provide benchmark results here. Only at higher resolutions does the GeForce RTX 3090 manage to set itself apart. AMD can no longer keep up here. Furthermore, Nvidia offers great features with DLSS and ray tracing, which are being used increasingly in many games. Meanwhile, AMD has also included RT cores in its RX 6800 GPUs, but they can't keep up with the current Ampere generation in terms of technical performance.
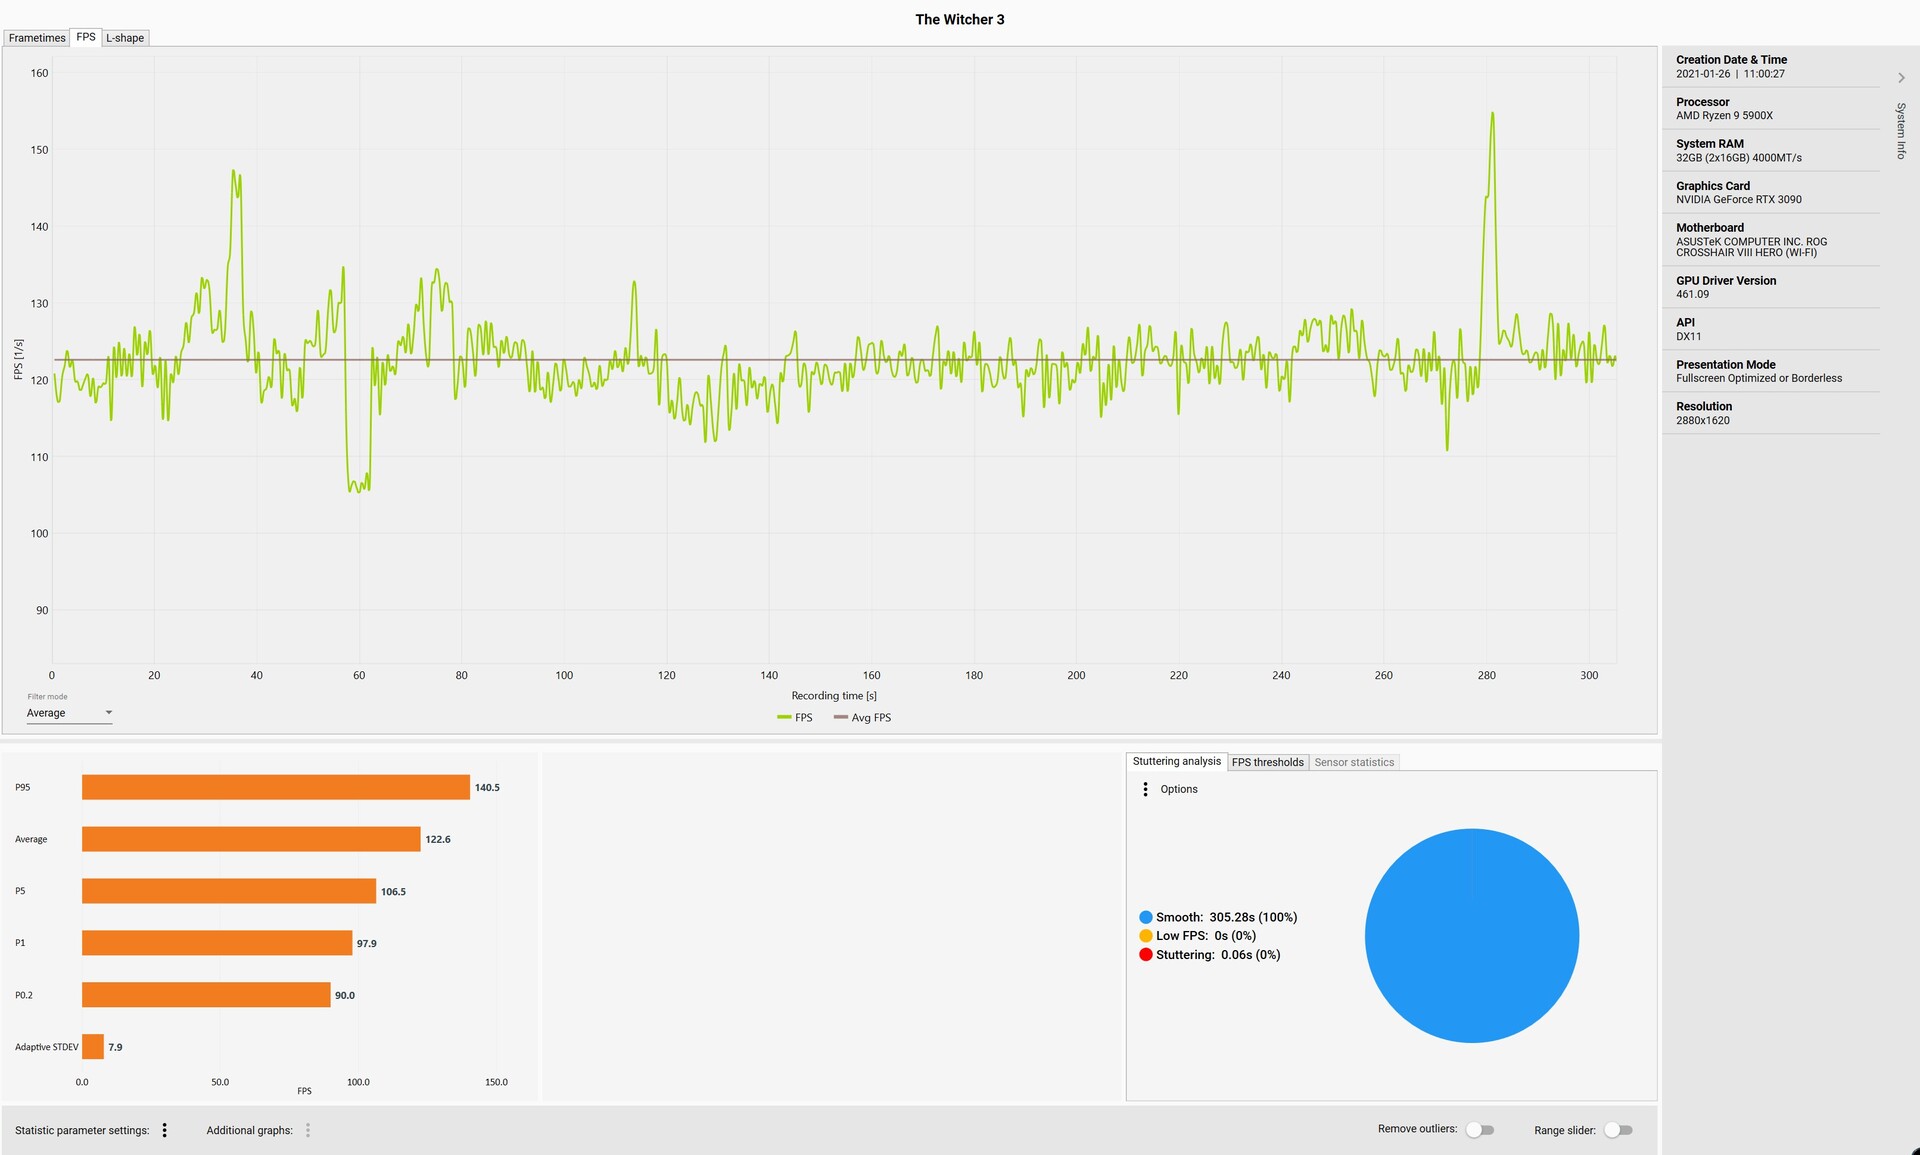
We use the game The Witcher 3 (Ultra preset, 1080p) to measure the frame times and frame rates. The game still scales very well with current graphics cards despite its age. We recorded a few outliers in the frame times, which are also visible in the frame rates. We could not determine a lasting impact on the game's performance.
| The Witcher 3 | |
| 1920x1080 Ultra Graphics & Postprocessing (HBAO+) | |
| NVIDIA GeForce RTX 3090, AMD Ryzen 9 5900X | |
| AMD Radeon RX 6800 XT, AMD Ryzen 9 5950X | |
| NVIDIA GeForce RTX 3080, AMD Ryzen 9 5900X | |
| NVIDIA Titan RTX, AMD Ryzen 9 5900X | |
| NVIDIA Titan RTX, AMD Ryzen 9 3900X | |
| NVIDIA GeForce RTX 3070, AMD Ryzen 9 5900X | |
| 3840x2160 High Graphics & Postprocessing (Nvidia HairWorks Off) | |
| NVIDIA GeForce RTX 3090, AMD Ryzen 9 5900X | |
| NVIDIA GeForce RTX 3080, AMD Ryzen 9 5900X | |
| AMD Radeon RX 6800 XT, AMD Ryzen 9 5950X | |
| NVIDIA Titan RTX, AMD Ryzen 9 5900X | |
| NVIDIA Titan RTX, AMD Ryzen 9 3900X | |
| NVIDIA GeForce RTX 3070, AMD Ryzen 9 5900X | |
| Far Cry 5 | |
| 1920x1080 Ultra Preset AA:T | |
| NVIDIA Titan RTX, AMD Ryzen 9 5900X | |
| NVIDIA GeForce RTX 3070, AMD Ryzen 9 5900X | |
| NVIDIA GeForce RTX 3090, AMD Ryzen 9 5900X | |
| NVIDIA GeForce RTX 3080, AMD Ryzen 9 5900X | |
| AMD Radeon RX 6800 XT, AMD Ryzen 9 5950X | |
| NVIDIA Titan RTX, AMD Ryzen 9 3900X | |
| 3840x2160 Ultra Preset AA:T | |
| NVIDIA GeForce RTX 3090, AMD Ryzen 9 5900X | |
| AMD Radeon RX 6800 XT, AMD Ryzen 9 5950X | |
| NVIDIA GeForce RTX 3080, AMD Ryzen 9 5900X | |
| NVIDIA Titan RTX, AMD Ryzen 9 5900X | |
| NVIDIA Titan RTX, AMD Ryzen 9 3900X | |
| NVIDIA GeForce RTX 3070, AMD Ryzen 9 5900X | |
| Far Cry New Dawn | |
| 1920x1080 Ultra Preset | |
| NVIDIA Titan RTX, AMD Ryzen 9 5900X | |
| NVIDIA GeForce RTX 3070, AMD Ryzen 9 5900X | |
| AMD Radeon RX 6800 XT, AMD Ryzen 9 5950X | |
| NVIDIA GeForce RTX 3090, AMD Ryzen 9 5900X | |
| NVIDIA GeForce RTX 3080, AMD Ryzen 9 5900X | |
| NVIDIA Titan RTX, AMD Ryzen 9 3900X | |
| 3840x2160 Ultra Preset | |
| NVIDIA GeForce RTX 3090, AMD Ryzen 9 5900X | |
| AMD Radeon RX 6800 XT, AMD Ryzen 9 5950X | |
| NVIDIA GeForce RTX 3080, AMD Ryzen 9 5900X | |
| NVIDIA Titan RTX, AMD Ryzen 9 5900X | |
| NVIDIA Titan RTX, AMD Ryzen 9 3900X | |
| NVIDIA GeForce RTX 3070, AMD Ryzen 9 5900X | |
| Anno 1800 | |
| 1920x1080 Ultra Graphics Quality (DX11) | |
| NVIDIA GeForce RTX 3090, AMD Ryzen 9 5900X | |
| NVIDIA GeForce RTX 3080, AMD Ryzen 9 5900X | |
| NVIDIA GeForce RTX 3070, AMD Ryzen 9 5900X | |
| AMD Radeon RX 6800 XT, AMD Ryzen 9 5950X | |
| 3840x2160 Ultra Graphics Quality (DX11) | |
| NVIDIA GeForce RTX 3090, AMD Ryzen 9 5900X | |
| AMD Radeon RX 6800 XT, AMD Ryzen 9 5950X | |
| NVIDIA GeForce RTX 3080, AMD Ryzen 9 5900X | |
| NVIDIA GeForce RTX 3070, AMD Ryzen 9 5900X | |
| Crysis Remastered | |
| 1920x1080 Very High Preset AA:SM | |
| NVIDIA Titan RTX, AMD Ryzen 9 5900X | |
| NVIDIA GeForce RTX 3090, AMD Ryzen 9 5900X | |
| AMD Radeon RX 6800 XT, AMD Ryzen 9 5950X | |
| NVIDIA GeForce RTX 3070, AMD Ryzen 9 5900X | |
| NVIDIA GeForce RTX 3080, AMD Ryzen 9 5900X | |
| 3840x2160 Very High Preset AA:SM | |
| NVIDIA GeForce RTX 3090, AMD Ryzen 9 5900X | |
| AMD Radeon RX 6800 XT, AMD Ryzen 9 5950X | |
| NVIDIA GeForce RTX 3080, AMD Ryzen 9 5900X | |
| NVIDIA Titan RTX, AMD Ryzen 9 5900X | |
| NVIDIA GeForce RTX 3070, AMD Ryzen 9 5900X | |
| Dirt 5 | |
| 1920x1080 Ultra High Preset | |
| NVIDIA GeForce RTX 3090, AMD Ryzen 9 5900X | |
| AMD Radeon RX 6800 XT, AMD Ryzen 9 5950X | |
| NVIDIA GeForce RTX 3080, AMD Ryzen 9 5900X | |
| NVIDIA Titan RTX, AMD Ryzen 9 5900X | |
| NVIDIA GeForce RTX 3070, AMD Ryzen 9 5900X | |
| 3840x2160 Ultra High Preset | |
| NVIDIA GeForce RTX 3090, AMD Ryzen 9 5900X | |
| AMD Radeon RX 6800 XT, AMD Ryzen 9 5950X | |
| NVIDIA GeForce RTX 3080, AMD Ryzen 9 5900X | |
| NVIDIA Titan RTX, AMD Ryzen 9 5900X | |
| NVIDIA GeForce RTX 3070, AMD Ryzen 9 5900X | |
| Call of Duty Black Ops Cold War | |
| 1920x1080 Highest Settings | |
| NVIDIA GeForce RTX 3090, AMD Ryzen 9 5900X | |
| NVIDIA Titan RTX, AMD Ryzen 9 5900X | |
| AMD Radeon RX 6800 XT, AMD Ryzen 9 5950X | |
| NVIDIA GeForce RTX 3080, AMD Ryzen 9 5900X | |
| NVIDIA GeForce RTX 3070, AMD Ryzen 9 5900X | |
| 3840x2160 Highest Settings | |
| NVIDIA GeForce RTX 3090, AMD Ryzen 9 5900X | |
| NVIDIA GeForce RTX 3080, AMD Ryzen 9 5900X | |
| AMD Radeon RX 6800 XT, AMD Ryzen 9 5950X | |
| NVIDIA Titan RTX, AMD Ryzen 9 5900X | |
| NVIDIA GeForce RTX 3070, AMD Ryzen 9 5900X | |
| F1 2020 | |
| 1920x1080 Ultra High Preset AA:T AF:16x | |
| AMD Radeon RX 6800 XT, AMD Ryzen 9 5950X | |
| NVIDIA GeForce RTX 3090, AMD Ryzen 9 5900X | |
| NVIDIA Titan RTX, AMD Ryzen 9 3900X | |
| NVIDIA GeForce RTX 3070, AMD Ryzen 9 5900X | |
| NVIDIA GeForce RTX 3080, AMD Ryzen 9 5900X | |
| 3840x2160 Ultra High Preset AA:T AF:16x | |
| NVIDIA GeForce RTX 3090, AMD Ryzen 9 5900X | |
| AMD Radeon RX 6800 XT, AMD Ryzen 9 5950X | |
| NVIDIA GeForce RTX 3080, AMD Ryzen 9 5900X | |
| NVIDIA Titan RTX, AMD Ryzen 9 3900X | |
| NVIDIA GeForce RTX 3070, AMD Ryzen 9 5900X | |
| Death Stranding | |
| 1920x1080 Very High Preset | |
| AMD Radeon RX 6800 XT, AMD Ryzen 9 5950X | |
| NVIDIA GeForce RTX 3080, AMD Ryzen 9 5900X | |
| NVIDIA GeForce RTX 3090, AMD Ryzen 9 5900X | |
| NVIDIA GeForce RTX 3070, AMD Ryzen 9 5900X | |
| NVIDIA Titan RTX, AMD Ryzen 9 3900X | |
| 3840x2160 Very High Preset | |
| NVIDIA GeForce RTX 3090, AMD Ryzen 9 5900X | |
| NVIDIA GeForce RTX 3080, AMD Ryzen 9 5900X | |
| AMD Radeon RX 6800 XT, AMD Ryzen 9 5950X | |
| NVIDIA GeForce RTX 3070, AMD Ryzen 9 5900X | |
| NVIDIA Titan RTX, AMD Ryzen 9 3900X | |
| Mafia Definitive Edition | |
| 1920x1080 High Preset | |
| NVIDIA GeForce RTX 3090, AMD Ryzen 9 5900X | |
| NVIDIA GeForce RTX 3080, AMD Ryzen 9 5900X | |
| NVIDIA GeForce RTX 3070, AMD Ryzen 9 5900X | |
| NVIDIA Titan RTX, AMD Ryzen 9 3900X | |
| AMD Radeon RX 6800 XT, AMD Ryzen 9 5950X | |
| 3840x2160 High Preset | |
| NVIDIA GeForce RTX 3090, AMD Ryzen 9 5900X | |
| NVIDIA GeForce RTX 3080, AMD Ryzen 9 5900X | |
| NVIDIA Titan RTX, AMD Ryzen 9 3900X | |
| AMD Radeon RX 6800 XT, AMD Ryzen 9 5950X | |
| NVIDIA GeForce RTX 3070, AMD Ryzen 9 5900X | |
| Watch Dogs Legion | |
| 1920x1080 Ultra Preset (DX12) | |
| AMD Radeon RX 6800 XT, AMD Ryzen 9 5950X | |
| NVIDIA GeForce RTX 3090, AMD Ryzen 9 5900X | |
| NVIDIA GeForce RTX 3080, AMD Ryzen 9 5900X | |
| NVIDIA GeForce RTX 3070, AMD Ryzen 9 5900X | |
| NVIDIA Titan RTX, AMD Ryzen 9 3900X | |
| 3840x2160 Ultra Preset (DX12) | |
| NVIDIA GeForce RTX 3090, AMD Ryzen 9 5900X | |
| NVIDIA GeForce RTX 3080, AMD Ryzen 9 5900X | |
| AMD Radeon RX 6800 XT, AMD Ryzen 9 5950X | |
| NVIDIA Titan RTX, AMD Ryzen 9 3900X | |
| NVIDIA GeForce RTX 3070, AMD Ryzen 9 5900X | |
| Horizon Zero Dawn | |
| 1920x1080 Ultimate Quality | |
| AMD Radeon RX 6800 XT, AMD Ryzen 9 5950X | |
| NVIDIA GeForce RTX 3090, AMD Ryzen 9 5900X | |
| NVIDIA GeForce RTX 3080, AMD Ryzen 9 5900X | |
| NVIDIA GeForce RTX 3070, AMD Ryzen 9 5900X | |
| NVIDIA Titan RTX, AMD Ryzen 9 3900X | |
| 3840x2160 Ultimate Quality | |
| AMD Radeon RX 6800 XT, AMD Ryzen 9 5950X | |
| NVIDIA GeForce RTX 3090, AMD Ryzen 9 5900X | |
| NVIDIA GeForce RTX 3080, AMD Ryzen 9 5900X | |
| NVIDIA GeForce RTX 3070, AMD Ryzen 9 5900X | |
| NVIDIA Titan RTX, AMD Ryzen 9 3900X | |
| Shadow of the Tomb Raider | |
| 1920x1080 Highest Preset AA:T | |
| AMD Radeon RX 6800 XT, AMD Ryzen 9 5950X | |
| NVIDIA GeForce RTX 3090, AMD Ryzen 9 5900X | |
| NVIDIA GeForce RTX 3080, AMD Ryzen 9 5900X | |
| NVIDIA Titan RTX, AMD Ryzen 9 5900X | |
| NVIDIA GeForce RTX 3070, AMD Ryzen 9 5900X | |
| NVIDIA Titan RTX, AMD Ryzen 9 3900X | |
| 3840x2160 Highest Preset AA:T | |
| NVIDIA GeForce RTX 3090, AMD Ryzen 9 5900X | |
| NVIDIA GeForce RTX 3080, AMD Ryzen 9 5900X | |
| AMD Radeon RX 6800 XT, AMD Ryzen 9 5950X | |
| NVIDIA Titan RTX, AMD Ryzen 9 5900X | |
| NVIDIA Titan RTX, AMD Ryzen 9 3900X | |
| NVIDIA GeForce RTX 3070, AMD Ryzen 9 5900X | |
| Yakuza Like a Dragon | |
| 1920x1080 Ultra Preset | |
| AMD Radeon RX 6800 XT, AMD Ryzen 9 5950X | |
| NVIDIA GeForce RTX 3090, AMD Ryzen 9 5900X | |
| NVIDIA Titan RTX, AMD Ryzen 9 5900X | |
| NVIDIA GeForce RTX 3070, AMD Ryzen 9 5900X | |
| NVIDIA GeForce RTX 3080, AMD Ryzen 9 5900X | |
| 3840x2160 Ultra Preset | |
| NVIDIA GeForce RTX 3090, AMD Ryzen 9 5900X | |
| NVIDIA GeForce RTX 3080, AMD Ryzen 9 5900X | |
| AMD Radeon RX 6800 XT, AMD Ryzen 9 5950X | |
| NVIDIA Titan RTX, AMD Ryzen 9 5900X | |
| NVIDIA GeForce RTX 3070, AMD Ryzen 9 5900X | |
| low | med. | high | ultra | QHD | 4K | |
|---|---|---|---|---|---|---|
| GTA V (2015) | 180 | 174 | 168 | 105 | 100 | 151 |
| The Witcher 3 (2015) | 437.6 | 418.7 | 338.6 | 171.5 | 148 | |
| Dota 2 Reborn (2015) | 149.1 | 139.2 | 138.4 | 134.3 | 138.6 | |
| Rise of the Tomb Raider (2016) | 391.3 | 283.6 | 269.7 | 253.7 | 128.1 | |
| Final Fantasy XV Benchmark (2018) | 211 | 190 | 153 | 128 | 81.5 | |
| X-Plane 11.11 (2018) | 157 | 137 | 111 | 92.8 | ||
| Far Cry 5 (2018) | 186 | 162 | 155 | 142 | 139 | 105 |
| Strange Brigade (2018) | 402 | 342 | 330 | 315 | 244 | 150 |
| Shadow of the Tomb Raider (2018) | 206 | 194 | 199 | 187 | 159 | 94 |
| Battlefield V (2018) | 179.4 | 172.3 | 157.6 | 145.8 | 129.5 | 95.8 |
| Apex Legends (2019) | 144 | 144 | 144 | 144 | 144 | 142.3 |
| Far Cry New Dawn (2019) | 148 | 128 | 123 | 112 | 110 | 97 |
| Metro Exodus (2019) | 201 | 168 | 146 | 124 | 106 | 70.6 |
| The Division 2 (2019) | 249 | 210 | 177 | 152 | 121 | 72 |
| Anno 1800 (2019) | 179 | 155 | 103.5 | 54.5 | 53.5 | 51.3 |
| Control (2019) | 239.2 | 217 | 172.2 | 115.8 | 61.3 | |
| Borderlands 3 (2019) | 172 | 142 | 126 | 119 | 105 | 68 |
| Star Wars Jedi Fallen Order (2019) | 129.9 | 129.6 | 129.2 | 127.4 | 124.4 | |
| Red Dead Redemption 2 (2019) | 167.9 | 171.7 | 153.2 | 109.9 | 92.3 | 63.5 |
| Hunt Showdown (2020) | 239 | 206.5 | 192 | 184.4 | 112.8 | |
| Doom Eternal (2020) | 449.3 | 398.6 | 365.8 | 359.9 | 304.5 | 192.6 |
| F1 2020 (2020) | 379 | 320 | 316 | 250 | 207 | 135 |
| Death Stranding (2020) | 206.1 | 193.2 | 188.6 | 188.1 | 140.9 | 131 |
| Horizon Zero Dawn (2020) | 206 | 191 | 175 | 159 | 141 | 89 |
| Crysis Remastered (2020) | 233.3 | 222.4 | 220.6 | 97.1 | 82.6 | 60.5 |
| Serious Sam 4 (2020) | 175.1 | 130.4 | 121.4 | 115.2 | 113.5 | 97.4 |
| Mafia Definitive Edition (2020) | 188.4 | 163.6 | 158.8 | 142.3 | 84.5 | |
| Star Wars Squadrons (2020) | 448 | 412.3 | 397.8 | 384.2 | 297.2 | 188.3 |
| FIFA 21 (2020) | 212 | 206.5 | 202.4 | 199.9 | 199.9 | 203.3 |
| Watch Dogs Legion (2020) | 132 | 131 | 120 | 107 | 88.3 | 57.6 |
| Dirt 5 (2020) | 250.2 | 197 | 178.5 | 159.5 | 131.1 | 91.4 |
| Assassin´s Creed Valhalla (2020) | 138 | 114 | 105 | 91 | 79 | 57 |
| Call of Duty Black Ops Cold War (2020) | 264 | 231.2 | 195.4 | 161.1 | 124.7 | 74.6 |
| Yakuza Like a Dragon (2020) | 121.2 | 120 | 118.3 | 115 | 113.2 | 78.2 |
| Immortals Fenyx Rising (2020) | 164 | 144 | 138 | 130 | 114 | 83 |
| Cyberpunk 2077 1.0 (2020) | 143.1 | 138.6 | 124.1 | 109.7 | 78.1 | 41.5 |
| Hitman 3 (2021) | 267 | 224 | 223 | 223 | 190 | 115 |
| Outriders (2021) | 120 | 137 | 166 | 168 | 150 | 85.7 |
| Resident Evil Village (2021) | 305 | 304 | 304 | 285 | 213 | 116 |
| Mass Effect Legendary Edition (2021) | 117 | 112 | 107 | 109 | ||
| Days Gone (2021) | 180 | 177 | 175 | 164 | 133 | 81.2 |
| Monster Hunter Stories 2 (2021) | 144 | 144 | 144 | 144 | 144 | |
| F1 2021 (2021) | 433 | 408 | 340 | 192 | 165 | 102 |
| Deathloop (2021) | 122 | 119 | 120 | 116 | 107 | 64.2 |
| New World (2021) | 199 | 149 | 138 | 75.3 | 124 | |
| Alan Wake Remastered (2021) | 94 | 89.1 | 88.9 | 89.4 | ||
| Far Cry 6 (2021) | 142 | 130 | 116 | 113 | 107 | 78.3 |
| Back 4 Blood (2021) | 305 | 294 | 285 | 231 | 131 | |
| Guardians of the Galaxy (2021) | 134 | 135 | 136 | 134 | 133 | 106 |
| Riders Republic (2021) | 221 | 203 | 175 | 166 | 130 | 80 |
| Call of Duty Vanguard (2021) | 116 | 172 | 179 | 166 | 129 | 82 |
| Forza Horizon 5 (2021) | 255 | 174 | 159 | 111 | 100 | 77 |
| Battlefield 2042 (2021) | 105 | 145 | 138 | 129 | 119 | 81.7 |
| Farming Simulator 22 (2021) | 270 | 219 | 190 | 168 | 169 | 145 |
| Halo Infinite (2021) | 165 | 142 | 144 | 110 | 73.6 | |
| God of War (2022) | 187 | 180 | 157 | 115 | 96.9 | 67.8 |
| Rainbow Six Extraction (2022) | 360 | 286 | 278 | 241 | 175 | 99 |
| Dying Light 2 (2022) | 209 | 150 | 131 | 98.7 | 57.3 | |
| GRID Legends (2022) | 214.9 | 194.1 | 179.6 | 153.9 | 132.7 | 101.4 |
| Elden Ring (2022) | 59.8 | 59.9 | 59.9 | 59.9 | 59.9 | 59.9 |
| Cyberpunk 2077 1.6 (2022) | 79.1 | 78.8 | 78.6 | 78.6 | 78 | 43.9 |
| Ghostwire Tokyo (2022) | 221 | 221 | 219 | 218 | 179.2 | 102.6 |
| Tiny Tina's Wonderlands (2022) | 293 | 247 | 192.5 | 159.4 | 125.4 | 71.4 |
| Vampire Bloodhunt (2022) | 386 | 309 | 302 | 299 | 233 | 129 |
Emissions of the Nvidia GeForce RTX 3090 FE
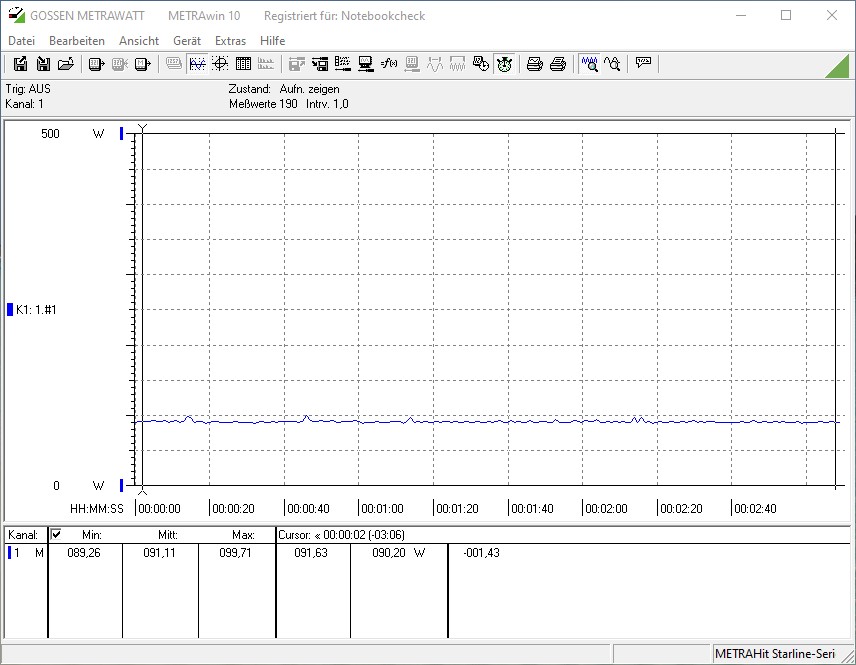
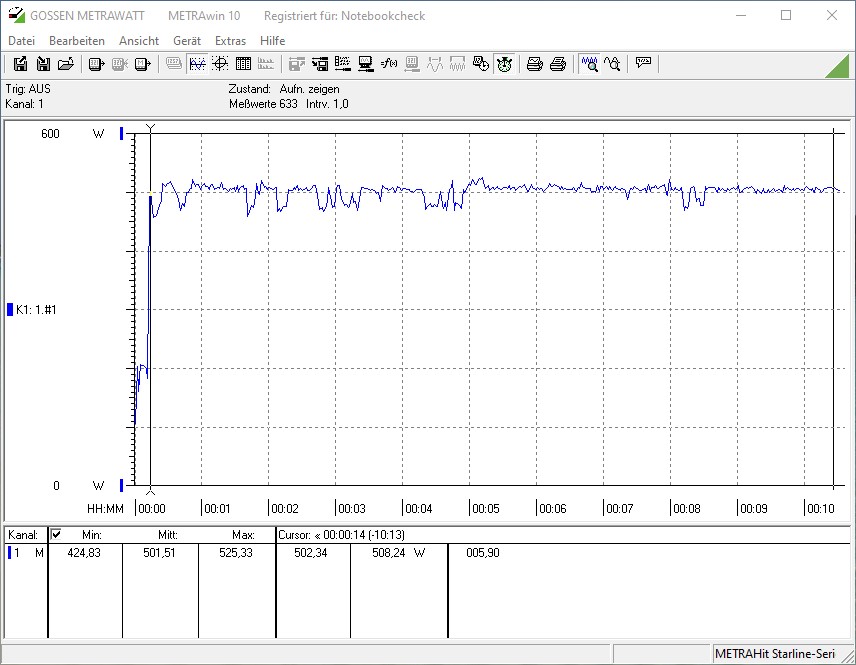
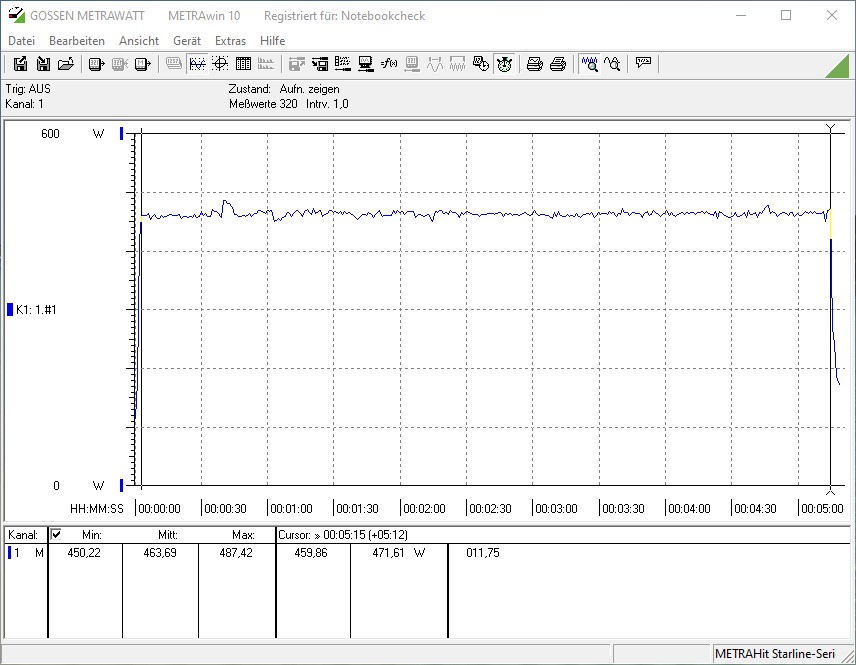
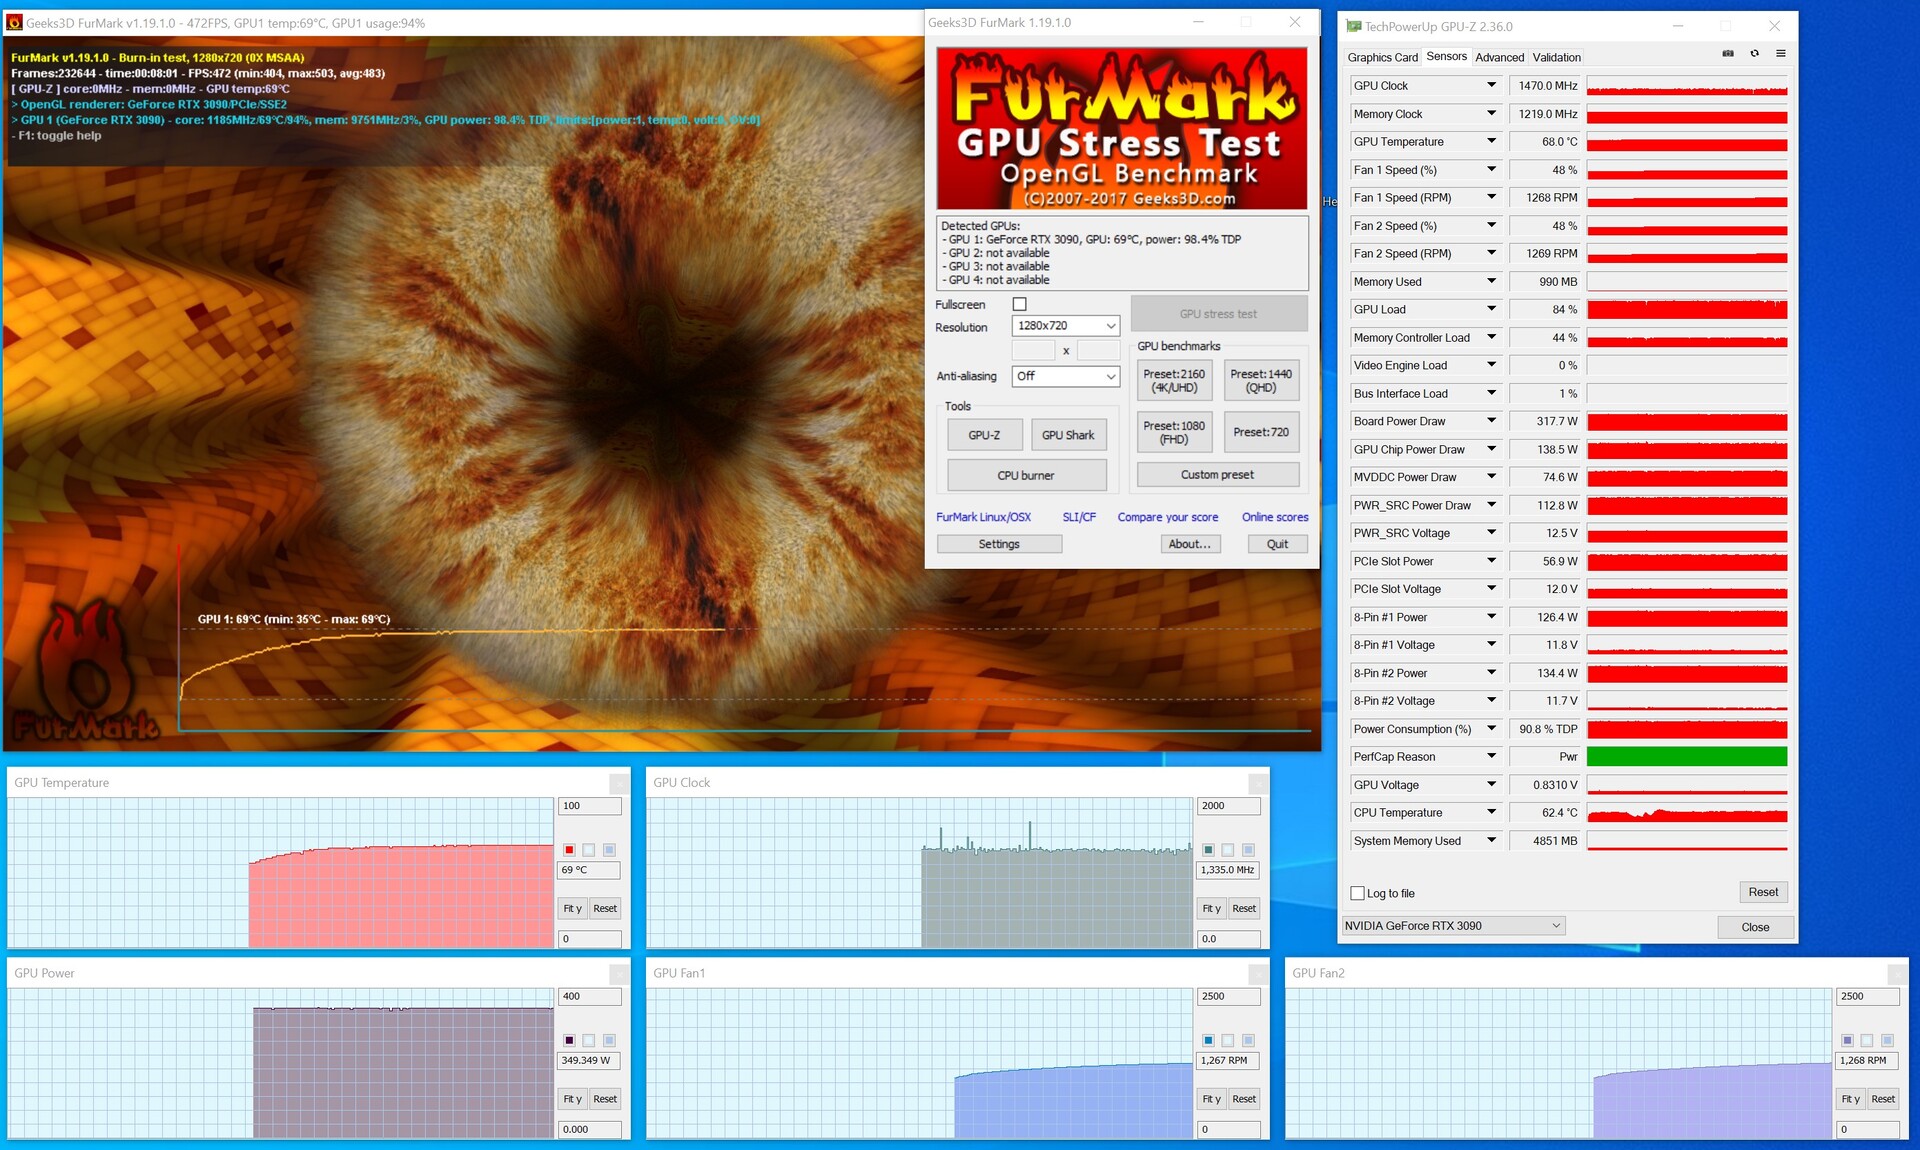
Due to the very high power consumption, you shouldn't pay attention to every single figure when it comes to energy consumption. The manufacturer specifies a maximum of 350 watts for the Founders Edition. The recently reviewed model from MSI even had a power consumption of 420 watts according to the spec sheet. However, the system is just as energy-efficient in idle usage at 91 watts as with other modern graphics cards. Therefore, the Nvidia GeForce RTX 3090 FE doesn't have a disadvantage here. Our measuring device shows considerably more when we play The Witcher 3. An average of 463 watts is reached here. A comparatively good result when we look at the RTX 3080 from Asus or the RTX 3090 from MSI. At 501 watts, our test system achieves almost the same value as the RTX 3080 from Asus in the stress test with FurMark.
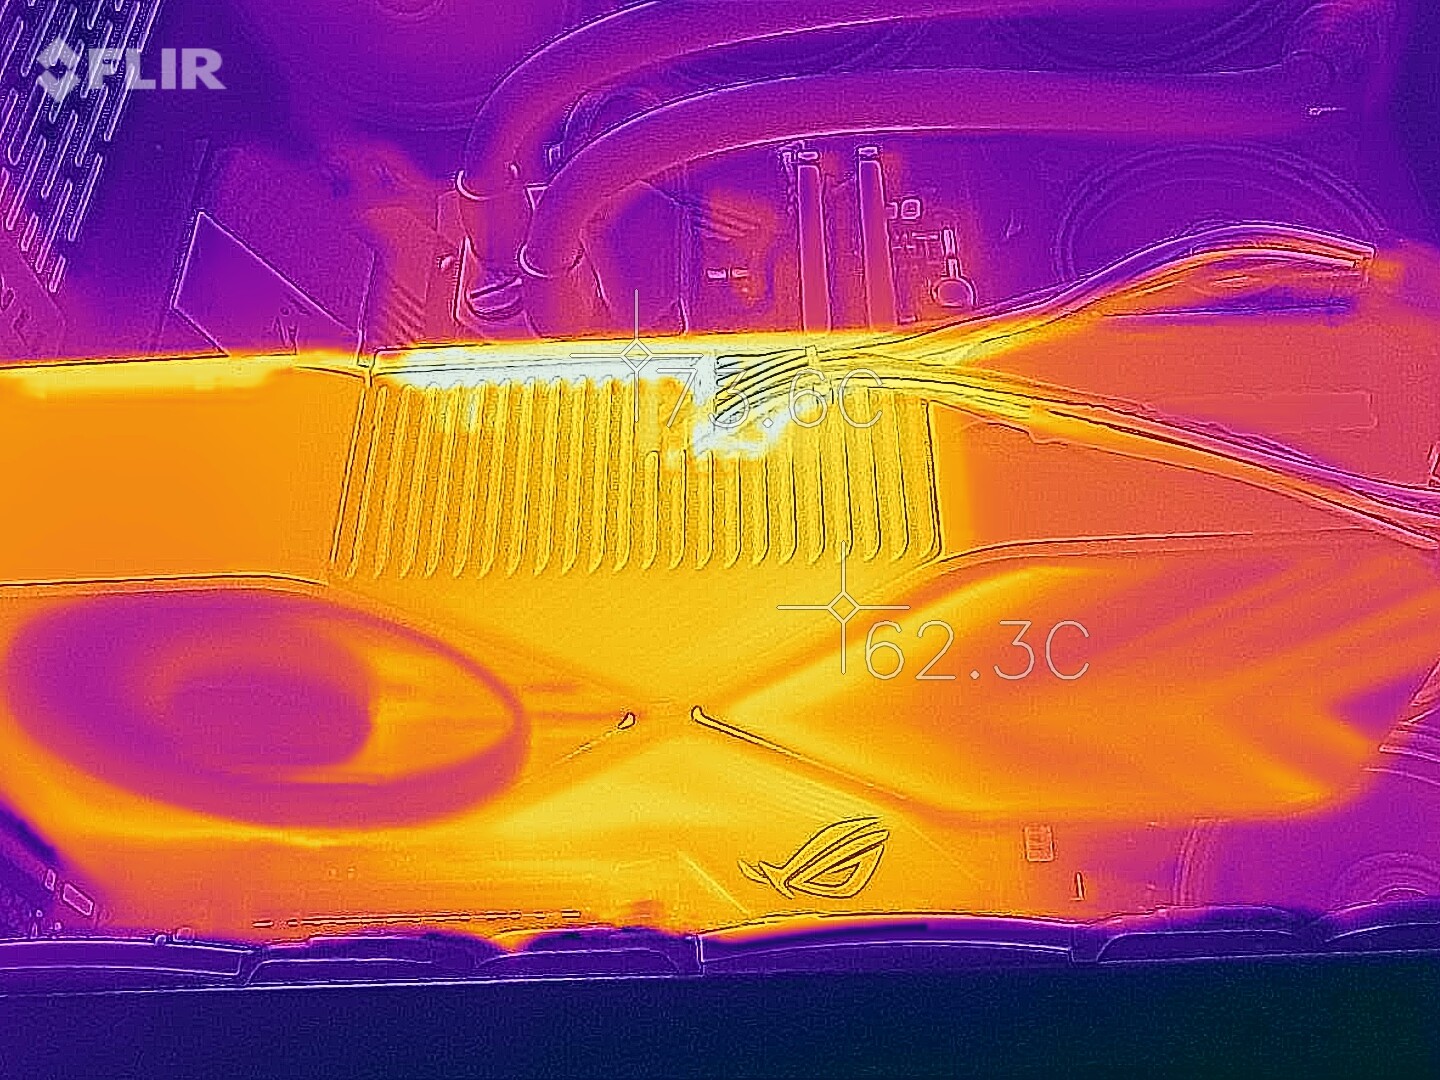
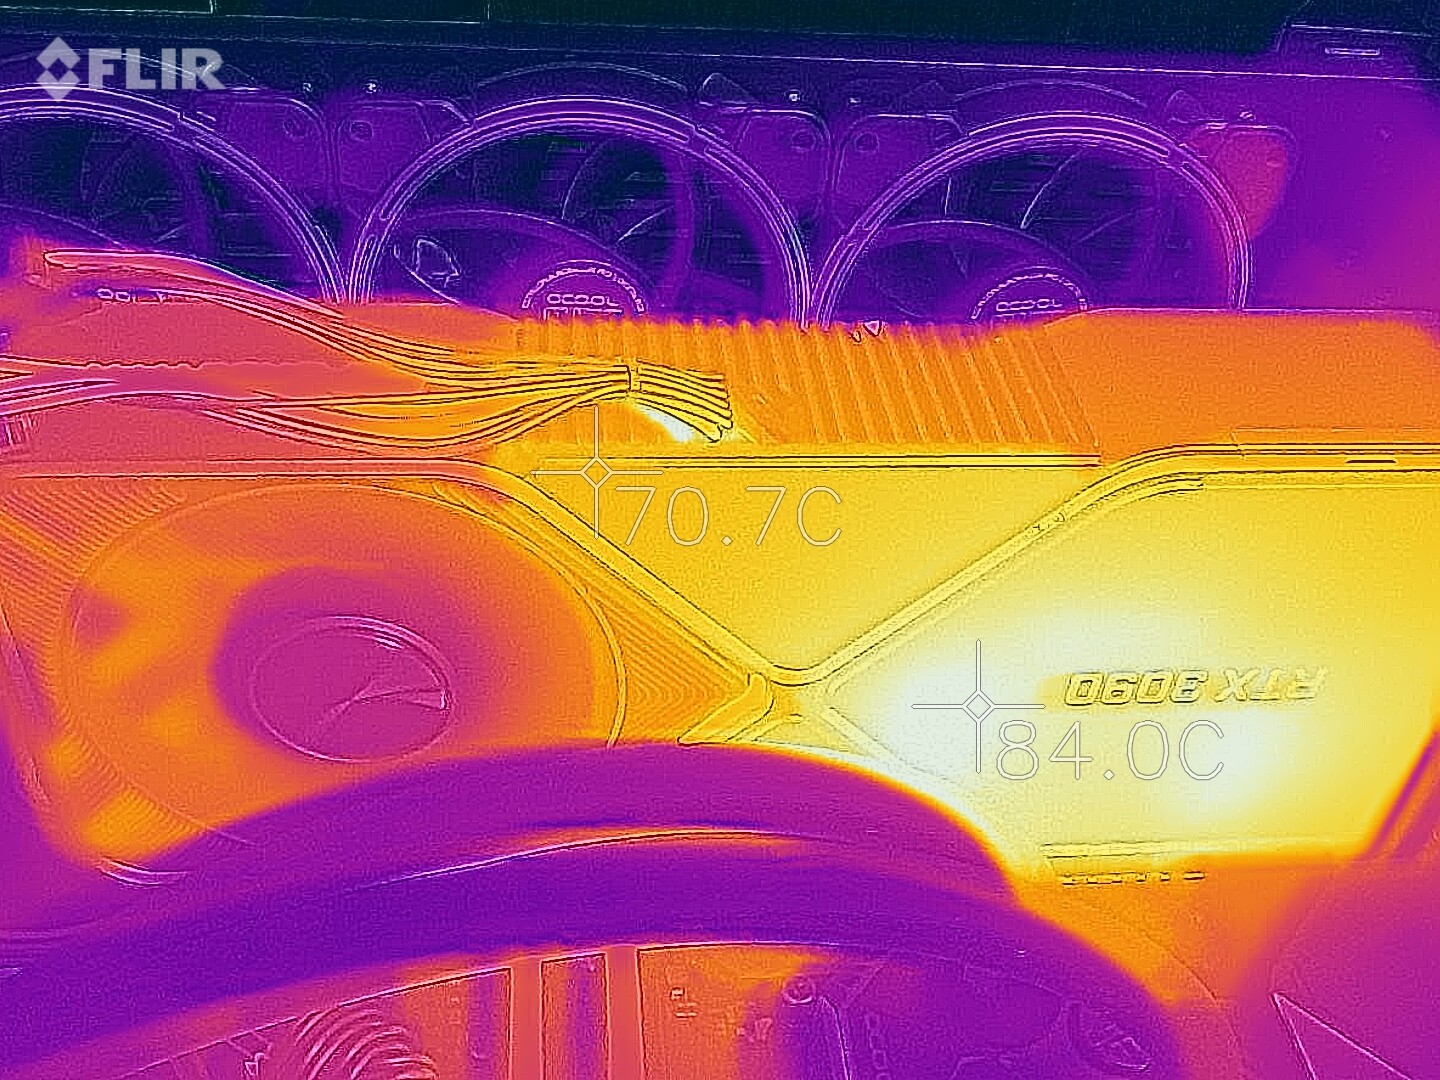
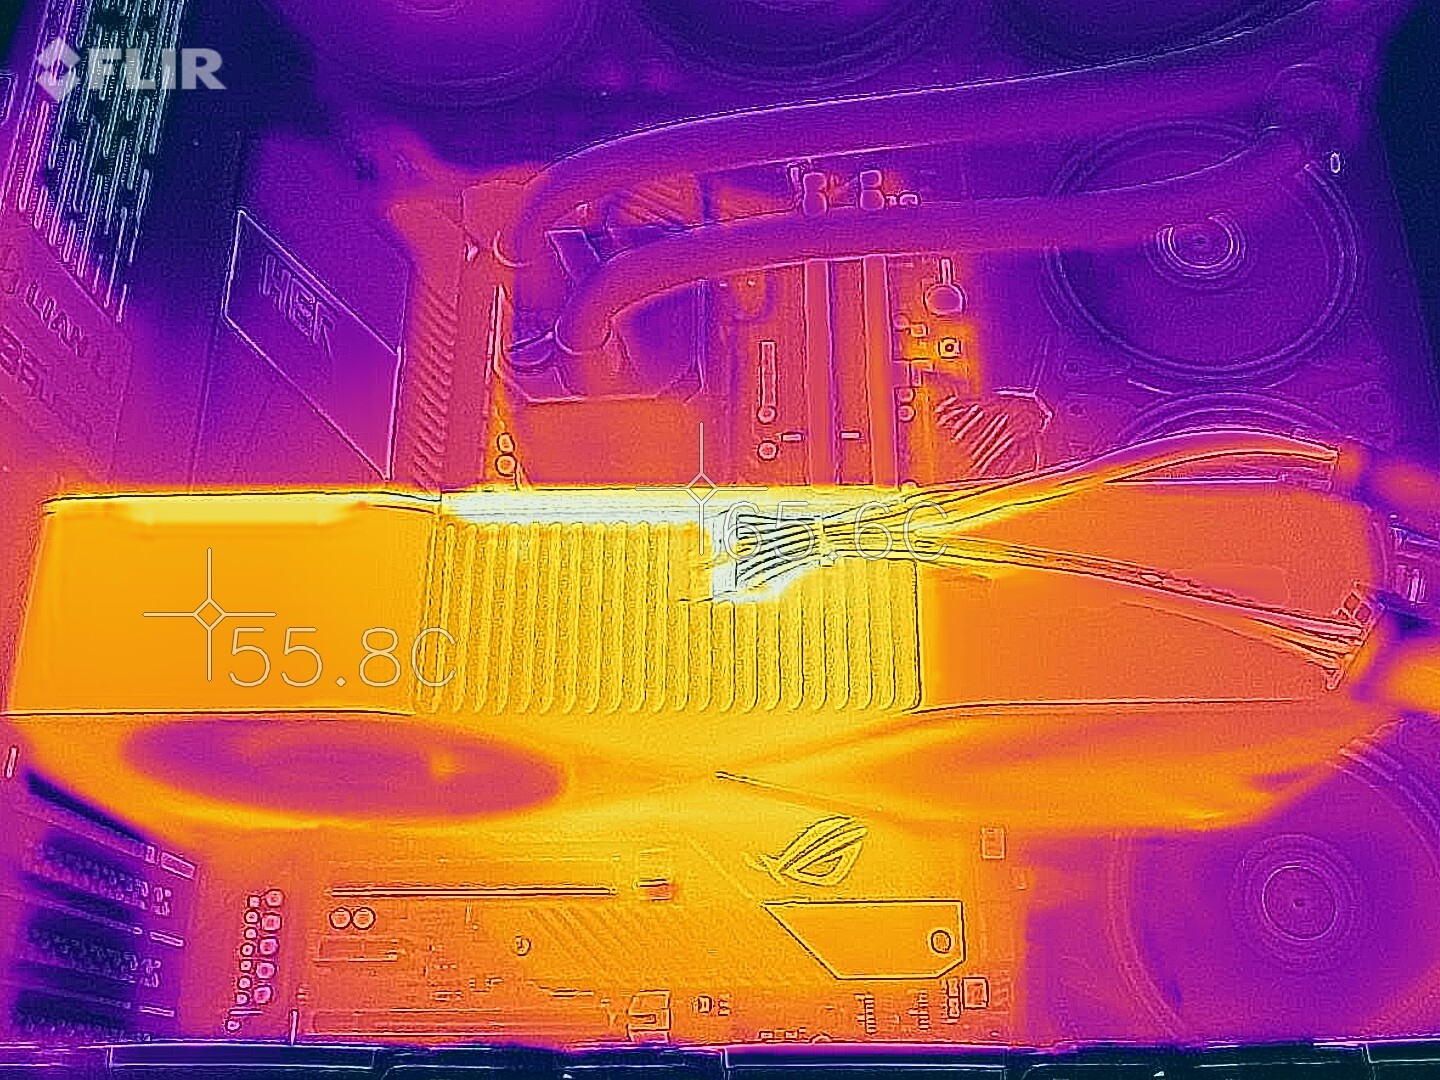
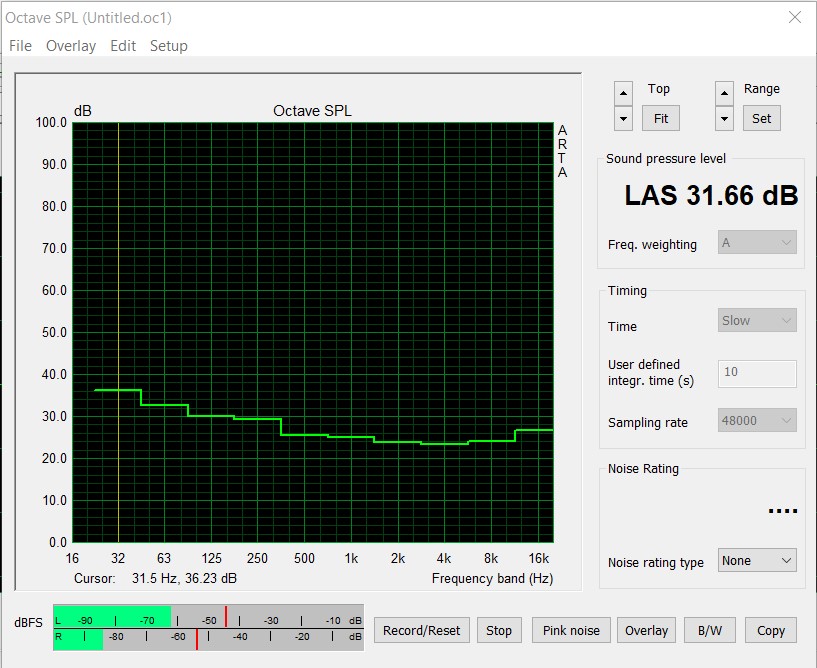
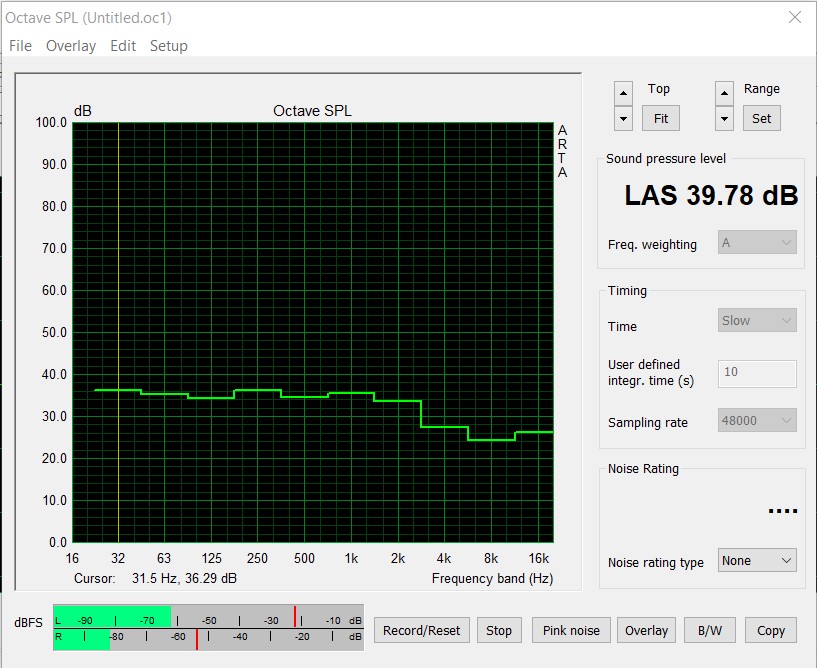
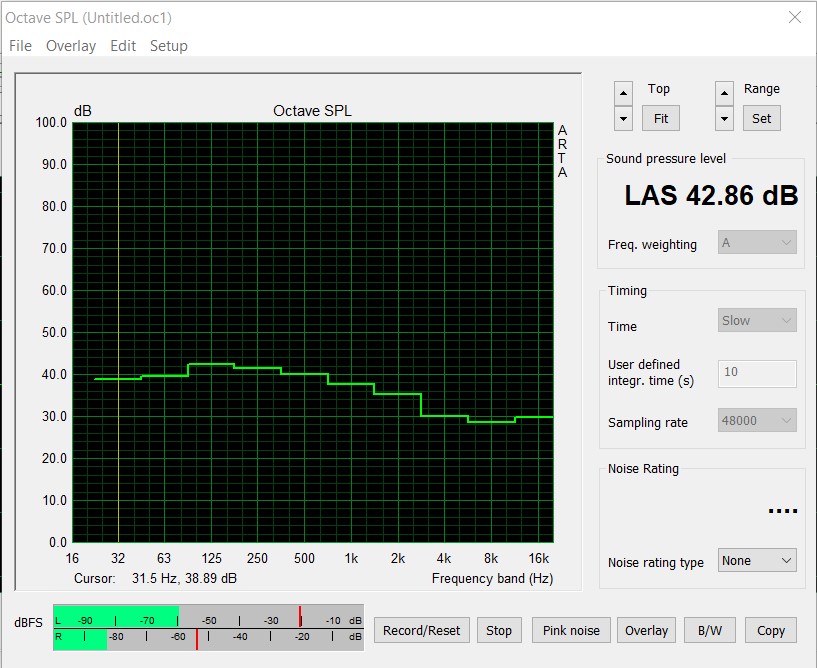
The newly designed cooling system works well, and the fan-stop mode enables now a whisper-quiet 2D operation. The large 110-millimeter fans only start to rotate under load. Nevertheless, they remain surprisingly quiet under load. We measured just under 40 dB(A) in the stress test and just under 43 dB(A) while gaming. The fans of the installed AIO drive the noise up a bit, since the CPU is pushed harder during gaming. The graphics card's case heats up quickly, and the thermal imaging camera's pictures show that heat is well distributed. Nonetheless, there are hotspots on the back of the graphics card that reach 84 °C (~183 °F), which is caused by the VRAM that is installed underneath. The GPU temperature is surprisingly cool at 69 °C (~156 °F). However, the VRAM gets much hotter at around 95 °C (~203 °F).
* ... smaller is better
Pros
Cons
Verdict - Big, quiet, and fast


Nvidia's flagship, the GeForce RTX 3090, is undoubtedly one of the fastest graphics cards on the market. However, the Founders Edition has to admit defeat against the custom designs of some manufacturers due to the 350-watt TDP limit. Meanwhile, board partners like EVGA offer GeForce RTX 3090 models at up to 500 watts. Nevertheless, the version that we tested is suitable for gaming in very high resolutions without restrictions. The build quality is very good, although the new 12-pin power connector has been placed in a very unfavorable position. The graphics card also has a very high-quality feel, and the high weight benefits the heatsink, which finally also offers a fan-stop mode. But even under load, the graphics card doesn't draw excessive attention to itself. The large fans push a lot of air through the cooling fins and produce a low-frequency noise, which is perceived as being somewhat quieter than what our measuring device indicates.
With the GeForce RTX 3090, Nvidia offers a high-end graphics card for uncompromised 4K gaming.
The big advantage of the GeForce RTX 3090 is the VRAM that has a whopping 24 GB of capacity. This is more than twice as much than in the GeForce RTX 3080. AMD is in the midfield with its current graphics cards and equips them with 16 GB. Nevertheless, the GeForce RTX 3090 can prevail over the competition, especially in 4K gaming. The point clearly goes to the RTX 3090 here.
At this point, we can only repeat ourselves when it comes to the subject of availability. The current situation is still unchanged, and the present MSRP of 1,549 Euros (~$1,866) is still only a dream for many users who want to purchase the Nvidia GeForce RTX 3090 Founders Edition. With a bit of luck, however, you can get a hold of this model directly from Nvidia. Every now and then, the model is listed there.

