Intel UHD Graphics G4 (Lakefield GT1 48 EU) vs NVIDIA RTX 2000 Ada Generation Laptop GPU vs Intel UHD Graphics (Jasper Lake 32 EU)
Intel UHD Graphics G4 (Lakefield GT1 48 EU) ► remove from comparison
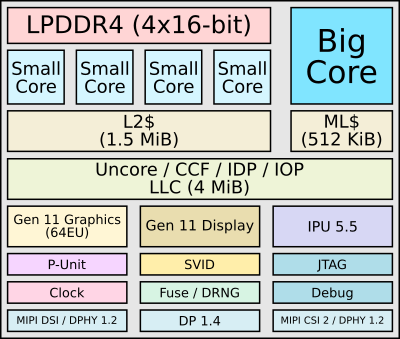
The Intel UHD Graphics G4 (Lakefield GT1 with 48 EUs) is an integrated graphics card in the Lakefield SoCs (e.g. Core i3-L13G4 ) for laptops. It offers no dedicated graphics memory (no eDRAM cache like the Intel Iris Graphics 655 predecessor of the Coffee Lake SoCs). The clock rate ranges between 200 MHz (guaranteed base clock) up to 500 MHz (boost). The TDP of the whole SoC is specified at 7 Watt.
The GPU performance should be a bit slower than the old Intel HD Graphics 620 and therefore only some low demanding games like League of Legends should run with the UHD Graphics.
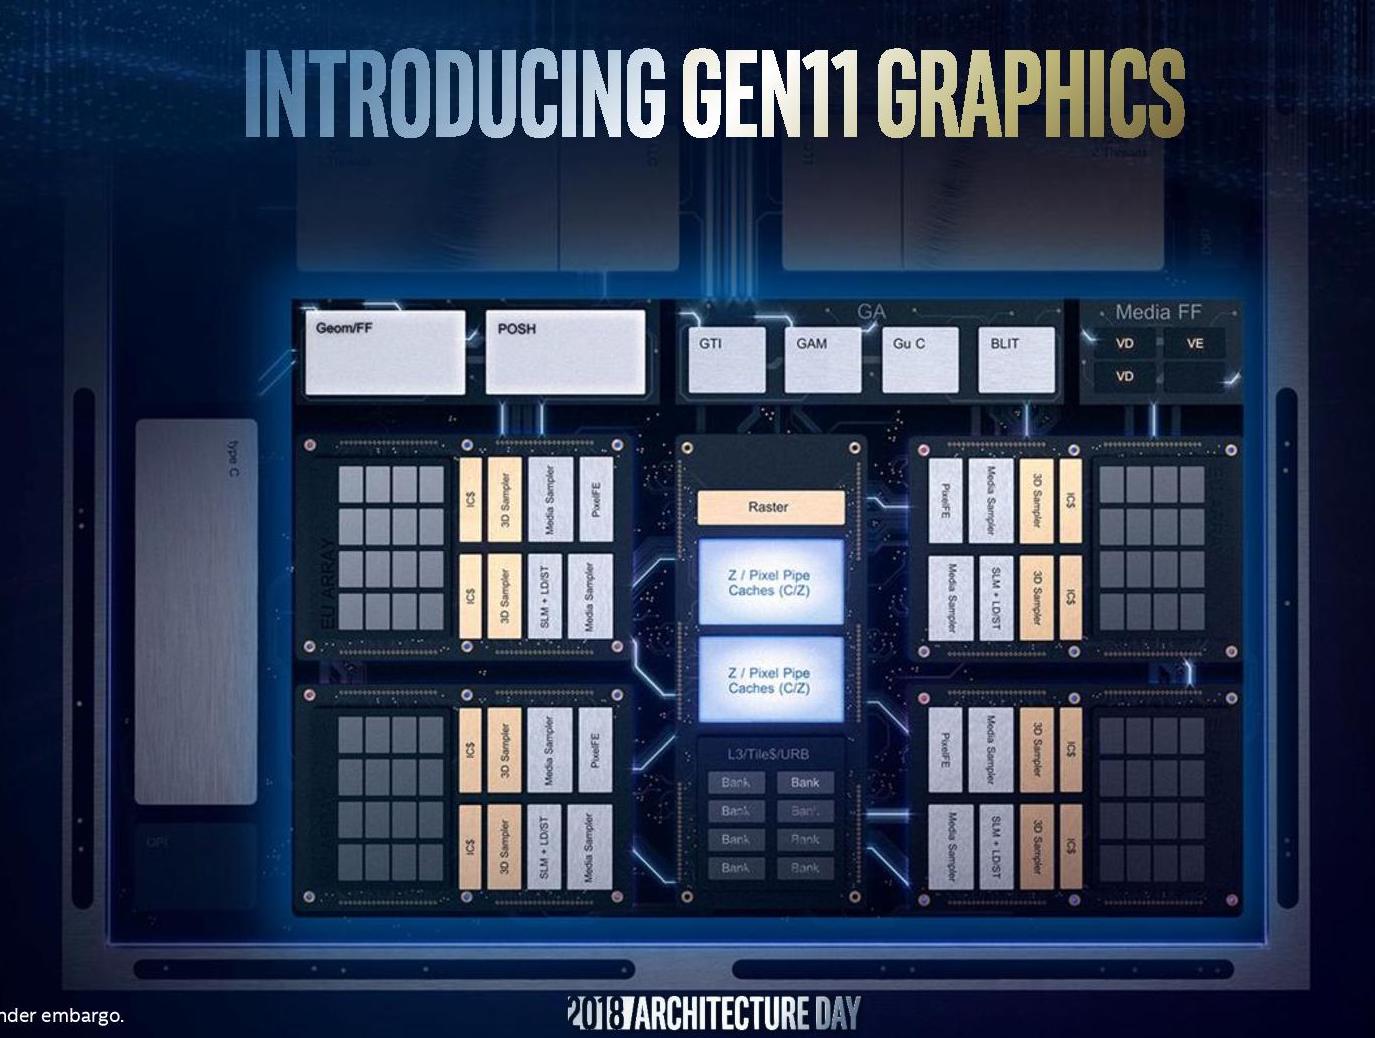
A special new feature of the Gen11 graphics card is the new Variable Rate Shading (VRS) support. With it game designers can decide where to spend shading time and e.g. shade object in the background or behind fog with less resolution (up to using only one source for a 4x4 block). With this technique early results show up to 1.3x performance in Unreal Engine POC and 1.2x speedup in Civ 6. Up to now VRS is only supported by the new Nvidia Turing architecture (GTX 1650 and up).
The Lakefield SoCs and therefore the integrated GPU are manufactured in the modern 10nm process at Intel that should be comparable to the 7nm process of TSMC.
NVIDIA RTX 2000 Ada Generation Laptop GPU ► remove from comparison
The Nvidia RTX 2000 Ada Generation Laptop GPU , not to be confused with the A2000 , P2000 or T2000 , is a mid-range professional graphics card for use in laptops that sports 3,072 CUDA cores and 8 GB of GDDR6 VRAM. It would be fair to say that this is a GeForce RTX 4060 (Laptop) in disguise; consequently, the former is powered by the same AD107 chip as the latter, and is fast enough to handle any triple-A game at 1080p with Ultra quality settings. Brought into existence in 2023, the RTX 2000 leverages TSMC's 5 nm process and Nvidia's Ada Lovelace architecture to achieve very decent performance combined with moderate power consumption. The Nvidia-recommended TGP range for the card is very wide at 35 W to 140 W leading to bizarre performance differences between different systems powered by what is supposed to be the same product.
Quadro series graphics cards ship with much different BIOS and drivers than GeForce cards and are targeted at professional users rather than gamers. Commercial product design, large-scale calculations, simulation, data mining, 24 x 7 operation, certified drivers - if any of this sounds familiar, then a Quadro card will make you happy.
Architecture and Features
Ada Lovelace brings a range of improvements over older graphics cards utilizing the outgoing Ampere architecture. It's not just a better manufacturing process and a higher number of CUDA cores that we have here (up to 16,384 versus 10,752); under-the-hood refinements are plentiful, including an immensely larger L2 cache, an optimized ray tracing routine (a different way is employed to determine what is transparent and what isn't), and other changes. Naturally, these graphics cards can both encode and decode some of the most widely used video codecs, AVC, HEVC and AV1 included; they also support a host of Nvidia technologies, including Optimus and DLSS 3, and they can certainly be used for various AI applications.
The RTX 2000 features 24 RT cores of the 3rd generation, 96 Tensor cores of the 4th generation and 3,072 CUDA cores. Increase those numbers by 50%, and you get an RTX 3000 Ada Generation - as long as we disregard clock speed differences, of course. Unlike costlier Ada Generation professional laptop graphics cards, the RTX 2000 comes with 8 GB of non-ECC VRAM; the lack of error correction makes this card less suitable for super-important tasks and round-the-clock operation. Much like it is with the RTX 3000 Ada Generation, the VRAM is 128-bit wide and delivers a decent bandwidth of ~256 GB/s.
The RTX 2000 Ada Generation makes use of the PCI-Express 4 protocol, just like Ampere-based cards. 8K SUHD monitors are supported, however, DP 1.4a video outputs can potentially prove to be a bottleneck down the line.
Performance
The average RTX 2000 Ada in our extensive database is much closer to the RTX 4050 Laptop than it is to the RTX 4060 Laptop .
Nvidia's marketing materials mention "up to 14.5 TFLOPS" of performance, a significant downgrade compared to 20 TFLOPS delivered by the RTX 3000 Ada Generation .
Your mileage may vary depending on how competent the cooling solution of your laptop is and how high the TGP power target of the RTX 2000 Ada is.
Power consumption
Nvidia no longer divides its laptop graphics cards into Max-Q and non-max-Q models. Instead, laptop makers are free to set the TGP according to their needs, and the range can sometimes be shockingly wide. This is especially the case for the RTX 2000, as the lowest value recommended for it sits at just 35 W while the highest is 300% higher at 140 W. The slowest system built around an RTX 2000 Ada can easily be half as fast as the fastest one. This is the kind of delta that we've already seen on consumer-grade laptops featuring the latest GeForce RTX cards.
Last but not the least, the improved 5 nm process (TSMC 4N) the RTX 2000 is built with makes for very decent energy efficiency, as of mid 2023.
Intel UHD Graphics (Jasper Lake 32 EU) ► remove from comparison
The Intel UHD Graphics 32 EUs (Jasper Lake, Gen. 11) is an integrated graphics card in the Jasper Lake Pentium SoCs for laptops and small desktops. It is the fastest GPU version in the Jasper Lake series (Pentium Silver) and offers all 32 EUs (Execution Units / Shader Blocks). It offers no dedicated graphics memory and the clock rate depends on the processor model. At launch there are two Pentium Silver models (N6000 with 6W and N6005 with 10W) clocked at 350 - 900 MHz.
Thanks to the improved architecture and more EUs, the UHD Graphics is clearly faster than the old Gemini Lake SoCs (e.g. N5000 ). Intel states up to 78% better 3DMark Fire Strike scores and up to 22% more FPS in Rocket League. Still only very low demanding games should be playable.
A special new feature of the Gen11 graphics card is the new Variable Rate Shading (VRS) support. With it game designers can decide where to spend shading time and e.g. shade object in the background or behind fog with less resolution (up to using only one source for a 4x4 block). With this technique early results show up to 1.3x performance in Unreal Engine POC and 1.2x speedup in Civ 6. Up to now VRS is only supported by the new Nvidia Turing architecture (GTX 1650 and up).
Another improved hardware piece is the integrated video de- and encoder that was improved significantly according to Intel. They did not specify any more details, but the previous generation was able to decode VP9 and H.265/HEVC in Main10 profile with 10 bit color depth using the dedicated hardware.
The Jasper Lake SoCs and therefore the integrated GPU are manufactured in the 10nm process (like Ice Lake probably) at Intel that should be comparable to the 7nm process of TSMC.
Intel UHD Graphics G4 (Lakefield GT1 48 EU) NVIDIA RTX 2000 Ada Generation Laptop GPU Intel UHD Graphics (Jasper Lake 32 EU) Gen. 11 Series Codename Lakefield GT1 Gen. 11 Architecture Gen. 11 Ice Lake Ada Lovelace Gen. 11 Pipelines 48 - unified 3072 - unified 32 - unified Core Speed 200 - 500 (Boost) MHz 350 - 900 (Boost) MHz Memory Type DDR4 GDDR6 Shared Memory yes no yes API DirectX 12_1, OpenGL 4.5 DirectX 12 Ultimate, Shader 6.7, OpenGL 4.6, OpenCL 3.0, Vulkan 1.3 DirectX 12_1, OpenGL 4.5 Power Consumption 7 Watt 115 Watt (35 - 115 Watt TGP) 4.8 - 10 Watt technology 10 nm 5 nm 10 nm Features QuickSync QuickSync Date of Announcement 28.05.2020 21.03.2023 11.01.2021 TMUs 96 ROPs 32 Raytracing Cores 24 Tensor / AI Cores 96 Cache L2: 32 MB Memory Speed 16000 effective = 2000 MHz Memory Bus Width 128 Bit Max. Amount of Memory 8 GB Memory Bandwidth 256 GB/s PCIe 4 Displays 4 Displays (max.), HDMI 2.1, DisplayPort 1.4a Notebook Size large Link to Manufacturer Page images.nvidia.com Predecessor RTX A2000 Laptop GPU
Benchmarks Performance Rating - 3DMark 11 + Fire Strike + Time Spy - UHD Graphics (Jasper Lake 32 EU)
0.5 pt (1%)
...
Intel UHD Graphics (Jasper Lake 32 EU)
...
max:
3DMark - 3DMark Time Spy Score
min: 7813 avg: 8763 median: 8849 (26%) max: 9628 Points
GPU TDP 50 W TDP 65 W TDP 80 W 81% 92% 100%
min: 274 avg: 371.2 median: 372 (1%) max: 456 Points
GPU TDP ? TDP 50 W TDP 65 W TDP 80 W 4% 81% 92% 100%
3DMark - 3DMark Time Spy Graphics
min: 7410 avg: 8334 median: 8433 (22%) max: 9158 Points
GPU TDP 50 W TDP 65 W TDP 80 W 81% 92% 100%
min: 242 avg: 328.8 median: 330 (1%) max: 402 Points
GPU TDP ? TDP 50 W TDP 65 W TDP 80 W 4% 81% 92% 100%
3DMark - 3DMark Ice Storm Unlimited Graphics
min: 62122 avg: 71176 median: 72158 (8%) max: 78266 Points
3DMark - 3DMark Ice Storm Extreme Graphics
min: 20602 avg: 28831 median: 30464 (4%) max: 33792 Points
3DMark - 3DMark Cloud Gate Score
58198 Points (62%)
min: 4709 avg: 5737 median: 5531.5 (6%) max: 7589 Points
GPU TDP ? TDP 80 W 10% 100%
3DMark - 3DMark Cloud Gate Graphics
133204 Points (35%)
min: 5681 avg: 7297 median: 6977 (2%) max: 9405 Points
3DMark - 3DMark Fire Strike Standard Score
min: 18177 avg: 20223 median: 19987 (35%) max: 22505 Points
GPU TDP 50 W TDP 65 W TDP 80 W 81% 89% 100%
min: 650 avg: 998 median: 982 (2%) max: 1260 Points
GPU TDP ? TDP 50 W TDP 65 W TDP 80 W 4% 81% 89% 100%
3DMark - 3DMark Fire Strike Standard Graphics
min: 20340 avg: 22325 median: 22039 (25%) max: 24596 Points
GPU TDP 50 W TDP 65 W TDP 80 W 83% 90% 100%
min: 712 avg: 1056 median: 1016 (1%) max: 1360 Points
GPU TDP ? TDP 50 W TDP 65 W TDP 80 W 4% 83% 90% 100%
3DMark - 3DMark Ice Storm Graphics
min: 21465 avg: 39252 median: 40638.5 (5%) max: 54265 Points
3DMark - 3DMark Wild Life Unlimited
min: 2289 avg: 2505 median: 2504.5 (1%) max: 2720 Points
3DMark - 3DMark Wild Life Extreme Unlimited
15840 Points (18%)
681 Points (1%)
3DMark - 3DMark Night Raid
min: 3217 avg: 3440 median: 3439.5 (3%) max: 3662 Points
3DMark - 3DMark Night Raid Graphics Score
min: 4254 avg: 4588 median: 4588 (2%) max: 4922 Points
3DMark 11 - 3DM11 Performance Score
min: 25876 avg: 27504 median: 27558 (38%) max: 29077 Points
GPU TDP 50 W TDP 65 W TDP 80 W 89% 95% 100%
min: 1448 avg: 1756 median: 1652 (2%) max: 2086 Points
GPU TDP ? TDP 50 W TDP 65 W TDP 80 W 6% 89% 95% 100%
3DMark 11 - 3DM11 Performance GPU
min: 26968 avg: 30077 median: 30262 (26%) max: 33001 Points
GPU TDP 50 W TDP 65 W TDP 80 W 82% 92% 100%
min: 1356 avg: 1625 median: 1589 (1%) max: 1872 Points
GPU TDP ? TDP 50 W TDP 65 W TDP 80 W 5% 82% 92% 100%
3DMark Vantage + NVIDIA RTX 2000 Ada Generation Laptop GPU 3DMark Vantage - 3DM Vant. Perf. total
37844 Points (11%)
3DM Vant. Perf. total + Intel UHD Graphics (Jasper Lake 32 EU)
min: 5185 avg: 6317 median: 6316.5 (2%) max: 7448 Points
GPU TDP ? TDP 65 W 17% 100%
3DM Vant. Perf. GPU no PhysX + NVIDIA RTX 2000 Ada Generation Laptop GPU 3DMark Vantage - 3DM Vant. Perf. GPU no PhysX
32473 Points (18%)
3DM Vant. Perf. GPU no PhysX + Intel UHD Graphics (Jasper Lake 32 EU)
min: 4446 avg: 5452 median: 5451.5 (3%) max: 6457 Points
GPU TDP ? TDP 65 W 17% 100%
3DMark 05 - 3DMark 05 - Standard
min: 8291 avg: 11395 median: 11395 (12%) max: 14499 Points
3DMark 06 3DMark 06 - Standard 1280x1024 + NVIDIA RTX 2000 Ada Generation Laptop GPU
53707 Points (70%)
3DMark 06 - Standard 1280x1024 + Intel UHD Graphics (Jasper Lake 32 EU)
min: 5416 avg: 7321 median: 6074 (8%) max: 10473 Points
GPU TDP ? TDP 65 W 14% 100%
Unigine Valley 1.0 - Unigine Valley 1.0 DX
34.1 fps (11%)
min: 3.5 avg: 4.6 median: 4.6 (1%) max: 5.6 fps
GPU TDP ? TDP 65 W 13% 100%
Unigine Heaven 3.0 - Unigine Heaven 3.0 DX 11
12.6 fps (4%)
Unigine Heaven 3.0 - Unigine Heaven 3.0 OpenGL
13.7 fps (6%)
Unigine Heaven 2.1 - Heaven 2.1 high
15.4 fps (3%)
Blender - Blender 3.3 Classroom CUDA *
min: 51 avg: 85.7 median: 51 (8%) max: 155 Seconds
GPU TDP 50 W TDP 65 W TDP 80 W 120% 120% 100%
Blender - Blender 3.3 Classroom OPTIX *
min: 25 avg: 26.3 median: 26 (10%) max: 28 Seconds
GPU TDP 50 W TDP 65 W TDP 80 W 101% 100% 101%
SPECviewperf 13 specvp13 sw-04 + NVIDIA RTX 2000 Ada Generation Laptop GPU SPECviewperf 13 - specvp13 sw-04
min: 173.89 avg: 181.1 median: 174.7 (47%) max: 194.75 fps
GPU TDP 50 W TDP 65 W TDP 80 W 89% 100% 90%
specvp13 snx-03 + NVIDIA RTX 2000 Ada Generation Laptop GPU SPECviewperf 13 - specvp13 snx-03
min: 315.35 avg: 333.9 median: 330 (37%) max: 356.29 fps
GPU TDP 50 W TDP 65 W TDP 80 W 89% 93% 100%
specvp13 showcase-02 + NVIDIA RTX 2000 Ada Generation Laptop GPU SPECviewperf 13 - specvp13 showcase-02
min: 79.97 avg: 85.9 median: 82.8 (18%) max: 95.04 fps
GPU TDP 50 W TDP 65 W TDP 80 W 87% 100% 84%
specvp13 medical-02 + NVIDIA RTX 2000 Ada Generation Laptop GPU SPECviewperf 13 - specvp13 medical-02
min: 103.3 avg: 126.4 median: 110.7 (23%) max: 165.27 fps
GPU TDP 50 W TDP 65 W TDP 80 W 63% 100% 67%
specvp13 maya-05 + NVIDIA RTX 2000 Ada Generation Laptop GPU SPECviewperf 13 - specvp13 maya-05
min: 271.86 avg: 280.7 median: 276.7 (31%) max: 293.61 fps
GPU TDP 50 W TDP 65 W TDP 80 W 93% 100% 94%
specvp13 energy-02 + NVIDIA RTX 2000 Ada Generation Laptop GPU SPECviewperf 13 - specvp13 energy-02
min: 46.29 avg: 48.4 median: 49.4 (16%) max: 49.58 fps
GPU TDP 50 W TDP 65 W TDP 80 W 93% 100% 100%
specvp13 creo-02 + NVIDIA RTX 2000 Ada Generation Laptop GPU SPECviewperf 13 - specvp13 creo-02
min: 249.3 avg: 258.6 median: 261.4 (38%) max: 265.15 fps
GPU TDP 50 W TDP 65 W TDP 80 W 94% 100% 99%
specvp13 catia-05 + NVIDIA RTX 2000 Ada Generation Laptop GPU SPECviewperf 13 - specvp13 catia-05
min: 257.86 avg: 293.4 median: 309.5 (34%) max: 312.95 fps
GPU TDP 50 W TDP 65 W TDP 80 W 82% 99% 100%
specvp13 3dsmax-06 + NVIDIA RTX 2000 Ada Generation Laptop GPU SPECviewperf 13 - specvp13 3dsmax-06
min: 155.94 avg: 179.7 median: 182.5 (32%) max: 200.54 fps
GPU TDP 50 W TDP 65 W TDP 80 W 91% 100% 78%
SPECviewperf 2020 specvp2020 solidworks-05 1080p + NVIDIA RTX 2000 Ada Generation Laptop GPU SPECviewperf 2020 - specvp2020 solidworks-05 1080p
min: 191.93 avg: 205.4 median: 198.6 (39%) max: 225.76 fps
GPU TDP 50 W TDP 65 W TDP 80 W 85% 88% 100%
specvp2020 snx-04 1080p + NVIDIA RTX 2000 Ada Generation Laptop GPU SPECviewperf 2020 - specvp2020 snx-04 1080p
min: 315.31 avg: 341.5 median: 327.9 (53%) max: 381.32 fps
GPU TDP 50 W TDP 65 W TDP 80 W 83% 86% 100%
specvp2020 medical-03 1080p + NVIDIA RTX 2000 Ada Generation Laptop GPU SPECviewperf 2020 - specvp2020 medical-03 1080p
min: 50.48 avg: 66.6 median: 57.2 (41%) max: 92.01 fps
GPU TDP 50 W TDP 65 W TDP 80 W 55% 100% 62%
specvp2020 maya-06 1080p + NVIDIA RTX 2000 Ada Generation Laptop GPU SPECviewperf 2020 - specvp2020 maya-06 1080p
min: 309.59 avg: 331.5 median: 329.5 (48%) max: 355.25 fps
GPU TDP 50 W TDP 65 W TDP 80 W 87% 93% 100%
specvp2020 energy-03 1080p + NVIDIA RTX 2000 Ada Generation Laptop GPU SPECviewperf 2020 - specvp2020 energy-03 1080p
min: 46.5 avg: 50.2 median: 49.7 (40%) max: 54.54 fps
GPU TDP 50 W TDP 65 W TDP 80 W 85% 91% 100%
specvp2020 creo-03 1080p + NVIDIA RTX 2000 Ada Generation Laptop GPU SPECviewperf 2020 - specvp2020 creo-03 1080p
min: 96.6 avg: 118.7 median: 121.7 (60%) max: 137.93 fps
GPU TDP 50 W TDP 65 W TDP 80 W 88% 100% 70%
specvp2020 catia-06 1080p + NVIDIA RTX 2000 Ada Generation Laptop GPU SPECviewperf 2020 - specvp2020 catia-06 1080p
min: 81.59 avg: 85.6 median: 84 (54%) max: 91.24 fps
GPU TDP 50 W TDP 65 W TDP 80 W 89% 92% 100%
specvp2020 3dsmax-07 1080p + NVIDIA RTX 2000 Ada Generation Laptop GPU SPECviewperf 2020 - specvp2020 3dsmax-07 1080p
min: 73.7 avg: 84.5 median: 84.6 (38%) max: 95.09 fps
GPU TDP 50 W TDP 65 W TDP 80 W 78% 89% 100%
specvp2020 solidworks-05 4k + NVIDIA RTX 2000 Ada Generation Laptop GPU SPECviewperf 2020 - specvp2020 solidworks-05 4k
77.6 fps (23%)
specvp2020 snx-04 4k + NVIDIA RTX 2000 Ada Generation Laptop GPU SPECviewperf 2020 - specvp2020 snx-04 4k
148.1 fps (15%)
specvp2020 medical-03 4k + NVIDIA RTX 2000 Ada Generation Laptop GPU SPECviewperf 2020 - specvp2020 medical-03 4k
17 fps (16%)
specvp2020 maya-06 4k + NVIDIA RTX 2000 Ada Generation Laptop GPU SPECviewperf 2020 - specvp2020 maya-06 4k
114 fps (19%)
specvp2020 energy-03 4k + NVIDIA RTX 2000 Ada Generation Laptop GPU SPECviewperf 2020 - specvp2020 energy-03 4k
14.9 fps (3%)
specvp2020 creo-03 4k + NVIDIA RTX 2000 Ada Generation Laptop GPU SPECviewperf 2020 - specvp2020 creo-03 4k
69.2 fps (33%)
specvp2020 catia-06 4k + NVIDIA RTX 2000 Ada Generation Laptop GPU SPECviewperf 2020 - specvp2020 catia-06 4k
44.7 fps (29%)
specvp2020 3dsmax-07 4k + NVIDIA RTX 2000 Ada Generation Laptop GPU SPECviewperf 2020 - specvp2020 3dsmax-07 4k
46.8 fps (20%)
Cinebench R10 Cinebench R10 Shading (32bit) + Intel UHD Graphics (Jasper Lake 32 EU) Cinebench R10 - Cinebench R10 Shading (32bit)
min: 6115 avg: 6526 median: 6561 (5%) max: 6868 Points
Cinebench R11.5 Cinebench R11.5 OpenGL 64 Bit + Intel UHD Graphics (Jasper Lake 32 EU) Cinebench R11.5 - Cinebench R11.5 OpenGL 64 Bit
min: 18.59 avg: 20.5 median: 19.8 (7%) max: 23.82 fps
Cinebench R15 + NVIDIA RTX 2000 Ada Generation Laptop GPU Cinebench R15 - Cinebench R15 OpenGL 64 Bit
min: 223 avg: 290.3 median: 295 (17%) max: 353 fps
GPU TDP 50 W TDP 65 W TDP 80 W 63% 84% 100%
Cinebench R15 OpenGL 64 Bit + Intel UHD Graphics (Jasper Lake 32 EU)
min: 25.4 avg: 31.3 median: 31.6 (2%) max: 37.14 fps
GPU TDP ? TDP 50 W TDP 65 W TDP 80 W 9% 63% 84% 100%
Cinebench R15 OpenGL Ref. Match 64 Bit + NVIDIA RTX 2000 Ada Generation Laptop GPU Cinebench R15 - Cinebench R15 OpenGL Ref. Match 64 Bit
99.6 % (100%)
GPU TDP 50 W TDP 65 W TDP 80 W 100% 100% 100%
Cinebench R15 OpenGL Ref. Match 64 Bit + Intel UHD Graphics (Jasper Lake 32 EU)
97.8 % (98%)
GPU TDP ? TDP 50 W TDP 65 W TDP 80 W 98% 100% 100% 100%
GFXBench - GFXBench 5.0 4K Aztec Ruins High Tier Offscreen
27 fps (11%)
GFXBench - GFXBench 5.0 Aztec Ruins High Tier Offscreen
61.4 fps (11%)
min: 9.6 avg: 10.5 median: 10.5 (2%) max: 11.3 fps
GPU TDP ? TDP 65 W 17% 100%
GFXBench - GFXBench 5.0 Aztec Ruins Normal Tier Offscreen
162.8 fps (12%)
min: 24.4 avg: 26.5 median: 26.5 (2%) max: 28.6 fps
GPU TDP ? TDP 65 W 16% 100%
GFXBench - GFXBench Car Chase Offscreen
145.2 fps (16%)
min: 24 avg: 25.1 median: 25.1 (3%) max: 26.1 fps
GPU TDP ? TDP 65 W 17% 100%
GFXBench 3.1 - GFXBench Manhattan ES 3.1 Offscreen
193.4 fps (4%)
min: 31.7 avg: 34 median: 34 (1%) max: 36.2 fps
GPU TDP ? TDP 65 W 18% 100%
GFXBench 3.0 - GFXBench 3.0 Manhattan Offscreen
304.1 fps (18%)
min: 48.7 avg: 53.7 median: 53.7 (3%) max: 58.7 fps
GPU TDP ? TDP 65 W 18% 100%
GFXBench (DX / GLBenchmark) 2.7 + NVIDIA RTX 2000 Ada Generation Laptop GPU GFXBench (DX / GLBenchmark) 2.7 - GFXBench T-Rex HD Offscreen C24Z16
599 fps (5%)
GFXBench T-Rex HD Offscreen C24Z16 + Intel UHD Graphics (Jasper Lake 32 EU)
min: 85.6 avg: 91.2 median: 91.2 (1%) max: 96.8 fps
GPU TDP ? TDP 65 W 15% 100%
Basemark GPU 1.2 - Basemark GPU 1.2 Vulkan Official Medium Offscreen 1080
min: 104.6 avg: 196.8 median: 196.8 (1%) max: 289 fps
GPU TDP 50 W TDP 65 W 36% 100%
Basemark GPU 1.2 - Basemark GPU 1.2 Vulkan Official High Offscreen 2160
3.6 fps (1%)
Geekbench 6.2 - Geekbench 6.2 GPU OpenCL
min: 75472 avg: 76342 median: 76342 (22%) max: 77212 Points
GPU TDP 50 W TDP 65 W 100% 98%
Geekbench 6.2 - Geekbench 6.2 GPU Vulkan
min: 19217 avg: 46136 median: 46136 (15%) max: 73055 Points
GPU TDP 50 W TDP 65 W 100% 26%
LuxMark v2.0 64Bit - LuxMark v2.0 Room GPU
2981 Samples/s (13%)
min: 136 avg: 163.8 median: 160 (1%) max: 199 Samples/s
LuxMark v2.0 64Bit - LuxMark v2.0 Sala GPU
6323 Samples/s (11%)
min: 274 avg: 364.5 median: 387 (1%) max: 410 Samples/s
ComputeMark v2.1 - ComputeMark v2.1 Result
14884 Points (16%)
min: 771 avg: 983 median: 1012.5 (1%) max: 1136 Points
Power Consumption - Furmark Stress Test Power Consumption - external Monitor *
min: 75.1 avg: 94.2 median: 87.9 (12%) max: 119.5 Watt
GPU TDP 50 W TDP 65 W TDP 80 W 108% 105% 100%
min: 11.2 avg: 16.9 median: 16.5 (2%) max: 25 Watt
GPU TDP ? TDP 50 W TDP 65 W TDP 80 W 118% 108% 105% 100%
Power Consumption - The Witcher 3 Power Consumption - external Monitor *
min: 84.4 avg: 109.1 median: 101.5 (14%) max: 141.5 Watt
GPU TDP 50 W TDP 65 W TDP 80 W 110% 107% 100%
min: 13.2 avg: 14.5 median: 13.9 (2%) max: 16.3 Watt
GPU TDP ? TDP 50 W TDP 65 W TDP 80 W 122% 110% 107% 100%
Power Consumption - Witcher 3 Power Consumption *
min: 87.9 avg: 112.5 median: 104.7 (23%) max: 144.9 Watt
GPU TDP 50 W TDP 65 W TDP 80 W 118% 113% 100%
min: 14.3 avg: 15.4 median: 15.4 (3%) max: 16.5 Watt
GPU TDP ? TDP 50 W TDP 65 W TDP 80 W 142% 118% 113% 100%
Power Consumption - Witcher 3 ultra Power Efficiency
0.8 fps per Watt (75%)
0.2 fps per Watt (17%)
GPU TDP ? TDP 65 W 22% 100%
Power Consumption - Witcher 3 ultra Power Efficiency - external Monitor
0.8 fps per Watt (65%)
0.2 fps per Watt (15%)
GPU TDP ? TDP 65 W 22% 100%
Emissions Witcher 3 Fan Noise + NVIDIA RTX 2000 Ada Generation Laptop GPU Emissions - Witcher 3 Fan Noise
min: 40.7 avg: 44.9 median: 43.3 (69%) max: 50.6 dB(A)
GPU TDP 50 W TDP 65 W TDP 80 W 86% 80% 100%
Average Benchmarks NVIDIA RTX 2000 Ada Generation Laptop GPU → 0% n= Average Benchmarks Intel UHD Graphics (Jasper Lake 32 EU) → 0% n=
- Range of benchmark values for this graphics card
- Average benchmark values for this graphics card
* Smaller numbers mean a higher performance
1 This benchmark is not used for the average calculation
Game Benchmarks The following benchmarks stem from our benchmarks of review laptops. The performance depends on the used graphics memory, clock rate, processor, system settings, drivers, and operating systems. So the results don't have to be representative for all laptops with this GPU. For detailed information on the benchmark results, click on the fps number.
NVIDIA RTX 2000 Ada Generation Laptop GPU:
113 fps
NVIDIA RTX 2000 Ada Generation Laptop GPU:
103 fps
NVIDIA RTX 2000 Ada Generation Laptop GPU:
97 fps
NVIDIA RTX 2000 Ada Generation Laptop GPU:
76 fps
NVIDIA RTX 2000 Ada Generation Laptop GPU:
58 fps
NVIDIA RTX 2000 Ada Generation Laptop GPU:
85.4 [X] HP ZBook Power 15 G10 2.02
AMD Ryzen 7 PRO 7840HS 3.8GHz
NVIDIA RTX 2000 Ada Generation Laptop GPU
min:
49.2 fps, max:
119.7 fps
fps
NVIDIA RTX 2000 Ada Generation Laptop GPU:
64.5 [X] HP ZBook Power 15 G10 2.02
AMD Ryzen 7 PRO 7840HS 3.8GHz
NVIDIA RTX 2000 Ada Generation Laptop GPU
min:
46.8 fps, max:
101.4 fps
fps
NVIDIA RTX 2000 Ada Generation Laptop GPU:
55.2 [X] HP ZBook Power 15 G10 2.02
AMD Ryzen 7 PRO 7840HS 3.8GHz
NVIDIA RTX 2000 Ada Generation Laptop GPU
min:
41.1 fps, max:
72 fps
fps
NVIDIA RTX 2000 Ada Generation Laptop GPU:
48.3 [X] HP ZBook Power 15 G10 2.02
AMD Ryzen 7 PRO 7840HS 3.8GHz
NVIDIA RTX 2000 Ada Generation Laptop GPU
min:
29.5 fps, max:
105.8 fps
fps
NVIDIA RTX 2000 Ada Generation Laptop GPU:
29.9 [X] HP ZBook Power 15 G10 2.02
AMD Ryzen 7 PRO 7840HS 3.8GHz
NVIDIA RTX 2000 Ada Generation Laptop GPU
min:
24.5 fps, max:
41 fps
fps
NVIDIA RTX 2000 Ada Generation Laptop GPU:
201 202 ~ 202 fps
NVIDIA RTX 2000 Ada Generation Laptop GPU:
191.1 192.1 ~ 192 fps
NVIDIA RTX 2000 Ada Generation Laptop GPU:
142.1 147 ~ 145 fps
NVIDIA RTX 2000 Ada Generation Laptop GPU:
44.4 49.2 ~ 47 fps
NVIDIA RTX 2000 Ada Generation Laptop GPU:
27.6 31.6 ~ 30 fps
NVIDIA RTX 2000 Ada Generation Laptop GPU:
49 fps
NVIDIA RTX 2000 Ada Generation Laptop GPU:
45 fps
NVIDIA RTX 2000 Ada Generation Laptop GPU:
42 fps
NVIDIA RTX 2000 Ada Generation Laptop GPU:
40 fps
NVIDIA RTX 2000 Ada Generation Laptop GPU:
27 fps
NVIDIA RTX 2000 Ada Generation Laptop GPU:
101 fps
NVIDIA RTX 2000 Ada Generation Laptop GPU:
80 fps
NVIDIA RTX 2000 Ada Generation Laptop GPU:
64 fps
NVIDIA RTX 2000 Ada Generation Laptop GPU:
53 fps
NVIDIA RTX 2000 Ada Generation Laptop GPU:
38 fps
NVIDIA RTX 2000 Ada Generation Laptop GPU:
166.7 [X] HP ZBook Power 15 G10 959964
AMD Ryzen 7 PRO 7840HS 3.8GHz
NVIDIA RTX 2000 Ada Generation Laptop GPU
min:
143 fps, P1:
98 fps, max:
207 fps
213 ~ 190 fps
NVIDIA RTX 2000 Ada Generation Laptop GPU:
151.8 [X] HP ZBook Power 15 G10 959964
AMD Ryzen 7 PRO 7840HS 3.8GHz
NVIDIA RTX 2000 Ada Generation Laptop GPU
min:
137 fps, P1:
92 fps, max:
171 fps
193.2 ~ 173 fps
NVIDIA RTX 2000 Ada Generation Laptop GPU:
119.9 [X] HP ZBook Power 15 G10 959964
AMD Ryzen 7 PRO 7840HS 3.8GHz
NVIDIA RTX 2000 Ada Generation Laptop GPU
min:
104 fps, P1:
74 fps, max:
129 fps
138.5 ~ 129 fps
NVIDIA RTX 2000 Ada Generation Laptop GPU:
44.2 [X] HP ZBook Power 15 G10 959964
AMD Ryzen 7 PRO 7840HS 3.8GHz
NVIDIA RTX 2000 Ada Generation Laptop GPU
min:
38 fps, P1:
37 fps, max:
51 fps
52.8 ~ 49 fps
NVIDIA RTX 2000 Ada Generation Laptop GPU:
28.9 [X] HP ZBook Power 15 G10 959964
AMD Ryzen 7 PRO 7840HS 3.8GHz
NVIDIA RTX 2000 Ada Generation Laptop GPU
min:
24 fps, P1:
24 fps, max:
33 fps
34.2 ~ 32 fps
NVIDIA RTX 2000 Ada Generation Laptop GPU:
119.8 fps
UHD Graphics (Jasper Lake 32 EU):
5.4 fps
NVIDIA RTX 2000 Ada Generation Laptop GPU:
110.5 fps
UHD Graphics (Jasper Lake 32 EU):
6.6 fps
NVIDIA RTX 2000 Ada Generation Laptop GPU:
77.3 fps
UHD Graphics (Jasper Lake 32 EU):
4.3 fps
NVIDIA RTX 2000 Ada Generation Laptop GPU:
62.3 fps
NVIDIA RTX 2000 Ada Generation Laptop GPU:
43.5 fps
NVIDIA RTX 2000 Ada Generation Laptop GPU:
101 fps
NVIDIA RTX 2000 Ada Generation Laptop GPU:
81 fps
NVIDIA RTX 2000 Ada Generation Laptop GPU:
72 fps
NVIDIA RTX 2000 Ada Generation Laptop GPU:
65 fps
NVIDIA RTX 2000 Ada Generation Laptop GPU:
41 fps
UHD Graphics (Jasper Lake 32 EU):
20.5 [X] Acer Swift 1 SF114-34-P91A Intel Pentium Silver N6000 1.1GHz
UHD Graphics (Jasper Lake 32 EU)
min:
3.75 fps, P0.1:
3.92 fps, P1:
7.13 fps, max:
56.6 fps
fps
UHD Graphics (Jasper Lake 32 EU):
12.8 [X] Acer Swift 1 SF114-34-P91A Intel Pentium Silver N6000 1.1GHz
UHD Graphics (Jasper Lake 32 EU)
min:
1.994 fps, P0.1:
2.09 fps, P1:
6.35 fps, max:
76.3 fps
fps
NVIDIA RTX 2000 Ada Generation Laptop GPU:
157 fps
NVIDIA RTX 2000 Ada Generation Laptop GPU:
121 fps
NVIDIA RTX 2000 Ada Generation Laptop GPU:
104 fps
NVIDIA RTX 2000 Ada Generation Laptop GPU:
87 fps
NVIDIA RTX 2000 Ada Generation Laptop GPU:
63 fps
UHD Graphics (Jasper Lake 32 EU):
10.6 [X] Acer Swift 1 SF114-34-P91A Intel Pentium Silver N6000 1.1GHz
UHD Graphics (Jasper Lake 32 EU)
min:
5.85 fps, P0.1:
5.92 fps, P1:
6.3 fps, max:
13.4 fps
fps
UHD Graphics (Jasper Lake 32 EU):
17 fps
NVIDIA RTX 2000 Ada Generation Laptop GPU:
353 fps
UHD Graphics (Jasper Lake 32 EU):
37.6 [X] Intel NUC11ATKPE, N6005 874931
Intel Pentium Silver N6005 2GHz
UHD Graphics (Jasper Lake 32 EU)
min:
8 fps, P1:
22 fps, max:
45 fps
fps
NVIDIA RTX 2000 Ada Generation Laptop GPU:
230 fps
UHD Graphics (Jasper Lake 32 EU):
15.8 [X] Intel NUC11ATKPE, N6005 874931
Intel Pentium Silver N6005 2GHz
UHD Graphics (Jasper Lake 32 EU)
min:
6 fps, P1:
10 fps, max:
18 fps
fps
NVIDIA RTX 2000 Ada Generation Laptop GPU:
186.6 fps
UHD Graphics (Jasper Lake 32 EU):
12.7 [X] Intel NUC11ATKPE, N6005 874931
Intel Pentium Silver N6005 2GHz
UHD Graphics (Jasper Lake 32 EU)
min:
7 fps, P1:
8 fps, max:
14 fps
fps
NVIDIA RTX 2000 Ada Generation Laptop GPU:
99.2 fps
NVIDIA RTX 2000 Ada Generation Laptop GPU:
74.9 fps
UHD Graphics (Jasper Lake 32 EU):
18.8 [X] Acer Swift 1 SF114-34-P91A Intel Pentium Silver N6000 1.1GHz
UHD Graphics (Jasper Lake 32 EU)
min:
8.88 fps, P0.1:
9.34 fps, P1:
12.5 fps, max:
30.4 fps
fps
UHD Graphics (Jasper Lake 32 EU):
4.4 [X] Acer Swift 1 SF114-34-P91A Intel Pentium Silver N6000 1.1GHz
UHD Graphics (Jasper Lake 32 EU)
min:
0.2191 fps, P0.1:
0.2642 fps, P1:
2.65 fps, max:
9.85 fps
fps
UHD Graphics (Jasper Lake 32 EU):
6.8 [X] Acer Swift 1 SF114-34-P91A Intel Pentium Silver N6000 1.1GHz
UHD Graphics (Jasper Lake 32 EU)
min:
1.009 fps, P0.1:
1.192 fps, P1:
2.33 fps, max:
32.1 fps
fps
UHD Graphics (Jasper Lake 32 EU):
15.3 [X] Acer Swift 1 SF114-34-P91A 759689
Intel Pentium Silver N6000 1.1GHz
UHD Graphics (Jasper Lake 32 EU)
min:
11 fps, max:
18 fps
30.8 ~ 23 fps
UHD Graphics (Jasper Lake 32 EU):
14.7 fps
UHD Graphics (Jasper Lake 32 EU):
10.5 fps
UHD Graphics (Jasper Lake 32 EU):
6.4 fps
UHD Graphics (Jasper Lake 32 EU):
4.1 [X] Acer Swift 1 SF114-34-P91A Intel Pentium Silver N6000 1.1GHz
UHD Graphics (Jasper Lake 32 EU)
19.2 ~ 12 fps
UHD Graphics (Jasper Lake 32 EU):
8 fps
UHD Graphics (Jasper Lake 32 EU):
4.7 fps
UHD Graphics (Jasper Lake 32 EU):
5.2 [X] Acer Swift 1 SF114-34-P91A Intel Pentium Silver N6000 1.1GHz
UHD Graphics (Jasper Lake 32 EU)
min:
1.096 fps, P0.1:
1.138 fps, P1:
1.517 fps, max:
29.2 fps
fps
NVIDIA RTX 2000 Ada Generation Laptop GPU:
332 [X] HP ZBook Power 15 G10 1.47.22.14 D3D12
AMD Ryzen 7 PRO 7840HS 3.8GHz
NVIDIA RTX 2000 Ada Generation Laptop GPU
min:
112.3 fps, P1:
251 fps, max:
511 fps
408 459 ~ 400 fps
UHD Graphics (Jasper Lake 32 EU):
15.6 [X] Acer Swift 1 SF114-34-P6U1 1.47.22.14 D3D12
Intel Pentium Silver N6000 1.1GHz
UHD Graphics (Jasper Lake 32 EU)
min:
5 fps, P1:
5.74 fps, max:
111 fps
16.3 [X] Lenovo V14 G2 IJL-82QX002LGE 1.47.22.14 D3D12
Intel Pentium Silver N6000 1.1GHz
UHD Graphics (Jasper Lake 32 EU)
min:
5 fps, P1:
6.47 fps, max:
112.8 fps
18.7 [X] Lenovo V14 G2 IJL-82QX002LGE 1.47.22.14 D3D12
Intel Pentium Silver N6000 1.1GHz
UHD Graphics (Jasper Lake 32 EU)
min:
5 fps, P1:
7.25 fps, max:
124.4 fps
20.3 [X] Acer Swift 1 SF114-34-P91A 1.47.22.14 D3D12, 8 GB RAM, Dual-Channel
Intel Pentium Silver N6000 1.1GHz
UHD Graphics (Jasper Lake 32 EU)
min:
5 fps, P1:
5.9 fps, max:
122 fps
32 [X] Intel NUC11ATKPE, N6005 1.47.22.14 D3D12
Intel Pentium Silver N6005 2GHz
UHD Graphics (Jasper Lake 32 EU)
min:
7.4 fps, P1:
8.56 fps, max:
212 fps
~ 21 fps
NVIDIA RTX 2000 Ada Generation Laptop GPU:
183 [X] HP ZBook Power 15 G10 1.47.22.14 D3D12
AMD Ryzen 7 PRO 7840HS 3.8GHz
NVIDIA RTX 2000 Ada Generation Laptop GPU
min:
88.1 fps, P1:
152.3 fps, max:
359 fps
228 231 ~ 214 fps
UHD Graphics (Jasper Lake 32 EU):
8.2 [X] Acer Swift 1 SF114-34-P91A 1.47.22.14 D3D12, 8 GB RAM, Dual-Channel
Intel Pentium Silver N6000 1.1GHz
UHD Graphics (Jasper Lake 32 EU)
min:
5 fps, P1:
5 fps, max:
106 fps
9.7 12.1 [X] Intel NUC11ATKPE, N6005 1.47.22.14 D3D12
Intel Pentium Silver N6005 2GHz
UHD Graphics (Jasper Lake 32 EU)
min:
5 fps, P1:
5.25 fps, max:
166.6 fps
~ 10 fps
NVIDIA RTX 2000 Ada Generation Laptop GPU:
148.4 [X] HP ZBook Power 15 G10 1.47.22.14 D3D12
AMD Ryzen 7 PRO 7840HS 3.8GHz
NVIDIA RTX 2000 Ada Generation Laptop GPU
min:
37.9 fps, P1:
110.3 fps, max:
328 fps
182.5 184.2 ~ 172 fps
UHD Graphics (Jasper Lake 32 EU):
7.7 10.2 [X] Intel NUC11ATKPE, N6005 1.47.22.14 D3D12
Intel Pentium Silver N6005 2GHz
UHD Graphics (Jasper Lake 32 EU)
min:
5 fps, P1:
5 fps, max:
152.8 fps
~ 9 fps
NVIDIA RTX 2000 Ada Generation Laptop GPU:
132.5 [X] HP ZBook Power 15 G10 1.47.22.14 D3D12
AMD Ryzen 7 PRO 7840HS 3.8GHz
NVIDIA RTX 2000 Ada Generation Laptop GPU
min:
80.3 fps, P1:
100.2 fps, max:
303 fps
158.2 158.4 ~ 150 fps
UHD Graphics (Jasper Lake 32 EU):
13.3 [X] Intel NUC11ATKPE, N6005 1.47.22.14 D3D12
Intel Pentium Silver N6005 2GHz
UHD Graphics (Jasper Lake 32 EU)
min:
5 fps, P1:
5 fps, max:
165.8 fps
fps
NVIDIA RTX 2000 Ada Generation Laptop GPU:
94.1 [X] HP ZBook Power 15 G10 1.47.22.14 D3D12
AMD Ryzen 7 PRO 7840HS 3.8GHz
NVIDIA RTX 2000 Ada Generation Laptop GPU
min:
60.9 fps, P1:
75.7 fps, max:
170 fps
103.9 107.5 ~ 102 fps
NVIDIA RTX 2000 Ada Generation Laptop GPU:
151 [X] HP ZBook Power 15 G10 AMD Ryzen 7 PRO 7840HS 3.8GHz
NVIDIA RTX 2000 Ada Generation Laptop GPU
min:
105 fps, max:
196 fps
175 ~ 163 fps
UHD Graphics (Jasper Lake 32 EU):
3 fps
NVIDIA RTX 2000 Ada Generation Laptop GPU:
110 [X] HP ZBook Power 15 G10 AMD Ryzen 7 PRO 7840HS 3.8GHz
NVIDIA RTX 2000 Ada Generation Laptop GPU
min:
96 fps, max:
127 fps
130 ~ 120 fps
UHD Graphics (Jasper Lake 32 EU):
1 fps
NVIDIA RTX 2000 Ada Generation Laptop GPU:
102 [X] HP ZBook Power 15 G10 AMD Ryzen 7 PRO 7840HS 3.8GHz
NVIDIA RTX 2000 Ada Generation Laptop GPU
min:
92 fps, max:
123 fps
120 ~ 111 fps
UHD Graphics (Jasper Lake 32 EU):
1 fps
NVIDIA RTX 2000 Ada Generation Laptop GPU:
95 [X] HP ZBook Power 15 G10 AMD Ryzen 7 PRO 7840HS 3.8GHz
NVIDIA RTX 2000 Ada Generation Laptop GPU
min:
86 fps, max:
111 fps
113 ~ 104 fps
UHD Graphics (Jasper Lake 32 EU):
1 fps
NVIDIA RTX 2000 Ada Generation Laptop GPU:
63 [X] HP ZBook Power 15 G10 AMD Ryzen 7 PRO 7840HS 3.8GHz
NVIDIA RTX 2000 Ada Generation Laptop GPU
min:
56 fps, max:
76 fps
81 ~ 72 fps
UHD Graphics (Jasper Lake 32 EU):
91.2 [X] Acer Swift 1 SF114-34-P91A Intel Pentium Silver N6000 1.1GHz
UHD Graphics (Jasper Lake 32 EU)
min:
7.34 fps, P0.1:
29 fps, P1:
42 fps, max:
341 fps
fps
UHD Graphics (Jasper Lake 32 EU):
13.3 [X] Acer Swift 1 SF114-34-P91A Intel Pentium Silver N6000 1.1GHz
UHD Graphics (Jasper Lake 32 EU)
min:
3.93 fps, P0.1:
5.58 fps, P1:
7.49 fps, max:
102 fps
fps
UHD Graphics (Jasper Lake 32 EU):
14.2 15.2 16.1 17.3 [X] Acer Swift 1 SF114-34-P91A 8 GB RAM, Dual-Channel
Intel Pentium Silver N6000 1.1GHz
UHD Graphics (Jasper Lake 32 EU)
20 21 [X] Newsmay AC8 (16 GB RAM) Intel Pentium Silver N6005 2GHz
UHD Graphics (Jasper Lake 32 EU)
23.4 ~ 18 fps
NVIDIA RTX 2000 Ada Generation Laptop GPU:
73 131.6 133.5 ~ 113 fps
UHD Graphics (Jasper Lake 32 EU):
0 (!) [X] Lenovo V14 G2 IJL-82QX002LGE Absturz
Intel Pentium Silver N6000 1.1GHz
UHD Graphics (Jasper Lake 32 EU)
10.2 10.2 [X] Acer Swift 1 SF114-34-P91A 8 GB RAM, Dual-Channel
Intel Pentium Silver N6000 1.1GHz
UHD Graphics (Jasper Lake 32 EU)
11.4 12.4 14.5 [X] Newsmay AC8 (16 GB RAM) Intel Pentium Silver N6005 2GHz
UHD Graphics (Jasper Lake 32 EU)
15.9 ~ 11 fps
UHD Graphics (Jasper Lake 32 EU):
8.9 [X] Acer Swift 1 SF114-34-P91A 8 GB RAM, Dual-Channel
Intel Pentium Silver N6000 1.1GHz
UHD Graphics (Jasper Lake 32 EU)
9 9.1 10.5 12.5 13.2 [X] Newsmay AC8 (16 GB RAM) Intel Pentium Silver N6005 2GHz
UHD Graphics (Jasper Lake 32 EU)
14.6 ~ 11 fps
NVIDIA RTX 2000 Ada Generation Laptop GPU:
173.3 199.2 ~ 186 fps
UHD Graphics (Jasper Lake 32 EU):
5.3 5.4 9 [X] Acer Swift 1 SF114-34-P91A 1.3, 8 GB RAM, Dual-Channel
Intel Pentium Silver N6000 1.1GHz
UHD Graphics (Jasper Lake 32 EU)
10.7 12.4 [X] Newsmay AC8 (16 GB RAM) 1.3
Intel Pentium Silver N6005 2GHz
UHD Graphics (Jasper Lake 32 EU)
14.3 ~ 10 fps
UHD Graphics (Jasper Lake 32 EU):
1.9 3 4.5 [X] Acer Swift 1 SF114-34-P91A 1.3, 8 GB RAM, Dual-Channel
Intel Pentium Silver N6000 1.1GHz
UHD Graphics (Jasper Lake 32 EU)
5 5.8 [X] Newsmay AC8 (16 GB RAM) 1.3
Intel Pentium Silver N6005 2GHz
UHD Graphics (Jasper Lake 32 EU)
6.7 ~ 4 fps
NVIDIA RTX 2000 Ada Generation Laptop GPU:
67.7 83.5 84.2 ~ 78 fps
UHD Graphics (Jasper Lake 32 EU):
0.8 2 4.6 ~ 2 fps
NVIDIA RTX 2000 Ada Generation Laptop GPU:
50.3 61.3 63.7 ~ 58 fps
NVIDIA RTX 2000 Ada Generation Laptop GPU:
155 [X] HP ZBook Power 15 G10 AMD Ryzen 7 PRO 7840HS 3.8GHz
NVIDIA RTX 2000 Ada Generation Laptop GPU
min:
138.6 fps, max:
-1 fps
178.4 188.2 ~ 174 fps
UHD Graphics (Jasper Lake 32 EU):
35.2 48.1 50.1 53.1 [X] Acer Swift 1 SF114-34-P91A 8 GB RAM, Dual-Channel
Intel Pentium Silver N6000 1.1GHz
UHD Graphics (Jasper Lake 32 EU)
min:
45.8 fps, max:
-1 fps
54 [X] Newsmay AC8 N6005 Intel Pentium Silver N6005 2GHz
UHD Graphics (Jasper Lake 32 EU)
min:
46.5 fps, max:
-1 fps
67.9 [X] Newsmay AC8 (16 GB RAM) Intel Pentium Silver N6005 2GHz
UHD Graphics (Jasper Lake 32 EU)
min:
54.9 fps, max:
-1 fps
79.8 ~ 55 fps
UHD Graphics (Jasper Lake 32 EU):
16.4 21.5 22.4 [X] Acer Swift 1 SF114-34-P91A 8 GB RAM, Dual-Channel
Intel Pentium Silver N6000 1.1GHz
UHD Graphics (Jasper Lake 32 EU)
min:
14.8 fps, max:
-1 fps
22.4 [X] Newsmay AC8 N6005 Intel Pentium Silver N6005 2GHz
UHD Graphics (Jasper Lake 32 EU)
min:
18 fps, max:
-1 fps
23.5 [X] Newsmay AC8 (16 GB RAM) Intel Pentium Silver N6005 2GHz
UHD Graphics (Jasper Lake 32 EU)
min:
15.7 fps, max:
-1 fps
26.9 27.8 ~ 23 fps
UHD Graphics (Jasper Lake 32 EU):
8.9 10.8 11.1 [X] Acer Swift 1 SF114-34-P91A 8 GB RAM, Dual-Channel
Intel Pentium Silver N6000 1.1GHz
UHD Graphics (Jasper Lake 32 EU)
min:
8.9 fps, max:
-1 fps
12.8 [X] Newsmay AC8 N6005 Intel Pentium Silver N6005 2GHz
UHD Graphics (Jasper Lake 32 EU)
min:
10.2 fps, max:
-1 fps
14.9 15.8 [X] Newsmay AC8 (16 GB RAM) Intel Pentium Silver N6005 2GHz
UHD Graphics (Jasper Lake 32 EU)
min:
12.8 fps, max:
-1 fps
19.5 ~ 13 fps
NVIDIA RTX 2000 Ada Generation Laptop GPU:
132 [X] HP ZBook Power 15 G10 AMD Ryzen 7 PRO 7840HS 3.8GHz
NVIDIA RTX 2000 Ada Generation Laptop GPU
min:
115.8 fps, max:
-1 fps
133.4 150.2 ~ 139 fps
UHD Graphics (Jasper Lake 32 EU):
8.3 8.4 10.4 [X] Acer Swift 1 SF114-34-P91A 8 GB RAM, Dual-Channel
Intel Pentium Silver N6000 1.1GHz
UHD Graphics (Jasper Lake 32 EU)
min:
7.5 fps, max:
-1 fps
11.5 [X] Newsmay AC8 N6005 Intel Pentium Silver N6005 2GHz
UHD Graphics (Jasper Lake 32 EU)
min:
9.5 fps, max:
-1 fps
13.8 14.4 [X] Newsmay AC8 (16 GB RAM) Intel Pentium Silver N6005 2GHz
UHD Graphics (Jasper Lake 32 EU)
min:
11.7 fps, max:
-1 fps
18.3 ~ 12 fps
NVIDIA RTX 2000 Ada Generation Laptop GPU:
336.4 [X] HP ZBook Power 15 G10 AMD Ryzen 7 PRO 7840HS 3.8GHz
NVIDIA RTX 2000 Ada Generation Laptop GPU
min:
296 fps, max:
364 fps
390 424 ~ 383 fps
UHD Graphics (Jasper Lake 32 EU):
8.4 11.3 [X] Acer Swift 1 SF114-34-P6U1 Intel Pentium Silver N6000 1.1GHz
UHD Graphics (Jasper Lake 32 EU)
min:
0.541 fps, P0.1:
0.623 fps, P1:
3.17 fps, max:
24.9 fps
20.1 ~ 13 fps
NVIDIA RTX 2000 Ada Generation Laptop GPU:
219 [X] HP ZBook Power 15 G10 AMD Ryzen 7 PRO 7840HS 3.8GHz
NVIDIA RTX 2000 Ada Generation Laptop GPU
min:
202 fps, max:
234 fps
261 291 ~ 257 fps
UHD Graphics (Jasper Lake 32 EU):
7.8 9.2 [X] Acer Swift 1 SF114-34-P6U1 Intel Pentium Silver N6000 1.1GHz
UHD Graphics (Jasper Lake 32 EU)
min:
2.52 fps, P0.1:
3.29 fps, P1:
4.52 fps, max:
30.8 fps
10 ~ 9 fps
NVIDIA RTX 2000 Ada Generation Laptop GPU:
127.9 [X] HP ZBook Power 15 G10 AMD Ryzen 7 PRO 7840HS 3.8GHz
NVIDIA RTX 2000 Ada Generation Laptop GPU
min:
111 fps, max:
139 fps
164 184.5 ~ 159 fps
UHD Graphics (Jasper Lake 32 EU):
3.5 4.8 [X] Acer Swift 1 SF114-34-P6U1 Intel Pentium Silver N6000 1.1GHz
UHD Graphics (Jasper Lake 32 EU)
min:
2.06 fps, P0.1:
2.13 fps, P1:
2.23 fps, max:
43.3 fps
~ 4 fps
NVIDIA RTX 2000 Ada Generation Laptop GPU:
65.5 [X] HP ZBook Power 15 G10 AMD Ryzen 7 PRO 7840HS 3.8GHz
NVIDIA RTX 2000 Ada Generation Laptop GPU
min:
61 fps, max:
72 fps
79.6 95.6 ~ 80 fps
UHD Graphics (Jasper Lake 32 EU):
2.4 [X] Acer Swift 1 SF114-34-P6U1 Intel Pentium Silver N6000 1.1GHz
UHD Graphics (Jasper Lake 32 EU)
min:
1.04 fps, P0.1:
1.063 fps, P1:
1.161 fps, max:
29 fps
2.7 ~ 3 fps
NVIDIA RTX 2000 Ada Generation Laptop GPU:
65 fps
NVIDIA RTX 2000 Ada Generation Laptop GPU:
176.3 178.1 [X] HP ZBook Power 15 G10 AMD Ryzen 7 PRO 7840HS 3.8GHz
NVIDIA RTX 2000 Ada Generation Laptop GPU
min:
3.76 fps, P1:
125 fps, max:
365 fps
185.2 ~ 180 fps
UHD Graphics (Jasper Lake 32 EU):
6.6 11.4 15.2 17.4 [X] Acer Swift 1 SF114-34-P91A 8 GB RAM, Dual-Channel
Intel Pentium Silver N6000 1.1GHz
UHD Graphics (Jasper Lake 32 EU)
min:
1.897 fps, P1:
8.77 fps, max:
33.6 fps
26 26.8 [X] Intel NUC11ATKPE, N6005 Intel Pentium Silver N6005 2GHz
UHD Graphics (Jasper Lake 32 EU)
min:
3.73 fps, P1:
14.7 fps, max:
49.5 fps
~ 17 fps
NVIDIA RTX 2000 Ada Generation Laptop GPU:
170.6 [X] HP ZBook Power 15 G10 AMD Ryzen 7 PRO 7840HS 3.8GHz
NVIDIA RTX 2000 Ada Generation Laptop GPU
min:
3.86 fps, P1:
111.1 fps, max:
347 fps
173.4 181.3 ~ 175 fps
NVIDIA RTX 2000 Ada Generation Laptop GPU:
157.7 [X] HP ZBook Power 15 G10 AMD Ryzen 7 PRO 7840HS 3.8GHz
NVIDIA RTX 2000 Ada Generation Laptop GPU
min:
4.55 fps, P1:
111.1 fps, max:
325 fps
163.6 171.9 173 ~ 167 fps
UHD Graphics (Jasper Lake 32 EU):
3.4 [X] Acer Swift 1 SF114-34-P91A 8 GB RAM, Dual-Channel
Intel Pentium Silver N6000 1.1GHz
UHD Graphics (Jasper Lake 32 EU)
min:
1.062 fps, P1:
1.706 fps, max:
10.9 fps
3.5 10.8 [X] Intel NUC11ATKPE, N6005 Intel Pentium Silver N6005 2GHz
UHD Graphics (Jasper Lake 32 EU)
min:
3.78 fps, P1:
7.94 fps, max:
17.3 fps
~ 6 fps
NVIDIA RTX 2000 Ada Generation Laptop GPU:
86.2 [X] HP ZBook Power 15 G10 AMD Ryzen 7 PRO 7840HS 3.8GHz
NVIDIA RTX 2000 Ada Generation Laptop GPU
min:
7.39 fps, P1:
55.6 fps, max:
153.8 fps
98 101.6 ~ 95 fps
NVIDIA RTX 2000 Ada Generation Laptop GPU:
60.6 [X] HP ZBook Power 15 G10 AMD Ryzen 7 PRO 7840HS 3.8GHz
NVIDIA RTX 2000 Ada Generation Laptop GPU
min:
9.07 fps, P1:
41.7 fps, max:
122.1 fps
69 74.6 76.8 ~ 70 fps
UHD Graphics (Jasper Lake 32 EU):
71.2 [X] Acer Swift 1 SF114-34-P91A Intel Pentium Silver N6000 1.1GHz
UHD Graphics (Jasper Lake 32 EU)
min:
12.1 fps, P0.1:
14.8 fps, P1:
32.1 fps, max:
164 fps
fps
UHD Graphics (Jasper Lake 32 EU):
18.3 [X] Acer Swift 1 SF114-34-P91A Intel Pentium Silver N6000 1.1GHz
UHD Graphics (Jasper Lake 32 EU)
min:
3.59 fps, P0.1:
4.17 fps, P1:
6.31 fps, max:
57.2 fps
fps
UHD Graphics (Jasper Lake 32 EU):
35 [X] Acer Swift 1 SF114-34-P91A Intel Pentium Silver N6000 1.1GHz
UHD Graphics (Jasper Lake 32 EU)
fps
UHD Graphics (Jasper Lake 32 EU):
20.6 [X] Acer Swift 1 SF114-34-P91A Intel Pentium Silver N6000 1.1GHz
UHD Graphics (Jasper Lake 32 EU)
fps
UHD Graphics (Jasper Lake 32 EU):
15.5 [X] Acer Swift 1 SF114-34-P91A Intel Pentium Silver N6000 1.1GHz
UHD Graphics (Jasper Lake 32 EU)
fps
UHD Graphics (Jasper Lake 32 EU):
106 [X] Acer Swift 1 SF114-34-P91A Intel Pentium Silver N6000 1.1GHz
UHD Graphics (Jasper Lake 32 EU)
min:
5.32 fps, P0.1:
12.3 fps, P1:
53.3 fps, max:
201 fps
fps
UHD Graphics (Jasper Lake 32 EU):
15.3 [X] Acer Swift 1 SF114-34-P91A Intel Pentium Silver N6000 1.1GHz
UHD Graphics (Jasper Lake 32 EU)
min:
2.09 fps, P0.1:
2.17 fps, P1:
2.88 fps, max:
49.3 fps
fps
UHD Graphics (Jasper Lake 32 EU):
45.4 [X] Acer Swift 1 SF114-34-P91A Intel Pentium Silver N6000 1.1GHz
UHD Graphics (Jasper Lake 32 EU)
min:
32 fps, max:
58 fps
fps
UHD Graphics (Jasper Lake 32 EU):
25.5 [X] Acer Swift 1 SF114-34-P91A Intel Pentium Silver N6000 1.1GHz
UHD Graphics (Jasper Lake 32 EU)
min:
19.4 fps, max:
29.1 fps
fps
UHD Graphics (Jasper Lake 32 EU):
16.1 [X] Acer Swift 1 SF114-34-P91A Intel Pentium Silver N6000 1.1GHz
UHD Graphics (Jasper Lake 32 EU)
min:
12.8 fps, max:
19.4 fps
fps
UHD Graphics (Jasper Lake 32 EU):
44.6 [X] Acer Swift 1 SF114-34-P91A Intel Pentium Silver N6000 1.1GHz
UHD Graphics (Jasper Lake 32 EU)
min:
19.5 fps, P0.1:
23.8 fps, P1:
31.6 fps, max:
56.9 fps
fps
UHD Graphics (Jasper Lake 32 EU):
32.6 [X] Acer Swift 1 SF114-34-P91A Intel Pentium Silver N6000 1.1GHz
UHD Graphics (Jasper Lake 32 EU)
min:
14.7 fps, P0.1:
19.1 fps, P1:
24.4 fps, max:
44.2 fps
fps
UHD Graphics (Jasper Lake 32 EU):
21.4 [X] Acer Swift 1 SF114-34-P91A Intel Pentium Silver N6000 1.1GHz
UHD Graphics (Jasper Lake 32 EU)
min:
3.87 fps, P0.1:
4.39 fps, P1:
10.6 fps, max:
37.1 fps
fps
UHD Graphics (Jasper Lake 32 EU):
14.9 [X] Acer Swift 1 SF114-34-P91A Intel Pentium Silver N6000 1.1GHz
UHD Graphics (Jasper Lake 32 EU)
min:
3.85 fps, P0.1:
3.97 fps, P1:
10.1 fps, max:
32.9 fps
fps
NVIDIA RTX 2000 Ada Generation Laptop GPU low med. high ultra QHD 4K Assassin's Creed Mirage 113 103 97 76 58 Cyberpunk 2077 2.1 Phantom Liberty 85.4 64.5 55.2 48.3 29.9 F1 23 202 192 145 47 30 Star Wars Jedi Survivor 49 45 42 40 27 Hogwarts Legacy 101 80 64 53 38 F1 22 190 173 129 49 32 Tiny Tina's Wonderlands 119.8 110.5 77.3 62.3 43.5 Cyberpunk 2077 1.6 101 81 72 65 41 Far Cry 6 157 121 104 87 63 F1 2021 353 230 186.6 99.2 74.9 Strange Brigade 400 214 172 150 102 Far Cry 5 163 120 111 104 72 X-Plane 11.11 129 113 88 Final Fantasy XV Benchmark 186 108 78 58 Dota 2 Reborn 174 154 147 139 The Witcher 3 383 257 159 80 65 GTA V 180 175 167 95 70 < 30 fps < 60 fps < 120 fps ≥ 120 fps 1 5 11 1 7 9 2 8 7 5 8 2 2 7 6
For more games that might be playable and a list of all games and graphics cards visit our Gaming List
v1.27
log 09. 12:51:32
#0 checking url part for id 10408 +0s ... 0s
#1 checking url part for id 11601 +0s ... 0s
#2 checking url part for id 10640 +0s ... 0s
#3 not redirecting to Ajax server +0s ... 0s
#4 did not recreate cache, as it is less than 5 days old! Created at Fri, 07 Jun 2024 05:42:36 +0200 +0.001s ... 0.001s
#5 composed specs +0.146s ... 0.147s
#6 did output specs +0s ... 0.147s
#7 start showIntegratedCPUs +0s ... 0.147s
#8 getting avg benchmarks for device 10408 +0.038s ... 0.185s
#9 got single benchmarks 10408 +0.005s ... 0.191s
#10 getting avg benchmarks for device 11601 +0.002s ... 0.192s
#11 got single benchmarks 11601 +0.019s ... 0.211s
#12 getting avg benchmarks for device 10640 +0.02s ... 0.231s
#13 got single benchmarks 10640 +0.024s ... 0.255s
#14 got avg benchmarks for devices +0s ... 0.255s
#15 min, max, avg, median took s +0.406s ... 0.661s
#16 before gaming benchmark output +0s ... 0.661s
#17 Got 318 rows for game benchmarks. +0.09s ... 0.751s
#18 composed SQL query for gamebenchmarks +0s ... 0.751s
#19 got data and put it in $dataArray +0.022s ... 0.773s
#20 benchmarks composed for output. +0.076s ... 0.849s
#21 calculated avg scores. +0s ... 0.849s
#22 return log +0.002s ... 0.851s
Please share our article, every link counts!
Redaktion, 2017-09- 8 (Update: 2023-07- 1)
 Deutsch
 English
 Español
 Français
 Italiano
 Nederlands
 Polski
 Português
 Русский
 Türkçe
 Svenska
 Chinese
 Magyar