

NVIDIA GeForce GTX 750 Ti vs NVIDIA GeForce 920MX
NVIDIA GeForce GTX 750 Ti
► remove from comparison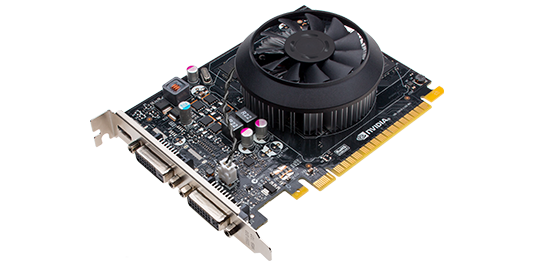
The NVIDIA GeForce GTX 750 Ti is a mid-range desktop graphics card that was announced early 2014. It is based on the first generation of the Maxwell architecture, namely the GM107 chip. Maxwell sets its focus on energy efficiency and was able to outperform the predecessor Kepler and AMD chips in similar performance regions. The GTX 750 Ti supports DirectX 11.2 but only feature level 11_0.
The GeForce GTX 750 Ti is comparable to the Nvidia Geforce GTX 860M for laptops that features the same chip with slightly slower clock rates and therefore also performance.
The 3D performance lies between the Radeon R7 260X and R7 265X from AMD or between the GTX 750 and GTX 660 from Nvidia. In our tests, the 750 Ti was not able to achieve playable framerates in demanding games and highest settings in 1920x1080 (see benchmarks below).
The power consumption as already mentioned is a strong suite for the GTX 750 Ti and it excels the e.g. slightly slower Radeon R7 260X by a great margin (gaming).
NVIDIA GeForce 920MX
► remove from comparison
The Nvidia GeForce 920MX is an entry-level graphics card for laptops that was launched in the first quarter of 2016. In comparison to the older 920M, the 920MX is now be based on the modern Maxwell chip of the 930MX but with a reduced shader count of 265 (GM108). According to our sources the TDP of 5-12 Watt and the support for DDR3 and GDDR5 is also specified.
The performance depends on the used graphics memory. The DDR3 version was slightly slower than an average GeForce 930M in our tests (and definitely faster than the GeForce 920M). The GDDR5 version could therefore best the 930M slightly. However, both versions are not suited for demanding games of 2017. Less demanding games, like The Sims 4, should be playable in medium to high settings (see below for benchmarks).
Thanks to the low power consumption, the GeForce 920MX is also suited for thin and light laptops.
| NVIDIA GeForce GTX 750 Ti | NVIDIA GeForce 920MX | |||||||||||||||||||||||||||||||||||||
| GeForce 900M Series |
|
| ||||||||||||||||||||||||||||||||||||
| Codename | GM107 | N16V-GMR | ||||||||||||||||||||||||||||||||||||
| Architecture | Maxwell | Maxwell | ||||||||||||||||||||||||||||||||||||
| Pipelines | 640 - unified | 256 - unified | ||||||||||||||||||||||||||||||||||||
| Core Speed | 1020 - 1085 (Boost) MHz | 965 - 993 (Boost) MHz | ||||||||||||||||||||||||||||||||||||
| Memory Speed | 2700 MHz | 1800 MHz | ||||||||||||||||||||||||||||||||||||
| Memory Bus Width | 128 Bit | 64 Bit | ||||||||||||||||||||||||||||||||||||
| Memory Type | GDDR5 | DDR3, GDDR5 | ||||||||||||||||||||||||||||||||||||
| Max. Amount of Memory | 2048 MB | |||||||||||||||||||||||||||||||||||||
| Shared Memory | no | no | ||||||||||||||||||||||||||||||||||||
| API | DirectX 11.2, Shader 5.0, OpenGL 4.4 | DirectX 12, Shader 5.0, OpenGL 4.5 | ||||||||||||||||||||||||||||||||||||
| Power Consumption | 60 Watt | |||||||||||||||||||||||||||||||||||||
| Transistors | 1.9 Billion | |||||||||||||||||||||||||||||||||||||
| technology | 28 nm | 28 nm | ||||||||||||||||||||||||||||||||||||
| Features | 3D Vision, PhysX, CUDA, GPU Boost 2.0, GeForce Experience, Adaptive VSync | Optimus, PhysX, Verde Drivers, CUDA, 3D Vision, 3DTV Play, GameWorks | ||||||||||||||||||||||||||||||||||||
| Date of Announcement | 18.02.2014 | 25.03.2015 | ||||||||||||||||||||||||||||||||||||
| Link to Manufacturer Page | www.nvidia.de | www.geforce.com |
Benchmarks
3DM Vant. Perf. total + NVIDIA GeForce GTX 750 Ti
Cinebench R15 OpenGL 64 Bit + NVIDIA GeForce 920MX
GFXBench T-Rex HD Offscreen C24Z16 + NVIDIA GeForce 920MX
Average Benchmarks NVIDIA GeForce GTX 750 Ti → 100% n=11
Average Benchmarks NVIDIA GeForce 920MX → 34% n=11
* Smaller numbers mean a higher performance
1 This benchmark is not used for the average calculation
Game Benchmarks
The following benchmarks stem from our benchmarks of review laptops. The performance depends on the used graphics memory, clock rate, processor, system settings, drivers, and operating systems. So the results don't have to be representative for all laptops with this GPU. For detailed information on the benchmark results, click on the fps number.


Fortnite
2018


Call of Duty WWII
2017

Destiny 2
2017
ELEX
2017
The Evil Within 2
2017

FIFA 18
2017
F1 2017
2017
Team Fortress 2
2017Dirt 4
2017Rocket League
2017Prey
2017For Honor
2017
Resident Evil 7
2017
Titanfall 2
2016Farming Simulator 17
2016
Battlefield 1
2016
Civilization 6
2016

Overwatch
2016


Need for Speed 2016
2016
Hitman 2016
2016
The Division
2016
Far Cry Primal
2016


Rainbow Six Siege
2015
Just Cause 3
2015


FIFA 16
2015
World of Warships
2015
Metal Gear Solid V
2015
Dota 2 Reborn
2015

The Witcher 3
2015
Dirt Rally
2015
GTA V
2015
Battlefield Hardline
2015
F1 2014
2014
The Evil Within
2014
Ryse: Son of Rome
2014
Alien: Isolation
2014

Fifa 15
2014
Sims 4
2014
Risen 3: Titan Lords
2014
GRID: Autosport
2014
Watch Dogs
2014


Thief
2014
Call of Duty: Ghosts
2013
Battlefield 4
2013
Saints Row IV
2013
Dota 2
2013
GRID 2
2013
Metro: Last Light
2013BioShock Infinite
2013
Tomb Raider
2013Crysis 3
2013
Far Cry 3
2012
Hitman: Absolution
2012
Guild Wars 2
2012
Diablo III
2012

StarCraft 2
2010Average Gaming NVIDIA GeForce GTX 750 Ti → 100%
Average Gaming 30-70 fps → 100%
Average Gaming NVIDIA GeForce 920MX → 38%
Average Gaming 30-70 fps → 35%
| NVIDIA GeForce GTX 750 Ti | NVIDIA GeForce 920MX | |||||||||||||
|---|---|---|---|---|---|---|---|---|---|---|---|---|---|---|
| low | med. | high | ultra | QHD | 4K | low | med. | high | ultra | QHD | 4K | |||
| Kingdom Come: Deliverance | 23.8 | 9.6 | 8.1 | 5.9 | ||||||||||
| Final Fantasy XV Benchmark | 17.3 | 8.2 | 5 | |||||||||||
| Fortnite | 76.7 | 21.2 | 14.5 | 11.4 | ||||||||||
| Star Wars Battlefront 2 | 45.4 | 12.8 | 10.5 | 8.9 | ||||||||||
| Need for Speed Payback | 30.4 | 15.3 | 12.2 | 11.6 | ||||||||||
| Call of Duty WWII | 53.7 | 33.1 | 16.3 | 11.9 | ||||||||||
| Assassin´s Creed Origins | 22 | 10 | 8 | 6 | ||||||||||
| Destiny 2 | 43.6 | 25.9 | 23.6 | 18 | ||||||||||
| ELEX | 25.1 | 11.9 | 9.3 | 6.4 | ||||||||||
| The Evil Within 2 | 17.9 | 9.2 | 8.1 | 6.1 | ||||||||||
| Middle-earth: Shadow of War | 33 | 13 | 9 | 7 | ||||||||||
| FIFA 18 | 110.4 | 63.8 | 54.2 | 50 | ||||||||||
| F1 2017 | 41 | 18 | 15 | 13 | ||||||||||
| Team Fortress 2 | 86 | 81 | 69 | 54 | ||||||||||
| Dirt 4 | 62.4 | 25.2 | 13 | 7.9 | ||||||||||
| Rocket League | 121.5 | 43.7 | 29 | |||||||||||
| Prey | 58 | 22.3 | 17.5 | 14.3 | ||||||||||
| Ghost Recon Wildlands | 27.6 | 11.2 | 10 | 3 | ||||||||||
| For Honor | 46.7 | 16.3 | 15.4 | 11.5 | ||||||||||
| Resident Evil 7 | 56.4 | 26.5 | 13.9 | 6 | ||||||||||
| Titanfall 2 | 46.3 | 33.6 | 13.8 | 12 | ||||||||||
| Farming Simulator 17 | 135.7 | 87.3 | 36.7 | 23.8 | ||||||||||
| Battlefield 1 | 49.2 | 29.1 | 13.8 | 12.5 | ||||||||||
| Civilization 6 | 52.3 | 25.4 | 9.9 | 5.6 | ||||||||||
| Deus Ex Mankind Divided | 20.8 | 14.8 | 8 | 4.9 | ||||||||||
| Mirror's Edge Catalyst | 34.9 | 20.5 | ||||||||||||
| Overwatch | 90.4 | 60.3 | 27.3 | 15.4 | ||||||||||
| Doom | 29.5 | 24.1 | ||||||||||||
| Ashes of the Singularity | 13.7 | 7.3 | ||||||||||||
| Need for Speed 2016 | 28.1 | 24.7 | ||||||||||||
| Hitman 2016 | 23.7 | 17.7 | ||||||||||||
| The Division | 32 | 20 | 9.4 | 7 | ||||||||||
| Far Cry Primal | 24 | 11 | 9 | |||||||||||
| XCOM 2 | 25.6 | 8.9 | ||||||||||||
| Rise of the Tomb Raider | 23.2 | 14.7 | 8.1 | |||||||||||
| Rainbow Six Siege | 54.3 | 34.1 | 17.2 | |||||||||||
| Just Cause 3 | 31.5 | 24.7 | ||||||||||||
| Star Wars Battlefront | 42.6 | 25.5 | 11.3 | |||||||||||
| Assassin's Creed Syndicate | 18.8 | 15.9 | ||||||||||||
| Fallout 4 | 27.9 | 17.4 | ||||||||||||
| Call of Duty: Black Ops 3 | 40.2 | 22.3 | ||||||||||||
| Anno 2205 | 38.1 | 19.1 | ||||||||||||
| FIFA 16 | 91.2 | 51.2 | 31.7 | |||||||||||
| World of Warships | 97.5 | 65.9 | 29.7 | |||||||||||
| Metal Gear Solid V | 60 | 43.6 | 15.4 | |||||||||||
| Mad Max | 26.2 | 14.6 | ||||||||||||
| Dota 2 Reborn | 83.3 | 68 | 36.4 | 33.5 | ||||||||||
| Batman: Arkham Knight | 22 | 19 | 9 | |||||||||||
| The Witcher 3 | 22.1 | 13.6 | ||||||||||||
| Dirt Rally | 170.3 | 44.4 | 22.6 | |||||||||||
| GTA V | 60.7 | 52.5 | 12.5 | |||||||||||
| Battlefield Hardline | 65.1 | 44.6 | 15.6 | |||||||||||
| Dragon Age: Inquisition | 45.4 | 29.2 | 16.4 | |||||||||||
| F1 2014 | 133 | 130 | 125 | 98 | 96 | 79 | 46 | 25 | ||||||
| Alien: Isolation | 196.3 | 129 | 65 | 46.2 | 58.9 | 38.8 | 19.9 | |||||||
| Middle-earth: Shadow of Mordor | 126.4 | 76.4 | 43.4 | 29.2 | 35.2 | 22.6 | 12.4 | |||||||
| Sims 4 | 172.5 | 94.8 | 71.9 | 63 | 171.4 | 63.4 | 34.1 | |||||||
| GRID: Autosport | 262.4 | 153.6 | 100.1 | 52.6 | 176.6 | 68.4 | 30.7 | 14.9 | ||||||
| Battlefield 4 | 162.3 | 116.3 | 81.8 | 33.3 | 54.5 | 37.8 | 26 | 11 | ||||||
| Metro: Last Light | 123.6 | 103 | 58.8 | 30.9 | 42.9 | 32.4 | 18.4 | |||||||
| BioShock Infinite | 233.3 | 140 | 122.2 | 46.7 | 87 | 47 | 40 | 15 | ||||||
| Tomb Raider | 347.4 | 179.3 | 109.9 | 49.5 | 104.2 | 52.6 | 30.6 | 14.6 | ||||||
| Crysis 3 | 133.8 | 81.9 | 54.3 | 20.4 | 38 | 22.2 | 15.9 | |||||||
| Diablo III | 122.8 | 79.3 | 64.7 | 39.1 | ||||||||||
| The Elder Scrolls V: Skyrim | 81.2 | 57 | 43.1 | 23.3 | ||||||||||
| StarCraft 2 | 232.7 | 88.9 | 56.7 | 27.2 | ||||||||||
| NVIDIA GeForce GTX 750 Ti | NVIDIA GeForce 920MX | |||||||||||||
| low | med. | high | ultra | QHD | 4K | low | med. | high | ultra | QHD | 4K | < 30 fps < 60 fps < 120 fps ≥ 120 fps | 10 | 5 5 | 3 5 2 | 2 6 2 | | | < 30 fps < 60 fps < 120 fps ≥ 120 fps | 18 25 15 7 | 40 14 11 | 41 11 2 | 30 5 | | |
For more games that might be playable and a list of all games and graphics cards visit our Gaming List