NVIDIA GeForce GTX 1070 SLI (Laptop) vs NVIDIA Quadro RTX 6000 (Laptop) vs NVIDIA Quadro RTX 4000 (Laptop)
NVIDIA GeForce GTX 1070 SLI (Laptop) ► remove from comparison
The Nvidia GeForce GTX 1070 SLI for laptops is a combination of two GTX 1070 graphics cards in SLI mode. Each card renders one frame at a time (AFR mode) but depends for most games on a good profile in the driver. Therefore, the performance can range from no gains over a single GTX 1070 to up to 90% faster performance. In most games with SLI support, the GTX 1070 SLI is therefore faster than a single GTX 1080. However, sometimes the combination also suffers from micro-stuttering .
The technical details of the card are identical to a single GTX 1070 (see for more information) and the power consumption is doubled. Therefore, the 1070 SLI combination is only found in huge clunky laptops.
NVIDIA Quadro RTX 6000 (Laptop) ► remove from comparison
The Nvidia Quadro RTX 6000 for laptops is a professional high-end graphics card for big and powerful laptops and mobile workstations. It is based on the same TU102 chip as the consumer GeForce RTX 2080 Ti . Compared to the desktop RTX 6000, the mobile variant offers lower clock speeds.
The Quadro GPUs offer certified drivers , which are optimized for stability and performance in professional applications (CAD, DCC, medical, prospection, and visualizing applications). The performance in these areas is therefore much better compared to corresponding consumer GPUs.
NVIDIA manufacturers the TU102 chip on a 12 nm FinFET process and includes features like Deep Learning Super Sampling (DLSS) and Real-Time Ray Tracing (RTRT), which should combine to create more realistic lighting effects than older GPUs based on the company's Pascal architecture (if the games support it). The Quadro RTX 6000 is also DisplayPort 1.4 ready, while there is also support for HDMI 2.0b, HDR, Simultaneous Multi-Projection (SMP) and H.265 video en/decoding (PlayReady 3.0).
Performance
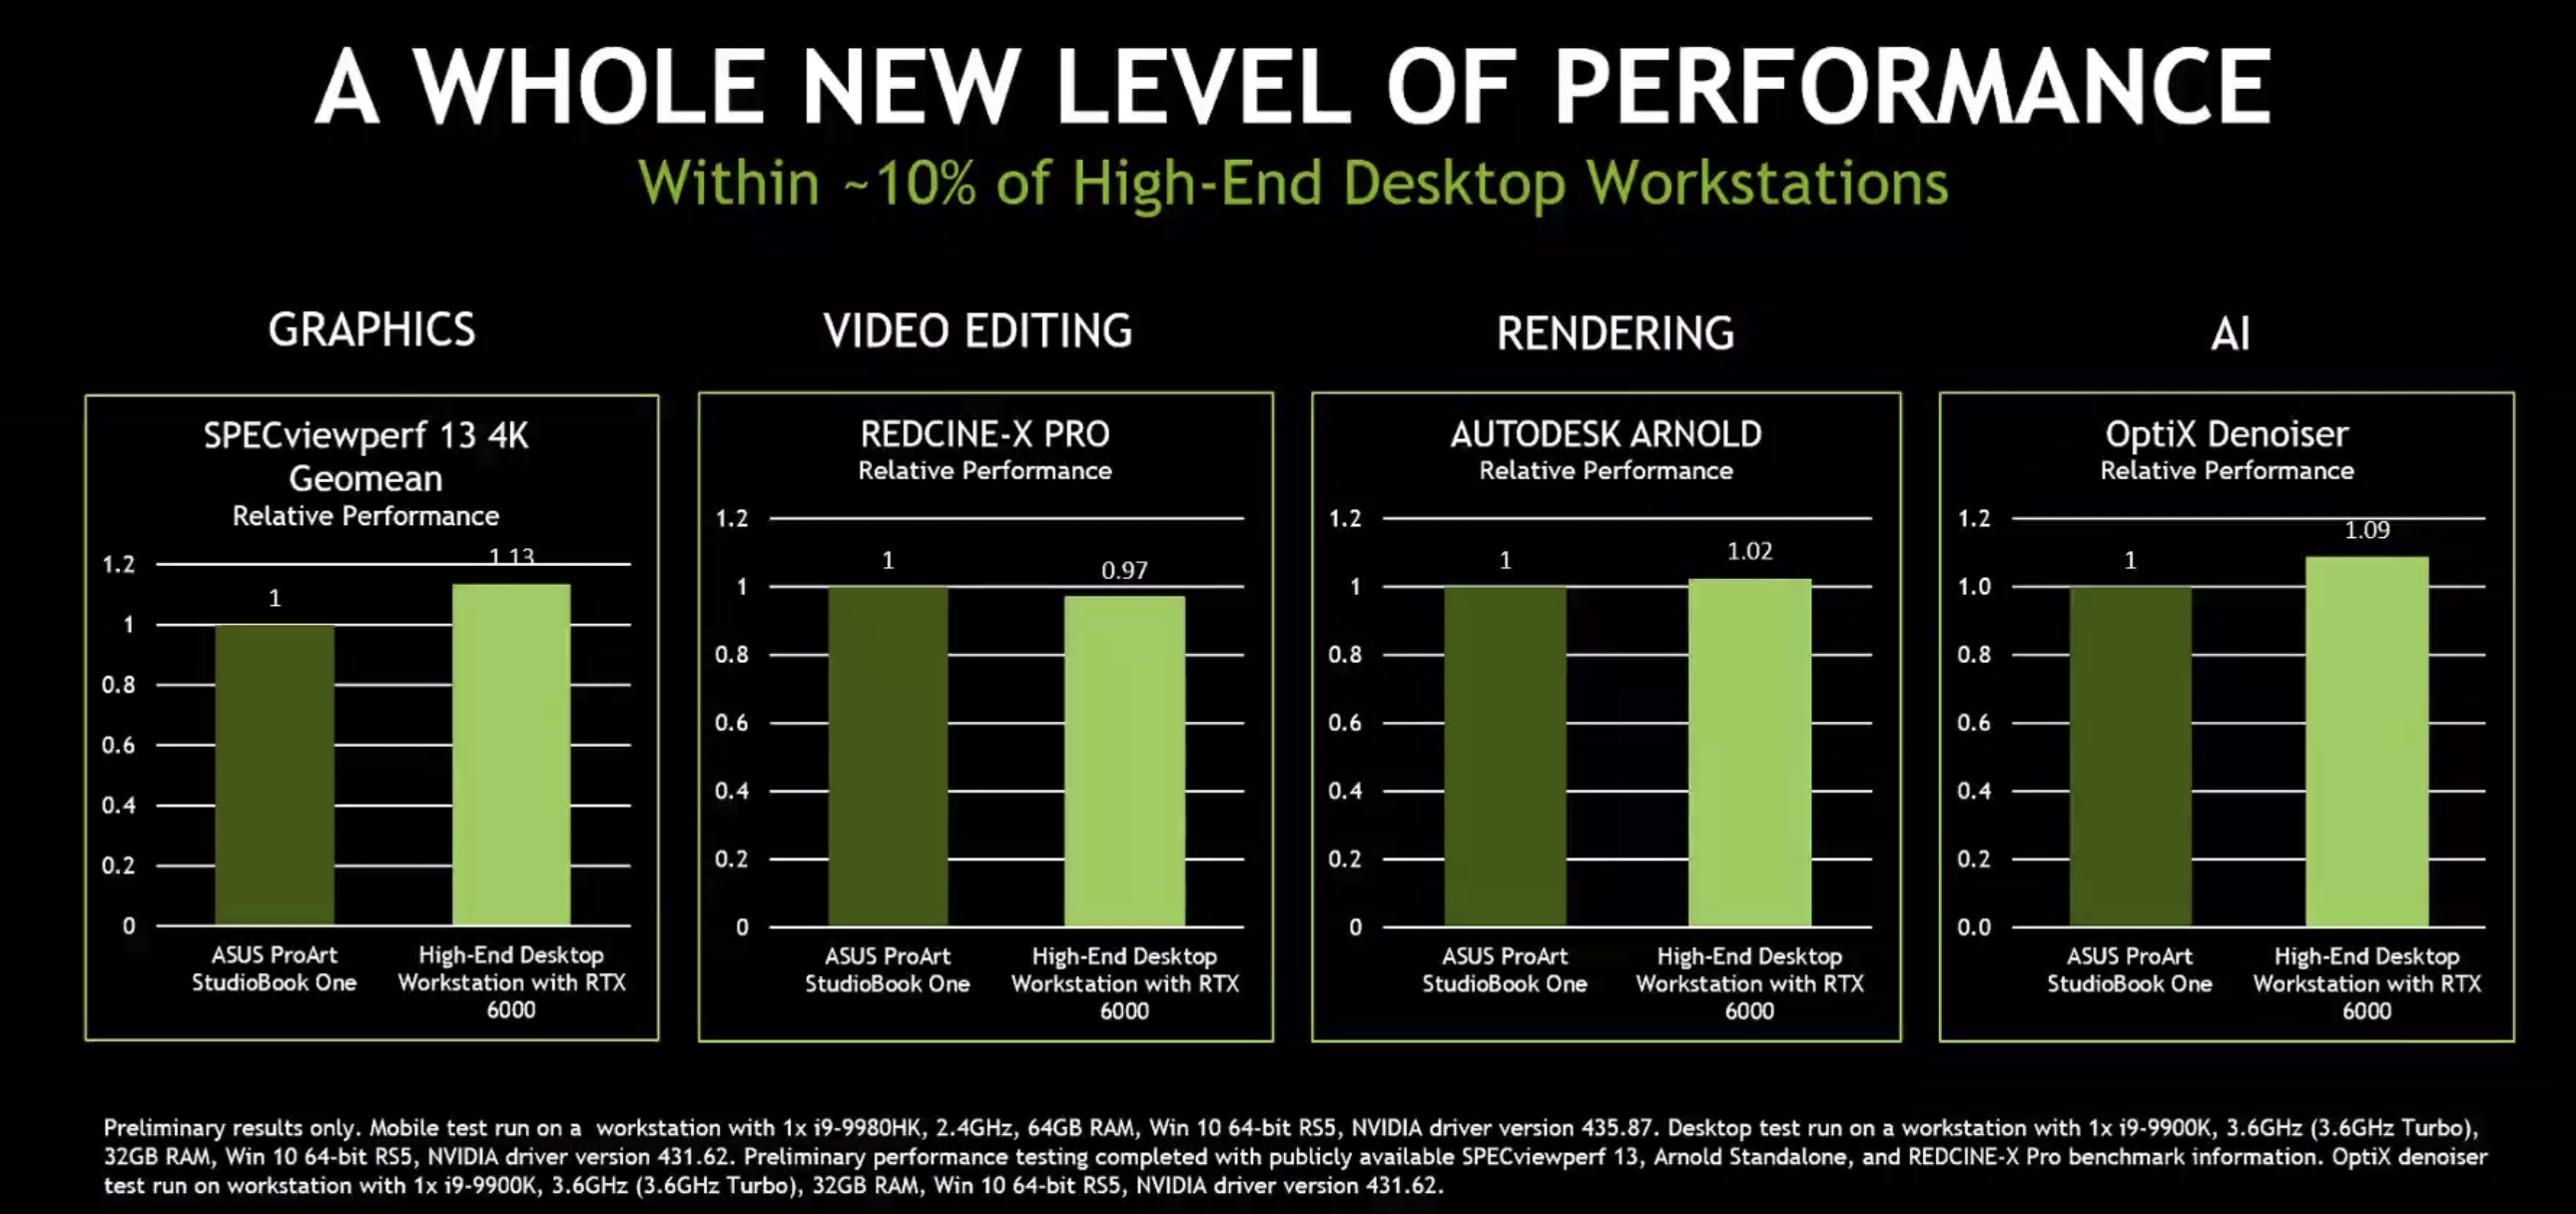
Due to the lower clock speeds, the mobile RTX 6000 lags slightly behind the desktop version with the same name. Nvidia states for example that a desktop system using the RTX 6000 is on average 13% faster in the SPECviewperf13 4k benchmark.
Due to the extremely high power consumption of 200 Watt (TDP), the mobile Quadro RTX 6000 needs an excellent cooling solution and will be used only in big laptops.
NVIDIA Quadro RTX 4000 (Laptop) ► remove from comparison
The Nvidia Quadro RTX 4000 for laptops is a professional high-end graphics card for big and powerful laptops and mobile workstations. It is based on the same TU104 chip as the consumer GeForce RTX 2080 (mobile) but offers less shaders (2,560) and is therefore positioned between the GeForce RTX 2080 (2,944) and 2070 (2,304). Compared to the desktop RTX 4000, the mobile variant offers lower clock speeds.
The Quadro GPUs offer certified drivers , which are optimized for stability and performance in professional applications (CAD, DCC, medical, prospection, and visualizing applications). The performance in these areas is therefore much better compared to corresponding consumer GPUs.
NVIDIA manufacturers the TU104 chip on a 12 nm FinFET process and includes features like Deep Learning Super Sampling (DLSS) and Real-Time Ray Tracing (RTRT), which should combine to create more realistic lighting effects than older GPUs based on the company's Pascal architecture (if the games support it). The Quadro RTX 5000 is also DisplayPort 1.4 ready, while there is also support for HDMI 2.0b, HDR, Simultaneous Multi-Projection (SMP) and H.265 video en/decoding (PlayReady 3.0).
Performance
For professional applications, the Quadro RTX 4000 should slot right in between the RTX 5000 and RTX 3000 cards. In games, the RTX 4000 is between the RTX 2080 and 2070. This means the GPU is located in the high end tier for all applications.
The high power consumption of the RTX4000 makes the card most suited for big and heavy laptops. The slower Max-Q variant is intended for thinner laptops.
NVIDIA GeForce GTX 1070 SLI (Laptop) NVIDIA Quadro RTX 6000 (Laptop) NVIDIA Quadro RTX 4000 (Laptop) Quadro Turing Series Codename Pascal GP104 SLI TU102 N19E-Q3 Architecture Pascal Turing Turing Pipelines 4096 - unified 4608 - unified 2560 - unified Core Speed 1443 - 1645 (Boost) MHz 1275 - 1455 (Boost) MHz 1110 - 1560 (Boost) MHz Memory Speed 8000 MHz 14000 MHz 14000 MHz Memory Bus Width 256 Bit 384 Bit 256 Bit Memory Type GDDR5 GDDR6 GDDR6 Max. Amount of Memory 2x 8192 MB 24 GB 8 GB Shared Memory no no no API DirectX 12_1, OpenGL 4.5 DirectX 12_1, OpenGL 4.6 DirectX 12_1, OpenGL 4.6 Transistors 14.4 Billion 18.6 Billion 10.8 Billion technology 16 nm 12 nm 12 nm Features Multi-Projection, VR Ready, G-SYNC, Vulkan, Multi Monitor, CUDA, 3D Vision, PhysX, GeForce Experience, Surround, GameStream, GPU Boost 2.0, Adaptive Vertical Sync, SLI NVLink, DLSS, Raytraycing, VR Ready, G-SYNC, Vulkan, Multi Monitor DLSS, Raytraycing, VR Ready, G-SYNC, Vulkan, Multi Monitor Notebook Size large large large Date of Announcement 16.08.2016 04.09.2019 27.05.2019 Power Consumption 200 Watt 110 Watt
Benchmarks Performance Rating - 3DMark 11 + Fire Strike + Time Spy - GeForce GTX 1070 SLI (Laptop)
15 pt (45%)
...
NVIDIA GeForce GTX 1070 SLI (Laptop)
max:
3DMark - 3DMark Time Spy Score
min: 8781 avg: 8856 median: 8856 (26%) max: 8931 Points
11084 Points (32%)
GPU TDP ? TDP 200 W 80% 100%
min: 6823 avg: 7362 median: 7362 (21%) max: 7901 Points
GPU TDP ? TDP 110 W TDP 200 W 74% 71% 100%
3DMark - 3DMark Time Spy Graphics
min: 10307 avg: 10455 median: 10455 (28%) max: 10603 Points
min: 6851 avg: 7284 median: 7284 (19%) max: 7717 Points
GPU TDP ? TDP 110 W 100% 83%
3DMark - 3DMark Ice Storm Unlimited Graphics
445161 Points (50%)
3DMark - 3DMark Ice Storm Extreme Graphics
359951 Points (46%)
3DMark - 3DMark Cloud Gate Score
min: 31696 avg: 32422 median: 32510 (35%) max: 33061 Points
38830 Points (42%)
3DMark - 3DMark Cloud Gate Graphics
min: 149345 avg: 153545 median: 152370 (40%) max: 158919 Points
119052 Points (31%)
3DMark - 3DMark Fire Strike Standard Score
min: 20379 avg: 20776 median: 20816 (37%) max: 21132 Points
min: 15912 avg: 16903 median: 16903 (30%) max: 17894 Points
GPU TDP ? TDP 110 W 100% 91%
3DMark - 3DMark Fire Strike Standard Graphics
min: 32640 avg: 33718 median: 32969 (37%) max: 35545 Points
min: 17619 avg: 18849 median: 18849 (21%) max: 20079 Points
GPU TDP ? TDP 110 W 100% 68%
3DMark - 3DMark Ice Storm Graphics
min: 378149 avg: 400739 median: 410383 (49%) max: 413686 Points
3DMark 11 - 3DM11 Performance Score
min: 23326 avg: 23835 median: 23911 (33%) max: 24267 Points
min: 19880 avg: 21595 median: 21595 (30%) max: 23310 Points
GPU TDP ? TDP 110 W 98% 100%
3DMark 11 - 3DM11 Performance GPU
min: 41469 avg: 43219 median: 42910 (37%) max: 45279 Points
min: 23739 avg: 25371 median: 25370.5 (22%) max: 27002 Points
GPU TDP ? TDP 110 W 100% 70%
3DMark Vantage + NVIDIA GeForce GTX 1070 SLI (Laptop) 3DMark Vantage - 3DM Vant. Perf. total
56476 Points (16%)
3DM Vant. Perf. total + NVIDIA Quadro RTX 4000 (Laptop)
56250 Points (16%)
3DM Vant. Perf. GPU no PhysX + NVIDIA GeForce GTX 1070 SLI (Laptop) 3DMark Vantage - 3DM Vant. Perf. GPU no PhysX
77533 Points (44%)
3DM Vant. Perf. GPU no PhysX + NVIDIA Quadro RTX 4000 (Laptop)
62557 Points (35%)
Unigine Valley 1.0 - Unigine Valley 1.0 DX
89.9 fps (29%)
SPECviewperf 11 + NVIDIA GeForce GTX 1070 SLI (Laptop) SPECviewperf 11 - specvp11 snx-01
13.2 fps (8%)
specvp11 tcvis-02 + NVIDIA GeForce GTX 1070 SLI (Laptop) SPECviewperf 11 - specvp11 tcvis-02
3.7 fps (2%)
specvp11 sw-02 + NVIDIA GeForce GTX 1070 SLI (Laptop) SPECviewperf 11 - specvp11 sw-02
24.7 fps (19%)
specvp11 proe-05 + NVIDIA GeForce GTX 1070 SLI (Laptop) SPECviewperf 11 - specvp11 proe-05
3.4 fps (4%)
specvp11 maya-03 + NVIDIA GeForce GTX 1070 SLI (Laptop) SPECviewperf 11 - specvp11 maya-03
15.3 fps (12%)
specvp11 lightwave-01 + NVIDIA GeForce GTX 1070 SLI (Laptop) SPECviewperf 11 - specvp11 lightwave-01
28.9 fps (31%)
specvp11 ensight-04 + NVIDIA GeForce GTX 1070 SLI (Laptop) SPECviewperf 11 - specvp11 ensight-04
72.8 fps (35%)
specvp11 catia-03 + NVIDIA GeForce GTX 1070 SLI (Laptop) SPECviewperf 11 - specvp11 catia-03
20.3 fps (11%)
SPECviewperf 12 + NVIDIA GeForce GTX 1070 SLI (Laptop) SPECviewperf 12 - specvp12 sw-03
64.7 fps (16%)
specvp12 sw-03 + NVIDIA Quadro RTX 4000 (Laptop)
149.1 fps (37%)
specvp12 snx-02 + NVIDIA GeForce GTX 1070 SLI (Laptop) SPECviewperf 12 - specvp12 snx-02
8.7 fps (1%)
specvp12 snx-02 + NVIDIA Quadro RTX 4000 (Laptop)
186 fps (27%)
specvp12 showcase-01 + NVIDIA GeForce GTX 1070 SLI (Laptop) SPECviewperf 12 - specvp12 showcase-01
82.3 fps (18%)
specvp12 showcase-01 + NVIDIA Quadro RTX 4000 (Laptop)
98 fps (21%)
specvp12 mediacal-01 + NVIDIA GeForce GTX 1070 SLI (Laptop) SPECviewperf 12 - specvp12 mediacal-01
43.5 fps (11%)
specvp12 mediacal-01 + NVIDIA Quadro RTX 4000 (Laptop)
62.4 fps (16%)
specvp12 maya-04 + NVIDIA GeForce GTX 1070 SLI (Laptop) SPECviewperf 12 - specvp12 maya-04
144.7 fps (39%)
specvp12 maya-04 + NVIDIA Quadro RTX 4000 (Laptop)
144.1 fps (39%)
specvp12 energy-01 + NVIDIA GeForce GTX 1070 SLI (Laptop) SPECviewperf 12 - specvp12 energy-01
9.2 fps (8%)
specvp12 energy-01 + NVIDIA Quadro RTX 4000 (Laptop)
13.9 fps (12%)
specvp12 creo-01 + NVIDIA GeForce GTX 1070 SLI (Laptop) SPECviewperf 12 - specvp12 creo-01
56.4 fps (23%)
specvp12 creo-01 + NVIDIA Quadro RTX 4000 (Laptop)
140.7 fps (56%)
specvp12 catia-04 + NVIDIA GeForce GTX 1070 SLI (Laptop) SPECviewperf 12 - specvp12 catia-04
84.1 fps (14%)
specvp12 catia-04 + NVIDIA Quadro RTX 4000 (Laptop)
161.9 fps (27%)
SPECviewperf 13 specvp13 sw-04 + NVIDIA Quadro RTX 6000 (Laptop) SPECviewperf 13 - specvp13 sw-04
217 fps (58%)
specvp13 sw-04 + NVIDIA Quadro RTX 4000 (Laptop)
min: 125.4 avg: 152.2 median: 152.2 (41%) max: 178.9 fps
GPU TDP ? TDP 110 W TDP 200 W 58% 82% 100%
specvp13 3dsmax-06 + NVIDIA Quadro RTX 6000 (Laptop) SPECviewperf 13 - specvp13 3dsmax-06
217 fps (38%)
specvp13 3dsmax-06 + NVIDIA Quadro RTX 4000 (Laptop)
min: 173 avg: 178.7 median: 178.7 (31%) max: 184.3 fps
GPU TDP ? TDP 110 W TDP 200 W 80% 85% 100%
specvp13 snx-03 + NVIDIA Quadro RTX 4000 (Laptop) SPECviewperf 13 - specvp13 snx-03
min: 271.1 avg: 314.1 median: 314.1 (35%) max: 357.1 fps
GPU TDP ? TDP 110 W 76% 100%
specvp13 showcase-02 + NVIDIA Quadro RTX 4000 (Laptop) SPECviewperf 13 - specvp13 showcase-02
min: 94 avg: 97.2 median: 97.2 (21%) max: 100.3 fps
GPU TDP ? TDP 110 W 94% 100%
specvp13 medical-02 + NVIDIA Quadro RTX 4000 (Laptop) SPECviewperf 13 - specvp13 medical-02
min: 73.2 avg: 87.9 median: 87.9 (18%) max: 102.5 fps
GPU TDP ? TDP 110 W 71% 100%
specvp13 maya-05 + NVIDIA Quadro RTX 4000 (Laptop) SPECviewperf 13 - specvp13 maya-05
min: 207.9 avg: 247 median: 247 (28%) max: 286.1 fps
GPU TDP ? TDP 110 W 73% 100%
specvp13 energy-02 + NVIDIA Quadro RTX 4000 (Laptop) SPECviewperf 13 - specvp13 energy-02
min: 36.03 avg: 40.5 median: 40.5 (13%) max: 45.02 fps
GPU TDP ? TDP 110 W 80% 100%
specvp13 creo-02 + NVIDIA Quadro RTX 4000 (Laptop) SPECviewperf 13 - specvp13 creo-02
min: 208 avg: 239 median: 239 (35%) max: 269.9 fps
GPU TDP ? TDP 110 W 77% 100%
specvp13 catia-05 + NVIDIA Quadro RTX 4000 (Laptop) SPECviewperf 13 - specvp13 catia-05
min: 212.6 avg: 245 median: 245 (27%) max: 277.3 fps
GPU TDP ? TDP 110 W 77% 100%
Cinebench R10 Cinebench R10 Shading (32bit) + NVIDIA Quadro RTX 4000 (Laptop) Cinebench R10 - Cinebench R10 Shading (32bit)
6824 Points (5%)
Cinebench R11.5 Cinebench R11.5 OpenGL 64 Bit + NVIDIA GeForce GTX 1070 SLI (Laptop) Cinebench R11.5 - Cinebench R11.5 OpenGL 64 Bit
80.5 fps (28%)
Cinebench R11.5 OpenGL 64 Bit + NVIDIA Quadro RTX 4000 (Laptop)
127.6 fps (44%)
Cinebench R15 + NVIDIA GeForce GTX 1070 SLI (Laptop) Cinebench R15 - Cinebench R15 OpenGL 64 Bit
min: 139.6 avg: 142.2 median: 142.2 (8%) max: 144.8 fps
Cinebench R15 OpenGL 64 Bit + NVIDIA Quadro RTX 4000 (Laptop)
min: 197 avg: 215.5 median: 215.5 (13%) max: 234 fps
GPU TDP ? TDP 110 W 69% 100%
Cinebench R15 OpenGL Ref. Match 64 Bit + NVIDIA GeForce GTX 1070 SLI (Laptop) Cinebench R15 - Cinebench R15 OpenGL Ref. Match 64 Bit
99.6 % (100%)
Cinebench R15 OpenGL Ref. Match 64 Bit + NVIDIA Quadro RTX 4000 (Laptop)
min: 99.6 avg: 99.8 median: 99.8 (100%) max: 100 %
GPU TDP ? TDP 110 W 100% 100%
GFXBench - GFXBench Car Chase Offscreen
305.3 fps (34%)
GFXBench 3.1 - GFXBench Manhattan ES 3.1 Offscreen
440.5 fps (9%)
GFXBench 3.0 - GFXBench 3.0 Manhattan Offscreen
545 fps (32%)
490.4 fps (29%)
GFXBench (DX / GLBenchmark) 2.7 + NVIDIA Quadro RTX 4000 (Laptop) GFXBench (DX / GLBenchmark) 2.7 - GFXBench T-Rex HD Offscreen C24Z16
1213 fps (10%)
LuxMark v2.0 64Bit - LuxMark v2.0 Room GPU
5280 Samples/s (24%)
2840 Samples/s (13%)
LuxMark v2.0 64Bit - LuxMark v2.0 Sala GPU
10434 Samples/s (18%)
5927 Samples/s (10%)
ComputeMark v2.1 - ComputeMark v2.1 Result
13059 Points (14%)
13576 Points (15%)
Power Consumption - Witcher 3 Power Consumption *
295 Watt (65%)
min: 137 avg: 159.5 median: 159.5 (35%) max: 182 Watt
GPU TDP ? TDP 110 W 100% 114%
Power Consumption - Witcher 3 ultra Power Efficiency
0.3 fps per Watt (34%)
min: 0.4341 avg: 0.5 median: 0.5 (47%) max: 0.511 fps per Watt
GPU TDP ? TDP 110 W 98% 100%
Emissions Witcher 3 Fan Noise + NVIDIA GeForce GTX 1070 SLI (Laptop) Emissions - Witcher 3 Fan Noise
56 dB(A) (90%)
Witcher 3 Fan Noise + NVIDIA Quadro RTX 4000 (Laptop)
min: 39.6 avg: 40.8 median: 40.8 (65%) max: 41.9 dB(A)
GPU TDP ? TDP 110 W 100% 81%
Clock Speed - GPU Clock Witcher 3 ultra
1650 MHz (65%)
Average Benchmarks NVIDIA GeForce GTX 1070 SLI (Laptop) → 100% n=1 Average Benchmarks NVIDIA Quadro RTX 6000 (Laptop) → 125% n=1 Average Benchmarks NVIDIA Quadro RTX 4000 (Laptop) → 83% n=1
- Range of benchmark values for this graphics card
- Average benchmark values for this graphics card
* Smaller numbers mean a higher performance
1 This benchmark is not used for the average calculation
Game Benchmarks The following benchmarks stem from our benchmarks of review laptops. The performance depends on the used graphics memory, clock rate, processor, system settings, drivers, and operating systems. So the results don't have to be representative for all laptops with this GPU. For detailed information on the benchmark results, click on the fps number.
Quadro RTX 4000 (Laptop):
283 fps
Quadro RTX 4000 (Laptop):
207 fps
Quadro RTX 4000 (Laptop):
171 fps
Quadro RTX 4000 (Laptop):
121 fps
Quadro RTX 4000 (Laptop):
89 fps
Quadro RTX 4000 (Laptop):
50 fps
Quadro RTX 4000 (Laptop):
98 fps
Quadro RTX 4000 (Laptop):
77.5 fps
Quadro RTX 4000 (Laptop):
42.6 fps
Quadro RTX 4000 (Laptop):
37.7 fps
Quadro RTX 4000 (Laptop):
22.4 fps
Quadro RTX 4000 (Laptop):
180 fps
Quadro RTX 4000 (Laptop):
122 fps
Quadro RTX 4000 (Laptop):
96 fps
Quadro RTX 4000 (Laptop):
70 fps
Quadro RTX 4000 (Laptop):
47 fps
Quadro RTX 4000 (Laptop):
25 fps
Quadro RTX 4000 (Laptop):
267 fps
Quadro RTX 4000 (Laptop):
180.7 fps
Quadro RTX 4000 (Laptop):
151 fps
Quadro RTX 4000 (Laptop):
85.6 fps
Quadro RTX 4000 (Laptop):
63.3 fps
Quadro RTX 4000 (Laptop):
118 124 ~ 121 fps
Quadro RTX 4000 (Laptop):
102 104 ~ 103 fps
Quadro RTX 4000 (Laptop):
99 103 ~ 101 fps
Quadro RTX 4000 (Laptop):
88 94 ~ 91 fps
Quadro RTX 4000 (Laptop):
72 82 ~ 77 fps
Quadro RTX 4000 (Laptop):
39 46 ~ 43 fps
Quadro RTX 4000 (Laptop):
150 fps
Quadro RTX 4000 (Laptop):
125 fps
Quadro RTX 4000 (Laptop):
93 fps
Quadro RTX 4000 (Laptop):
86 fps
Quadro RTX 4000 (Laptop):
60 fps
Quadro RTX 4000 (Laptop):
33 fps
Quadro RTX 4000 (Laptop):
143.8 fps
Quadro RTX 4000 (Laptop):
119.2 fps
Quadro RTX 4000 (Laptop):
105.2 fps
Quadro RTX 4000 (Laptop):
69.1 fps
Quadro RTX 4000 (Laptop):
34.2 fps
Quadro RTX 4000 (Laptop):
116.7 fps
Quadro RTX 4000 (Laptop):
100.6 fps
Quadro RTX 4000 (Laptop):
86.6 fps
Quadro RTX 4000 (Laptop):
81 fps
Quadro RTX 4000 (Laptop):
65.5 fps
Quadro RTX 4000 (Laptop):
41.8 fps
Quadro RTX 4000 (Laptop):
95.4 fps
Quadro RTX 4000 (Laptop):
93.6 fps
Quadro RTX 4000 (Laptop):
85.8 fps
Quadro RTX 4000 (Laptop):
81.1 fps
Quadro RTX 4000 (Laptop):
72.9 fps
Quadro RTX 4000 (Laptop):
39.4 fps
Quadro RTX 4000 (Laptop):
99 fps
Quadro RTX 4000 (Laptop):
87 fps
Quadro RTX 4000 (Laptop):
75 fps
Quadro RTX 4000 (Laptop):
54 fps
Quadro RTX 4000 (Laptop):
41 fps
Quadro RTX 4000 (Laptop):
28 fps
Quadro RTX 4000 (Laptop):
138.6 fps
Quadro RTX 4000 (Laptop):
105.2 fps
Quadro RTX 4000 (Laptop):
81.6 fps
Quadro RTX 4000 (Laptop):
85 fps
Quadro RTX 4000 (Laptop):
57.1 fps
Quadro RTX 4000 (Laptop):
29.7 fps
Quadro RTX 4000 (Laptop):
241 fps
Quadro RTX 4000 (Laptop):
180 fps
Quadro RTX 4000 (Laptop):
142 fps
Quadro RTX 4000 (Laptop):
95 fps
Quadro RTX 4000 (Laptop):
76 fps
Quadro RTX 4000 (Laptop):
48 fps
Quadro RTX 4000 (Laptop):
129 fps
Quadro RTX 4000 (Laptop):
106 fps
Quadro RTX 4000 (Laptop):
100 fps
Quadro RTX 4000 (Laptop):
96 fps
Quadro RTX 4000 (Laptop):
69 fps
Quadro RTX 4000 (Laptop):
36 fps
Quadro RTX 4000 (Laptop):
119 122 ~ 121 fps
Quadro RTX 4000 (Laptop):
107 110 ~ 109 fps
Quadro RTX 4000 (Laptop):
88 90.2 ~ 89 fps
Quadro RTX 4000 (Laptop):
76.6 fps
100%
GeForce GTX 1070 SLI (Laptop):
330 [X] Aorus X9 Intel Core i7-7820HK @4.1GHz
GeForce GTX 1070 SLI (Laptop)
fps
100%
GeForce GTX 1070 SLI (Laptop):
310 [X] Aorus X9 Intel Core i7-7820HK @4.1GHz
GeForce GTX 1070 SLI (Laptop)
fps
100%
GeForce GTX 1070 SLI (Laptop):
187 [X] Aorus X9 Intel Core i7-7820HK @4.1GHz
GeForce GTX 1070 SLI (Laptop)
fps
100%
GeForce GTX 1070 SLI (Laptop):
88.6 [X] Aorus X9 Intel Core i7-7820HK @4.1GHz
GeForce GTX 1070 SLI (Laptop)
fps
100%
GeForce GTX 1070 SLI (Laptop):
53 [X] Aorus X9 Intel Core i7-7820HK @4.1GHz
GeForce GTX 1070 SLI (Laptop)
fps
100%
GeForce GTX 1070 SLI (Laptop):
25.8 [X] Aorus X9 Intel Core i7-7820HK @4.1GHz
GeForce GTX 1070 SLI (Laptop)
fps
100%
GeForce GTX 1070 SLI (Laptop):
132 [X] Aorus X9 Intel Core i7-7820HK @4.1GHz
GeForce GTX 1070 SLI (Laptop)
fps
100%
GeForce GTX 1070 SLI (Laptop):
89 [X] Aorus X9 Intel Core i7-7820HK @4.1GHz
GeForce GTX 1070 SLI (Laptop)
fps
100%
GeForce GTX 1070 SLI (Laptop):
42 [X] Aorus X9 Intel Core i7-7820HK @4.1GHz
GeForce GTX 1070 SLI (Laptop)
fps
100%
GeForce GTX 1070 SLI (Laptop):
102 [X] Aorus X9 Intel Core i7-7820HK @4.1GHz
GeForce GTX 1070 SLI (Laptop)
fps
100%
GeForce GTX 1070 SLI (Laptop):
93.3 [X] Aorus X9 Intel Core i7-7820HK @4.1GHz
GeForce GTX 1070 SLI (Laptop)
fps
100%
GeForce GTX 1070 SLI (Laptop):
37.1 [X] Aorus X9 Intel Core i7-7820HK @4.1GHz
GeForce GTX 1070 SLI (Laptop)
fps
100%
GeForce GTX 1070 SLI (Laptop):
115 [X] Aorus X9 Intel Core i7-7820HK @4.1GHz
GeForce GTX 1070 SLI (Laptop)
fps
100%
GeForce GTX 1070 SLI (Laptop):
70.4 [X] Aorus X9 Intel Core i7-7820HK @4.1GHz
GeForce GTX 1070 SLI (Laptop)
fps
100%
GeForce GTX 1070 SLI (Laptop):
219 [X] Aorus X9 Intel Core i7-7820HK @4.1GHz
GeForce GTX 1070 SLI (Laptop)
fps
100%
GeForce GTX 1070 SLI (Laptop):
141 [X] Aorus X9 Intel Core i7-7820HK @4.1GHz
GeForce GTX 1070 SLI (Laptop)
fps
100%
GeForce GTX 1070 SLI (Laptop):
140 [X] Aorus X9 Intel Core i7-7820HK @4.1GHz
GeForce GTX 1070 SLI (Laptop)
fps
100%
GeForce GTX 1070 SLI (Laptop):
137 [X] Aorus X9 Intel Core i7-7820HK @4.1GHz
GeForce GTX 1070 SLI (Laptop)
fps
100%
GeForce GTX 1070 SLI (Laptop):
79.1 [X] Aorus X9 Intel Core i7-7820HK @4.1GHz
GeForce GTX 1070 SLI (Laptop)
fps
Quadro RTX 4000 (Laptop):
139.9 fps
Quadro RTX 4000 (Laptop):
98 fps
100%
GeForce GTX 1070 SLI (Laptop):
112 [X] Aorus X9 Intel Core i7-7820HK @4.1GHz
GeForce GTX 1070 SLI (Laptop)
fps
81%
Quadro RTX 4000 (Laptop):
90.8 fps
100%
GeForce GTX 1070 SLI (Laptop):
68.8 [X] Aorus X9 Intel Core i7-7820HK @4.1GHz
GeForce GTX 1070 SLI (Laptop)
fps
77%
Quadro RTX 4000 (Laptop):
52.9 fps
100%
GeForce GTX 1070 SLI (Laptop):
53.1 [X] Aorus X9 Intel Core i7-7820HK @4.1GHz
GeForce GTX 1070 SLI (Laptop)
fps
66%
Quadro RTX 4000 (Laptop):
35 fps
Quadro RTX 4000 (Laptop):
289 fps
Quadro RTX 4000 (Laptop):
148 fps
100%
GeForce GTX 1070 SLI (Laptop):
177 [X] Aorus X9 Intel Core i7-7820HK @4.1GHz
GeForce GTX 1070 SLI (Laptop)
fps
80%
Quadro RTX 4000 (Laptop):
141 fps
100%
GeForce GTX 1070 SLI (Laptop):
163 [X] Aorus X9 Intel Core i7-7820HK @4.1GHz
GeForce GTX 1070 SLI (Laptop)
fps
67%
Quadro RTX 4000 (Laptop):
109 fps
100%
GeForce GTX 1070 SLI (Laptop):
83.9 [X] Aorus X9 Intel Core i7-7820HK @4.1GHz
GeForce GTX 1070 SLI (Laptop)
fps
54%
Quadro RTX 4000 (Laptop):
45.7 fps
100%
GeForce GTX 1070 SLI (Laptop):
146 [X] Aorus X9 Intel Core i7-7820HK @4.1GHz
GeForce GTX 1070 SLI (Laptop)
fps
100%
GeForce GTX 1070 SLI (Laptop):
123 [X] Aorus X9 Intel Core i7-7820HK @4.1GHz
GeForce GTX 1070 SLI (Laptop)
fps
100%
GeForce GTX 1070 SLI (Laptop):
42 [X] Aorus X9 Intel Core i7-7820HK @4.1GHz
GeForce GTX 1070 SLI (Laptop)
fps
100%
GeForce GTX 1070 SLI (Laptop):
111 [X] Aorus X9 Intel Core i7-7820HK @4.1GHz
GeForce GTX 1070 SLI (Laptop)
fps
100%
GeForce GTX 1070 SLI (Laptop):
90.9 [X] Aorus X9 Intel Core i7-7820HK @4.1GHz
GeForce GTX 1070 SLI (Laptop)
fps
100%
GeForce GTX 1070 SLI (Laptop):
59 [X] Aorus X9 Intel Core i7-7820HK @4.1GHz
GeForce GTX 1070 SLI (Laptop)
fps
100%
GeForce GTX 1070 SLI (Laptop):
92.4 [X] Aorus X9 Intel Core i7-7820HK @4.1GHz
GeForce GTX 1070 SLI (Laptop)
fps
100%
GeForce GTX 1070 SLI (Laptop):
78.6 [X] Aorus X9 Intel Core i7-7820HK @4.1GHz
GeForce GTX 1070 SLI (Laptop)
fps
100%
GeForce GTX 1070 SLI (Laptop):
60 [X] Aorus X9 Intel Core i7-7820HK @4.1GHz
GeForce GTX 1070 SLI (Laptop)
fps
100%
GeForce GTX 1070 SLI (Laptop):
122 [X] Aorus X9 Intel Core i7-7820HK @4.1GHz
GeForce GTX 1070 SLI (Laptop)
fps
100%
GeForce GTX 1070 SLI (Laptop):
111 [X] Aorus X9 Intel Core i7-7820HK @4.1GHz
GeForce GTX 1070 SLI (Laptop)
fps
100%
GeForce GTX 1070 SLI (Laptop):
58.6 [X] Aorus X9 Intel Core i7-7820HK @4.1GHz
GeForce GTX 1070 SLI (Laptop)
fps
100%
GeForce GTX 1070 SLI (Laptop):
143 [X] Aorus X9 Intel Core i7-7820HK @4.1GHz
GeForce GTX 1070 SLI (Laptop)
fps
100%
GeForce GTX 1070 SLI (Laptop):
141 [X] Aorus X9 Intel Core i7-7820HK @4.1GHz
GeForce GTX 1070 SLI (Laptop)
fps
100%
GeForce GTX 1070 SLI (Laptop):
68.4 [X] Aorus X9 Intel Core i7-7820HK @4.1GHz
GeForce GTX 1070 SLI (Laptop)
fps
100%
GeForce GTX 1070 SLI (Laptop):
143 [X] Aorus X9 Intel Core i7-7820HK @4.1GHz
GeForce GTX 1070 SLI (Laptop)
fps
100%
GeForce GTX 1070 SLI (Laptop):
129 [X] Aorus X9 Intel Core i7-7820HK @4.1GHz
GeForce GTX 1070 SLI (Laptop)
fps
100%
GeForce GTX 1070 SLI (Laptop):
74.1 [X] Aorus X9 Intel Core i7-7820HK @4.1GHz
GeForce GTX 1070 SLI (Laptop)
fps
100%
GeForce GTX 1070 SLI (Laptop):
54 fps
100%
GeForce GTX 1070 SLI (Laptop):
21.3 fps
100%
GeForce GTX 1070 SLI (Laptop):
293 fps
100%
GeForce GTX 1070 SLI (Laptop):
286 fps
100%
GeForce GTX 1070 SLI (Laptop):
174 fps
100%
GeForce GTX 1070 SLI (Laptop):
73.9 fps
100%
GeForce GTX 1070 SLI (Laptop):
56.1 fps
100%
GeForce GTX 1070 SLI (Laptop):
146 fps
100%
GeForce GTX 1070 SLI (Laptop):
77.4 fps
100%
GeForce GTX 1070 SLI (Laptop):
74.7 fps
100%
GeForce GTX 1070 SLI (Laptop):
102 fps
100%
GeForce GTX 1070 SLI (Laptop):
97.4 fps
100%
GeForce GTX 1070 SLI (Laptop):
53.9 fps
100%
GeForce GTX 1070 SLI (Laptop):
294 fps
100%
GeForce GTX 1070 SLI (Laptop):
293 fps
100%
GeForce GTX 1070 SLI (Laptop):
177 fps
100%
GeForce GTX 1070 SLI (Laptop):
158 fps
100%
GeForce GTX 1070 SLI (Laptop):
152 fps
100%
GeForce GTX 1070 SLI (Laptop):
74.1 fps
100%
GeForce GTX 1070 SLI (Laptop):
99.3 fps
100%
GeForce GTX 1070 SLI (Laptop):
85.7 fps
100%
GeForce GTX 1070 SLI (Laptop):
84 fps
100%
GeForce GTX 1070 SLI (Laptop):
128 fps
100%
GeForce GTX 1070 SLI (Laptop):
113 fps
100%
GeForce GTX 1070 SLI (Laptop):
67.4 fps
100%
GeForce GTX 1070 SLI (Laptop):
78 fps
100%
GeForce GTX 1070 SLI (Laptop):
72 fps
100%
GeForce GTX 1070 SLI (Laptop):
69 fps
100%
GeForce GTX 1070 SLI (Laptop):
103 fps
100%
GeForce GTX 1070 SLI (Laptop):
82.3 fps
100%
GeForce GTX 1070 SLI (Laptop):
53.1 fps
Quadro RTX 4000 (Laptop):
199.6 fps
100%
GeForce GTX 1070 SLI (Laptop):
80.9 fps
158%
Quadro RTX 4000 (Laptop):
127.8 fps
100%
GeForce GTX 1070 SLI (Laptop):
79.8 fps
131%
Quadro RTX 4000 (Laptop):
104.9 fps
100%
GeForce GTX 1070 SLI (Laptop):
67.7 fps
67%
Quadro RTX 4000 (Laptop):
45.1 fps
100%
GeForce GTX 1070 SLI (Laptop):
176 fps
100%
GeForce GTX 1070 SLI (Laptop):
160 fps
100%
GeForce GTX 1070 SLI (Laptop):
60.7 fps
100%
GeForce GTX 1070 SLI (Laptop):
129 fps
100%
GeForce GTX 1070 SLI (Laptop):
115 fps
100%
GeForce GTX 1070 SLI (Laptop):
198 fps
100%
GeForce GTX 1070 SLI (Laptop):
196 fps
100%
GeForce GTX 1070 SLI (Laptop):
106 fps
100%
GeForce GTX 1070 SLI (Laptop):
87.7 fps
100%
GeForce GTX 1070 SLI (Laptop):
75.3 fps
100%
GeForce GTX 1070 SLI (Laptop):
74.1 fps
100%
GeForce GTX 1070 SLI (Laptop):
141 fps
100%
GeForce GTX 1070 SLI (Laptop):
137 fps
100%
GeForce GTX 1070 SLI (Laptop):
82.3 fps
100%
GeForce GTX 1070 SLI (Laptop):
140 fps
100%
GeForce GTX 1070 SLI (Laptop):
121 fps
100%
GeForce GTX 1070 SLI (Laptop):
87.9 fps
100%
GeForce GTX 1070 SLI (Laptop):
111 fps
100%
GeForce GTX 1070 SLI (Laptop):
49.8 fps
100%
GeForce GTX 1070 SLI (Laptop):
54.8 fps
100%
GeForce GTX 1070 SLI (Laptop):
265 fps
100%
GeForce GTX 1070 SLI (Laptop):
262 fps
Quadro RTX 4000 (Laptop):
146 152 ~ 149 fps
Quadro RTX 4000 (Laptop):
135 140 ~ 138 fps
Quadro RTX 4000 (Laptop):
130 133 ~ 132 fps
Quadro RTX 4000 (Laptop):
124 129 ~ 127 fps
Quadro RTX 4000 (Laptop):
100 111 ~ 106 fps
100%
GeForce GTX 1070 SLI (Laptop):
134 fps
100%
GeForce GTX 1070 SLI (Laptop):
68 [X] Saelic Vici G781D Intel Core i7-6700K 4GHz
GeForce GTX 1070 SLI (Laptop)
89 ~ 79 fps
100%
GeForce GTX 1070 SLI (Laptop):
48 fps
Quadro RTX 4000 (Laptop):
303 345 ~ 324 fps
Quadro RTX 4000 (Laptop):
215 254 ~ 235 fps
100%
GeForce GTX 1070 SLI (Laptop):
167 [X] Aorus X9 Intel Core i7-7820HK @4.1GHz
GeForce GTX 1070 SLI (Laptop)
169 ~ 168 fps
85%
Quadro RTX 4000 (Laptop):
132 153 ~ 143 fps
100%
GeForce GTX 1070 SLI (Laptop):
81.4 [X] Saelic Vici G781D Intel Core i7-6700K 4GHz
GeForce GTX 1070 SLI (Laptop)
99.9 [X] Aorus X9 Intel Core i7-7820HK @4.1GHz
GeForce GTX 1070 SLI (Laptop)
103 ~ 95 fps
79%
Quadro RTX 4000 (Laptop):
70 79 ~ 75 fps
100%
GeForce GTX 1070 SLI (Laptop):
69.3 [X] Aorus X9 Intel Core i7-7820HK @4.1GHz
GeForce GTX 1070 SLI (Laptop)
74.6 ~ 72 fps
71%
Quadro RTX 4000 (Laptop):
46 56 ~ 51 fps
100%
GeForce GTX 1070 SLI (Laptop):
170 fps
100%
GeForce GTX 1070 SLI (Laptop):
168 fps
100%
GeForce GTX 1070 SLI (Laptop):
163 fps
100%
GeForce GTX 1070 SLI (Laptop):
159 fps
100%
GeForce GTX 1070 SLI (Laptop):
138 fps
100%
GeForce GTX 1070 SLI (Laptop):
199 fps
100%
GeForce GTX 1070 SLI (Laptop):
190 fps
100%
GeForce GTX 1070 SLI (Laptop):
114.6 [X] Saelic Vici G781D Intel Core i7-6700K 4GHz
GeForce GTX 1070 SLI (Laptop)
fps
100%
GeForce GTX 1070 SLI (Laptop):
105.3 [X] Saelic Vici G781D Intel Core i7-6700K 4GHz
GeForce GTX 1070 SLI (Laptop)
fps
100%
GeForce GTX 1070 SLI (Laptop):
198.4 [X] Saelic Vici G781D Intel Core i7-6700K 4GHz
GeForce GTX 1070 SLI (Laptop)
fps
100%
GeForce GTX 1070 SLI (Laptop):
217.9 [X] Saelic Vici G781D Intel Core i7-6700K 4GHz
GeForce GTX 1070 SLI (Laptop)
fps
Average Gaming NVIDIA GeForce GTX 1070 SLI (Laptop) → 100% Average Gaming 30-70 fps → 100%
Average Gaming NVIDIA Quadro RTX 4000 (Laptop) → 85% Average Gaming 30-70 fps → 67%
NVIDIA Quadro RTX 4000 (Laptop) low med. high ultra QHD 4K F1 2020 283 207 171 121 89 50 Anno 1800 98 77.5 42.6 37.7 22.4 The Division 2 180 122 96 70 47 25 Dirt Rally 2.0 267 180.7 151 85.6 63.3 Far Cry New Dawn 121 103 101 91 77 43 Just Cause 4 150 125 93 86 60 33 Darksiders III 143.8 119.2 105.2 69.1 34.2 Battlefield V 116.7 100.6 86.6 81 65.5 41.8 Hitman 2 95.4 93.6 85.8 81.1 72.9 39.4 Assassin´s Creed Odyssey 99 87 75 54 41 28 Shadow of the Tomb Raider 138.6 105.2 81.6 85 57.1 29.7 F1 2018 241 180 142 95 76 48 Far Cry 5 129 106 100 96 69 36 X-Plane 11.11 121 109 89 76.6 Ghost Recon Wildlands 139.9 98 90.8 52.9 35 For Honor 289 148 141 109 45.7 Rise of the Tomb Raider 199.6 127.8 104.9 45.1 Dota 2 Reborn 149 138 132 127 106 The Witcher 3 324 235 143 75 51 < 30 fps < 60 fps < 120 fps ≥ 120 fps 3 13 9 10 12 7 3 13 2 4 9 4 12 2
For more games that might be playable and a list of all games and graphics cards visit our Gaming List
v1.27
log 16. 01:38:29
#0 checking url part for id 7438 +0s ... 0s
#1 checking url part for id 9923 +0s ... 0s
#2 checking url part for id 9856 +0s ... 0s
#3 not redirecting to Ajax server +0s ... 0s
#4 did not recreate cache, as it is less than 5 days old! Created at Thu, 13 Jun 2024 05:35:10 +0200 +0.001s ... 0.001s
#5 composed specs +0.179s ... 0.18s
#6 did output specs +0s ... 0.18s
#7 start showIntegratedCPUs +0s ... 0.18s
#8 getting avg benchmarks for device 7438 +0.085s ... 0.265s
#9 got single benchmarks 7438 +0.021s ... 0.287s
#10 getting avg benchmarks for device 9923 +0.002s ... 0.289s
#11 got single benchmarks 9923 +0.008s ... 0.297s
#12 getting avg benchmarks for device 9856 +0.003s ... 0.3s
#13 got single benchmarks 9856 +0.015s ... 0.315s
#14 got avg benchmarks for devices +0s ... 0.315s
#15 min, max, avg, median took s +0.354s ... 0.669s
#16 before gaming benchmark output +0s ... 0.669s
#17 Got 243 rows for game benchmarks. +0.033s ... 0.702s
#18 composed SQL query for gamebenchmarks +0s ... 0.702s
#19 got data and put it in $dataArray +0.047s ... 0.749s
#20 benchmarks composed for output. +0.147s ... 0.896s
#21 calculated avg scores. +0s ... 0.896s
#22 return log +0.003s ... 0.899s
Please share our article, every link counts!
Redaktion, 2017-09- 8 (Update: 2023-07- 1)
 Deutsch
 English
 Español
 Français
 Italiano
 Nederlands
 Polski
 Português
 Русский
 Türkçe
 Svenska
 Chinese
 Magyar