 Deutsch
 English
 Español
 Français
 Italiano
 Nederlands
 Polski
 Português
 Русский
 Türkçe
 Svenska
 Chinese
 Magyar
NVIDIA GeForce GTX 1050 Ti Max-Q vs NVIDIA T600 Laptop GPU vs NVIDIA Quadro RTX 6000 (Laptop)
NVIDIA GeForce GTX 1050 Ti Max-Q
► remove from comparison
The Nvidia GTX 1050 Ti with Max-Q design is a power efficient mainstream GPU for laptops based on the Pascal architecture and was announced in January 2017. Contrary to the faster models, the GTX 1050 uses the GP107 chip, which is manufactured in a 14 nm process at Samsung.
The clock is not the only difference compared to the regular GTX 1050 Ti though. The drivers for the Max-Q version were optimized for efficiency (and not performance; only for Max-Q models), there are optimized voltage converters for 1V operation, high-end cooling methods, and a 40 dB limit for the fan noise (with clock adjustments to ensure this at all times).
Features
The GP107 chip is manufactured in a 14 nm FinFET process at Samsung and offers a number of new features, including support for DisplayPort 1.4 (ready), HDMI 2.0b, HDR, Simultaneous Multi-Projection (SMP) as well as improved H.265 video de- and encoding (PlayReady 3.0). A full list of improvements and the new Pascal desktop GPUs is available in our dedicated Pascal architecture article.
Performance
The performance of the GeForce GTX 1050 Ti can vary quite a lot depending on the cooling performance of the laptop. Nvidia states that the Max-Q variant should be about 10 to 15% slower than a regular GTX 1050 Ti for laptops. Therefore, the GPU is most suited for Full HD and high quality settings for games of 2016.
Power Consumption
The power consumption of the GeForce GTX 1050 Ti with Max-Q design is rated at 40 to 46 Watt and therefore a lot lower than a regular GTX 1050 Ti for laptops (53 Watt). This means that the Max-Q GTX 1050 Ti is also suited for thin and light laptops.
NVIDIA T600 Laptop GPU
► remove from comparison
The Nvidia T600 Laptop GPU (or Quadro T600 for laptops) is a professional mobile graphics card that is based on the Turing architecture (TU117 chip). It is similar to the consumer GTX 1650 with 896 CUDA cores and a 128 Bit memory bus for GDDR6 graphics memory (10 Gbits). The chip is manufactured in 12nm FinFET at TSMC. The T600 was introduced as a refresh together with the T1200 and should be slightly slower than the older Quadro T1000 (2.6 versus 2.5 TFLOPS peak SP performance).
The Turing generation did not only introduce raytracing for the RTX cards, but also optimized the architecture of the cores and caches. According to Nvidia the CUDA cores offer now a concurrent execution of floating point and integer operations for increased performance in compute-heavy workloads of modern games.
Furthermore, the caches were reworked (new unified memory architecture with twice the cache compared to Pascal). This leads to up to 50% more instructions per clock and a 40% more power efficient usage compared to Pascal. In contrary to the faster Quadro RTX cards, the T600 do not feature raytracing and Tensor cores.
Currently Nvidia only specifies the TDP of 25 Watt (the older T1000 had a TGP of 40-50 Watt). Therefore, the T600 should be well suited for thin and light laptops.
NVIDIA Quadro RTX 6000 (Laptop)
► remove from comparison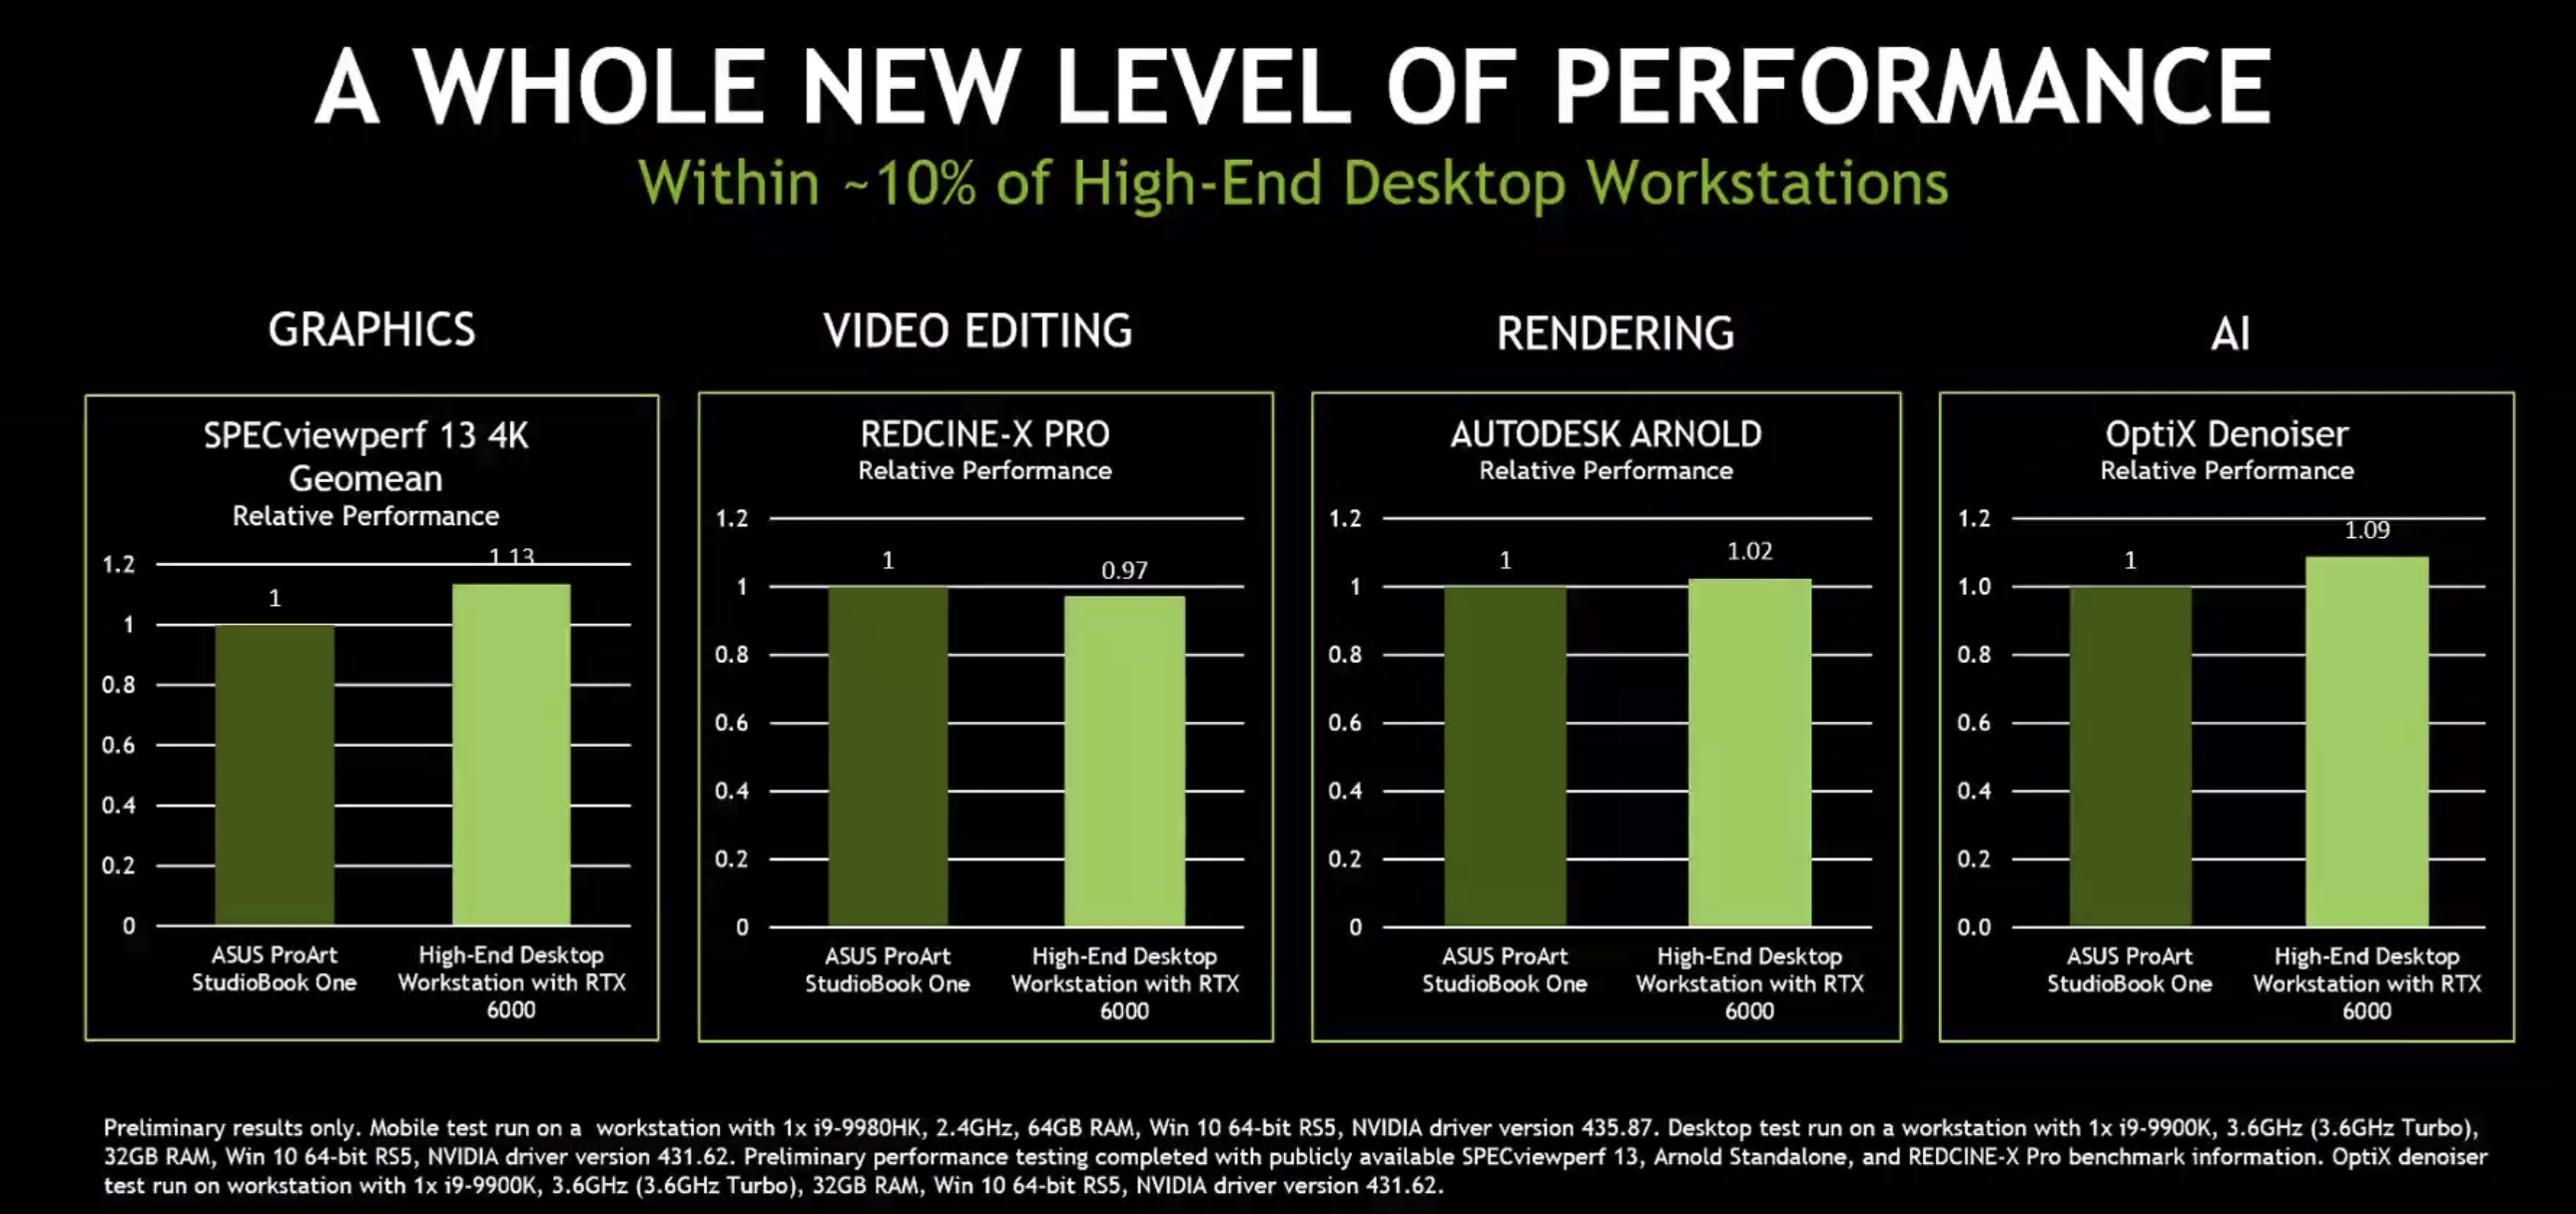
The Nvidia Quadro RTX 6000 for laptops is a professional high-end graphics card for big and powerful laptops and mobile workstations. It is based on the same TU102 chip as the consumer GeForce RTX 2080 Ti. Compared to the desktop RTX 6000, the mobile variant offers lower clock speeds.
The Quadro GPUs offer certified drivers, which are optimized for stability and performance in professional applications (CAD, DCC, medical, prospection, and visualizing applications). The performance in these areas is therefore much better compared to corresponding consumer GPUs.
Features
NVIDIA manufacturers the TU102 chip on a 12 nm FinFET process and includes features like Deep Learning Super Sampling (DLSS) and Real-Time Ray Tracing (RTRT), which should combine to create more realistic lighting effects than older GPUs based on the company's Pascal architecture (if the games support it). The Quadro RTX 6000 is also DisplayPort 1.4 ready, while there is also support for HDMI 2.0b, HDR, Simultaneous Multi-Projection (SMP) and H.265 video en/decoding (PlayReady 3.0).
Performance
Due to the lower clock speeds, the mobile RTX 6000 lags slightly behind the desktop version with the same name. Nvidia states for example that a desktop system using the RTX 6000 is on average 13% faster in the SPECviewperf13 4k benchmark.
Due to the extremely high power consumption of 200 Watt (TDP), the mobile Quadro RTX 6000 needs an excellent cooling solution and will be used only in big laptops.
| NVIDIA GeForce GTX 1050 Ti Max-Q | NVIDIA T600 Laptop GPU | NVIDIA Quadro RTX 6000 (Laptop) | ||||||||||||||||||||||||||||||||||||||||||||||||||||||||||||||||||||||||||||||||||||||||||||||||||||||||||||||||||||||||||||||||||||||||||||||||||||||||||||||||
| Quadro Turing Series |
|
|
| |||||||||||||||||||||||||||||||||||||||||||||||||||||||||||||||||||||||||||||||||||||||||||||||||||||||||||||||||||||||||||||||||||||||||||||||||||||||||||||||
| Codename | N17P-G1 Max-Q | TU102 | ||||||||||||||||||||||||||||||||||||||||||||||||||||||||||||||||||||||||||||||||||||||||||||||||||||||||||||||||||||||||||||||||||||||||||||||||||||||||||||||||
| Architecture | Pascal | Turing | Turing | |||||||||||||||||||||||||||||||||||||||||||||||||||||||||||||||||||||||||||||||||||||||||||||||||||||||||||||||||||||||||||||||||||||||||||||||||||||||||||||||
| Pipelines | 768 - unified | 896 - unified | 4608 - unified | |||||||||||||||||||||||||||||||||||||||||||||||||||||||||||||||||||||||||||||||||||||||||||||||||||||||||||||||||||||||||||||||||||||||||||||||||||||||||||||||
| Core Speed | 1151 – 1290 - 1290 – 1417 (Boost) MHz | 1400 (Boost) MHz | 1275 - 1455 (Boost) MHz | |||||||||||||||||||||||||||||||||||||||||||||||||||||||||||||||||||||||||||||||||||||||||||||||||||||||||||||||||||||||||||||||||||||||||||||||||||||||||||||||
| Memory Speed | 7000 MHz | 10000 MHz | 14000 MHz | |||||||||||||||||||||||||||||||||||||||||||||||||||||||||||||||||||||||||||||||||||||||||||||||||||||||||||||||||||||||||||||||||||||||||||||||||||||||||||||||
| Memory Bus Width | 128 Bit | 128 Bit | 384 Bit | |||||||||||||||||||||||||||||||||||||||||||||||||||||||||||||||||||||||||||||||||||||||||||||||||||||||||||||||||||||||||||||||||||||||||||||||||||||||||||||||
| Memory Type | GDDR5 | GDDR6 | GDDR6 | |||||||||||||||||||||||||||||||||||||||||||||||||||||||||||||||||||||||||||||||||||||||||||||||||||||||||||||||||||||||||||||||||||||||||||||||||||||||||||||||
| Max. Amount of Memory | 4 GB | 4 GB | 24 GB | |||||||||||||||||||||||||||||||||||||||||||||||||||||||||||||||||||||||||||||||||||||||||||||||||||||||||||||||||||||||||||||||||||||||||||||||||||||||||||||||
| Shared Memory | no | no | no | |||||||||||||||||||||||||||||||||||||||||||||||||||||||||||||||||||||||||||||||||||||||||||||||||||||||||||||||||||||||||||||||||||||||||||||||||||||||||||||||
| API | DirectX 12_1, OpenGL 4.5 | DirectX 12_1, OpenGL 4.6 | DirectX 12_1, OpenGL 4.6 | |||||||||||||||||||||||||||||||||||||||||||||||||||||||||||||||||||||||||||||||||||||||||||||||||||||||||||||||||||||||||||||||||||||||||||||||||||||||||||||||
| Power Consumption | 40 - 46 Watt | 40 Watt | 200 Watt | |||||||||||||||||||||||||||||||||||||||||||||||||||||||||||||||||||||||||||||||||||||||||||||||||||||||||||||||||||||||||||||||||||||||||||||||||||||||||||||||
| technology | 16 nm | 12 nm | 12 nm | |||||||||||||||||||||||||||||||||||||||||||||||||||||||||||||||||||||||||||||||||||||||||||||||||||||||||||||||||||||||||||||||||||||||||||||||||||||||||||||||
| Features | Multi-Projection, VR Ready, G-SYNC, Vulkan, Multi Monitor | 2.5 TFLOPS SP max. performance, DisplayPort 1.4, HDMI 2.0b, PCIe 4.0 x8, 160 GB/s memory bandwidth | NVLink, DLSS, Raytraycing, VR Ready, G-SYNC, Vulkan, Multi Monitor | |||||||||||||||||||||||||||||||||||||||||||||||||||||||||||||||||||||||||||||||||||||||||||||||||||||||||||||||||||||||||||||||||||||||||||||||||||||||||||||||
| Notebook Size | medium sized | medium sized | large | |||||||||||||||||||||||||||||||||||||||||||||||||||||||||||||||||||||||||||||||||||||||||||||||||||||||||||||||||||||||||||||||||||||||||||||||||||||||||||||||
| Date of Announcement | 03.01.2018 | 12.04.2021 | 04.09.2019 | |||||||||||||||||||||||||||||||||||||||||||||||||||||||||||||||||||||||||||||||||||||||||||||||||||||||||||||||||||||||||||||||||||||||||||||||||||||||||||||||
| Link to Manufacturer Page | www.nvidia.com | www.nvidia.com | ||||||||||||||||||||||||||||||||||||||||||||||||||||||||||||||||||||||||||||||||||||||||||||||||||||||||||||||||||||||||||||||||||||||||||||||||||||||||||||||||
| Transistors | 18.6 Billion |
Benchmarks
3DM Vant. Perf. total + NVIDIA GeForce GTX 1050 Ti Max-Q
Cinebench R15 OpenGL 64 Bit + NVIDIA GeForce GTX 1050 Ti Max-Q
GFXBench T-Rex HD Offscreen C24Z16 + NVIDIA GeForce GTX 1050 Ti Max-Q
* Smaller numbers mean a higher performance
1 This benchmark is not used for the average calculation
Game Benchmarks
The following benchmarks stem from our benchmarks of review laptops. The performance depends on the used graphics memory, clock rate, processor, system settings, drivers, and operating systems. So the results don't have to be representative for all laptops with this GPU. For detailed information on the benchmark results, click on the fps number.

Vampire Bloodhunt
2022
Ghostwire Tokyo
2022

Elex 2
2022
GRID Legends
2022
Elden Ring
2022
Dying Light 2
2022
Farming Simulator 22
2021
Riders Republic
2021
Deathloop
2021


Dirt Rally 2.0
2019
Anthem
2019
Far Cry New Dawn
2019
Metro Exodus
2019
Just Cause 4
2018
Darksiders III
2018
Battlefield V
2018
Farming Simulator 19
2018
Hitman 2
2018


Forza Horizon 4
2018

Strange Brigade
2018
F1 2018
2018
Monster Hunter World
2018
The Crew 2
2018
Far Cry 5
2018
X-Plane 11.11
2018


Destiny 2
2017

Team Fortress 2
2017Rocket League
2017Prey
2017For Honor
2017Farming Simulator 17
2016
Battlefield 1
2016
Civilization VI
2016
Overwatch
2016

The Division
2016

Rainbow Six Siege
2015
World of Warships
2015Dota 2 Reborn
2015
The Witcher 3
2015
GTA V
2015BioShock Infinite
2013
Diablo III
2012
StarCraft 2
2010Average Gaming NVIDIA GeForce GTX 1050 Ti Max-Q → 100%
Average Gaming 30-70 fps → 100%
Average Gaming NVIDIA T600 Laptop GPU → 116%
Average Gaming 30-70 fps → 121%
| NVIDIA T600 Laptop GPU | low | med. | high | ultra | QHD | 4K |
|---|---|---|---|---|---|---|
| Vampire Bloodhunt | 119 | 64.5 | 61.8 | 60.1 | ||
| Ghostwire Tokyo | 45.7 | 44.3 | 43.9 | 41.8 | ||
| Tiny Tina's Wonderlands | 57.5 | 32.8 | 48.3 | 27.2 | ||
| Elex 2 | 38.5 | 35.7 | 30.5 | 26.9 | ||
| GRID Legends | 104.1 | 71 | 57.7 | 41.9 | ||
| Elden Ring | 52.4 | 45 | 39 | 29.9 | ||
| Dying Light 2 | 31.7 | 23 | 18.3 | |||
| Farming Simulator 22 | 175.4 | 87.5 | 63.5 | 53.9 | ||
| Riders Republic | 91 | 52 | 39 | 30 | ||
| Deathloop | 68.9 | 34.4 | 28.4 | 25.2 | ||
| Resident Evil Village | 113.6 | 58.6 | 52.1 | 44 | ||
| Immortals Fenyx Rising | 72 | 45 | 36 | 31 | ||
| Mafia Definitive Edition | 83.6 | 40.4 | 34.9 | |||
| Shadow of the Tomb Raider | 98 | 53 | 42 | 36 | ||
| Strange Brigade | 190.4 | 76.2 | 60.7 | 52.7 | ||
| Far Cry 5 | 105 | 53 | 49 | 45 | ||
| X-Plane 11.11 | 107.9 | 92.4 | 77 | |||
| Final Fantasy XV Benchmark | 86 | 43.9 | 31 | |||
| Dota 2 Reborn | 149.4 | 127.6 | 115.8 | 107.1 | ||
| The Witcher 3 | 158.6 | 92.7 | 52.2 | 27.6 | ||
| GTA V | 142.6 | 137.6 | 82.3 | 44.1 | ||
| < 30 fps < 60 fps < 120 fps ≥ 120 fps | 5 11 5 | 1 12 6 2 | 2 13 6 | 5 10 2 | | |
| NVIDIA GeForce GTX 1050 Ti Max-Q | low | med. | high | ultra | QHD | 4K |
|---|---|---|---|---|---|---|
| Dirt Rally 2.0 | 133.2 | 56.7 | 44.3 | 27.2 | 11.3 | |
| Anthem | 67.1 | 40.5 | 34 | 30.4 | 9 | |
| Far Cry New Dawn | 86 | 49 | 45 | 42 | 29 | 15 |
| Metro Exodus | 58 | 41 | 30 | 24 | 4.7 | |
| Just Cause 4 | 73.2 | 47.9 | 36.1 | 35.3 | 12.9 | |
| Darksiders III | 134.5 | 87.4 | 73.7 | 65 | 13.2 | |
| Battlefield V | 100.1 | 57.3 | 47.9 | 44.8 | 17.3 | |
| Farming Simulator 19 | 193.6 | 128.7 | 80.5 | 61 | 22 | |
| Hitman 2 | 64.8 | 41 | 37.5 | 35.9 | 11.3 | |
| Call of Duty Black Ops 4 | 118.7 | 46.3 | 45 | 37.5 | 10.1 | |
| Assassin´s Creed Odyssey | 67 | 43 | 34 | 18 | 7 | |
| Forza Horizon 4 | 122 | 67 | 61 | 47 | 20 | |
| Shadow of the Tomb Raider | 97 | 39 | 35 | 29 | 11 | |
| F1 2018 | 134 | 80 | 62 | 38 | 17 | |
| Monster Hunter World | 100.3 | 39.2 | 34.9 | 26.8 | 8.3 | |
| The Crew 2 | 60 | 49.1 | 45.3 | 42 | 14 | |
| Far Cry 5 | 86 | 47 | 43 | 39 | 13 | |
| X-Plane 11.11 | 92.7 | 80.3 | 69.4 | 39.5 | ||
| Final Fantasy XV Benchmark | 68 | 37 | 24 | 9.2 | ||
| Star Wars Battlefront 2 | 92.3 | 42 | 34.3 | 30.4 | ||
| Assassin´s Creed Origins | 58 | 41 | 33 | 27 | 13 | |
| Destiny 2 | 119.5 | 69.4 | 64.3 | 57.9 | 18.9 | |
| Middle-earth: Shadow of War | 105 | 55 | 41 | 31 | 13 | |
| Team Fortress 2 | 129.8 | 123.6 | 115.7 | 112.6 | 65.2 | |
| Rocket League | 249.1 | 169.1 | 112.5 | 42.3 | ||
| Prey | 142.4 | 85.6 | 68.3 | 58.9 | 21.7 | |
| Ghost Recon Wildlands | 83 | 43 | 39 | 22 | 14 | |
| For Honor | 146 | 66 | 65 | 50 | 19 | |
| Farming Simulator 17 | 137.3 | 104.6 | ||||
| Battlefield 1 | 122 | 103 | 55 | 51 | 21 | |
| Civilization VI | 112.5 | 85.8 | 51 | 43 | ||
| Overwatch | 285.4 | 233.9 | 117.7 | 70.5 | 37 | |
| Ashes of the Singularity | 63 | 41.3 | 35.8 | 15.7 | ||
| The Division | 126 | 86 | 42 | 34 | 15 | |
| Rise of the Tomb Raider | 125 | 77 | 45 | 38 | 17 | |
| Rainbow Six Siege | 250 | 158 | 91 | 65 | 29 | |
| World of Warships | 168.6 | 143.9 | 112.7 | 101 | 34.4 | |
| Dota 2 Reborn | 111.9 | 104.2 | 98.1 | 93.5 | 46 | |
| The Witcher 3 | 133 | 83 | 48 | 28 | 16 | |
| GTA V | 150.4 | 143.3 | 78.9 | 34.5 | 35.5 | |
| BioShock Infinite | 280 | 206 | 182 | 73 | ||
| Diablo III | 228.2 | 202.6 | 202.1 | 170.1 | ||
| StarCraft 2 | 433.4 | 200.4 | 186.7 | 126.7 | ||
| < 30 fps < 60 fps < 120 fps ≥ 120 fps | 2 20 20 | 19 13 10 | 1 23 15 4 | 8 20 9 2 | 1 | 30 6 1 |
For more games that might be playable and a list of all games and graphics cards visit our Gaming List