Notebookcheck Logo

AMD Radeon 860M vs Intel Arc Graphics 140T

AMD Radeon 860M

► remove from comparison AMD Radeon 860M

The Radeon 860M is a fairly powerful RDNA 3.5 architecture iGPU that debuted in early 2025 in Krakan Point APUs and a direct successor to the Radeon 760M. It packs just a few differences under the hood, such as faster caches; its 8 CUs/WGPs (512 unified shaders) run at up to 3,000 MHz.

DX12 Ultimate, ray tracing, AI image generation and other modern features are all supported here, as are many popular video codecs including first and foremost AVC, HEVC, VP9 and AV1. The latest addition to that list, the VVC codec, is not HW-supported unlike it is with Intel Lunar Lake chips. Miracast and FreeSync support is present. The iGPU can drive up to 4 monitors simultaneously with resolutions as high as SUHD 4320p60.

RDNA 3.5-based GPUs are projected to be fully supported by AMD until some time in 2027.

Performance

Its gaming performance is good enough for playing 2024 games in low graphics settings.

Power consumption

Krakan Point chips are a single-die design, meaning the iGPU is built with the same TSMC N4P process as the CPU cores for above average, as of late 2024, power efficiency.

Intel Arc Graphics 140T

► remove from comparison Intel Arc 140T

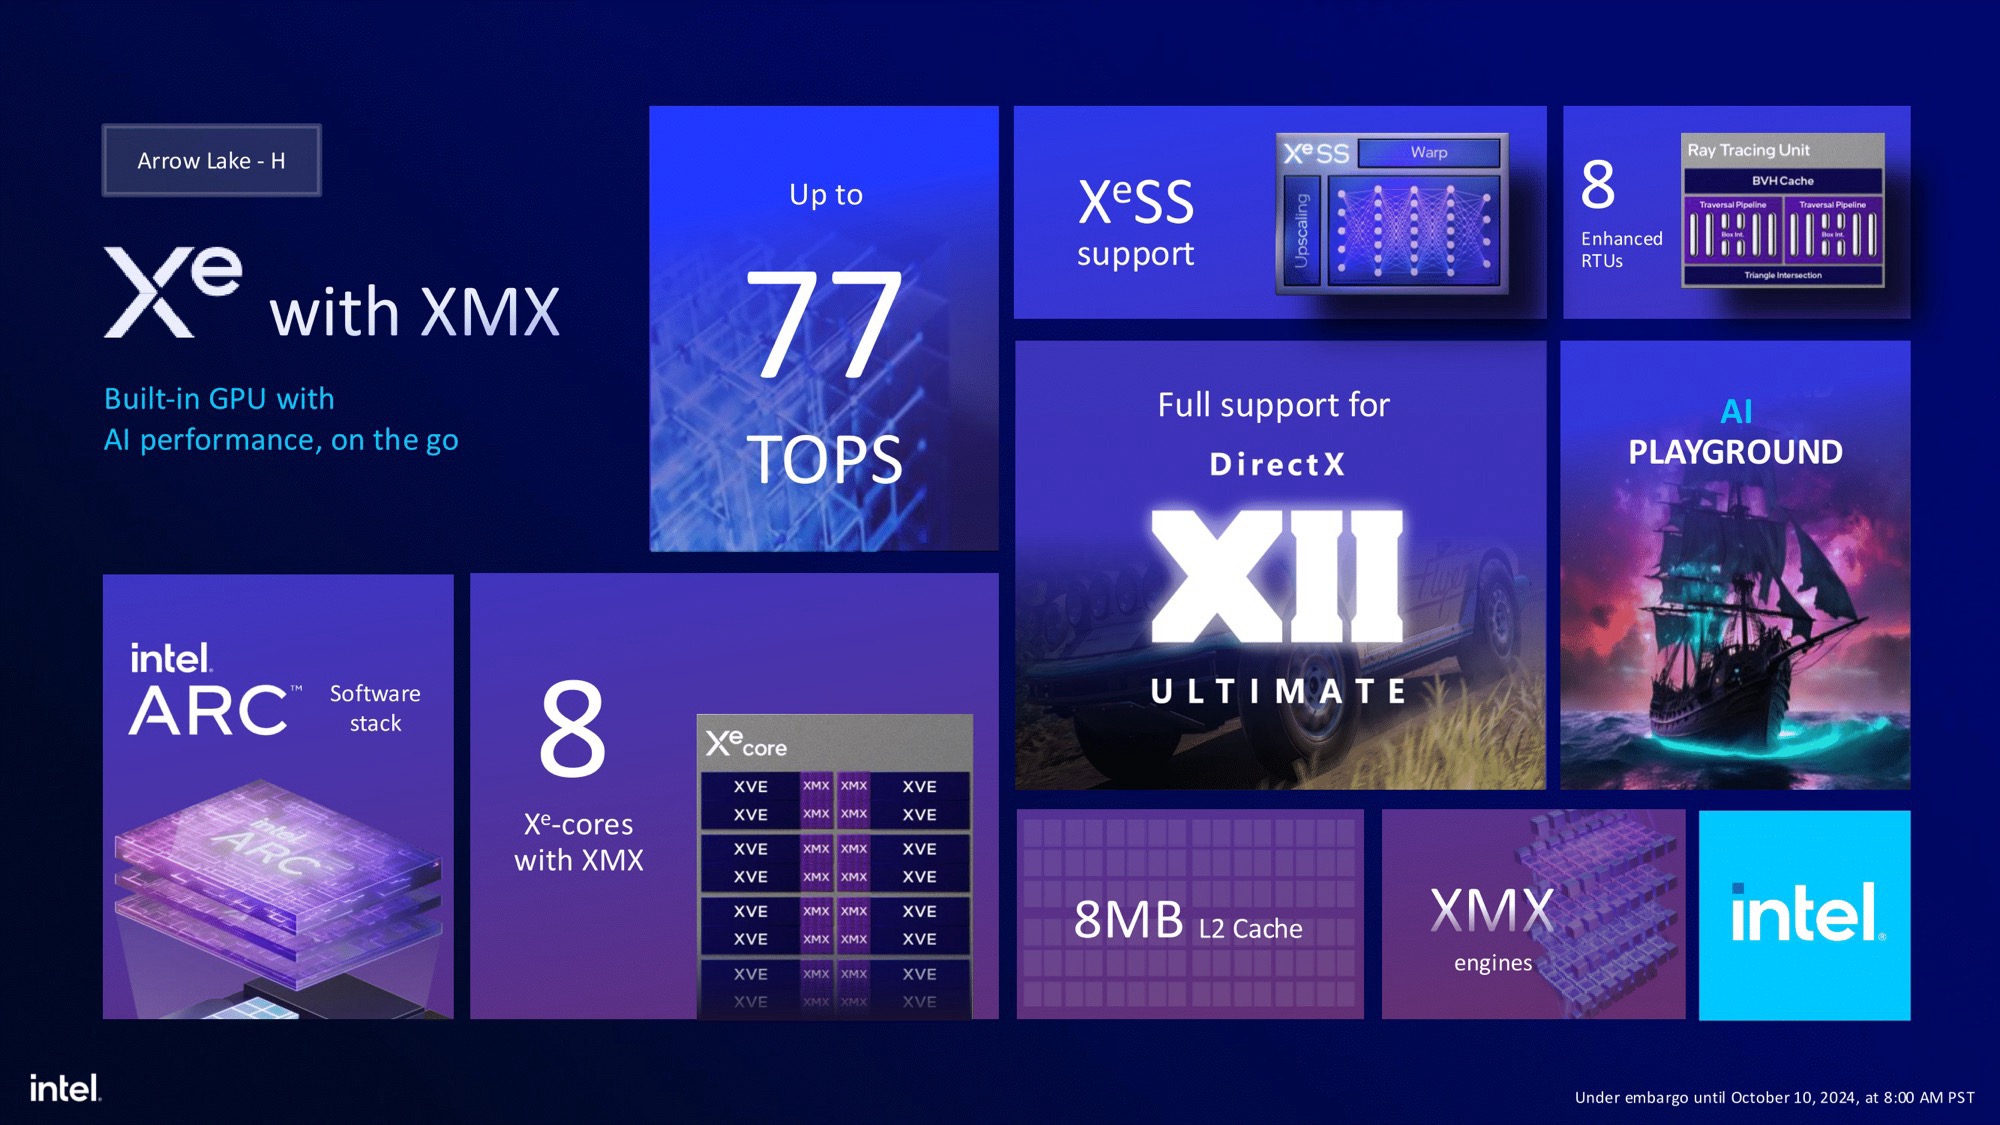
Intel Arc 140T is the iGPU used in the Intel Arrow Lake H/HX processor series. It is based on the Xe+ architecture (and not the newer Xe2 architecture that e.g. the Arc Graphics 140V in Lunar Lake uses). The graphics adapter features 8 cores (128 CUs, 8 Raytracing units) with XMX instructions for improved AI performance and 8 MB L2-Cache.

Thanks to the similar core count and clock speed but higher TDP, the performance should be similar to the Xe2 based Intel Arc 140V iGPU. First leaked benchmarks even showed a vastly better performance. All in all, we think that the Arc 140T will be only suited for entry level gaming in lowest settings.

The Arc 140T is integrated in the H and HX series of CPUs but use an own chiplet that is manufactured at TSMC in 5nm (N5P process).

AMD Radeon 860MIntel Arc Graphics 140T
AMD Radeon 800M Series
Radeon 890M compare 1024 @ 2.9 GHz? Bit @ 7500 MHz
Radeon 880M compare 768 @ 2.9 GHz? Bit @ 7500 MHz
Radeon 860M 512 @ 2.9 GHz? Bit @ 7500 MHz
Radeon 840M compare 256 @ 2.9 GHz? Bit @ 7500 MHz
CodenameKrackan Point
ArchitectureRDNA 3+Xe+
Pipelines512 - unified8 - unified
Raytracing Cores88
Core Speed2900 (Boost) MHz
Memory Speed7500 MHz
Shared Memoryyesyes
APIDirectX 12_2DirectX 12 Ultrimate
technology4 nm
PCIe4
Displays4 Displays (max.), HDMI 2.1, DisplayPort 2.1
FeaturesFreeSync, Miracast, SUHD 4320p60 resolution support, AVC/HEVC/VP9/AV1 encoding and decoding
Notebook Sizemedium sized
Date of Announcement02.06.2024 06.01.2025
PredecessorRadeon 760M
CacheL2: 8 MB
CPU in Radeon 860MGPU Base SpeedGPU Boost / Turbo
AMD Ryzen AI 7 3508 x 2000 MHz, 28 W? MHz3000 MHz
AMD Ryzen AI 7 PRO 3508 x 2000 MHz, 28 W? MHz3000 MHz
min. - max.? MHz3000 MHz
CPU in Arc 140TGPU Base SpeedGPU Boost / Turbo
Intel Core Ultra 9 285H16 x 4500 MHz, 45 W? MHz2350 MHz
Intel Core Ultra 7 265H16 x 4500 MHz, 28 W? MHz2300 MHz
Intel Core Ultra 7 255H16 x 4400 MHz, 28 W? MHz2250 MHz
Intel Core Ultra 5 235H16 x 4400 MHz, 28 W? MHz2250 MHz
min. - max.? MHz2250 - 2350 MHz

Benchmarks

Performance Rating - 3DMark 11 + Fire Strike + Time Spy - Radeon 860M
2.7 pt (8%)
Restrict / Search: Model: Max. age: years
Performance Rating - 3DMark 11 + Fire Strike + Time Spy - Arc 140T
3.5 pt (10%)
Restrict / Search: Model: Max. age: years
3DMark - 3DMark Time Spy Score
min: 1883     avg: 2937     median: 3147 (8%)     max: 3347 Points
min: 4041     avg: 4425     median: 4421 (12%)     max: 4694 Points
3DMark - 3DMark Time Spy Graphics
min: 1656     avg: 2626     median: 2868 (6%)     max: 2987 Points
min: 3629     avg: 4019     median: 4074 (8%)     max: 4212 Points
3DMark - 3DMark Ice Storm Extreme Graphics
237569 Points (28%)
3DMark - 3DMark Cloud Gate Score
22791 Points (22%)
min: 36844     avg: 38897     median: 38897 (37%)     max: 40950 Points
3DMark - 3DMark Cloud Gate Graphics
24614 Points (6%)
min: 48687     avg: 51620     median: 51620 (13%)     max: 54553 Points
3DMark - 3DMark Fire Strike Standard Score
min: 3999     avg: 6314     median: 6715 (10%)     max: 7241 Points
min: 8153     avg: 8715     median: 8721 (13%)     max: 9595 Points
3DMark - 3DMark Fire Strike Standard Graphics
min: 4449     avg: 6910     median: 7335 (7%)     max: 7935 Points
min: 8697     avg: 9473     median: 9328 (9%)     max: 10299 Points
3DMark - 3DMark Ice Storm Graphics
210628 Points (23%)
316591 Points (35%)
3DMark - 3DMark Wild Life Extreme Unlimited
min: 5570     avg: 5872     median: 6020 (7%)     max: 6025 Points
7632 Points (9%)
3DMark 11 - 3DM11 Performance Score
min: 6804     avg: 10859     median: 11800 (14%)     max: 12267 Points
min: 12521     avg: 13596     median: 13428 (16%)     max: 14934 Points
3DMark 11 - 3DM11 Performance GPU
min: 6901     avg: 10803     median: 11680 (9%)     max: 12149 Points
min: 11868     avg: 13094     median: 12566 (10%)     max: 14932 Points
3DMark Vantage
3DM Vant. Perf. total + AMD Radeon 860M
3DMark Vantage - 3DM Vant. Perf. total
24821 Points (7%)
3DM Vant. Perf. total + Intel Arc Graphics 140T
58039 Points (17%)
3DM Vant. Perf. GPU no PhysX + AMD Radeon 860M
3DMark Vantage - 3DM Vant. Perf. GPU no PhysX
20346 Points (11%)
3DM Vant. Perf. GPU no PhysX + Intel Arc Graphics 140T
52086 Points (28%)
3DMark 06 3DMark 06 - Standard 1280x1024 + AMD Radeon 860M
3DMark 06
15774 Points (21%)
3DMark 06 - Standard 1280x1024 + Intel Arc Graphics 140T
48766 Points (64%)
3DMark 06 - Standard 1280x720 + AMD Radeon 860M
3DMark 06
14855 Points (19%)
3DMark 06 - Standard 1024x768 + AMD Radeon 860M
3DMark 06
14920 Points (19%)
Cinebench R10 Cinebench R10 Shading (32bit) + AMD Radeon 860M
Cinebench R10 - Cinebench R10 Shading (32bit)
4517 Points (3%)
Cinebench R10 Shading (32bit) + Intel Arc Graphics 140T
21927 Points (16%)
Cinebench R11.5 Cinebench R11.5 OpenGL 64 Bit + Intel Arc Graphics 140T
Cinebench R11.5 - Cinebench R11.5 OpenGL 64 Bit
159.1 fps (52%)
Cinebench R15
Cinebench R15 OpenGL 64 Bit + AMD Radeon 860M
Cinebench R15 - Cinebench R15 OpenGL 64 Bit
min: 145.7     avg: 220.9     median: 238 (14%)     max: 253 fps
Cinebench R15 OpenGL 64 Bit + Intel Arc Graphics 140T
min: 195.5     avg: 203.9     median: 205 (12%)     max: 209 fps
Cinebench R15 OpenGL Ref. Match 64 Bit + AMD Radeon 860M
Cinebench R15 - Cinebench R15 OpenGL Ref. Match 64 Bit
97.9 % (98%)
Cinebench R15 OpenGL Ref. Match 64 Bit + Intel Arc Graphics 140T
97.8 % (98%)
GFXBench - GFXBench 5.0 4K Aztec Ruins High Tier Offscreen
min: 16.89     avg: 24.2     median: 24.1 (9%)     max: 31.4 fps
min: 38.3     avg: 41.2     median: 41.2 (15%)     max: 44.1 fps
GFXBench - GFXBench 5.0 Aztec Ruins High Tier Offscreen
min: 35.2     avg: 51.3     median: 51.3 (9%)     max: 67.4 fps
min: 81.3     avg: 90.8     median: 90.8 (16%)     max: 100.3 fps
GFXBench - GFXBench 5.0 Aztec Ruins Normal Tier Offscreen
min: 81.5     avg: 119.1     median: 119.1 (9%)     max: 156.6 fps
min: 208.5     avg: 229.6     median: 229.6 (17%)     max: 250.7 fps
GFXBench - GFXBench Car Chase Offscreen
min: 97.2     avg: 135.5     median: 135.5 (13%)     max: 173.7 fps
min: 155.2     avg: 164.9     median: 164.9 (16%)     max: 174.6 fps
GFXBench 3.1 - GFXBench Manhattan ES 3.1 Offscreen
229.4 fps (5%)
min: 249.6     avg: 269.5     median: 269.5 (6%)     max: 289.3 fps
GFXBench 3.0 - GFXBench 3.0 Manhattan Offscreen
289.7 fps (12%)
min: 374.3     avg: 405.3     median: 405.3 (17%)     max: 436.2 fps
GFXBench (DX / GLBenchmark) 2.7
GFXBench T-Rex HD Offscreen C24Z16 + AMD Radeon 860M
GFXBench (DX / GLBenchmark) 2.7 - GFXBench T-Rex HD Offscreen C24Z16
494.5 fps (4%)
GFXBench T-Rex HD Offscreen C24Z16 + Intel Arc Graphics 140T
min: 822.6     avg: 875     median: 874.8 (7%)     max: 927 fps
Basemark GPU 1.2 - Basemark GPU 1.2 Vulkan Official Medium Offscreen 1080
min: 104.6     avg: 230.8     median: 315 (8%)     max: 315 fps
min: 104.6     avg: 246     median: 315 (8%)     max: 379 fps
Basemark GPU 1.2 - Basemark GPU 1.2 Vulkan Official High Offscreen 2160
3.6 fps (1%)
Geekbench 6.4 - Geekbench 6.4 GPU OpenCL
min: 22403     avg: 24794     median: 24584 (6%)     max: 27133 Points
min: 39288     avg: 41485     median: 41775 (11%)     max: 43036 Points
Geekbench 6.4 - Geekbench 6.4 GPU Vulkan
min: 26038     avg: 35242     median: 36748 (9%)     max: 38899 Points
min: 32497     avg: 35040     median: 34146 (8%)     max: 38138 Points
LuxMark v2.0 64Bit - LuxMark v2.0 Room GPU
536 Samples/s (2%)
1156 Samples/s (4%)
LuxMark v2.0 64Bit - LuxMark v2.0 Sala GPU
974 Samples/s (2%)
3762 Samples/s (7%)
ComputeMark v2.1 - ComputeMark v2.1 Result
6397 Points (5%)
7948 Points (7%)
Power Consumption - Furmark Stress Test Power Consumption - external Monitor *
min: 47     avg: 59.4     median: 61.5 (8%)     max: 65.9 Watt
min: 45.8     avg: 51.6     median: 51.1 (7%)     max: 57.7 Watt
Power Consumption - Cyberpunk 2077 Power Consumption 150cd *
min: 54.5     avg: 71     median: 65.4 (19%)     max: 85.3 Watt
min: 48.7     avg: 60.6     median: 58.5 (17%)     max: 70 Watt
Power Consumption - Cyberpunk 2077 Power Consumption - external Monitor *
min: 58     avg: 71.2     median: 65.7 (8%)     max: 84.7 Watt
min: 47     avg: 58.5     median: 56.7 (7%)     max: 67.4 Watt
Power Consumption - Power Efficiency - Cyberpunk 2077 ultra
min: 0.181     avg: 0.2     median: 0.2 (1%)     max: 0.2984 fps per Watt
min: 0.368     avg: 0.4     median: 0.4 (1%)     max: 0.4468 fps per Watt

Average Benchmarks AMD Radeon 860M → 100% n=29

Average Benchmarks Intel Arc Graphics 140T → 175% n=29

- Range of benchmark values for this graphics card
red legend - Average benchmark values for this graphics card
* Smaller numbers mean a higher performance
1 This benchmark is not used for the average calculation

Game Benchmarks

The following benchmarks stem from our benchmarks of review laptops. The performance depends on the used graphics memory, clock rate, processor, system settings, drivers, and operating systems. So the results don't have to be representative for all laptops with this GPU. For detailed information on the benchmark results, click on the fps number.

F1 24

F1 24

2024
low 1920x1080
100%
Radeon 860M:
61.3 72.9 77.2 ~ 70 fps
111%
Arc 140T:
76 76.5 77.7 82.3 ~ 78 fps
med. 1920x1080
100%
Radeon 860M:
54.1 65.2 69.6 ~ 63 fps
113%
Arc 140T:
69.4 69.5 70.3 74.1 ~ 71 fps
high 1920x1080
100%
Radeon 860M:
48.7 51.8 ~ 50 fps
114%
Arc 140T:
54.2 56.6 58.9 ~ 57 fps
ultra 1920x1080
100%
Radeon 860M:
10.4 10.6 ~ 11 fps
173%
Arc 140T:
17.8 19.3 19.9 ~ 19 fps
low 1920x1080
100%
Radeon 860M:
24.3 37.1 40.4 40.4 42.8 ~ 37 fps
105%
Arc 140T:
35.9 37.3 37.6 40.8 41.7 ~ 39 fps
med. 1920x1080
100%
Radeon 860M:
18.9 28.3 29.9 31 32.8 ~ 28 fps
118%
Arc 140T:
30.4 32.3 33.5 34.7 ~ 33 fps
high 1920x1080
100%
Radeon 860M:
12.3 22.4 23.6 24.3 25.5 ~ 22 fps
127%
Arc 140T:
26.6 27.7 28.7 29.7 ~ 28 fps
ultra 1920x1080
100%
Radeon 860M:
11.1 17.9 19.1 19.9 20.9 ~ 18 fps
139%
Arc 140T:
22.8 24.1 24.5 26.5 27.3 ~ 25 fps
low 1920x1080
100%
Radeon 860M:
23.6 34 36 36.9 37 ~ 34 fps
112%
Arc 140T:
35.6 36.9 39.1 39.4 40.9 ~ 38 fps
med. 1920x1080
100%
Radeon 860M:
17.9 26.2 29 29.9 30.1 ~ 27 fps
111%
Arc 140T:
28.4 28.8 30 30.7 31.4 ~ 30 fps
high 1920x1080
100%
Radeon 860M:
14.6 20.4 23 23.5 23.6 ~ 21 fps
124%
Arc 140T:
24.8 25.1 25.3 25.7 26.9 ~ 26 fps
ultra 1920x1080
100%
Radeon 860M:
14.3 20 22.5 22.9 23.1 ~ 21 fps
119%
Arc 140T:
24.4 24.4 24.7 24.8 26.4 ~ 25 fps
Strange Brigade

Strange Brigade

2018
low 1280x720
100%
Radeon 860M:
88.5 165.4 171.3 177.3 ~ 151 fps
130%
Arc 140T:
160.5 200 208 216 ~ 196 fps
med. 1920x1080
100%
Radeon 860M:
34.7 65 68.2 70.8 ~ 60 fps
137%
Arc 140T:
61.6 83.6 90.2 90.9 ~ 82 fps
high 1920x1080
100%
Radeon 860M:
29.3 53.9 55.7 58.7 ~ 49 fps
143%
Arc 140T:
56.6 71.2 75.1 75.1 ~ 70 fps
ultra 1920x1080
100%
Radeon 860M:
25.2 45.5 45.7 48.5 ~ 41 fps
141%
Arc 140T:
48.6 59 61.2 61.6 ~ 58 fps
Far Cry 5

Far Cry 5

2018
low 1280x720
100%
Radeon 860M:
97 104 ~ 101 fps
83%
Arc 140T:
80 87 ~ 84 fps
med. 1920x1080
100%
Radeon 860M:
47 52 ~ 50 fps
96%
Arc 140T:
48 48 ~ 48 fps
high 1920x1080
100%
Radeon 860M:
43 47 ~ 45 fps
100%
Arc 140T:
44 45 ~ 45 fps
ultra 1920x1080
100%
Radeon 860M:
40 44 ~ 42 fps
95%
Arc 140T:
38 42 ~ 40 fps
low 1280x720
100%
Radeon 860M:
52.9 66.3 73.6 77.2 77.6 ~ 70 fps
79%
Arc 140T:
53.1 53.3 55.7 56.3 56.4 ~ 55 fps
med. 1920x1080
100%
Radeon 860M:
41.6 52.3 58.4 59 59.7 ~ 54 fps
83%
Arc 140T:
43.2 44.4 44.7 45.1 47.3 ~ 45 fps
high 1920x1080
100%
Radeon 860M:
34.9 43.4 47.7 47.8 48.6 ~ 44 fps
86%
Arc 140T:
37.7 38.1 38.4 38.5 38.8 ~ 38 fps
low 1280x720
100%
Radeon 860M:
40.6 66.7 78.7 83.9 85.6 ~ 71 fps
111%
Arc 140T:
72.3 72.9 80.1 80.6 90.1 ~ 79 fps
med. 1920x1080
100%
Radeon 860M:
21.6 35.5 37.9 39.2 41.5 ~ 35 fps
126%
Arc 140T:
40.8 42 44.2 46.9 47.9 ~ 44 fps
high 1920x1080
100%
Radeon 860M:
15.5 23.7 27.1 27.4 28.6 ~ 24 fps
121%
Arc 140T:
25.8 27.9 29.4 30.6 31.4 ~ 29 fps
low 1280x720
100%
Radeon 860M:
78.2 164.8 165.9 166.4 167.5 ~ 149 fps
71%
Arc 140T:
103.5 104.1 105.6 107.7 109.1 ~ 106 fps
med. 1366x768
100%
Radeon 860M:
50.9 122.6 134.9 137.9 139.5 ~ 117 fps
69%
Arc 140T:
68.8 78.3 83.5 84.7 89.6 ~ 81 fps
high 1920x1080
100%
Radeon 860M:
50.7 80.4 82.1 83.4 84.8 ~ 76 fps
100%
Arc 140T:
53.6 76.8 80.1 83.5 88.1 ~ 76 fps
ultra 1920x1080
100%
Radeon 860M:
39.8 74.2 77 78.1 78.7 ~ 70 fps
116%
Arc 140T:
69.5 75.5 80.1 83.8 94.9 ~ 81 fps
GTA V

GTA V

2015
low 1024x768
100%
Radeon 860M:
125.1 169.9 172.5 173.2 173.8 ~ 163 fps
103%
Arc 140T:
156.4 168.9 172 176.5 ~ 168 fps
med. 1366x768
100%
Radeon 860M:
113.6 153.3 157.2 157.4 160.5 ~ 148 fps
107%
Arc 140T:
152.3 153.9 161.1 165.2 ~ 158 fps
high 1920x1080
100%
Radeon 860M:
33.6 57.4 70 74.7 76 ~ 62 fps
66%
Arc 140T:
39.7 41.2 41.7 43.2 ~ 41 fps
ultra 1920x1080
100%
Radeon 860M:
13.5 22.2 27.8 28 30.7 ~ 24 fps
71%
Arc 140T:
16.3 16.8 17 17.1 ~ 17 fps

Average Gaming AMD Radeon 860M → 100%

Average Gaming 30-70 fps → 100%

Average Gaming Intel Arc Graphics 140T → 109%

Average Gaming 30-70 fps → 102%

AMD Radeon 860MIntel Arc Graphics 140T
lowmed.highultraQHD4Klowmed.highultraQHD4K
F1 247063501178715719
Cyberpunk 2077 2.2 Phantom Liberty3728221839332825
Baldur's Gate 33427212138302625
Strange Brigade151604941196827058
Far Cry 510150454284484540
X-Plane 11.11705444554538
Final Fantasy XV Benchmark713524794429
Dota 2 Reborn1491177670106817681
GTA V16314862241681584117
AMD Radeon 860MIntel Arc Graphics 140T
lowmed.highultraQHD4Klowmed.highultraQHD4K
< 30 fps
< 60 fps
< 120 fps
≥ 120 fps

2
4
3
2
3
3
1
3
4
2
4
2
1


< 30 fps
< 60 fps
< 120 fps
≥ 120 fps

3
4
2

5
3
1
3
4
2
4
2
1


For more games that might be playable and a list of all games and graphics cards visit our Gaming List

Add one or more devices and compare

In the following list you can select (and also search for) devices that should be added to the comparison. You can select more than one device.

restrict list:
v1.33
log 29. 07:00:19

#0 ran 0s before starting gpusingle class +0s ... 0s

#1 checking url part for id 12988 +0s ... 0s

#2 checking url part for id 12966 +0s ... 0s

#3 redirected to Ajax server, took 1751173218s time from redirect:0 +0s ... 0s

#4 did not recreate cache, as it is less than 5 days old! Created at Sat, 28 Jun 2025 05:20:36 +0200 +0s ... 0s

#5 composed specs +0.019s ... 0.019s

#6 did output specs +0s ... 0.019s

#7 start showIntegratedCPUs +0s ... 0.019s

#8 getting avg benchmarks for device 12988 +0.023s ... 0.042s

#9 got single benchmarks 12988 +0.008s ... 0.05s

#10 getting avg benchmarks for device 12966 +0.004s ... 0.054s

#11 got single benchmarks 12966 +0.008s ... 0.062s

#12 got avg benchmarks for devices +0s ... 0.062s

#13 min, max, avg, median took s +0.028s ... 0.09s

#14 before gaming benchmark output +0s ... 0.09s

#15 Got 422 rows for game benchmarks. +0.02s ... 0.11s

#16 composed SQL query for gamebenchmarks +0s ... 0.11s

#17 got data and put it in $dataArray +0.001s ... 0.111s

#18 benchmarks composed for output. +0.004s ... 0.115s

#19 calculated avg scores. +0s ... 0.115s

#20 return log +0.001s ... 0.117s

Please share our article, every link counts!
Mail Logo
> Expert Reviews and News on Laptops, Smartphones and Tech Innovations > Benchmarks / Tech > Graphics Card Comparison - Head 2 Head
Redaktion, 2017-09- 8 (Update: 2023-07- 1)