Notebookcheck Logo

Nvidia RTX A2000 vs NVIDIA RTX 500 Ada Generation Laptop

Nvidia RTX A2000

► remove from comparison NVIDIA RTX A2000

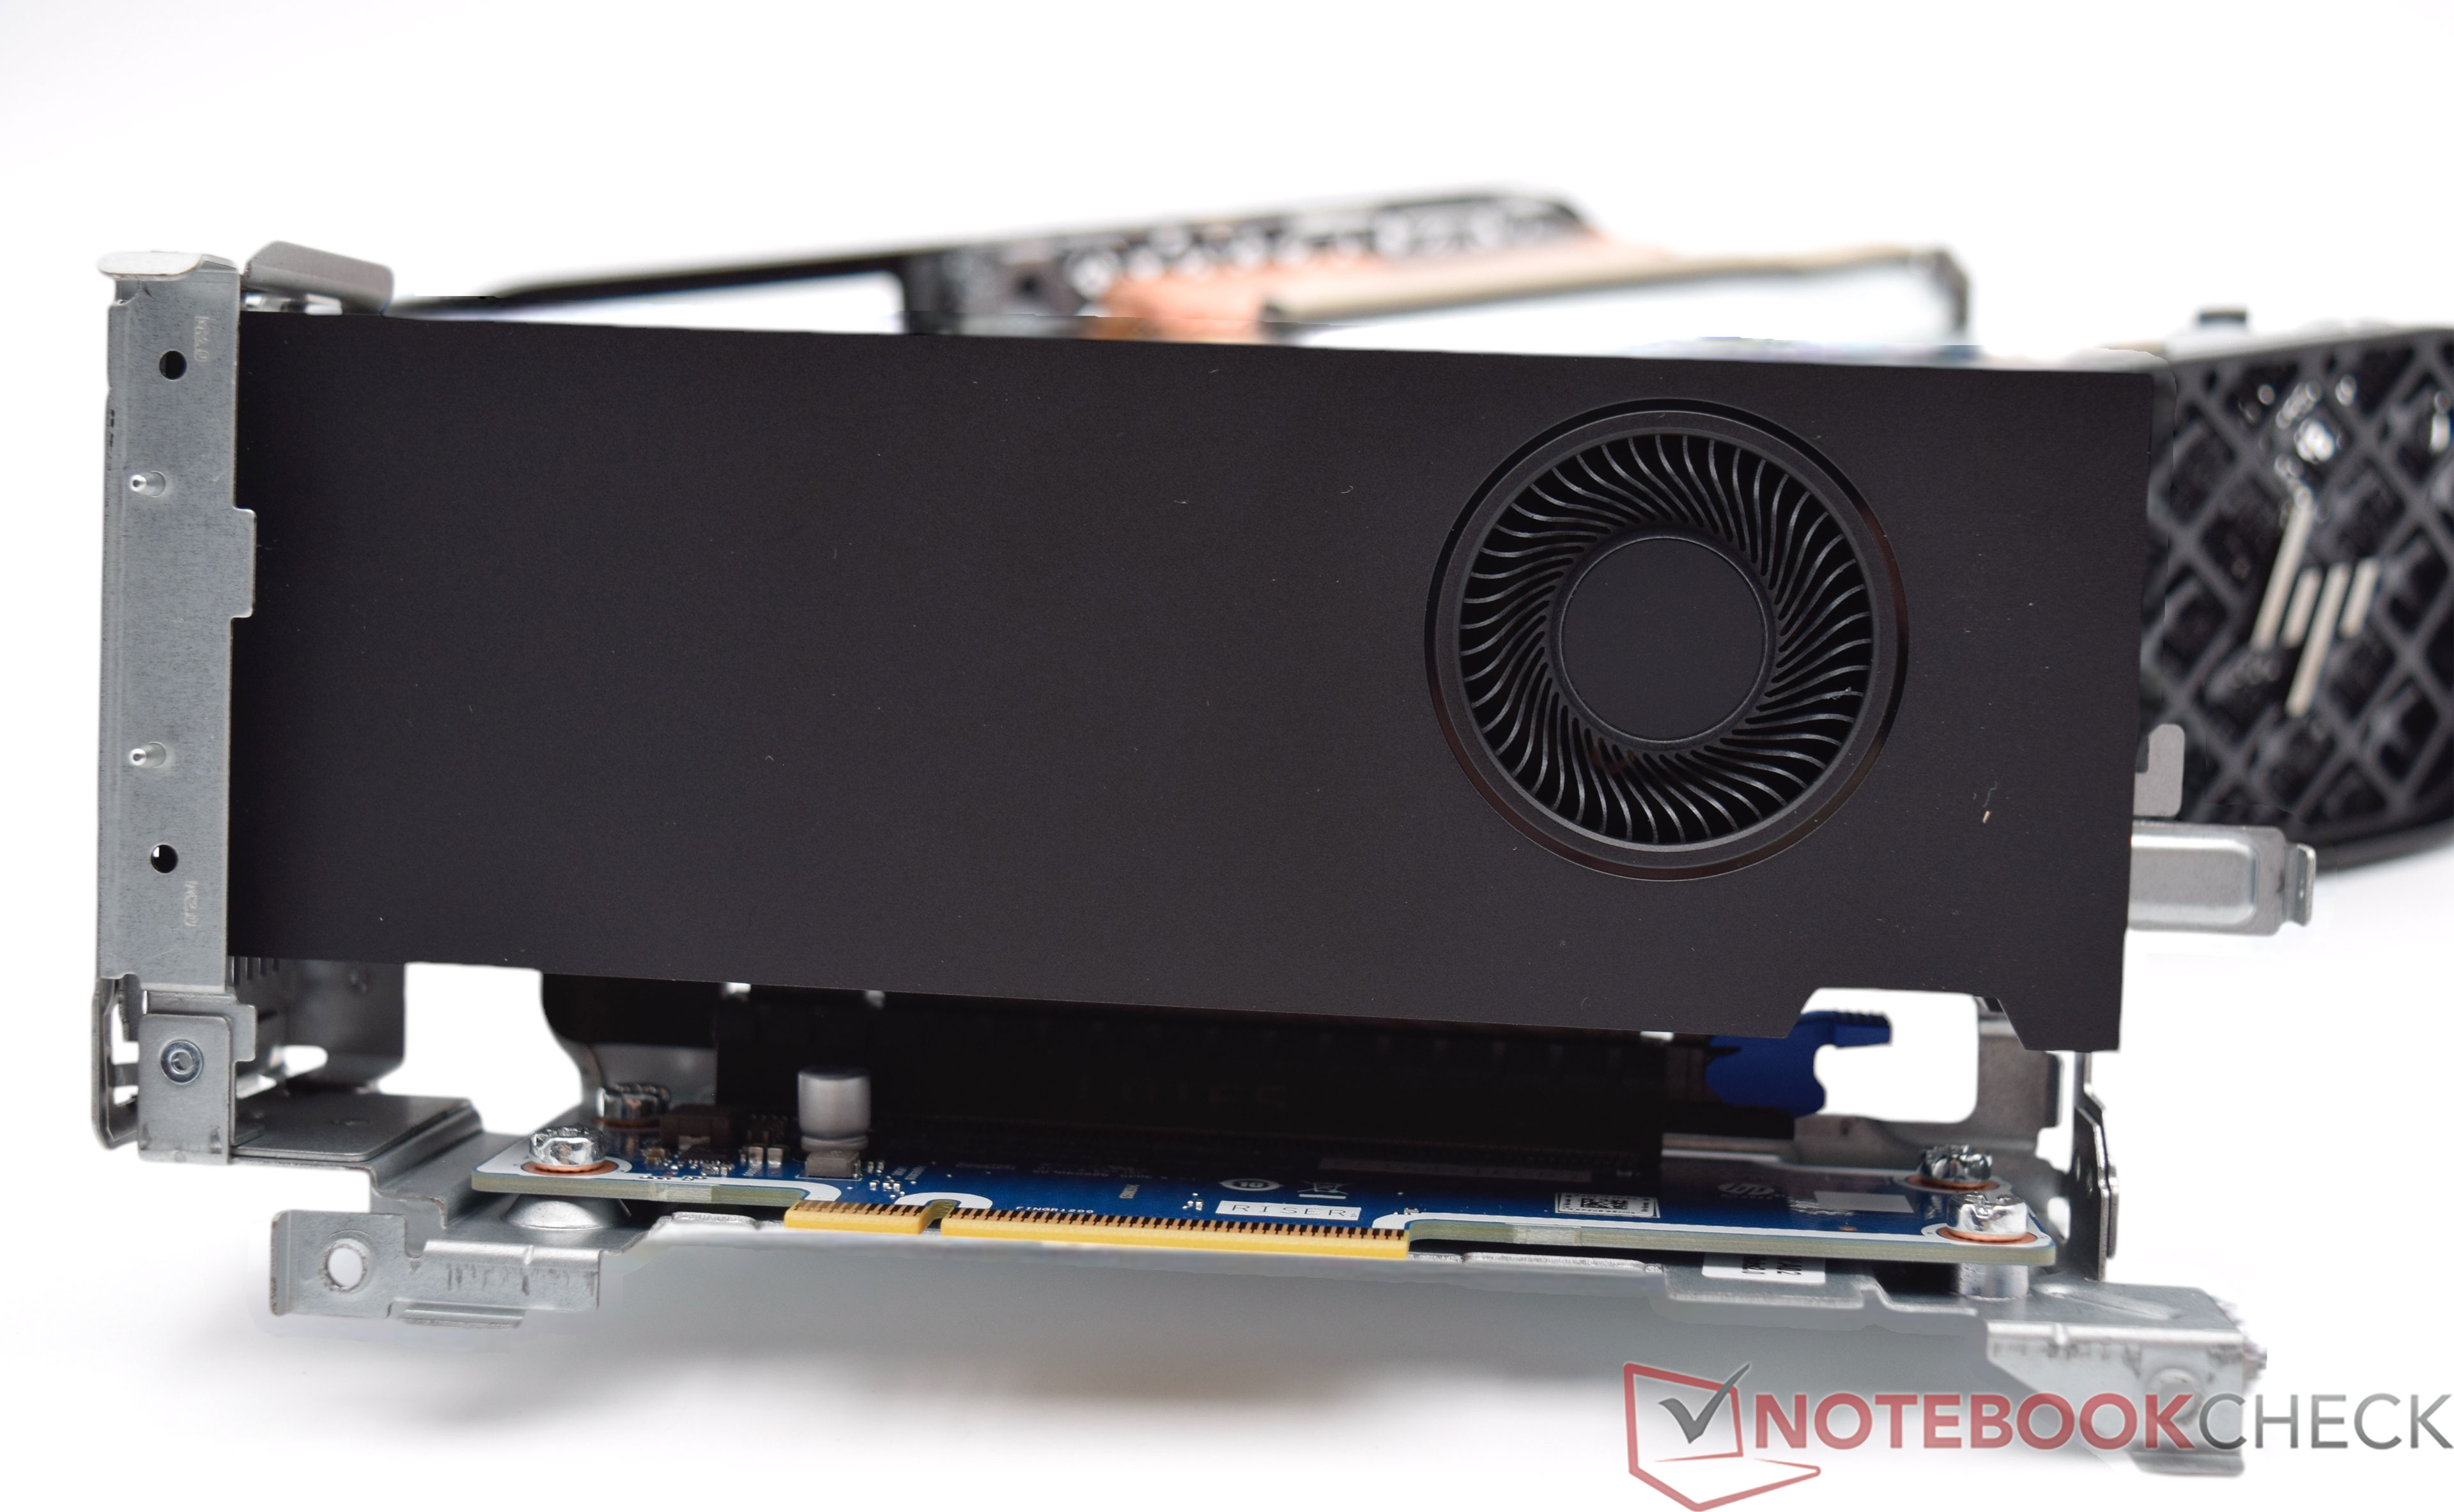
The Nvidia RTX A2000 Desktop GPU is a professional graphics card for small workstation PCs. It is based on the GA106 graphics chip, which is used in the GeForce RTX 3050 or GeForce RTX 3060 consumer graphics cards, among others. However, the GA106 only works with 3,328 active shader units, as well as 26 RT cores and 104 tensor units. The VRAM comprises 12 GB GDDR6 and communicates via a 192-bit memory interface. This results in a memory bandwidth of 288 GB/s.


The professional graphics cards from Nvidia offer certified drivers that are optimized for stability and performance in professional applications (CAD, DCC, medical, prospecting, visualization applications). This results in many advantages over consumer graphics cards.


Compact design and flexibility:


The RTX A2000 is designed in a low-profile form factor, making it ideal for smaller workstations or systems where space is a limited resource. Despite its compact size, the Nvidia RTX A2000 offers considerable computing power.


The graphics card is ideal for 3D modeling, CAD applications, video editing and visual effects where high precision and speed are paramount. Thanks to the combination of CUDA, Tensor and Raytracing cores, the Nvidia RTX A2000 offers significant performance improvements in the areas of real-time rendering and AI-supported image processing.


Energy efficiency and power consumption:


With a TDP of just 70 watts, the Nvidia RTX A2000 is one of the most energy efficient workstation GPUs on the market. This efficiency makes it possible to be more productive in workflows that require intensive graphics processing without compromising system performance or consuming excessive power.


In summary, the NVIDIA RTX A2000 is a compact, powerful and energy-efficient solution for professional users.

NVIDIA RTX 500 Ada Generation Laptop

► remove from comparison NVIDIA RTX 500 Ada Generation Laptop

The Nvidia RTX 500 Ada Generation, not to be confused with the A500, P500 and the T500, is a lower-end professional graphics card for use in laptops that sports 2,048 CUDA cores and a paltry 4 GB of GDDR6 VRAM. We believe this graphics card to be a heavily cut-down GeForce RTX 4050 Laptop; therefore, both should employ the Ada Lovelace AD107 chip built with TSMC's 5 nm process. The RTX 500 was launched in February 2024. The Nvidia-recommended TGP range for this graphics card is moderately wide at 35 W to 60 W [the second figure includes the Dynamic Boost, it seems] leading to noticeable performance differences between different systems powered by what is supposed to be the same graphics card.

Quadro series graphics cards ship with much different BIOS and drivers than GeForce cards and are targeted at professional users rather than gamers. Commercial product design, large-scale calculations, simulation, data mining, 24 x 7 operation, certified drivers - if any of this sounds familiar, then a Quadro card will make you happy.

Architecture and Features

Ada Lovelace brings a range of improvements over older graphics cards utilizing the outgoing Ampere architecture. It's not just a better manufacturing process and a higher number of CUDA cores that we have here; under-the-hood refinements are plentiful, including an immensely larger L2 cache, an optimized ray tracing routine (a different way to determine what is transparent and what isn't is used), and other changes. Naturally, these graphics cards can both encode and decode some of the most widely used video codecs, AVC, HEVC and AV1 included; they also support a host of proprietary Nvidia technologies, including Optimus and DLSS 3, and they can certainly be used for various AI applications.

The RTX 500 Ada features 16 RT cores of the 3rd generation, 64 Tensor cores of the 4th generation and 2,048 CUDA cores. Increase those numbers by 25%, and you get the RTX 1000 Ada - as long as we pay no attention to clock speed differences, of course. Unlike costlier Ada Generation professional laptop graphics cards, the RTX 500 comes with just 4 GB of non-ECC VRAM; the lack of error correction makes this card less suitable for super-important tasks and round-the-clock operation. The VRAM is just 64-bit wide, delivering an anemic bandwidth of ~128 GB/s.

The RTX 500 Ada Generation makes use of the PCI-Express 4 protocol, just like Ampere-based cards did. 8K SUHD monitors are supported, however, DP 1.4a video outputs may prove to be a bottleneck down the line.

Performance

At 50 W (35 W + 15 W Dynamic Boost), the graphics card can handle most 2023 and 2024 games like Baldur's Gate 3 at 1080p on high graphics settings. With a Geekbench 6.2 OpenCL GPU score of 61,500 points and a Blender v3.3 Classroom CUDA score of 71 seconds, it's clear the Ada is so much faster than any integrated GPUs on the market including the 890M.

Power consumption

With the latest Nvidia graphics cards, laptop makers are free to set the TGP according to their needs within a fairly wide range. With the RTX 500 Ada, we have the lowest value recommended sitting at just at 35 W while the highest value is 60 W [this most likely includes Dynamic Boost]. Real-world performance of the slowest RTX 500 Ada will probably be around 40% lower than that of the fastest one.

Last but not the least, the improved 5 nm process (TSMC 4N) the AD107 chip is built with makes for decent energy efficiency, as of early 2024.

Nvidia RTX A2000NVIDIA RTX 500 Ada Generation Laptop
RTX Ada Generation Laptop Series
RTX A5500 Laptop GPU compare 7424 256 Bit @ 16000 MHz
RTX A4500 Laptop GPU compare 5888 @ 0.93 - 1.5 GHz256 Bit @ 16000 MHz
RTX A5000 Laptop GPU compare 6144 @ 1.22 - 1.77 GHz256 Bit @ 14000 MHz
RTX A4000 Laptop GPU compare 5120 @ 0.78 - 1.68 GHz256 Bit @ 12000 MHz
RTX A3000 Laptop GPU compare 4096 @ 1.08 - 1.56 GHz192 Bit @ 14000 MHz
RTX A2000 3328 @ 0.56 - 1.2 GHz192 Bit @ 12000 MHz
RTX A2000 Laptop GPU compare 2560 @ 0.89 - 1.69 GHz128 Bit @ 14000 MHz
RTX A1000 Laptop GPU compare 2048 128 Bit @ 14000 MHz
RTX A500 Laptop GPU compare 2048 64 Bit @ 14000 MHz
RTX 5000 Ada Generation Laptop compare 9728 @ 0.93 - 1.68 GHz256 Bit @ 20000 MHz
RTX 4000 Ada Generation Laptop compare 7424 192 Bit @ 16000 MHz
RTX 3500 Ada Generation Laptop compare 5120 192 Bit @ 16000 MHz
RTX 3000 Ada Generation Laptop compare 4608 128 Bit @ 16000 MHz
RTX 2000 Ada Generation Laptop compare 3072 128 Bit @ 16000 MHz
RTX 1000 Ada Generation Laptop compare 2560 96 Bit @ 16000 MHz
RTX 500 Ada Generation Laptop 2048 @ 1.49 - 2.03 GHz64 Bit @ 12000 MHz
CodenameGA106
ArchitectureQuadro AmpereAda Lovelace
Pipelines3328 - unified2048 - unified
TMUs10464
ROPs4832
Raytracing Cores2616
Tensor / AI Cores10464
Core Speed562 - 1200 (Boost) MHz1485 - 2025 (Boost) MHz
Theoretical Performance7987 TFLOPS FP16, 7987 TFLOPS FP32, 0.1248 TFLOPS FP64
Memory Speed12000 effective = 1500 MHz12000 effective = 1500 MHz
Memory Bus Width192 Bit64 Bit
Memory TypeGDDR6GDDR6
Max. Amount of Memory12 GB4 GB
Shared Memorynono
Memory Bandwidth288 GB/s128 GB/s
APIDirectX 12 Ultimate (12_2), Shader 6.8, OpenGL 4.6, OpenCL 3.0, Vulkan 1.3DirectX 12 Ultimate, Shader 6.7, OpenGL 4.6, OpenCL 3.0, Vulkan 1.3
Power Consumption70 Watt60 Watt (35 - 60 Watt TGP)
Transistors12 Billion
Die Size 276 mm²
technology8 nm5 nm
PCIe4.0 x164.0 x16
Displays4 Displays (max.), DisplayPort 1.4a4 Displays (max.), HDMI 2.1, DisplayPort 1.4a
Features4x DisplayPort 1.4a, PCIe 4.0 x16
Date of Announcement23.11.2021 27.02.2024
AI GPU154 TOPS INT8
CacheL1: 2 MB, L2: 12 MB
Notebook Sizemedium sized
Link to Manufacturer Pageimages.nvidia.com

Benchmarks

Performance Rating - 3DMark 11 + Fire Strike + Time Spy - RTX A2000
5.6 pt (17%)
Restrict / Search: Model: Max. age: years
3DMark - 3DMark Speed Way Score
1393 Points (9%)
3DMark - 3DMark Steel Nomad
1283 Points (9%)
981 Points (7%)
3DMark - 3DMark Steel Nomad Light
5815 Points (13%)
5441 Points (12%)
3DMark - 3DMark Wild Life Extreme Unlimited
10353 Points (12%)
3DMark - 3DMark Solar Bay
26502 Points (12%)
3DMark - 3DMark Fire Strike Standard Score
14566 Points (22%)
min: 12761     avg: 13178     median: 13177.5 (20%)     max: 13594 Points
3DMark - 3DMark Fire Strike Standard Graphics
14934 Points (14%)
min: 14136     avg: 14610     median: 14610 (13%)     max: 15084 Points
3DMark - 3DMark Ice Storm Graphics
369883 Points (41%)
3DMark - 3DMark Time Spy Score
6282 Points (16%)
min: 5745     avg: 5902     median: 5902 (15%)     max: 6059 Points
3DMark - 3DMark Time Spy Graphics
5675 Points (12%)
min: 5278     avg: 5449     median: 5448.5 (11%)     max: 5619 Points
3DMark - 3DMark Ice Storm Unlimited Graphics
561627 Points (57%)
3DMark - 3DMark Ice Storm Extreme Graphics
310737 Points (36%)
3DMark - 3DMark Cloud Gate Score
56330 Points (53%)
47157 Points (45%)
3DMark - 3DMark Cloud Gate Graphics
94407 Points (23%)
92300 Points (23%)
3DMark - 3DMark Night Raid
48115 Points (45%)
3DMark - 3DMark Night Raid Graphics Score
68223 Points (26%)
3DMark 11 - 3DM11 Performance Score
20964 Points (25%)
min: 20365     avg: 20396     median: 20395.5 (25%)     max: 20426 Points
3DMark 11 - 3DM11 Performance GPU
19978 Points (15%)
min: 20239     avg: 20464     median: 20463.5 (16%)     max: 20688 Points
3DMark Vantage
3DM Vant. Perf. total + Nvidia RTX A2000
3DMark Vantage - 3DM Vant. Perf. total
76281 Points (22%)
3DM Vant. Perf. total + NVIDIA RTX 500 Ada Generation Laptop
66297 Points (19%)
3DM Vant. Perf. GPU no PhysX + Nvidia RTX A2000
3DMark Vantage - 3DM Vant. Perf. GPU no PhysX
71338 Points (39%)
3DM Vant. Perf. GPU no PhysX + NVIDIA RTX 500 Ada Generation Laptop
64680 Points (35%)
3DMark 05 - 3DMark 05 - Standard
63697 Points (70%)
3DMark 06 3DMark 06 - Standard 1280x1024 + Nvidia RTX A2000
3DMark 06
43178 Points (56%)
3DMark 06 - Standard 1280x1024 + NVIDIA RTX 500 Ada Generation Laptop
50935 Points (67%)
Unigine Valley 1.0 - Unigine Valley 1.0 DX
72.1 fps (22%)
59.2 fps (18%)
Blender - Blender 3.3 Classroom CUDA *
70 Seconds (10%)
min: 71     avg: 71.5     median: 71.5 (11%)     max: 72 Seconds
Blender - Blender 3.3 Classroom OPTIX *
37 Seconds (14%)
min: 39     avg: 41     median: 41 (15%)     max: 43 Seconds
SPECviewperf 12
specvp12 sw-03 + Nvidia RTX A2000
SPECviewperf 12 - specvp12 sw-03
135 fps (33%)
specvp12 sw-03 + NVIDIA RTX 500 Ada Generation Laptop
92 fps (23%)
specvp12 snx-02 + Nvidia RTX A2000
SPECviewperf 12 - specvp12 snx-02
125 fps (18%)
specvp12 snx-02 + NVIDIA RTX 500 Ada Generation Laptop
144 fps (21%)
specvp12 showcase-01 + Nvidia RTX A2000
SPECviewperf 12 - specvp12 showcase-01
79 fps (14%)
specvp12 showcase-01 + NVIDIA RTX 500 Ada Generation Laptop
57.6 fps (10%)
specvp12 mediacal-01 + Nvidia RTX A2000
SPECviewperf 12 - specvp12 mediacal-01
48 fps (12%)
specvp12 mediacal-01 + NVIDIA RTX 500 Ada Generation Laptop
51.8 fps (13%)
specvp12 maya-04 + Nvidia RTX A2000
SPECviewperf 12 - specvp12 maya-04
137 fps (37%)
specvp12 maya-04 + NVIDIA RTX 500 Ada Generation Laptop
131.7 fps (36%)
specvp12 energy-01 + Nvidia RTX A2000
SPECviewperf 12 - specvp12 energy-01
10.2 fps (9%)
specvp12 energy-01 + NVIDIA RTX 500 Ada Generation Laptop
1.8 fps (2%)
specvp12 creo-01 + Nvidia RTX A2000
SPECviewperf 12 - specvp12 creo-01
117 fps (47%)
specvp12 creo-01 + NVIDIA RTX 500 Ada Generation Laptop
121.6 fps (49%)
specvp12 catia-04 + Nvidia RTX A2000
SPECviewperf 12 - specvp12 catia-04
129 fps (21%)
specvp12 catia-04 + NVIDIA RTX 500 Ada Generation Laptop
147 fps (24%)
specvp12 3dsmax-05 + Nvidia RTX A2000
SPECviewperf 12 - specvp12 3dsmax-05
162 fps (24%)
specvp12 3dsmax-05 + NVIDIA RTX 500 Ada Generation Laptop
157.6 fps (24%)
SPECviewperf 13 specvp13 sw-04 + Nvidia RTX A2000
SPECviewperf 13 - specvp13 sw-04
138 fps (37%)
specvp13 sw-04 + NVIDIA RTX 500 Ada Generation Laptop
161.8 fps (43%)
specvp13 snx-03 + Nvidia RTX A2000
SPECviewperf 13 - specvp13 snx-03
239 fps (27%)
specvp13 snx-03 + NVIDIA RTX 500 Ada Generation Laptop
267.4 fps (30%)
specvp13 showcase-02 + Nvidia RTX A2000
SPECviewperf 13 - specvp13 showcase-02
79.2 fps (13%)
specvp13 showcase-02 + NVIDIA RTX 500 Ada Generation Laptop
55.9 fps (10%)
specvp13 medical-02 + Nvidia RTX A2000
SPECviewperf 13 - specvp13 medical-02
119 fps (20%)
specvp13 medical-02 + NVIDIA RTX 500 Ada Generation Laptop
141.9 fps (24%)
specvp13 maya-05 + Nvidia RTX A2000
SPECviewperf 13 - specvp13 maya-05
221 fps (25%)
specvp13 maya-05 + NVIDIA RTX 500 Ada Generation Laptop
203.2 fps (23%)
specvp13 energy-02 + Nvidia RTX A2000
SPECviewperf 13 - specvp13 energy-02
32.9 fps (11%)
specvp13 energy-02 + NVIDIA RTX 500 Ada Generation Laptop
2.8 fps (1%)
specvp13 creo-02 + Nvidia RTX A2000
SPECviewperf 13 - specvp13 creo-02
217 fps (32%)
specvp13 creo-02 + NVIDIA RTX 500 Ada Generation Laptop
193.2 fps (28%)
specvp13 3dsmax-06 + Nvidia RTX A2000
SPECviewperf 13 - specvp13 3dsmax-06
162 fps (25%)
specvp13 3dsmax-06 + NVIDIA RTX 500 Ada Generation Laptop
148.5 fps (23%)
specvp13 catia-05 + NVIDIA RTX 500 Ada Generation Laptop
SPECviewperf 13 - specvp13 catia-05
244.4 fps (27%)
SPECviewperf 2020 specvp2020 medical-03 1080p + Nvidia RTX A2000
SPECviewperf 2020 - specvp2020 medical-03 1080p
68.8 fps (19%)
specvp2020 medical-03 1080p + NVIDIA RTX 500 Ada Generation Laptop
min: 59.75     avg: 62.5     median: 62.5 (17%)     max: 65.25 fps
specvp2020 maya-06 1080p + Nvidia RTX A2000
SPECviewperf 2020 - specvp2020 maya-06 1080p
271 fps (29%)
specvp2020 maya-06 1080p + NVIDIA RTX 500 Ada Generation Laptop
241.1 fps (26%)
specvp2020 energy-03 1080p + Nvidia RTX A2000
SPECviewperf 2020 - specvp2020 energy-03 1080p
33.6 fps (5%)
specvp2020 energy-03 1080p + NVIDIA RTX 500 Ada Generation Laptop
min: 2.78     avg: 19.5     median: 19.5 (3%)     max: 36.12 fps
specvp2020 creo-03 1080p + Nvidia RTX A2000
SPECviewperf 2020 - specvp2020 creo-03 1080p
112 fps (38%)
specvp2020 creo-03 1080p + NVIDIA RTX 500 Ada Generation Laptop
min: 107.4     avg: 110.5     median: 110.5 (38%)     max: 113.62 fps
specvp2020 catia-06 1080p + Nvidia RTX A2000
SPECviewperf 2020 - specvp2020 catia-06 1080p
64 fps (31%)
specvp2020 catia-06 1080p + NVIDIA RTX 500 Ada Generation Laptop
min: 56.25     avg: 57.5     median: 57.5 (28%)     max: 58.71 fps
specvp2020 3dsmax-07 1080p + Nvidia RTX A2000
SPECviewperf 2020 - specvp2020 3dsmax-07 1080p
79.1 fps (21%)
specvp2020 3dsmax-07 1080p + NVIDIA RTX 500 Ada Generation Laptop
min: 59.56     avg: 59.7     median: 59.7 (16%)     max: 59.92 fps
specvp2020 snx-04 4k + Nvidia RTX A2000
SPECviewperf 2020 - specvp2020 snx-04 4k
159 fps (16%)
specvp2020 medical-03 4k + Nvidia RTX A2000
SPECviewperf 2020 - specvp2020 medical-03 4k
24.2 fps (16%)
specvp2020 maya-06 4k + Nvidia RTX A2000
SPECviewperf 2020 - specvp2020 maya-06 4k
126 fps (18%)
specvp2020 energy-03 4k + Nvidia RTX A2000
SPECviewperf 2020 - specvp2020 energy-03 4k
15.8 fps (3%)
specvp2020 creo-03 4k + Nvidia RTX A2000
SPECviewperf 2020 - specvp2020 creo-03 4k
75.1 fps (34%)
specvp2020 catia-06 4k + Nvidia RTX A2000
SPECviewperf 2020 - specvp2020 catia-06 4k
38.8 fps (25%)
specvp2020 3dsmax-07 4k + Nvidia RTX A2000
SPECviewperf 2020 - specvp2020 3dsmax-07 4k
49.8 fps (17%)
specvp2020 solidworks-07 1080p + NVIDIA RTX 500 Ada Generation Laptop
SPECviewperf 2020 - specvp2020 solidworks-07 1080p
min: 138.26     avg: 138.7     median: 138.7 (24%)     max: 139.14 fps
specvp2020 solidworks-05 1080p + NVIDIA RTX 500 Ada Generation Laptop
SPECviewperf 2020 - specvp2020 solidworks-05 1080p
136 fps (25%)
specvp2020 snx-04 1080p + NVIDIA RTX 500 Ada Generation Laptop
SPECviewperf 2020 - specvp2020 snx-04 1080p
min: 258.44     avg: 260.2     median: 260.2 (29%)     max: 261.92 fps
Cinebench R10 Cinebench R10 Shading (32bit) + Nvidia RTX A2000
Cinebench R10 - Cinebench R10 Shading (32bit)
6827 Points (5%)
Cinebench R11.5 Cinebench R11.5 OpenGL 64 Bit + Nvidia RTX A2000
Cinebench R11.5 - Cinebench R11.5 OpenGL 64 Bit
303.9 fps (100%)
Cinebench R15
Cinebench R15 OpenGL 64 Bit + Nvidia RTX A2000
Cinebench R15 - Cinebench R15 OpenGL 64 Bit
371.8 fps (22%)
Cinebench R15 OpenGL 64 Bit + NVIDIA RTX 500 Ada Generation Laptop
min: 252     avg: 273.5     median: 273.5 (16%)     max: 295 fps
Cinebench R15 OpenGL Ref. Match 64 Bit + Nvidia RTX A2000
Cinebench R15 - Cinebench R15 OpenGL Ref. Match 64 Bit
99.6 % (100%)
Cinebench R15 OpenGL Ref. Match 64 Bit + NVIDIA RTX 500 Ada Generation Laptop
99.6 % (100%)
GFXBench - GFXBench 5.0 4K Aztec Ruins High Tier Offscreen
52.7 fps (20%)
GFXBench - GFXBench 5.0 Aztec Ruins High Tier Offscreen
126.4 fps (23%)
GFXBench - GFXBench 5.0 Aztec Ruins Normal Tier Offscreen
353.2 fps (26%)
Basemark GPU 1.2 - Basemark GPU 1.2 Vulkan Official Medium Offscreen 1080
667 fps (16%)
min: 104.6     avg: 209.8     median: 209.8 (5%)     max: 315 fps
Basemark GPU 1.2 - Basemark GPU 1.2 Vulkan Official High Offscreen 2160
61.5 fps (11%)
Geekbench 6.5 - Geekbench 6.5 GPU OpenCL
72935 Points (19%)
min: 61467     avg: 62502     median: 62502 (16%)     max: 63537 Points
Geekbench 6.5 - Geekbench 6.5 GPU Vulkan
72741 Points (18%)
min: 34889     avg: 49556     median: 49555.5 (12%)     max: 64222 Points
LuxMark v2.0 64Bit - LuxMark v2.0 Room GPU
3120 Samples/s (11%)
1760 Samples/s (6%)
LuxMark v2.0 64Bit - LuxMark v2.0 Sala GPU
6758 Samples/s (12%)
5177 Samples/s (9%)
ComputeMark v2.1 - ComputeMark v2.1 Result
15520 Points (13%)
13116 Points (11%)
Power Consumption - Furmark Stress Test Power Consumption - external Monitor *
119.2 Watt (16%)
min: 73     avg: 75.9     median: 75.9 (10%)     max: 78.7 Watt
Power Consumption - The Witcher 3 Power Consumption - external Monitor *
81.5 Watt (11%)
Power Consumption - Power Efficiency - Witcher 3 ultra external Monitor
0.6 fps per Watt (52%)
Power Consumption - Cyberpunk 2077 Power Consumption 150cd *
min: 84     avg: 85.4     median: 85.4 (24%)     max: 86.7 Watt
Power Consumption - Cyberpunk 2077 Power Consumption - external Monitor *
244 Watt (31%)
min: 80.6     avg: 82.6     median: 82.6 (10%)     max: 84.6 Watt
Power Consumption - Power Efficiency - Cyberpunk 2077 ultra
0.2 fps per Watt (1%)
0.4 fps per Watt (2%)

Average Benchmarks Nvidia RTX A2000 → 100% n=47

Average Benchmarks NVIDIA RTX 500 Ada Generation Laptop → 87% n=47

- Range of benchmark values for this graphics card
red legend - Average benchmark values for this graphics card
* Smaller numbers mean a higher performance
1 This benchmark is not used for the average calculation

Game Benchmarks

The following benchmarks stem from our benchmarks of review laptops. The performance depends on the used graphics memory, clock rate, processor, system settings, drivers, and operating systems. So the results don't have to be representative for all laptops with this GPU. For detailed information on the benchmark results, click on the fps number.

F1 25

F1 25

2025
low 1920x1080
RTX 500 Ada Generation Laptop:
130  fps
med. 1920x1080
RTX 500 Ada Generation Laptop:
96.9  fps
high 1920x1080
RTX 500 Ada Generation Laptop:
73.6 74.6 ~ 74 fps
ultra 1920x1080
RTX 500 Ada Generation Laptop:
7.4  fps
low 1920x1080
100%
RTX A2000:
45  fps
med. 1920x1080
100%
RTX A2000:
34  fps
high 1920x1080
100%
RTX A2000:
26  fps
ultra 1920x1080
100%
RTX A2000:
13  fps
QHD 2560x1440
100%
RTX A2000:
10  fps
low 1920x1080
100%
RTX A2000:
117.7  fps
med. 1920x1080
100%
RTX A2000:
78.2  fps
high 1920x1080
100%
RTX A2000:
64  fps
ultra 1920x1080
100%
RTX A2000:
57.6  fps
QHD 2560x1440
100%
RTX A2000:
36.6  fps
4K 3840x2160
100%
RTX A2000:
18.3  fps
low 1920x1080
100%
RTX A2000:
102.6  fps
med. 1920x1080
100%
RTX A2000:
64.6  fps
high 1920x1080
100%
RTX A2000:
49.6  fps
ultra 1920x1080
100%
RTX A2000:
41.1  fps
QHD 2560x1440
100%
RTX A2000:
25.6  fps
4K 3840x2160
100%
RTX A2000:
13.3  fps
F1 24

F1 24

2024
low 1920x1080
100%
RTX A2000:
173.3  fps
65%
RTX 500 Ada Generation Laptop:
112.9  fps
med. 1920x1080
100%
RTX A2000:
144.7  fps
56%
RTX 500 Ada Generation Laptop:
80.8  fps
high 1920x1080
100%
RTX A2000:
104.6  fps
25%
RTX 500 Ada Generation Laptop:
26.5  fps
ultra 1920x1080
100%
RTX A2000:
32.5  fps
49%
RTX 500 Ada Generation Laptop:
16  fps
QHD 2560x1440
100%
RTX A2000:
20.2  fps
109%
RTX 500 Ada Generation Laptop:
22  fps
4K 3840x2160
100%
RTX A2000:
9.7  fps
4K DLSS 3840x2160
100%
RTX A2000:
17.9  fps
QHD DLSS 2560x1440
100%
RTX A2000:
34.2  fps
low 1920x1080
RTX 500 Ada Generation Laptop:
56.4  fps
med. 1920x1080
RTX 500 Ada Generation Laptop:
47.1  fps
high 1920x1080
RTX 500 Ada Generation Laptop:
40.2  fps
ultra 1920x1080
RTX 500 Ada Generation Laptop:
30.9  fps
QHD 2560x1440
RTX 500 Ada Generation Laptop:
22  fps
low 1920x1080
100%
RTX A2000:
90  fps
med. 1920x1080
100%
RTX A2000:
84  fps
high 1920x1080
100%
RTX A2000:
58  fps
ultra 1920x1080
100%
RTX A2000:
39  fps
QHD 2560x1440
100%
RTX A2000:
32  fps
4K 3840x2160
100%
RTX A2000:
22  fps
4K DLSS 3840x2160
100%
RTX A2000:
24  fps
low 1920x1080
100%
RTX A2000:
44  fps
95%
RTX 500 Ada Generation Laptop:
42  fps
med. 1920x1080
100%
RTX A2000:
39  fps
97%
RTX 500 Ada Generation Laptop:
38  fps
high 1920x1080
100%
RTX A2000:
34  fps
94%
RTX 500 Ada Generation Laptop:
32  fps
ultra 1920x1080
100%
RTX A2000:
25  fps
80%
RTX 500 Ada Generation Laptop:
20  fps
QHD 2560x1440
100%
RTX A2000:
16  fps
4K 3840x2160
100%
RTX A2000:
7  fps
4K DLSS 3840x2160
100%
RTX A2000:
14  fps
low 1920x1080
RTX 500 Ada Generation Laptop:
88  fps
med. 1920x1080
RTX 500 Ada Generation Laptop:
78  fps
high 1920x1080
RTX 500 Ada Generation Laptop:
58  fps
ultra 1920x1080
RTX 500 Ada Generation Laptop:
49  fps
QHD 2560x1440
RTX 500 Ada Generation Laptop:
33  fps
low 1920x1080
100%
RTX A2000:
85.4  fps
med. 1920x1080
100%
RTX A2000:
60.2  fps
high 1920x1080
100%
RTX A2000:
54.2  fps
ultra 1920x1080
100%
RTX A2000:
49.7  fps
QHD 2560x1440
100%
RTX A2000:
34.4  fps
4K 3840x2160
100%
RTX A2000:
18.6  fps
4K DLSS 3840x2160
100%
RTX A2000:
28.3  fps
low 1920x1080
100%
RTX A2000:
244.4  fps
81%
RTX 500 Ada Generation Laptop:
199  fps
med. 1920x1080
100%
RTX A2000:
155.3  fps
83%
RTX 500 Ada Generation Laptop:
129  fps
high 1920x1080
100%
RTX A2000:
87.3  fps
84%
RTX 500 Ada Generation Laptop:
73  fps
ultra 1920x1080
100%
RTX A2000:
69  fps
81%
RTX 500 Ada Generation Laptop:
56  fps
QHD 2560x1440
100%
RTX A2000:
46.2  fps
84%
RTX 500 Ada Generation Laptop:
39  fps
4K 3840x2160
100%
RTX A2000:
23.3  fps
low 1920x1080
RTX 500 Ada Generation Laptop:
78  fps
med. 1920x1080
RTX 500 Ada Generation Laptop:
69  fps
high 1920x1080
RTX 500 Ada Generation Laptop:
55  fps
ultra 1920x1080
RTX 500 Ada Generation Laptop:
40  fps
QHD 2560x1440
RTX 500 Ada Generation Laptop:
32  fps
low 1920x1080
100%
RTX A2000:
83.9  fps
75%
RTX 500 Ada Generation Laptop:
52.9 72.8 ~ 63 fps
med. 1920x1080
100%
RTX A2000:
61.9  fps
76%
RTX 500 Ada Generation Laptop:
37.7 55.5 ~ 47 fps
high 1920x1080
100%
RTX A2000:
51.8  fps
69%
RTX 500 Ada Generation Laptop:
25.4 45.6 ~ 36 fps
ultra 1920x1080
100%
RTX A2000:
44.7  fps
72%
RTX 500 Ada Generation Laptop:
25 39.6 ~ 32 fps
QHD 2560x1440
100%
RTX A2000:
25.5  fps
78%
RTX 500 Ada Generation Laptop:
19.8  fps
4K 3840x2160
100%
RTX A2000:
11  fps
low 1920x1080
100%
RTX A2000:
74.9  fps
100%
RTX 500 Ada Generation Laptop:
69.4 79.6 ~ 75 fps
med. 1920x1080
100%
RTX A2000:
58.8  fps
99%
RTX 500 Ada Generation Laptop:
53.6 61.9 ~ 58 fps
high 1920x1080
100%
RTX A2000:
50.8  fps
93%
RTX 500 Ada Generation Laptop:
39 54.9 ~ 47 fps
ultra 1920x1080
100%
RTX A2000:
49.9  fps
92%
RTX 500 Ada Generation Laptop:
38.9 53.1 ~ 46 fps
QHD 2560x1440
100%
RTX A2000:
34.4  fps
78%
RTX 500 Ada Generation Laptop:
26.8  fps
4K 3840x2160
100%
RTX A2000:
18.2  fps
4K DLSS 3840x2160
100%
RTX A2000:
30.2  fps
Starfield

Starfield

2023
low 1920x1080
100%
RTX A2000:
77.3  fps
med. 1920x1080
100%
RTX A2000:
61.1  fps
high 1920x1080
100%
RTX A2000:
40.5  fps
ultra 1920x1080
100%
RTX A2000:
33  fps
QHD 2560x1440
100%
RTX A2000:
26.6  fps
4K 3840x2160
100%
RTX A2000:
17.1  fps
F1 23

F1 23

2023
low 1920x1080
100%
RTX A2000:
185.1  fps
74%
RTX 500 Ada Generation Laptop:
136.5  fps
med. 1920x1080
100%
RTX A2000:
165.1  fps
73%
RTX 500 Ada Generation Laptop:
119.8  fps
high 1920x1080
100%
RTX A2000:
111.2  fps
76%
RTX 500 Ada Generation Laptop:
84.1  fps
ultra 1920x1080
100%
RTX A2000:
32.2  fps
78%
RTX 500 Ada Generation Laptop:
25  fps
QHD 2560x1440
100%
RTX A2000:
20  fps
80%
RTX 500 Ada Generation Laptop:
16  fps
4K 3840x2160
100%
RTX A2000:
9.4  fps
4K DLSS 3840x2160
100%
RTX A2000:
17.4  fps
low 1920x1080
100%
RTX A2000:
110  fps
med. 1920x1080
100%
RTX A2000:
92  fps
high 1920x1080
100%
RTX A2000:
69  fps
ultra 1920x1080
100%
RTX A2000:
68  fps
QHD 2560x1440
100%
RTX A2000:
50  fps
4K 3840x2160
100%
RTX A2000:
28  fps
Returnal

Returnal

2023
low 1920x1080
100%
RTX A2000:
65  fps
med. 1920x1080
100%
RTX A2000:
60  fps
high 1920x1080
100%
RTX A2000:
53  fps
ultra 1920x1080
100%
RTX A2000:
45  fps
QHD 2560x1440
100%
RTX A2000:
32  fps
4K 3840x2160
100%
RTX A2000:
18  fps
F1 22

F1 22

2022
low 1920x1080
100%
RTX A2000:
197.4  fps
76%
RTX 500 Ada Generation Laptop:
150.4  fps
med. 1920x1080
100%
RTX A2000:
181.5  fps
74%
RTX 500 Ada Generation Laptop:
134.4  fps
high 1920x1080
100%
RTX A2000:
125.3  fps
79%
RTX 500 Ada Generation Laptop:
99.6  fps
ultra 1920x1080
100%
RTX A2000:
37.5  fps
88%
RTX 500 Ada Generation Laptop:
32.9  fps
QHD 2560x1440
100%
RTX A2000:
23  fps
4K 3840x2160
100%
RTX A2000:
10.9  fps
low 1920x1080
100%
RTX A2000:
124  fps
med. 1920x1080
100%
RTX A2000:
99.4  fps
high 1920x1080
100%
RTX A2000:
66  fps
ultra 1920x1080
100%
RTX A2000:
51.2  fps
QHD 2560x1440
100%
RTX A2000:
34.3  fps
4K 3840x2160
100%
RTX A2000:
17.7  fps
low 1920x1080
100%
RTX A2000:
198  fps
med. 1920x1080
100%
RTX A2000:
142.1  fps
high 1920x1080
100%
RTX A2000:
115.4  fps
ultra 1920x1080
100%
RTX A2000:
81.7  fps
QHD 2560x1440
100%
RTX A2000:
62  fps
4K 3840x2160
100%
RTX A2000:
36.6  fps
low 1920x1080
100%
RTX A2000:
86.1  fps
med. 1920x1080
100%
RTX A2000:
72.9  fps
high 1920x1080
100%
RTX A2000:
57.4  fps
ultra 1920x1080
100%
RTX A2000:
38.9  fps
QHD 2560x1440
100%
RTX A2000:
30.9  fps
4K 3840x2160
100%
RTX A2000:
19.9  fps
low 1280x720
100%
RTX A2000:
351  fps
med. 1920x1080
100%
RTX A2000:
181.9  fps
high 1920x1080
100%
RTX A2000:
131.5  fps
ultra 1920x1080
100%
RTX A2000:
108.5  fps
QHD 2560x1440
100%
RTX A2000:
78.7  fps
4K 3840x2160
100%
RTX A2000:
45.2  fps
low 1280x720
100%
RTX A2000:
231  fps
med. 1920x1080
100%
RTX A2000:
121  fps
high 1920x1080
100%
RTX A2000:
106  fps
ultra 1920x1080
100%
RTX A2000:
59  fps
QHD 2560x1440
100%
RTX A2000:
43  fps
4K 3840x2160
100%
RTX A2000:
29  fps
low 1280x720
100%
RTX A2000:
199  fps
med. 1920x1080
100%
RTX A2000:
142  fps
high 1920x1080
100%
RTX A2000:
143  fps
ultra 1920x1080
100%
RTX A2000:
131  fps
QHD 2560x1440
100%
RTX A2000:
98  fps
4K 3840x2160
100%
RTX A2000:
55  fps
Far Cry 6

Far Cry 6

2021
low 1280x720
100%
RTX A2000:
180.4  fps
70%
RTX 500 Ada Generation Laptop:
126  fps
med. 1920x1080
100%
RTX A2000:
97.6  fps
82%
RTX 500 Ada Generation Laptop:
80  fps
high 1920x1080
100%
RTX A2000:
83.2  fps
82%
RTX 500 Ada Generation Laptop:
68  fps
ultra 1920x1080
100%
RTX A2000:
68.3  fps
QHD 2560x1440
100%
RTX A2000:
48.8  fps
4K 3840x2160
100%
RTX A2000:
25.7  fps
F1 2021

F1 2021

2021
low 1280x720
100%
RTX A2000:
448  fps
med. 1920x1080
100%
RTX A2000:
204  fps
high 1920x1080
100%
RTX A2000:
157.3  fps
ultra 1920x1080
100%
RTX A2000:
75.1  fps
QHD 2560x1440
100%
RTX A2000:
53.4  fps
4K 3840x2160
100%
RTX A2000:
28.4  fps
low 1280x720
100%
RTX A2000:
184  fps
med. 1920x1080
100%
RTX A2000:
104  fps
high 1920x1080
100%
RTX A2000:
83  fps
ultra 1920x1080
100%
RTX A2000:
68  fps
QHD 2560x1440
100%
RTX A2000:
52  fps
4K 3840x2160
100%
RTX A2000:
26  fps
4K DLSS 3840x2160
100%
RTX A2000:
39  fps
F1 2020

F1 2020

2020
low 1280x720
100%
RTX A2000:
405  fps
med. 1920x1080
100%
RTX A2000:
197.2  fps
high 1920x1080
100%
RTX A2000:
149.4  fps
ultra 1920x1080
100%
RTX A2000:
101.2  fps
QHD 2560x1440
100%
RTX A2000:
72  fps
4K 3840x2160
100%
RTX A2000:
38.8  fps
low 1280x720
100%
RTX A2000:
224  fps
med. 1920x1080
100%
RTX A2000:
108.1  fps
high 1920x1080
100%
RTX A2000:
68.6  fps
ultra 1920x1080
100%
RTX A2000:
52  fps
QHD 2560x1440
100%
RTX A2000:
35.2  fps
4K 3840x2160
100%
RTX A2000:
18.7  fps
low 1280x720
100%
RTX A2000:
370.4  fps
med. 1920x1080
100%
RTX A2000:
116.2  fps
high 1920x1080
100%
RTX A2000:
70.5  fps
ultra 1920x1080
100%
RTX A2000:
48.4  fps
QHD 2560x1440
100%
RTX A2000:
28.9  fps
4K 3840x2160
100%
RTX A2000:
13.8  fps
low 1280x720
100%
RTX A2000:
181  fps
med. 1920x1080
100%
RTX A2000:
106  fps
high 1920x1080
100%
RTX A2000:
97  fps
ultra 1920x1080
100%
RTX A2000:
87  fps
QHD 2560x1440
100%
RTX A2000:
62  fps
4K 3840x2160
100%
RTX A2000:
33  fps
low 1280x720
100%
RTX A2000:
169.6  fps
med. 1920x1080
100%
RTX A2000:
79  fps
high 1920x1080
100%
RTX A2000:
56.9  fps
ultra 1920x1080
100%
RTX A2000:
44.8  fps
QHD 2560x1440
100%
RTX A2000:
34  fps
4K 3840x2160
100%
RTX A2000:
20.2  fps
low 1280x720
100%
RTX A2000:
229  fps
med. 1920x1080
100%
RTX A2000:
96.8  fps
high 1920x1080
100%
RTX A2000:
86.5  fps
ultra 1920x1080
100%
RTX A2000:
77.4  fps
QHD 2560x1440
100%
RTX A2000:
51.5  fps
4K 3840x2160
100%
RTX A2000:
26.7  fps
Strange Brigade

Strange Brigade

2018
low 1280x720
100%
RTX A2000:
407  fps
80%
RTX 500 Ada Generation Laptop:
316 333 ~ 325 fps
med. 1920x1080
100%
RTX A2000:
166.4  fps
77%
RTX 500 Ada Generation Laptop:
126 129.6 ~ 128 fps
high 1920x1080
100%
RTX A2000:
130.1  fps
81%
RTX 500 Ada Generation Laptop:
104 106.7 ~ 105 fps
ultra 1920x1080
100%
RTX A2000:
109.3  fps
84%
RTX 500 Ada Generation Laptop:
91 93.2 ~ 92 fps
QHD 2560x1440
100%
RTX A2000:
79  fps
80%
RTX 500 Ada Generation Laptop:
63  fps
4K 3840x2160
100%
RTX A2000:
45.2  fps
Far Cry 5

Far Cry 5

2018
low 1280x720
100%
RTX A2000:
203  fps
67%
RTX 500 Ada Generation Laptop:
135  fps
med. 1920x1080
100%
RTX A2000:
108  fps
80%
RTX 500 Ada Generation Laptop:
86  fps
high 1920x1080
100%
RTX A2000:
98  fps
80%
RTX 500 Ada Generation Laptop:
78  fps
ultra 1920x1080
100%
RTX A2000:
91  fps
81%
RTX 500 Ada Generation Laptop:
74  fps
QHD 2560x1440
100%
RTX A2000:
61  fps
82%
RTX 500 Ada Generation Laptop:
50  fps
4K 3840x2160
100%
RTX A2000:
30  fps
low 1280x720
100%
RTX A2000:
203  fps
56%
RTX 500 Ada Generation Laptop:
98 128.3 ~ 113 fps
med. 1920x1080
100%
RTX A2000:
176.4  fps
52%
RTX 500 Ada Generation Laptop:
79.4 103.5 ~ 91 fps
high 1920x1080
100%
RTX A2000:
136.4  fps
54%
RTX 500 Ada Generation Laptop:
67 81.5 ~ 74 fps
4K 3840x2160
100%
RTX A2000:
99.8  fps
low 1280x720
100%
RTX A2000:
163.1  fps
86%
RTX 500 Ada Generation Laptop:
130.5 148.5 ~ 140 fps
med. 1920x1080
100%
RTX A2000:
82.3  fps
90%
RTX 500 Ada Generation Laptop:
71 77.8 ~ 74 fps
high 1920x1080
100%
RTX A2000:
61.3  fps
88%
RTX 500 Ada Generation Laptop:
50 57.1 ~ 54 fps
QHD 2560x1440
100%
RTX A2000:
43.9  fps
82%
RTX 500 Ada Generation Laptop:
36.1  fps
4K 3840x2160
100%
RTX A2000:
24.7  fps
low 1280x720
100%
RTX A2000:
265.4  fps
67%
RTX 500 Ada Generation Laptop:
176.2 178 ~ 177 fps
med. 1366x768
100%
RTX A2000:
234.2  fps
68%
RTX 500 Ada Generation Laptop:
156.1 163.3 ~ 160 fps
high 1920x1080
100%
RTX A2000:
212  fps
69%
RTX 500 Ada Generation Laptop:
145.6 148.1 ~ 147 fps
ultra 1920x1080
100%
RTX A2000:
190.2  fps
72%
RTX 500 Ada Generation Laptop:
136 137.4 ~ 137 fps
4K 3840x2160
100%
RTX A2000:
86.6  fps
low 1024x768
100%
RTX A2000:
345  fps
81%
RTX 500 Ada Generation Laptop:
278  fps
med. 1366x768
100%
RTX A2000:
217  fps
81%
RTX 500 Ada Generation Laptop:
175  fps
high 1920x1080
100%
RTX A2000:
117  fps
78%
RTX 500 Ada Generation Laptop:
91  fps
ultra 1920x1080
100%
RTX A2000:
63.9  fps
80%
RTX 500 Ada Generation Laptop:
51  fps
QHD 2560x1440
100%
RTX A2000:
47.2  fps
76%
RTX 500 Ada Generation Laptop:
36  fps
4K 3840x2160
100%
RTX A2000:
40.1  fps
GTA V

GTA V

2015
low 1024x768
100%
RTX A2000:
187.7  fps
97%
RTX 500 Ada Generation Laptop:
182.7 183.8 ~ 183 fps
med. 1366x768
100%
RTX A2000:
187.5  fps
95%
RTX 500 Ada Generation Laptop:
177.4 178.9 ~ 178 fps
high 1920x1080
100%
RTX A2000:
174.1  fps
80%
RTX 500 Ada Generation Laptop:
138.2 139.1 ~ 139 fps
ultra 1920x1080
100%
RTX A2000:
82.9  fps
81%
RTX 500 Ada Generation Laptop:
64.6 69.7 ~ 67 fps
QHD 2560x1440
100%
RTX A2000:
57.8  fps
78%
RTX 500 Ada Generation Laptop:
45.1  fps
4K 3840x2160
100%
RTX A2000:
55.6  fps

Average Gaming Nvidia RTX A2000 → 100%

Average Gaming 30-70 fps → 100%

Average Gaming NVIDIA RTX 500 Ada Generation Laptop → 78%

Average Gaming 30-70 fps → 84%

Nvidia RTX A2000NVIDIA RTX 500 Ada Generation Laptop
lowmed.highultraQHD4Klowmed.highultraQHD4K
F1 2513096.9747.44
F1 24173.3144.7104.632.520.29.7112.980.826.51622
Ghost of Tsushima56.447.140.230.922
Avatar Frontiers of Pandora4439342516742383220
Call of Duty Modern Warfare 3 20238878584933
Total War Pharaoh244.4155.387.36946.223.3199129735639
Assassin's Creed Mirage7869554032
Cyberpunk 207783.961.951.844.725.5116347363219.8
Baldur's Gate 374.958.850.849.934.418.27558474626.8
F1 23185.1165.1111.232.2209.4136.5119.884.12516
F1 22197.4181.5125.337.52310.9150.4134.499.632.9
Far Cry 6180.497.683.268.348.825.71268068
Strange Brigade407166.4130.1109.37945.23251281059263
Far Cry 52031089891613013586787450
X-Plane 11.11203176.4136.499.81139174
Final Fantasy XV Benchmark163.182.361.343.924.7140745436.1
Dota 2 Reborn265.4234.2212190.286.6177160147137
The Witcher 334521711763.947.240.1278175915136
GTA V187.7187.5174.182.957.855.61831781396745.1
Nvidia RTX A2000NVIDIA RTX 500 Ada Generation Laptop
lowmed.highultraQHD4Klowmed.highultraQHD4K
< 30 fps
< 60 fps
< 120 fps
≥ 120 fps

1
2
12

2
4
9

3
7
5
1
5
6
1
5
6
2
9
4
2
< 30 fps
< 60 fps
< 120 fps
≥ 120 fps

2
6
11

4
9
6
1
7
9
2
4
8
3
1
5
7
1


For more games that might be playable and a list of all games and graphics cards visit our Gaming List

Add one or more devices and compare

In the following list you can select (and also search for) devices that should be added to the comparison. You can select more than one device.

restrict list:
v1.35
log 30. 00:24:13

#0 ran 0s before starting gpusingle class +0s ... 0s

#1 checking url part for id 12778 +0s ... 0s

#2 checking url part for id 12426 +0s ... 0s

#3 redirected to Ajax server, took 1767050653s time from redirect:0 +0s ... 0s

#4 did not recreate cache, as it is less than 5 days old! Created at Mon, 29 Dec 2025 10:37:44 +0100 +0s ... 0s

#5 composed specs +0.024s ... 0.024s

#6 did output specs +0s ... 0.024s

#7 start showIntegratedCPUs +0s ... 0.024s

#8 getting avg benchmarks for device 12778 +0.021s ... 0.045s

#9 got single benchmarks 12778 +0.005s ... 0.05s

#10 getting avg benchmarks for device 12426 +0s ... 0.051s

#11 got single benchmarks 12426 +0.006s ... 0.057s

#12 got avg benchmarks for devices +0s ... 0.057s

#13 min, max, avg, median took s +0.052s ... 0.108s

#14 before gaming benchmark output +0s ... 0.108s

#15 Got 338 rows for game benchmarks. +0.014s ... 0.123s

#16 composed SQL query for gamebenchmarks +0s ... 0.123s

#17 got data and put it in $dataArray +0.003s ... 0.126s

#18 benchmarks composed for output. +0.014s ... 0.14s

#19 calculated avg scores. +0s ... 0.14s

#20 return log +0.003s ... 0.143s

Please share our article, every link counts!
Mail Logo
Google Logo Add as a preferred
source on Google
> Expert Reviews and News on Laptops, Smartphones and Tech Innovations > Benchmarks / Tech > Graphics Card Comparison - Head 2 Head
Redaktion, 2017-09- 8 (Update: 2023-07- 1)