Notebookcheck Logo

Micron 2400 MTFDKBA512QFM vs Samsung SSD 970 EVO Plus 500GB

Micron 2400 MTFDKBA512QFM

► remove from comparison  MTFDKBA512QFM

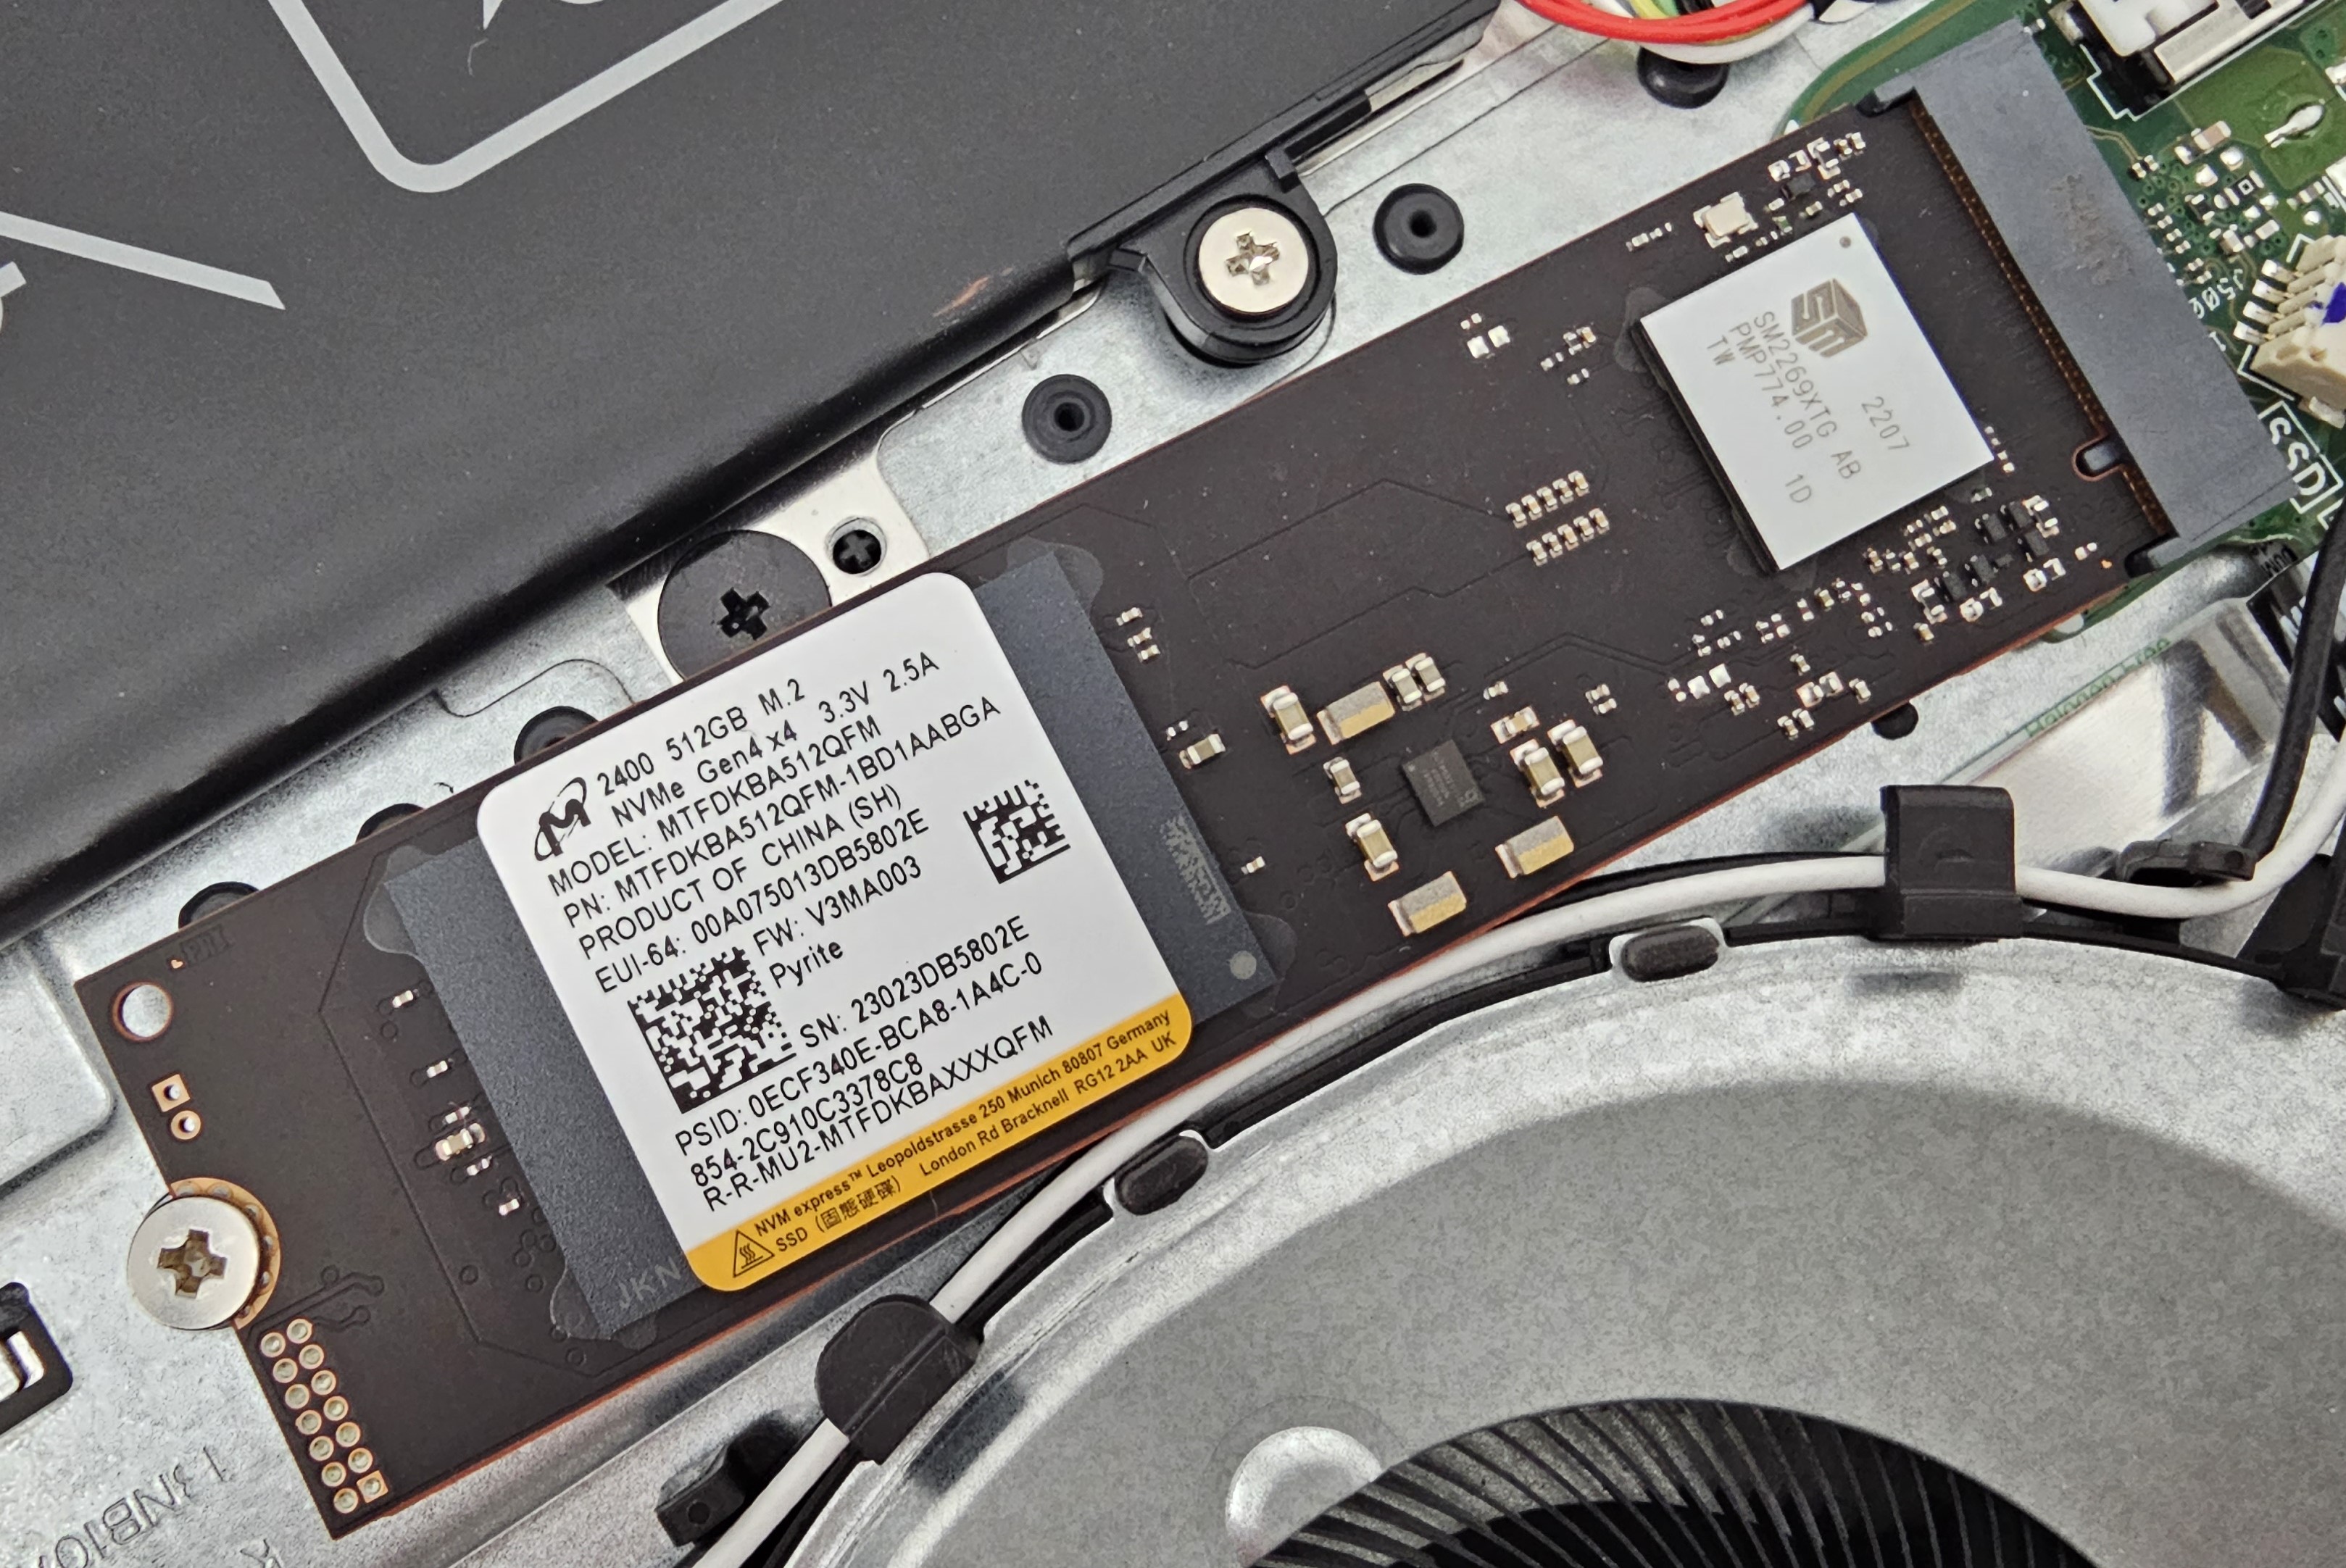
The Micron 2400 MTFDKBA512QFM 512GB is a fast PCIe 4.0 x4 NVMe SSD in the M.2 2280 form factor. It uses 176-layer QLC NAND with 4 bits per memory cell. The SSD is specified at up to 4,200 MB/s read and 1,800 MB/s write (max) and a TBW of 150 TB / MTTF of 2 mio hours. The power consumption is specified at <2.5 mW in sleep and <200 mW in idle. The SSD supports hardware AES 256-bit encryption, RAIN, SMART, TCG Opal 2.01, TCG Pyrite 2.01 (security features only in the A model).

Samsung SSD 970 EVO Plus 500GB

► remove from comparison  970 EVO Plus 500GB

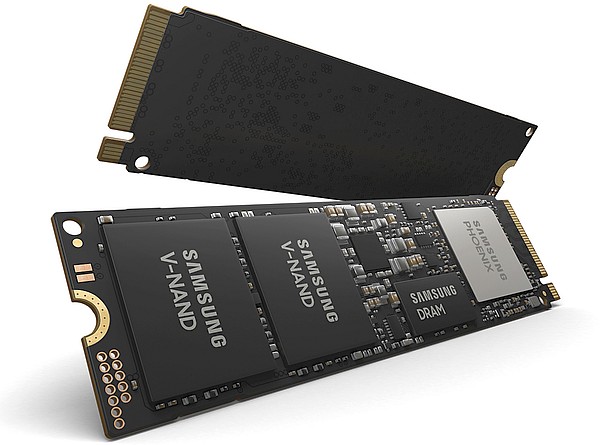
The Samsung SSD 970 EVO Plus 500GB is a high-end M.2 SSD in the 2280 form factor. It uses the Samsung Phoenix controller (S4LR020) and is specified at up to 3500 MB/s read and 3200 MB/s write speeds. The memory modules are by Samsung and specified as 96 layer 3D-NAND TLC chips (V-NAND v5). The MTBF is spedified at 1.5 Mio hours and the TBW at 300 TB. The warranty is 5 years or the reach of the TBW.

Micron 2400 MTFDKBA512QFMSamsung SSD 970 EVO Plus 500GB
TypeSSDSSD
SizeM.2 2280M.2 2280
Capacity512 GB500 GB
InterfaceNVMeNVMe
Announced14.02.2023 22.01.2019
LinkMicron 2400 MTFDKBA512QFM

Benchmarks

Performance Rating - DiskSpd - MTFDKBA512QFM
18.5 pt (21%)
Seagate ST1000LM014 Solid State Hybrid Drive
0.717 -96%
...
Intel SSDPEMKF512G8 NVMe SSD
18 -3%
18 -3%
18.1 -2%
Netac G938E
18.1 -2%
Samsung BM9C1 1024GB
18.1 -2%
ADATA XPG Gammix S11L 1024GB
18.2 -2%
Crucial P1 SSD CT1000P1SSD8
18.2 -2%
Toshiba BG4 KBG40ZPZ512G
18.2 -2%
18.3 -1%
Micron 2400 MTFDKBA512QFM
18.5
HP PSEJN512GA87EC0
18.6 1%
18.7 1%
18.7 1%
18.8 2%
18.8 2%
18.8 2%
18.8 2%
Intel SSD 660p 1TB SSDPEKNW010T8
18.9 2%
19 3%
...
Kingston Fury Renegade G5 4TB
87.8 375%
0%
100%
Restrict / Search: Model: Max. age: years
Performance Rating - DiskSpd - 970 EVO Plus 500GB
31.2 pt (36%)
Seagate ST1000LM014 Solid State Hybrid Drive
0.717 -98%
...
30.1 -4%
30.2 -3%
Micron 2500 MTFDKBA512QGN
30.3 -3%
30.4 -3%
30.4 -3%
Acer N5000
30.5 -2%
30.9 -1%
30.9 -1%
31.1 0%
Samsung SSD 970 EVO Plus 500GB
31.2
31.2 0%
Phison Electronics PS5012
31.3 0%
31.5 1%
Silicon Motion PCIe-8 SSD 1TB
31.7 2%
31.7 2%
31.7 2%
31.8 2%
31.8 2%
31.8 2%
...
Kingston Fury Renegade G5 4TB
87.8 181%
0%
100%
Restrict / Search: Model: Max. age: years
AS SSD - Copy Game
min: 513.4     avg: 1006     median: 1165.4 (19%)     max: 1232.57 MB/s
min: 787     avg: 1121     median: 1157.5 (19%)     max: 1434 MB/s
AS SSD - Copy Program
min: 325.46     avg: 526     median: 543.2 (20%)     max: 811.69 MB/s
min: 242.9     avg: 441.9     median: 453.4 (17%)     max: 570 MB/s
AS SSD - Copy ISO
min: 543.03     avg: 1188     median: 1321.2 (5%)     max: 1479.66 MB/s
min: 1394     avg: 1989     median: 2018.5 (8%)     max: 2728 MB/s
AS SSD - Score Total
min: 2845     avg: 3533     median: 3457 (21%)     max: 4261 Points
min: 3254     avg: 5023     median: 5172 (32%)     max: 5893 Points
AS SSD - Score Write
min: 1257     avg: 1473     median: 1438.5 (20%)     max: 1735 Points
min: 1364     avg: 2507     median: 2662.5 (37%)     max: 2859 Points
AS SSD - Score Read
min: 1031     avg: 1426     median: 1350.5 (22%)     max: 1875 Points
min: 1243     avg: 1664     median: 1621.5 (26%)     max: 2359 Points
AS SSD - Access Time Write *
min: 0.103     avg: 0.2     median: 0.1 (0%)     max: 0.414 ms
min: 0.02     avg: 0     median: 0 (0%)     max: 0.037 ms
AS SSD - Access Time Read *
min: 0.039     avg: 0.1     median: 0.1 (0%)     max: 0.15 ms
min: 0.033     avg: 0     median: 0 (0%)     max: 0.092 ms
AS SSD - 4K-64 Write
min: 990.57     avg: 1193     median: 1144.1 (19%)     max: 1468 MB/s
min: 922     avg: 2116     median: 2289 (39%)     max: 2447 MB/s
AS SSD - 4K-64 Read
min: 720.72     avg: 1052     median: 983.5 (19%)     max: 1453.25 MB/s
min: 906     avg: 1345     median: 1281.5 (25%)     max: 2050 MB/s
AS SSD - 4K Write
min: 99.77     avg: 154.6     median: 134.2 (26%)     max: 222.05 MB/s
min: 99.1     avg: 141.2     median: 144.2 (28%)     max: 190.5 MB/s
AS SSD - 4K Read
min: 30.01     avg: 40.8     median: 41.2 (13%)     max: 58.97 MB/s
min: 29.99     avg: 54.8     median: 56.1 (18%)     max: 64.3 MB/s
AS SSD - Sequential Write
min: 1155.67     avg: 1567     median: 1363.9 (12%)     max: 2650.58 MB/s
min: 2081     avg: 2500     median: 2521.5 (22%)     max: 2779 MB/s
AS SSD - Sequential Read
min: 2798.13     avg: 3348     median: 3545.7 (28%)     max: 3707.36 MB/s
min: 2172     avg: 2640     median: 2688.5 (21%)     max: 3020 MB/s
CrystalDiskMark 3.0 - 4K QD32 Write
min: 178.1     avg: 342.9     median: 318.6 (30%)     max: 530 MB/s
CrystalDiskMark 3.0 - 4K QD32 Read
min: 248.9     avg: 410.3     median: 390.4 (30%)     max: 611 MB/s
CrystalDiskMark 3.0 - 4K Write
min: 92.1     avg: 117.1     median: 115.8 (4%)     max: 139.6 MB/s
CrystalDiskMark 3.0 - 4K Read
min: 53.3     avg: 59.5     median: 58.5 (1%)     max: 65 MB/s
CrystalDiskMark 3.0 - 512K Write
min: 762     avg: 1991     median: 2214.5 (24%)     max: 2677 MB/s
CrystalDiskMark 3.0 - 512K Read
min: 665     avg: 1700     median: 1830 (39%)     max: 2236 MB/s
CrystalDiskMark 3.0 - Sequential Write
min: 1429     avg: 1792     median: 1679.5 (16%)     max: 2506 MB/s
CrystalDiskMark 3.0 - Sequential Read
min: 1189     avg: 1790     median: 1718 (20%)     max: 2591 MB/s
CrystalDiskMark 5.2 / 6 - CDM 5/6 Write 4K
min: 107.3     avg: 141.9     median: 123.9 (11%)     max: 251.1 MB/s
min: 99.3     avg: 159.2     median: 164.5 (15%)     max: 233 MB/s
CrystalDiskMark 5.2 / 6 - CDM 5/6 Read 4K
min: 27.2     avg: 39.8     median: 37.9 (1%)     max: 53.3 MB/s
min: 38.47     avg: 48.5     median: 49.3 (1%)     max: 54.8 MB/s
CrystalDiskMark 5.2 / 6 - CDM 5 Write Seq
min: 1428     avg: 1564     median: 1608 (9%)     max: 1674 MB/s
min: 1087     avg: 2114     median: 1790 (10%)     max: 3051 MB/s
CrystalDiskMark 5.2 / 6 - CDM 5 Read Seq
min: 1642     avg: 2083     median: 2071 (22%)     max: 2373 MB/s
min: 974     avg: 2044     median: 1758 (19%)     max: 3042 MB/s
CrystalDiskMark 5.2 / 6 - CDM 5/6 Write 4K Q32T1
min: 269.6     avg: 414.3     median: 420.9 (9%)     max: 516.9 MB/s
min: 310.9     avg: 434.7     median: 404.7 (8%)     max: 557 MB/s
CrystalDiskMark 5.2 / 6 - CDM 5/6 Read 4K Q32T1
min: 363.5     avg: 479.3     median: 448.7 (7%)     max: 719.1 MB/s
min: 351.2     avg: 508     median: 529 (8%)     max: 648 MB/s
CrystalDiskMark 5.2 / 6 - CDM 5/6 Write Seq Q32T1
min: 1511     avg: 1741     median: 1774.5 (12%)     max: 1827 MB/s
min: 2933     avg: 3238     median: 3248 (22%)     max: 3280 MB/s
CrystalDiskMark 5.2 / 6 - CDM 5/6 Read Seq Q32T1
min: 3354     avg: 4016     median: 4288 (23%)     max: 4432 MB/s
min: 3235     avg: 3499     median: 3547 (19%)     max: 3617 MB/s
CrystalDiskMark 5.2 / 6 - CDM 6 Write 4K Q8T8
min: 379     avg: 1067     median: 1067.1 (21%)     max: 1755.2 MB/s
2067 MB/s (41%)
CrystalDiskMark 5.2 / 6 - CDM 6 Read 4K Q8T8
min: 1082     avg: 1150     median: 1150 (17%)     max: 1218 MB/s
1064 MB/s (16%)
PCMark 8 - PCMark 8 Storage v2
5088 Points (99%)
DiskSpd - DiskSpd 4k_q1t1_write
min: 106.4     avg: 144.7     median: 129.5 (30%)     max: 266 MB/s
min: 126     avg: 165.4     median: 171 (39%)     max: 202.5 MB/s
DiskSpd - DiskSpd 4k_q1t1_read
min: 29.9     avg: 32.7     median: 32.6 (9%)     max: 37.1 MB/s
min: 46.4     avg: 51.2     median: 52.2 (15%)     max: 54.7 MB/s
DiskSpd - DiskSpd 4k_q32t16_write
min: 313     avg: 651     median: 449 (7%)     max: 1585 MB/s
min: 1521     avg: 2492     median: 2664 (40%)     max: 2672 MB/s
DiskSpd - DiskSpd 4k_q32t16_read
min: 718     avg: 941     median: 789 (10%)     max: 1705 MB/s
min: 1145     avg: 1149     median: 1148 (14%)     max: 1154 MB/s
DiskSpd - DiskSpd seq_write
min: 1454     avg: 1572     median: 1554 (15%)     max: 1671 MB/s
min: 1733     avg: 2655     median: 2810 (27%)     max: 2993 MB/s
DiskSpd - DiskSpd seq_read
min: 1748     avg: 1949     median: 1934 (20%)     max: 2253 MB/s
min: 1451     avg: 2584     median: 2668 (28%)     max: 2991 MB/s
DiskSpd - DiskSpd seq_q8t1_write
min: 1610     avg: 1702     median: 1699 (12%)     max: 1808 MB/s
min: 3217     avg: 3241     median: 3242 (22%)     max: 3259 MB/s
DiskSpd - DiskSpd seq_q8t1_read
min: 3234     avg: 3904     median: 3886 (24%)     max: 4602 MB/s
min: 2573     avg: 3412     median: 3558 (22%)     max: 3572 MB/s
DiskSpd - DiskSpd Loop seq_q8t1_read
min: 3241     avg: 3812     median: 4012 (25%)     max: 4483 MB/s
min: 3537     avg: 3550     median: 3549 (22%)     max: 3563 MB/s
- Range of benchmark values for this graphics card
red legend - Average benchmark values for this graphics card
* Smaller numbers mean a higher performance

Average Benchmarks

Micron 2400 MTFDKBA512QFM → 100% n=33

Samsung SSD 970 EVO Plus 500GB → 162% n=33

Average of the median scores above. 1 ... This benchmark is not used for the average calculation

Amazon Logo
  • $99.00
    Micron 2400 512GB M.2 2280 PCIe NVMe Gen 4x4 SSD MTFDKBA512QFM - 1BD1AABHA
  • $319.99
    SIX NVME M.2 SSD PCIe 4.0-2TB m.2 2280 ssd, Read UP to 7350MB/s 2TB for Gaming PS5 Memory Storage Expansion with Heatsink, Internal Solid State Hard Drive PCIe gen 4x4 Nvme for Laptop Desktop pc

Add one or more devices and compare

In the following list you can select (and also search for) devices that should be added to the comparison. You can select more than one device.

restrict list:
v1.35
log 22. 13:41:05

#0 ran 0s before starting gpusingle class +0s ... 0s

#1 checking url part for id 3999 +0s ... 0s

#2 checking url part for id 3321 +0s ... 0s

#3 redirected to Ajax server, took 1779450065s time from redirect:0 +0s ... 0s

#4 did not recreate cache, as it is less than 5 days old! Created at Sun, 17 May 2026 22:44:14 +0200 +0s ... 0s

#5 composed specs +0.003s ... 0.003s

#6 did output specs +0s ... 0.003s

#7 getting avg benchmarks for device 3999 +0.005s ... 0.008s

#8 got single benchmarks 3999 +0.007s ... 0.015s

#9 getting avg benchmarks for device 3321 +0.003s ... 0.018s

#10 got single benchmarks 3321 +0.011s ... 0.029s

#11 got avg benchmarks for devices +0s ... 0.029s

#12 min, max, avg, median took s +0.088s ... 0.116s

#13 return log +0.468s ... 0.585s

Google LogoAdd as a preferred source on Google
Mail Logo
> Expert Reviews and News on Laptops, Smartphones and Tech Innovations > Benchmarks / Tech > HDD/SSD Comparison - Head 2 Head
Redaktion, 2017-09- 8 (Update: 2023-07- 1)