




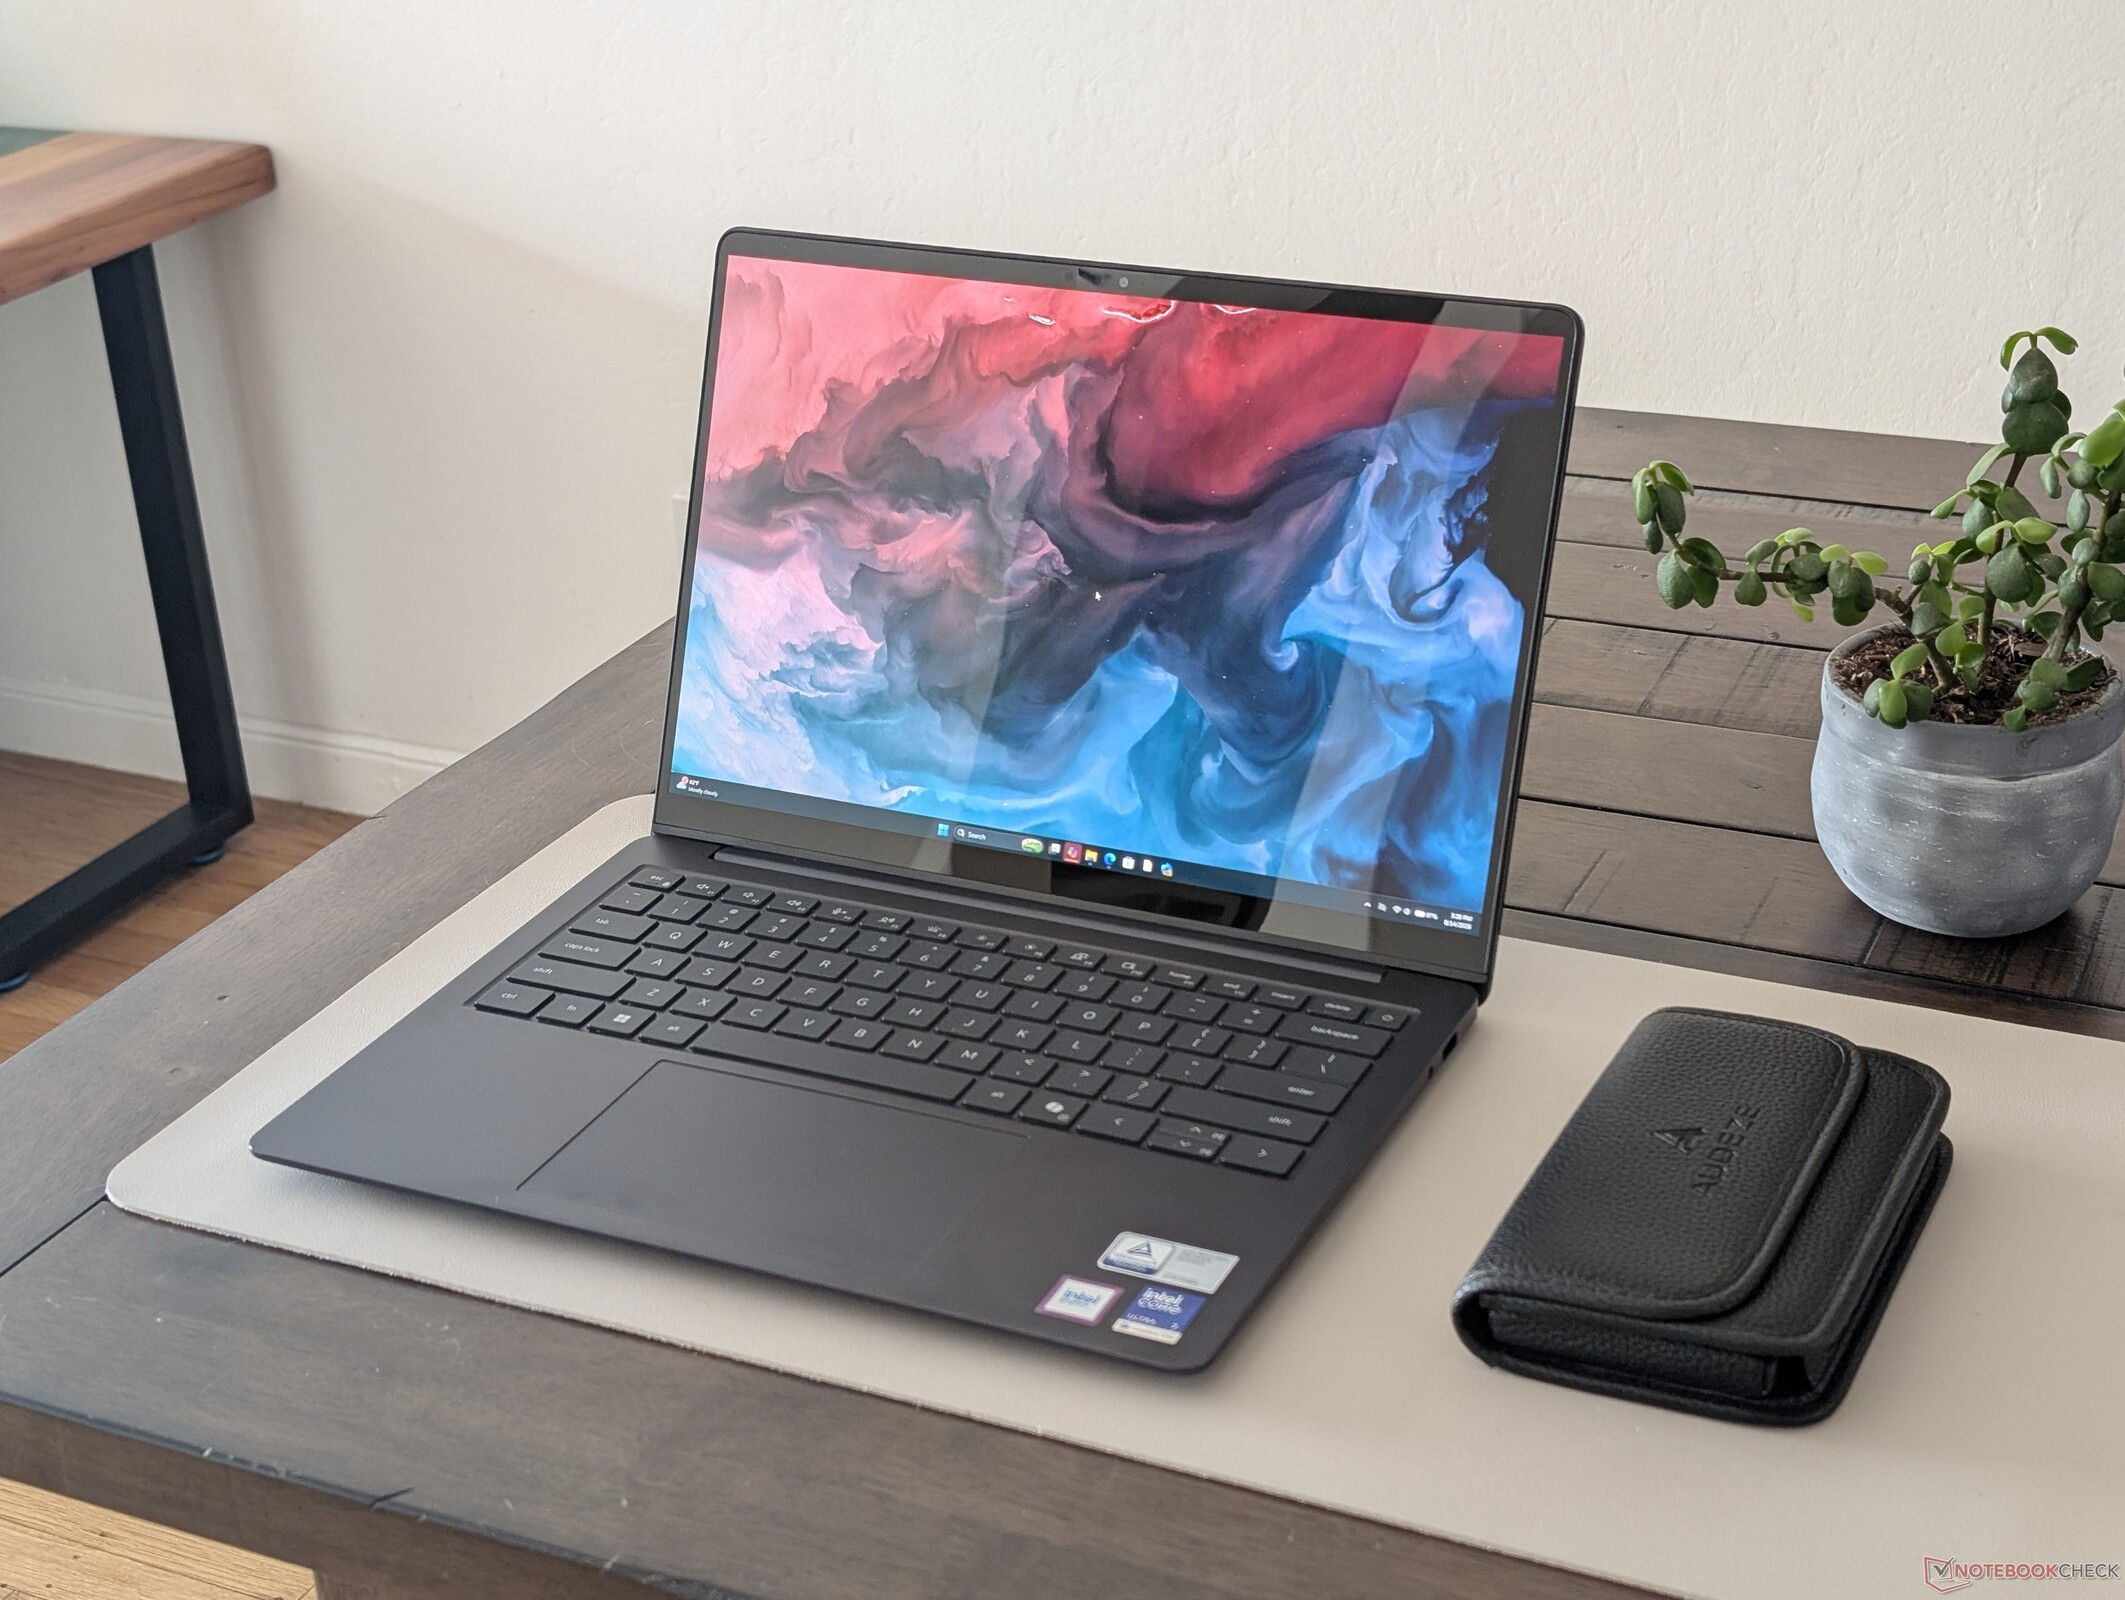
Verdict — Looks And Feels So Much Better Than Before
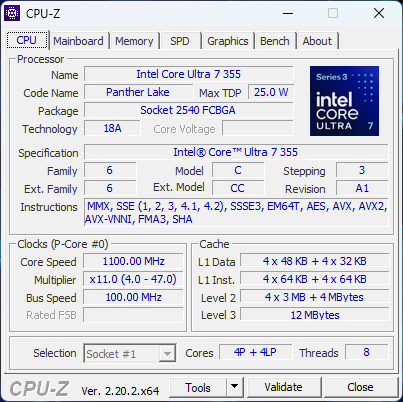
In our review of the Dell 14 Plus, we boasted its efficiency and relative affordability thanks to the Lunar Lake platform while criticizing its old design unchanged from the Inspiron days. For the Dell 14S, the manufacturer has updated the chassis with more metal materials for stronger first impressions and a higher-end feel than previous generation models. The newer design is arguably one of the top selling points of the Dell 14S as raw performance from the Core Ultra 7 355 is otherwise quite similar to the Lunar Lake Core Ultra 7 256V in last year's Dell 14 Plus. Users craving more performance will want to consider the Core Ultra X7 configurations.
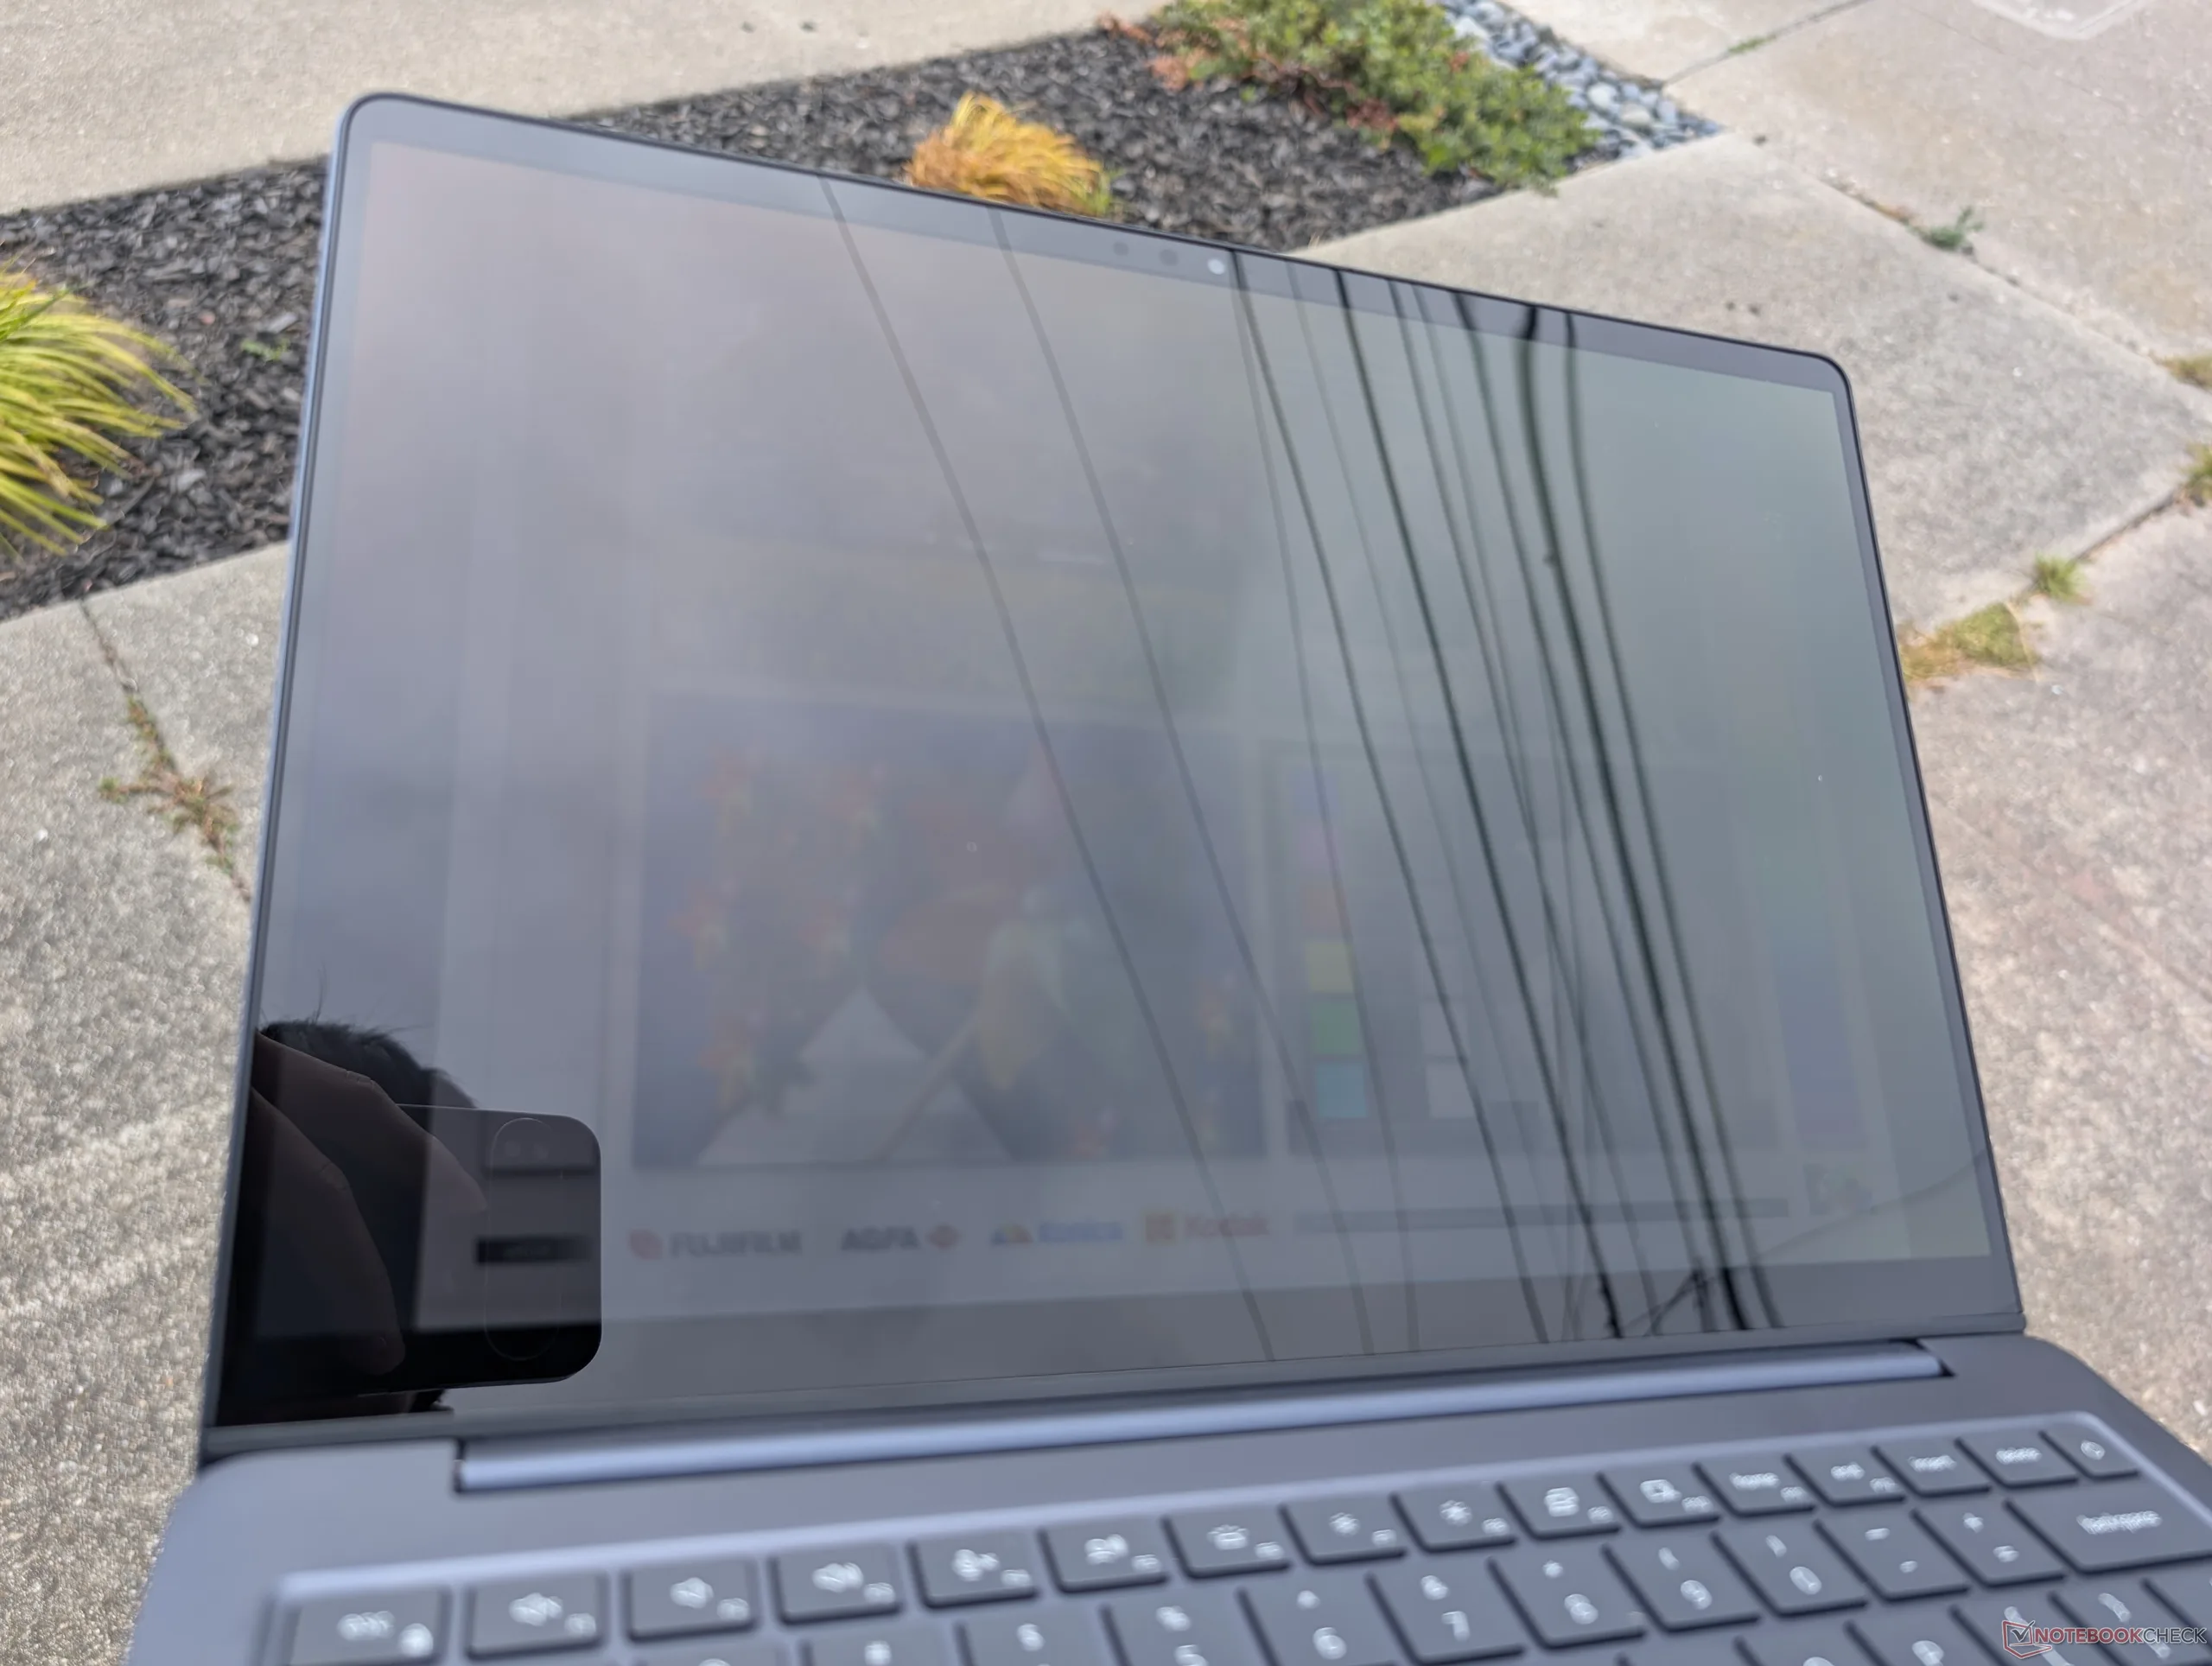
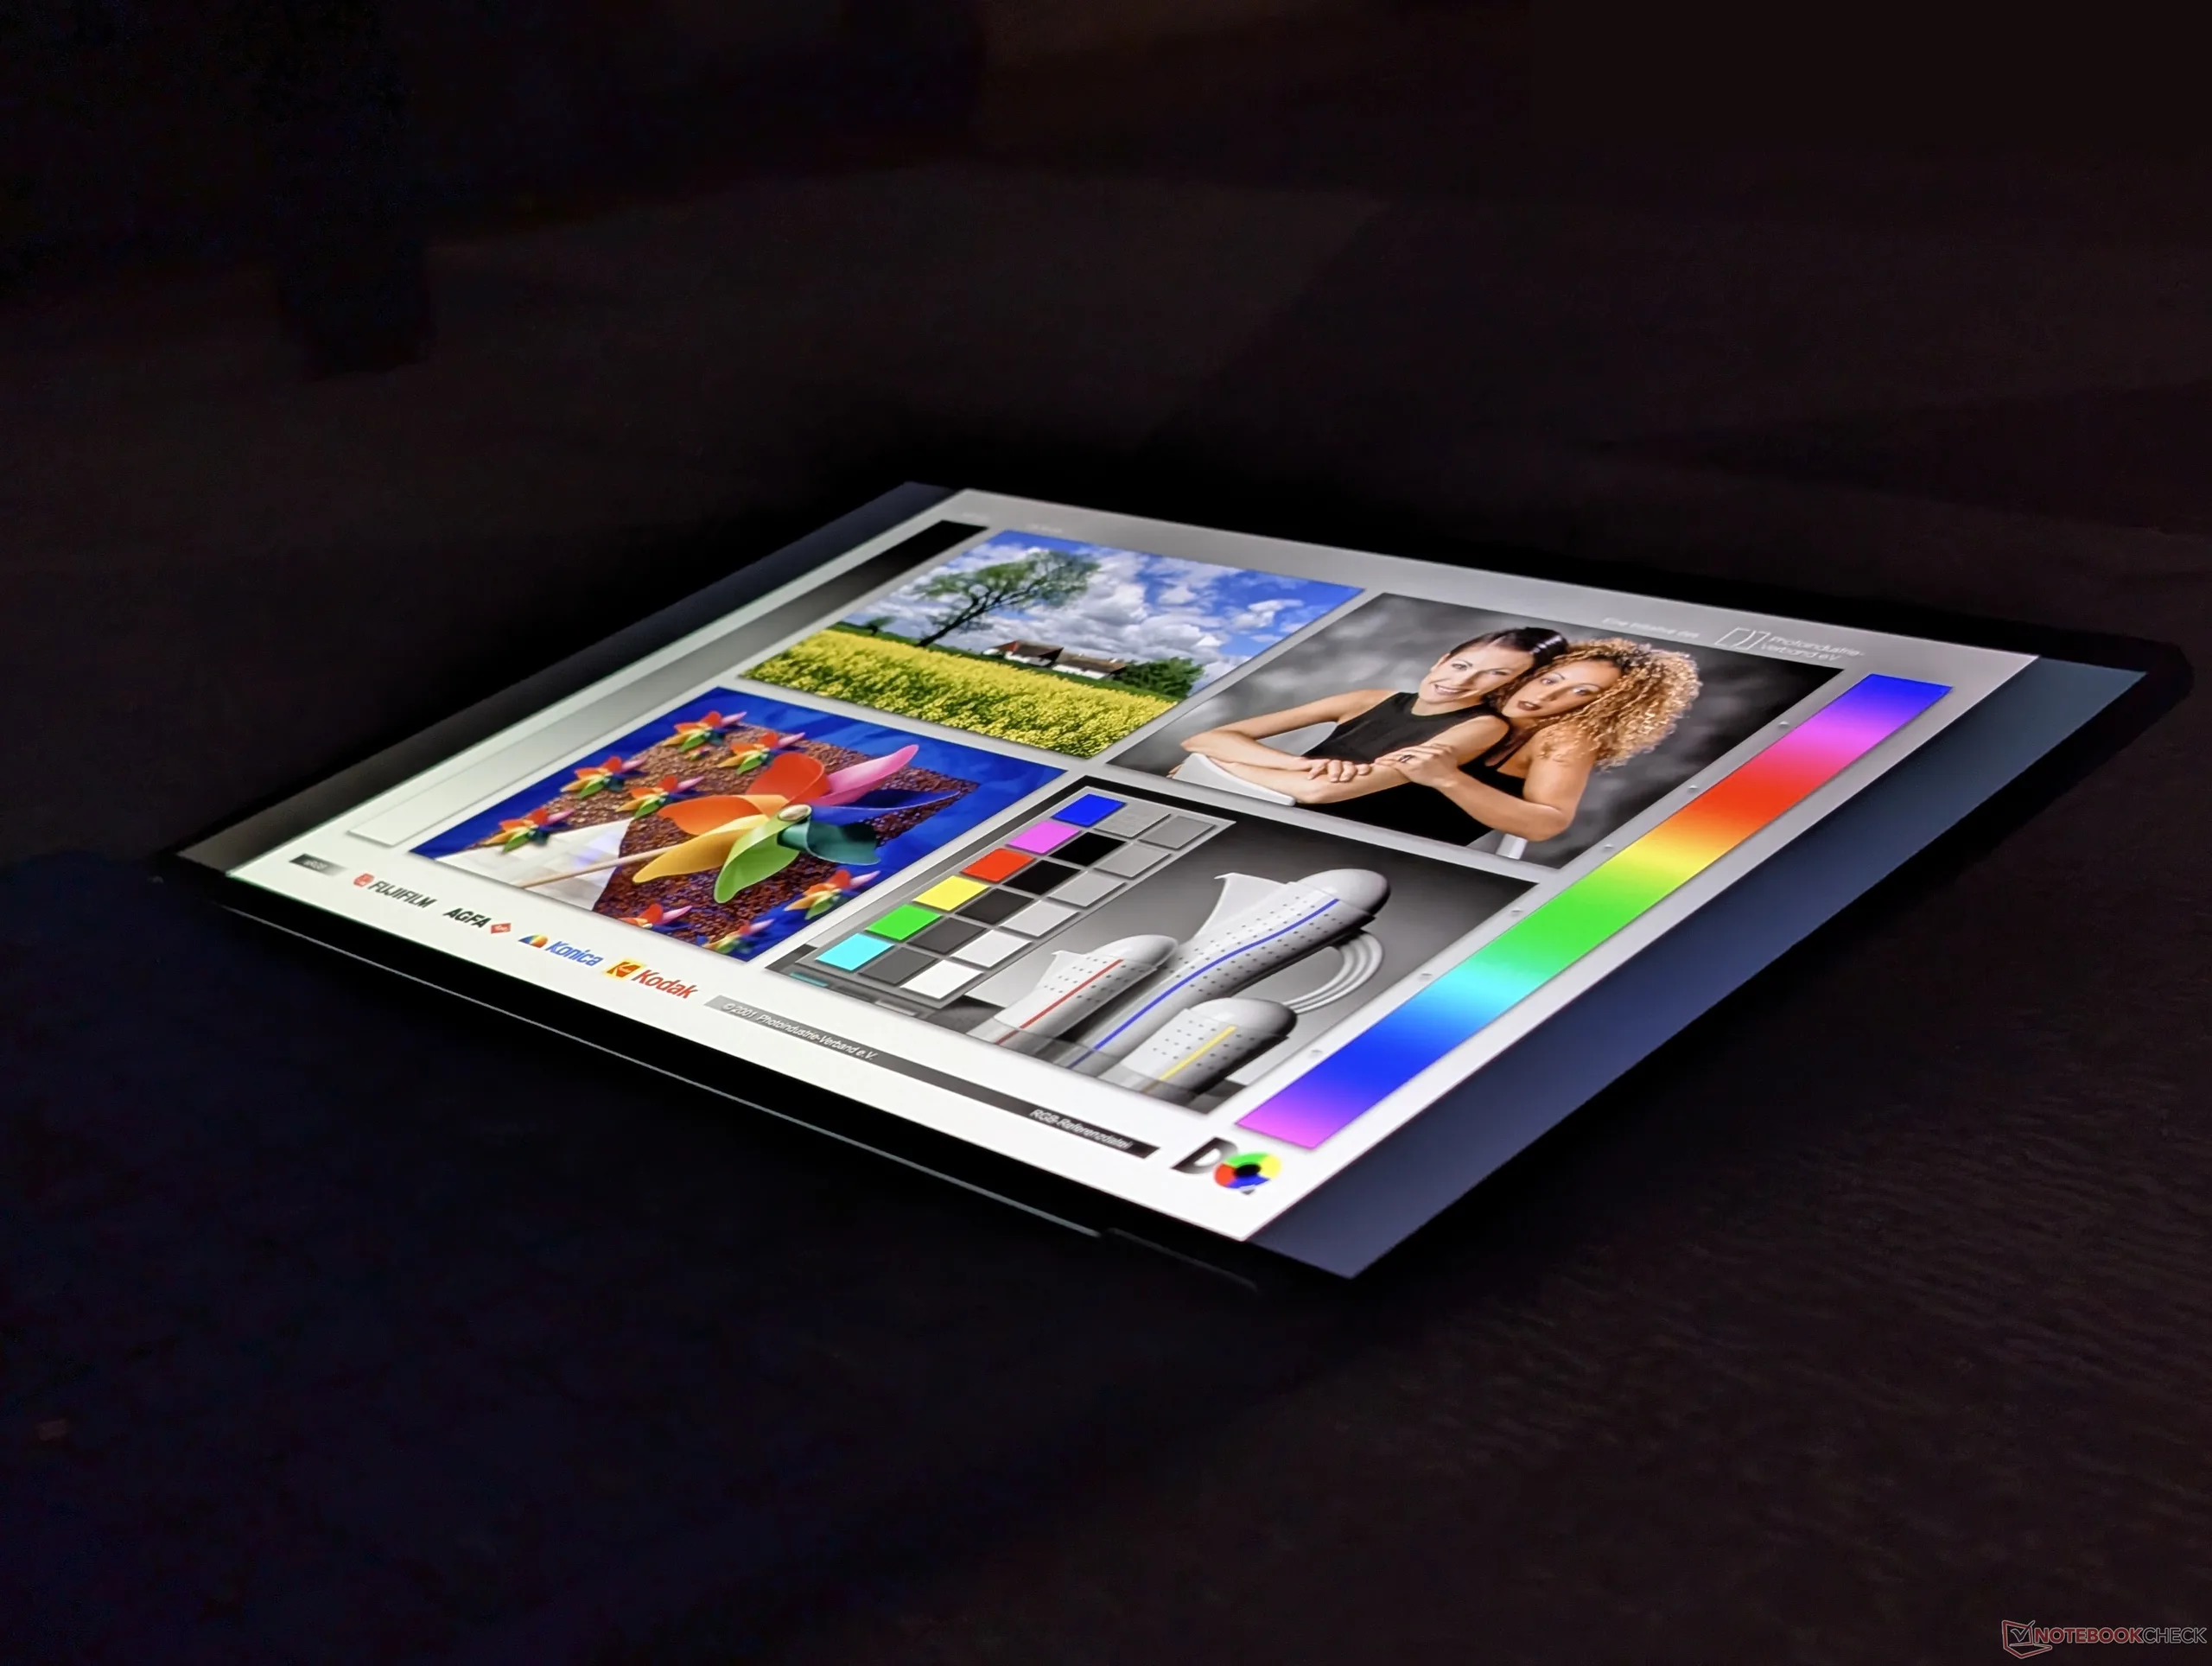
To better distinguish the mainstream Dell 14S from costlier flagship models like the XPS 14, the Dell 14S comes with midrange display panels at best. For example, the OLED option is 60 Hz only and just half as bright as the OLED panel on the XPS 14 or even dimmer when compared to the Asus ExpertBook Ultra 14. While 120 Hz is available, the option is tied to an IPS panel meaning users must sacrifice image quality for the smoother refresh rate. Additionally, the model is one of the heavier 14-inch clamshells as competitors like the Lenovo Yoga Slim 7 Ultra 14IPH11 can be over 500 g lighter. Users who prioritize HDR support and portability may want to look into such alternatives.
Pros
Cons
Price and Availability
Dell is now shipping the 14S starting at $1420 for the Core 7 355 FHD IPS configuration.

The Dell 14S is the manufacturer's latest mid-range laptop and direct successor to last year's Dell 14 Plus. The chassis has been upgraded with stronger metal materials while sporting both a larger fan and battery pack than before.
Our test unit is a middle configuration with the Core Ultra 7 355 Panther Lake CPU and 1200p 60 Hz OLED touchscreen for approximately $1500. Pricier SKUs may ship with higher resolution IPS panels or the much faster Core Ultra X7 358H instead while lower-end options include the Core Ultra 5 322 and 1200p IPS non-touch display.
Alternatives to the Dell 14S include other midrange multimedia subnotebooks laptops like the Asus VivoBook S 14, HP OmniBook 7 series, or the Lenovo IdeaPad Slim series. A 16-inch version of this model is also available called the Dell 16S.
More Dell reviews:
Specifications
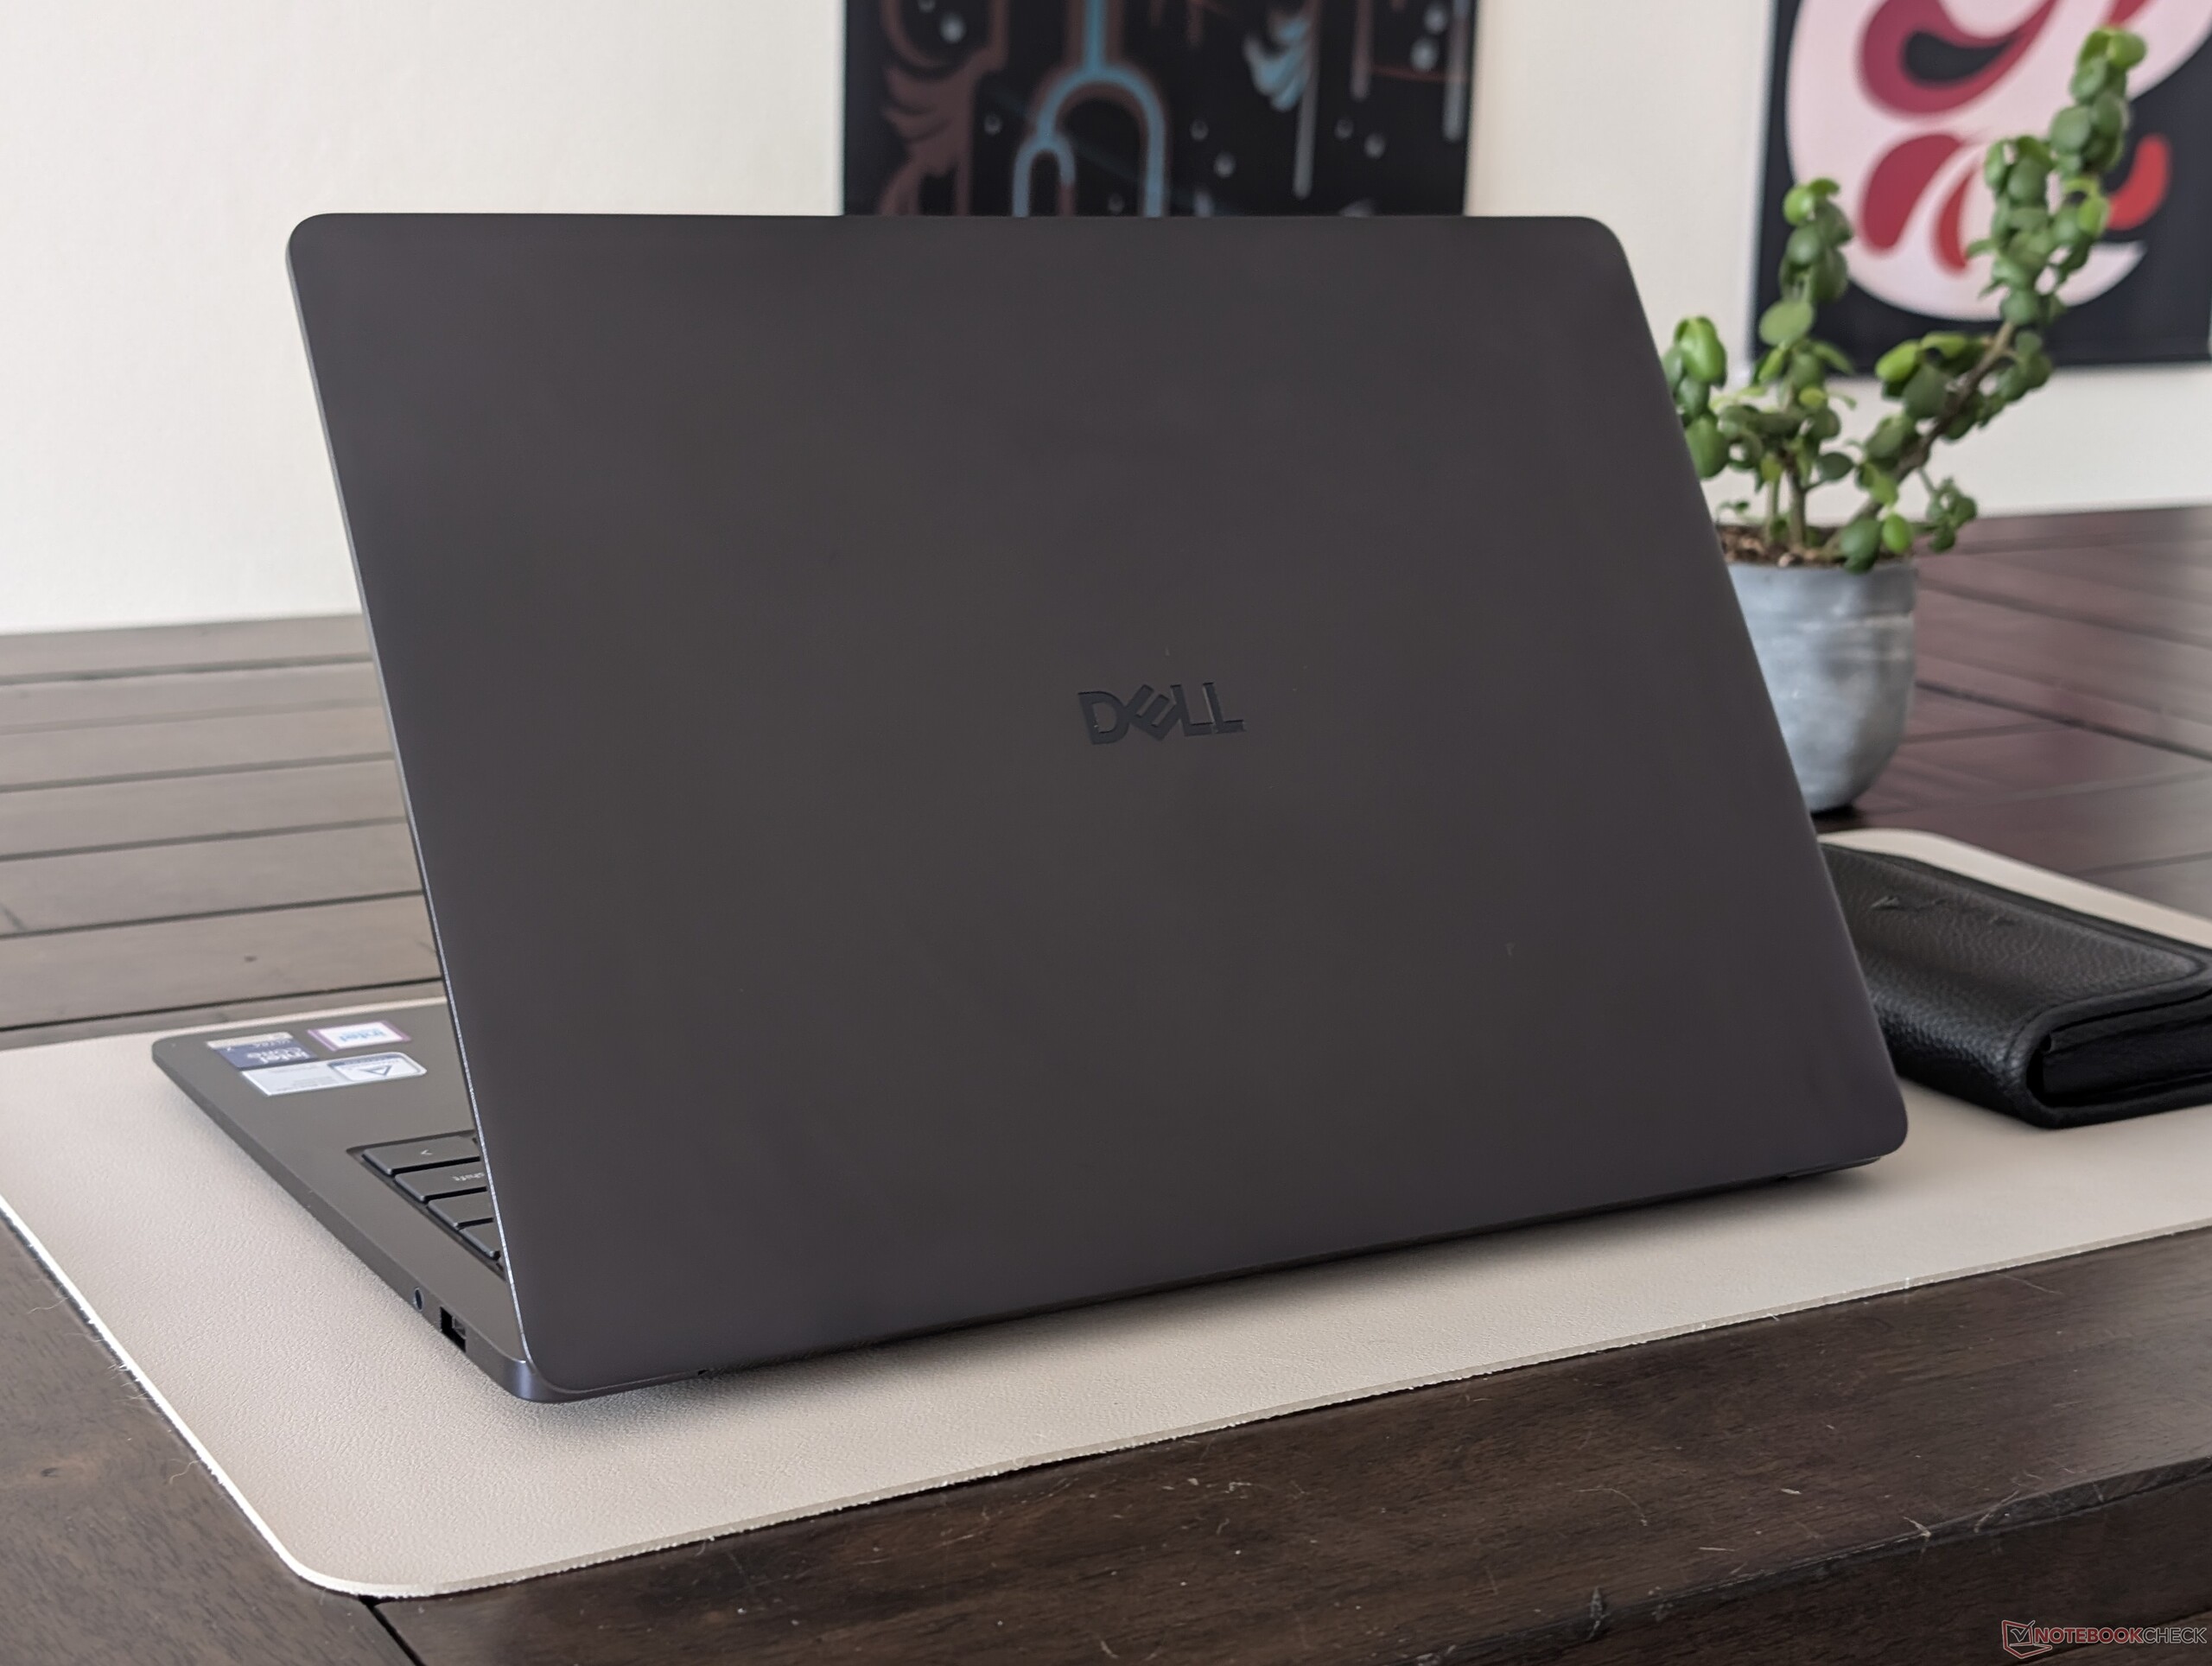
Case
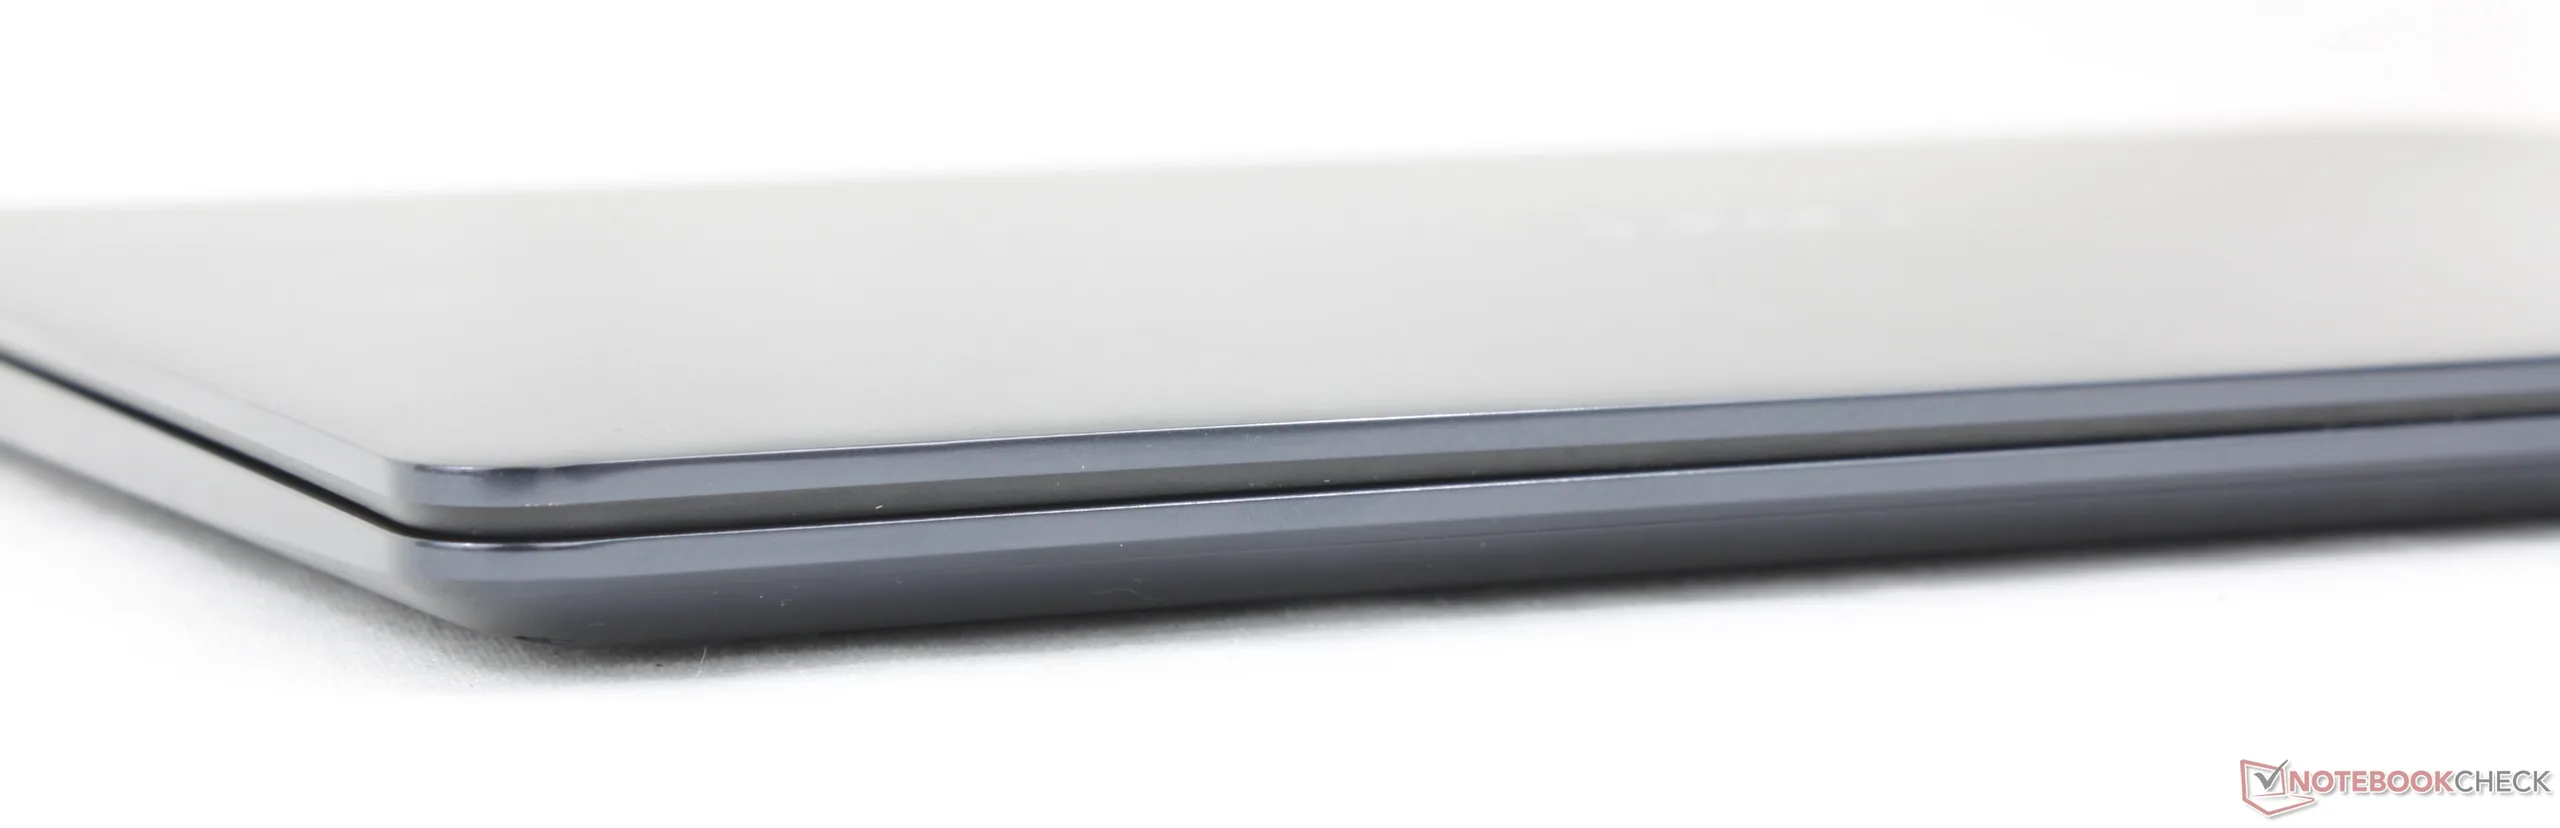
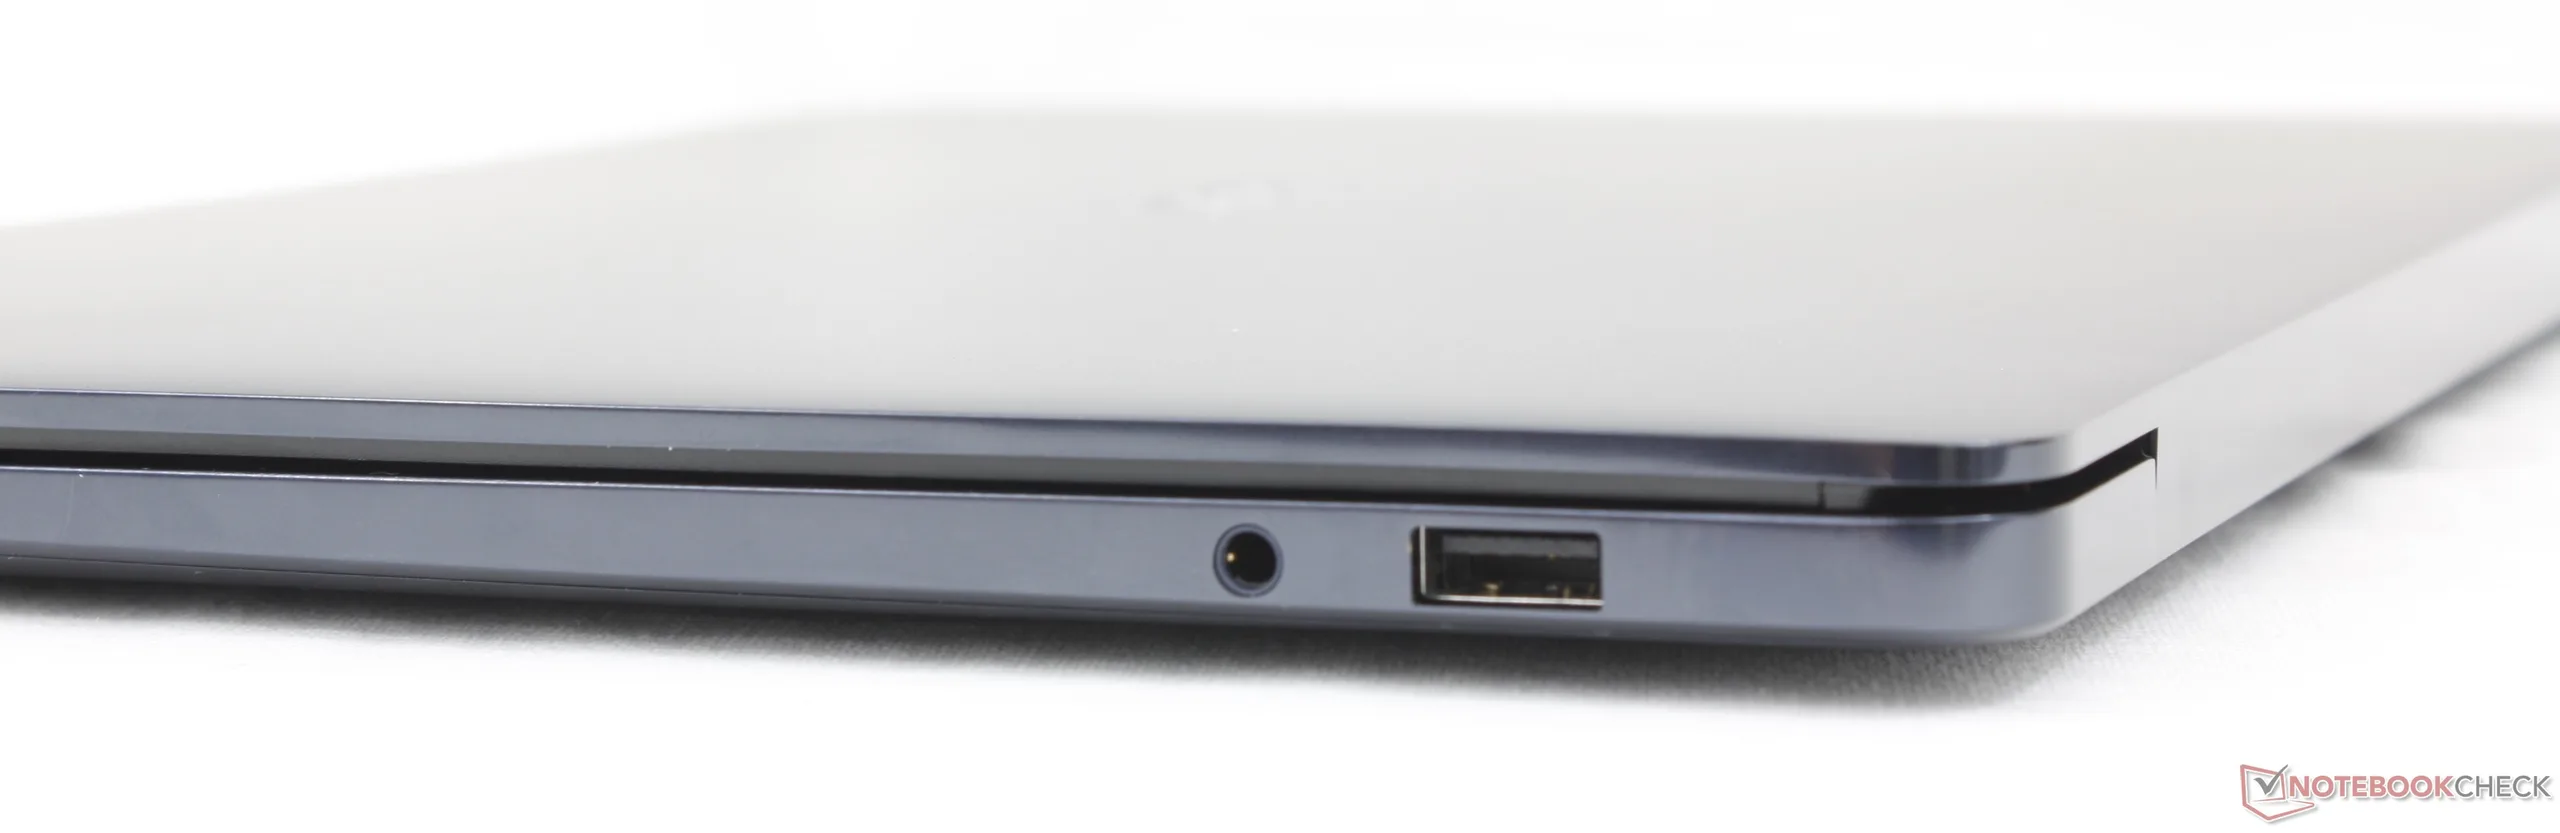
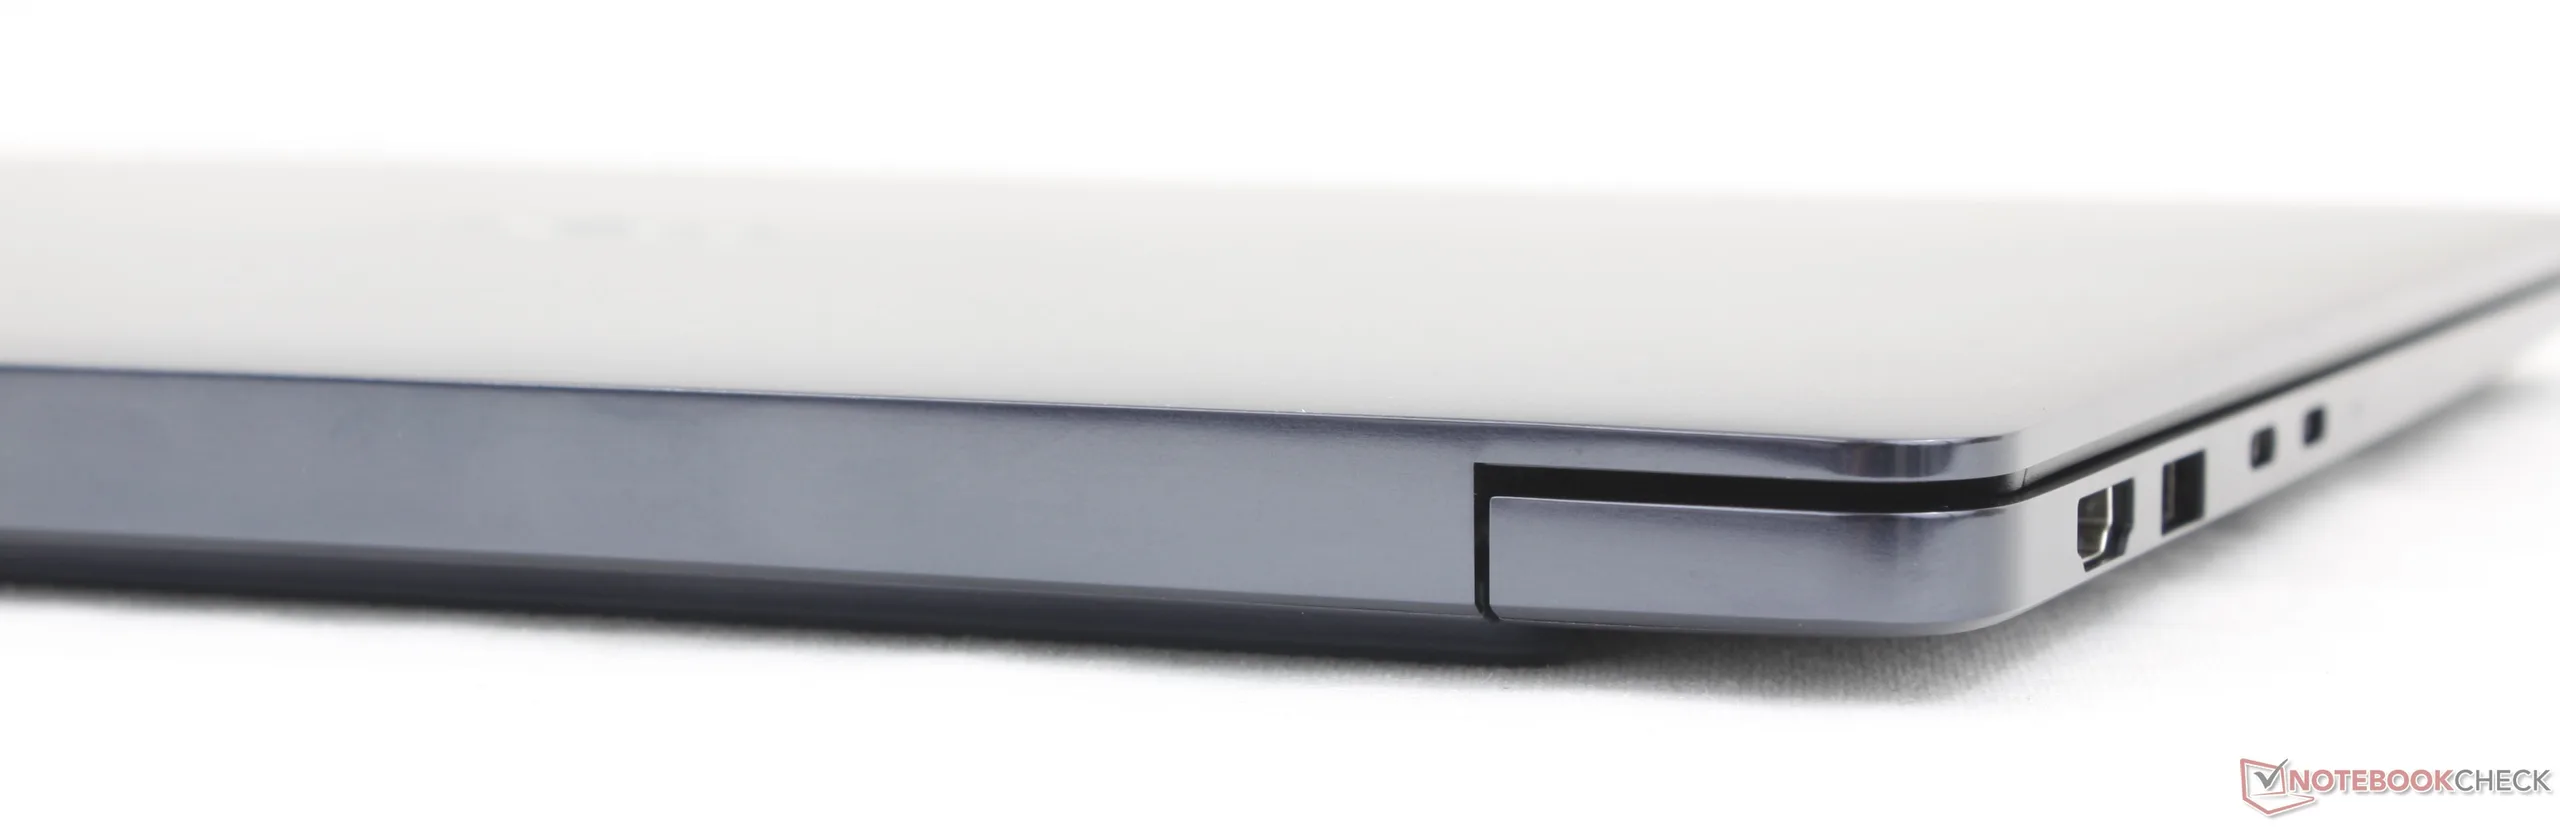
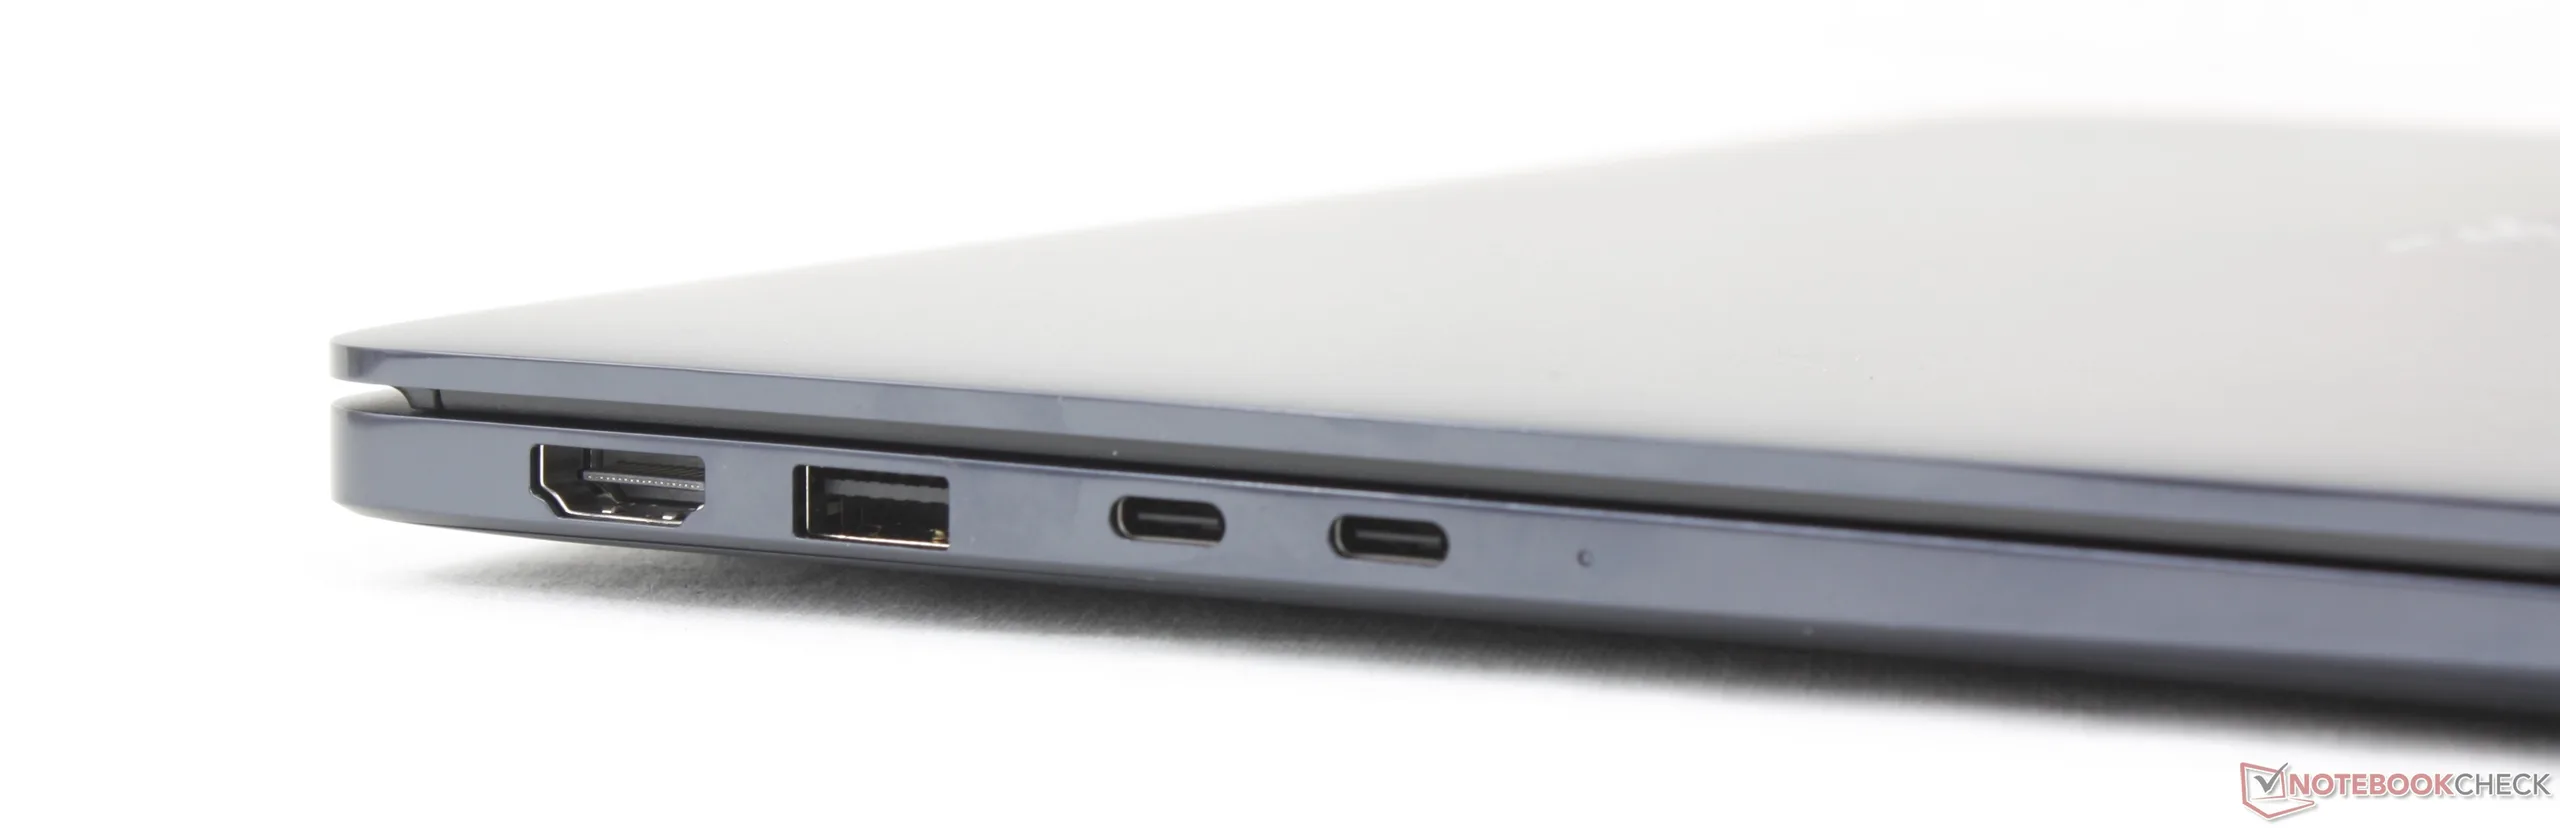
Connectivity
Communication
| Networking | |
| iperf3 transmit Wi-Fi6/7 RT-BE96U | |
| Lenovo ThinkBook 14 G9 IPL 21UX005PGE | |
| iperf3 receive Wi-Fi6/7 RT-BE96U | |
| Lenovo ThinkBook 14 G9 IPL 21UX005PGE | |
| iperf3 receive AXE11000 6GHz | |
| Dell XPS 14 Core Ultra X7 358H | |
| HP OmniBook Ultra 14 Core Ultra X9 | |
| Dell 14S DS14260 | |
| Dell Inspiron 14 7445 2-in-1 | |
| iperf3 transmit AXE11000 6GHz | |
| Dell 14S DS14260 | |
| HP OmniBook Ultra 14 Core Ultra X9 | |
| Dell XPS 14 Core Ultra X7 358H | |
| Dell Inspiron 14 7445 2-in-1 | |
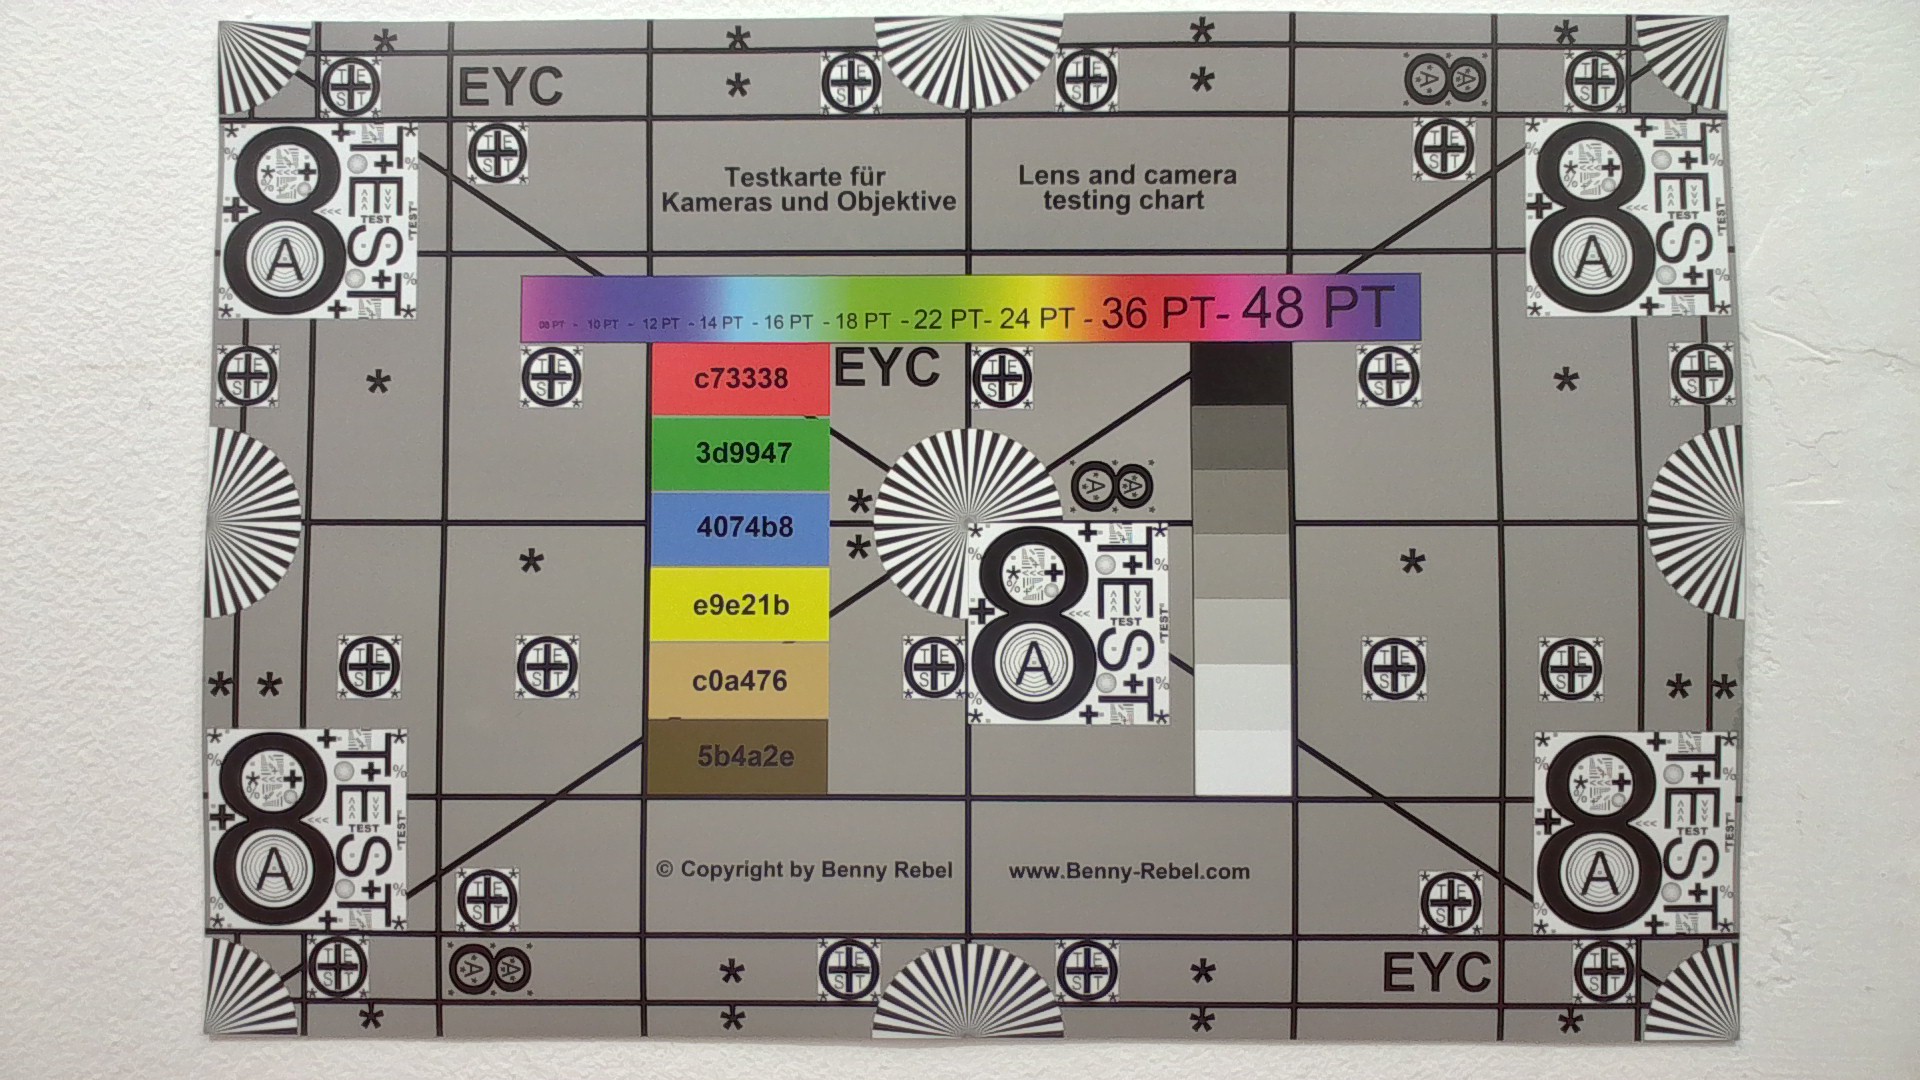
Webcam

Maintenance
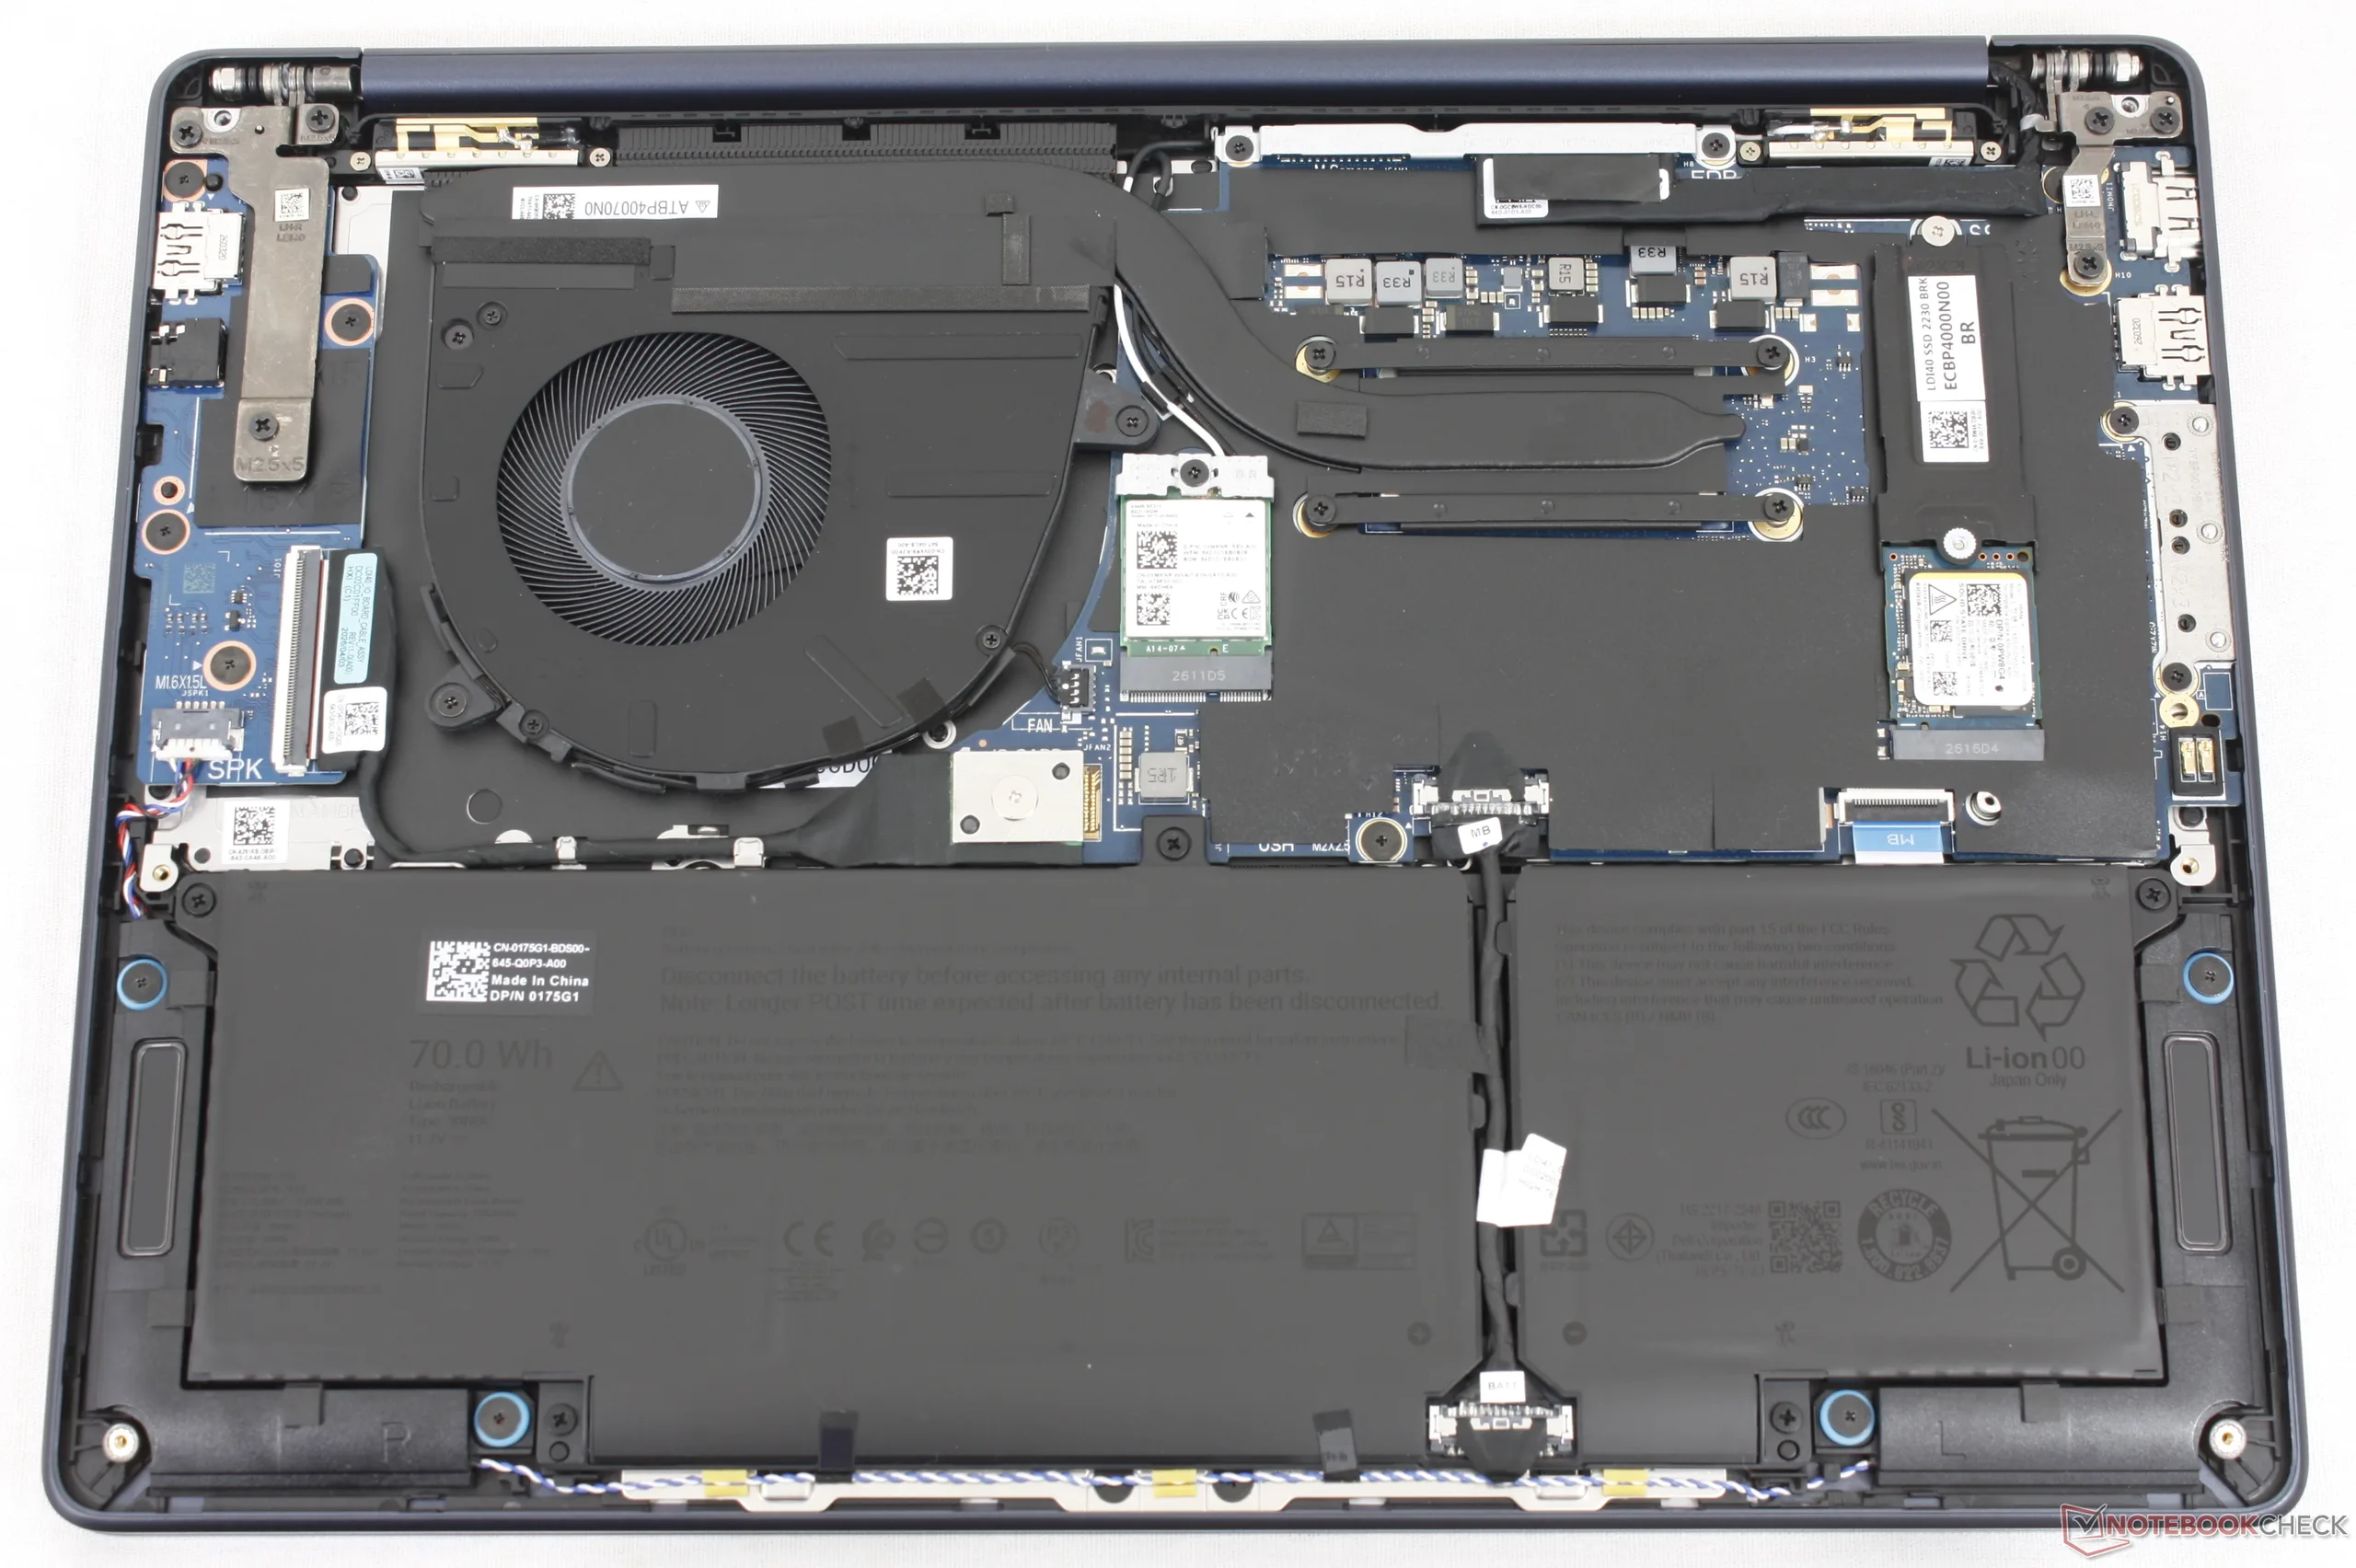
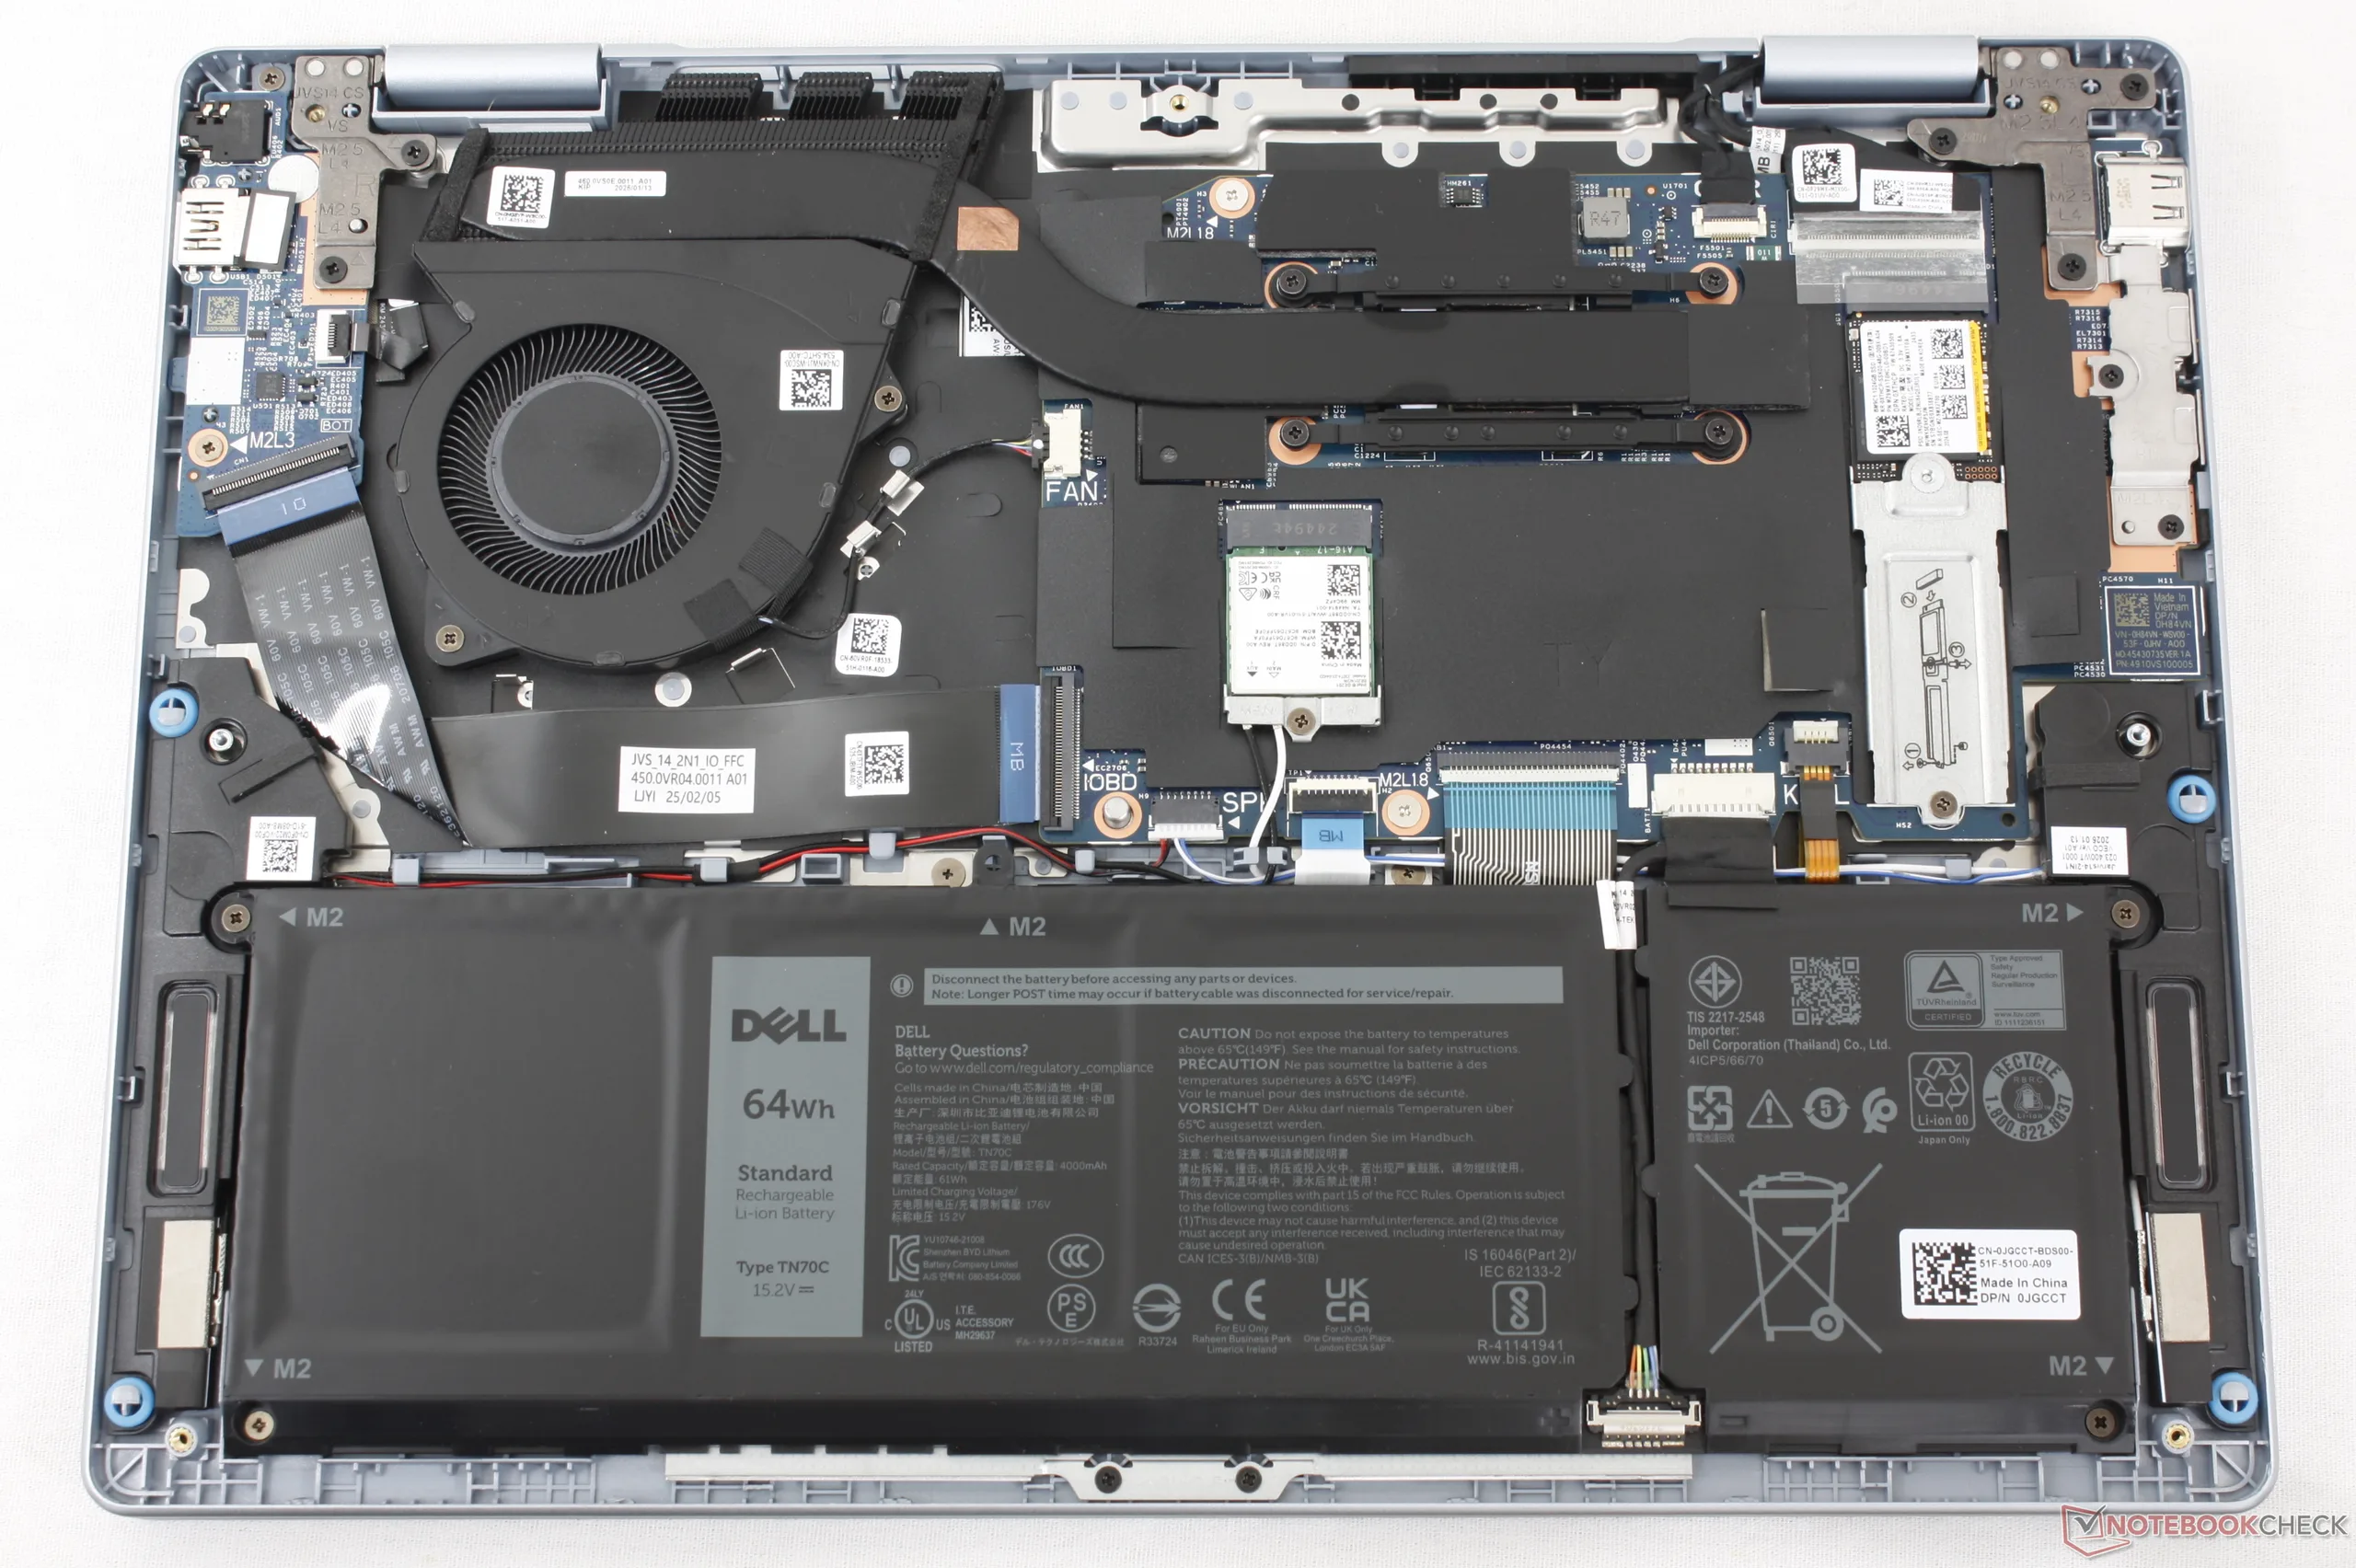
Sustainability
Up to 50 percent PCC plastic is utilized for the chassis, bezel, and speaker while up to 50 percent recycled aluminum, steel, and cobalt are used for the outer cover, palm rests, keyboard brackets, and battery, respectively. The packaging is plastic-free.
Input Devices
Display

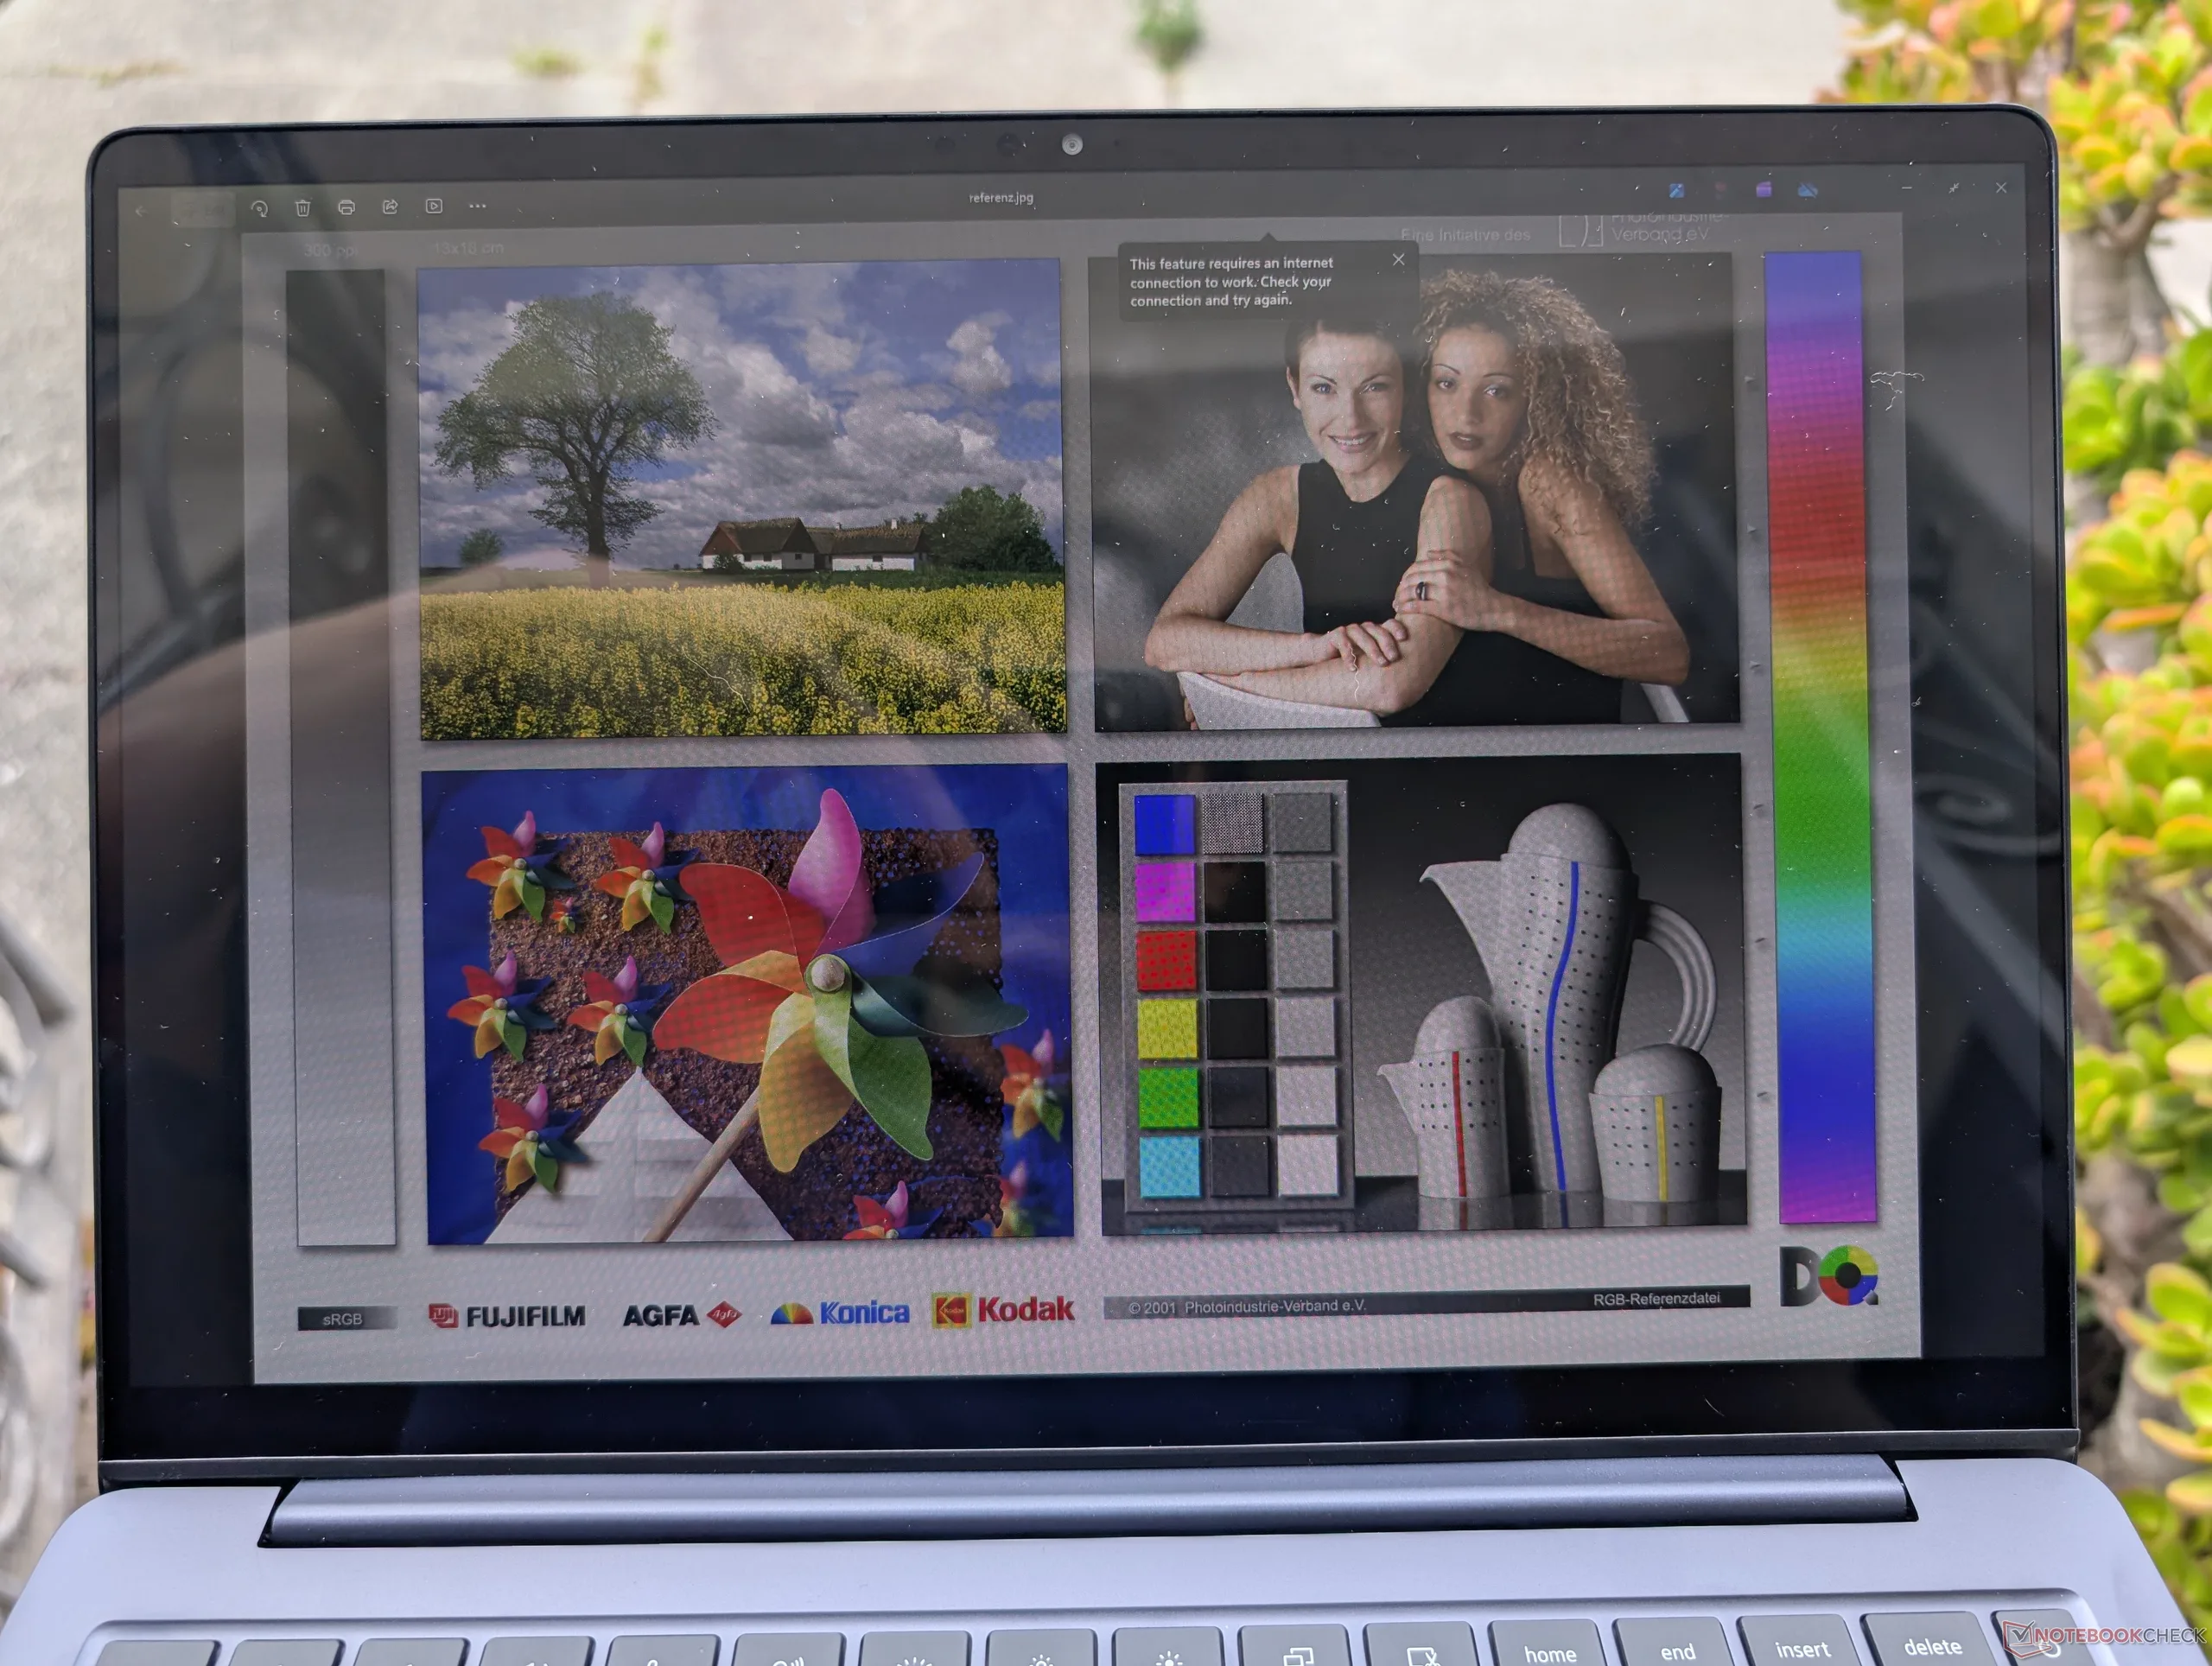
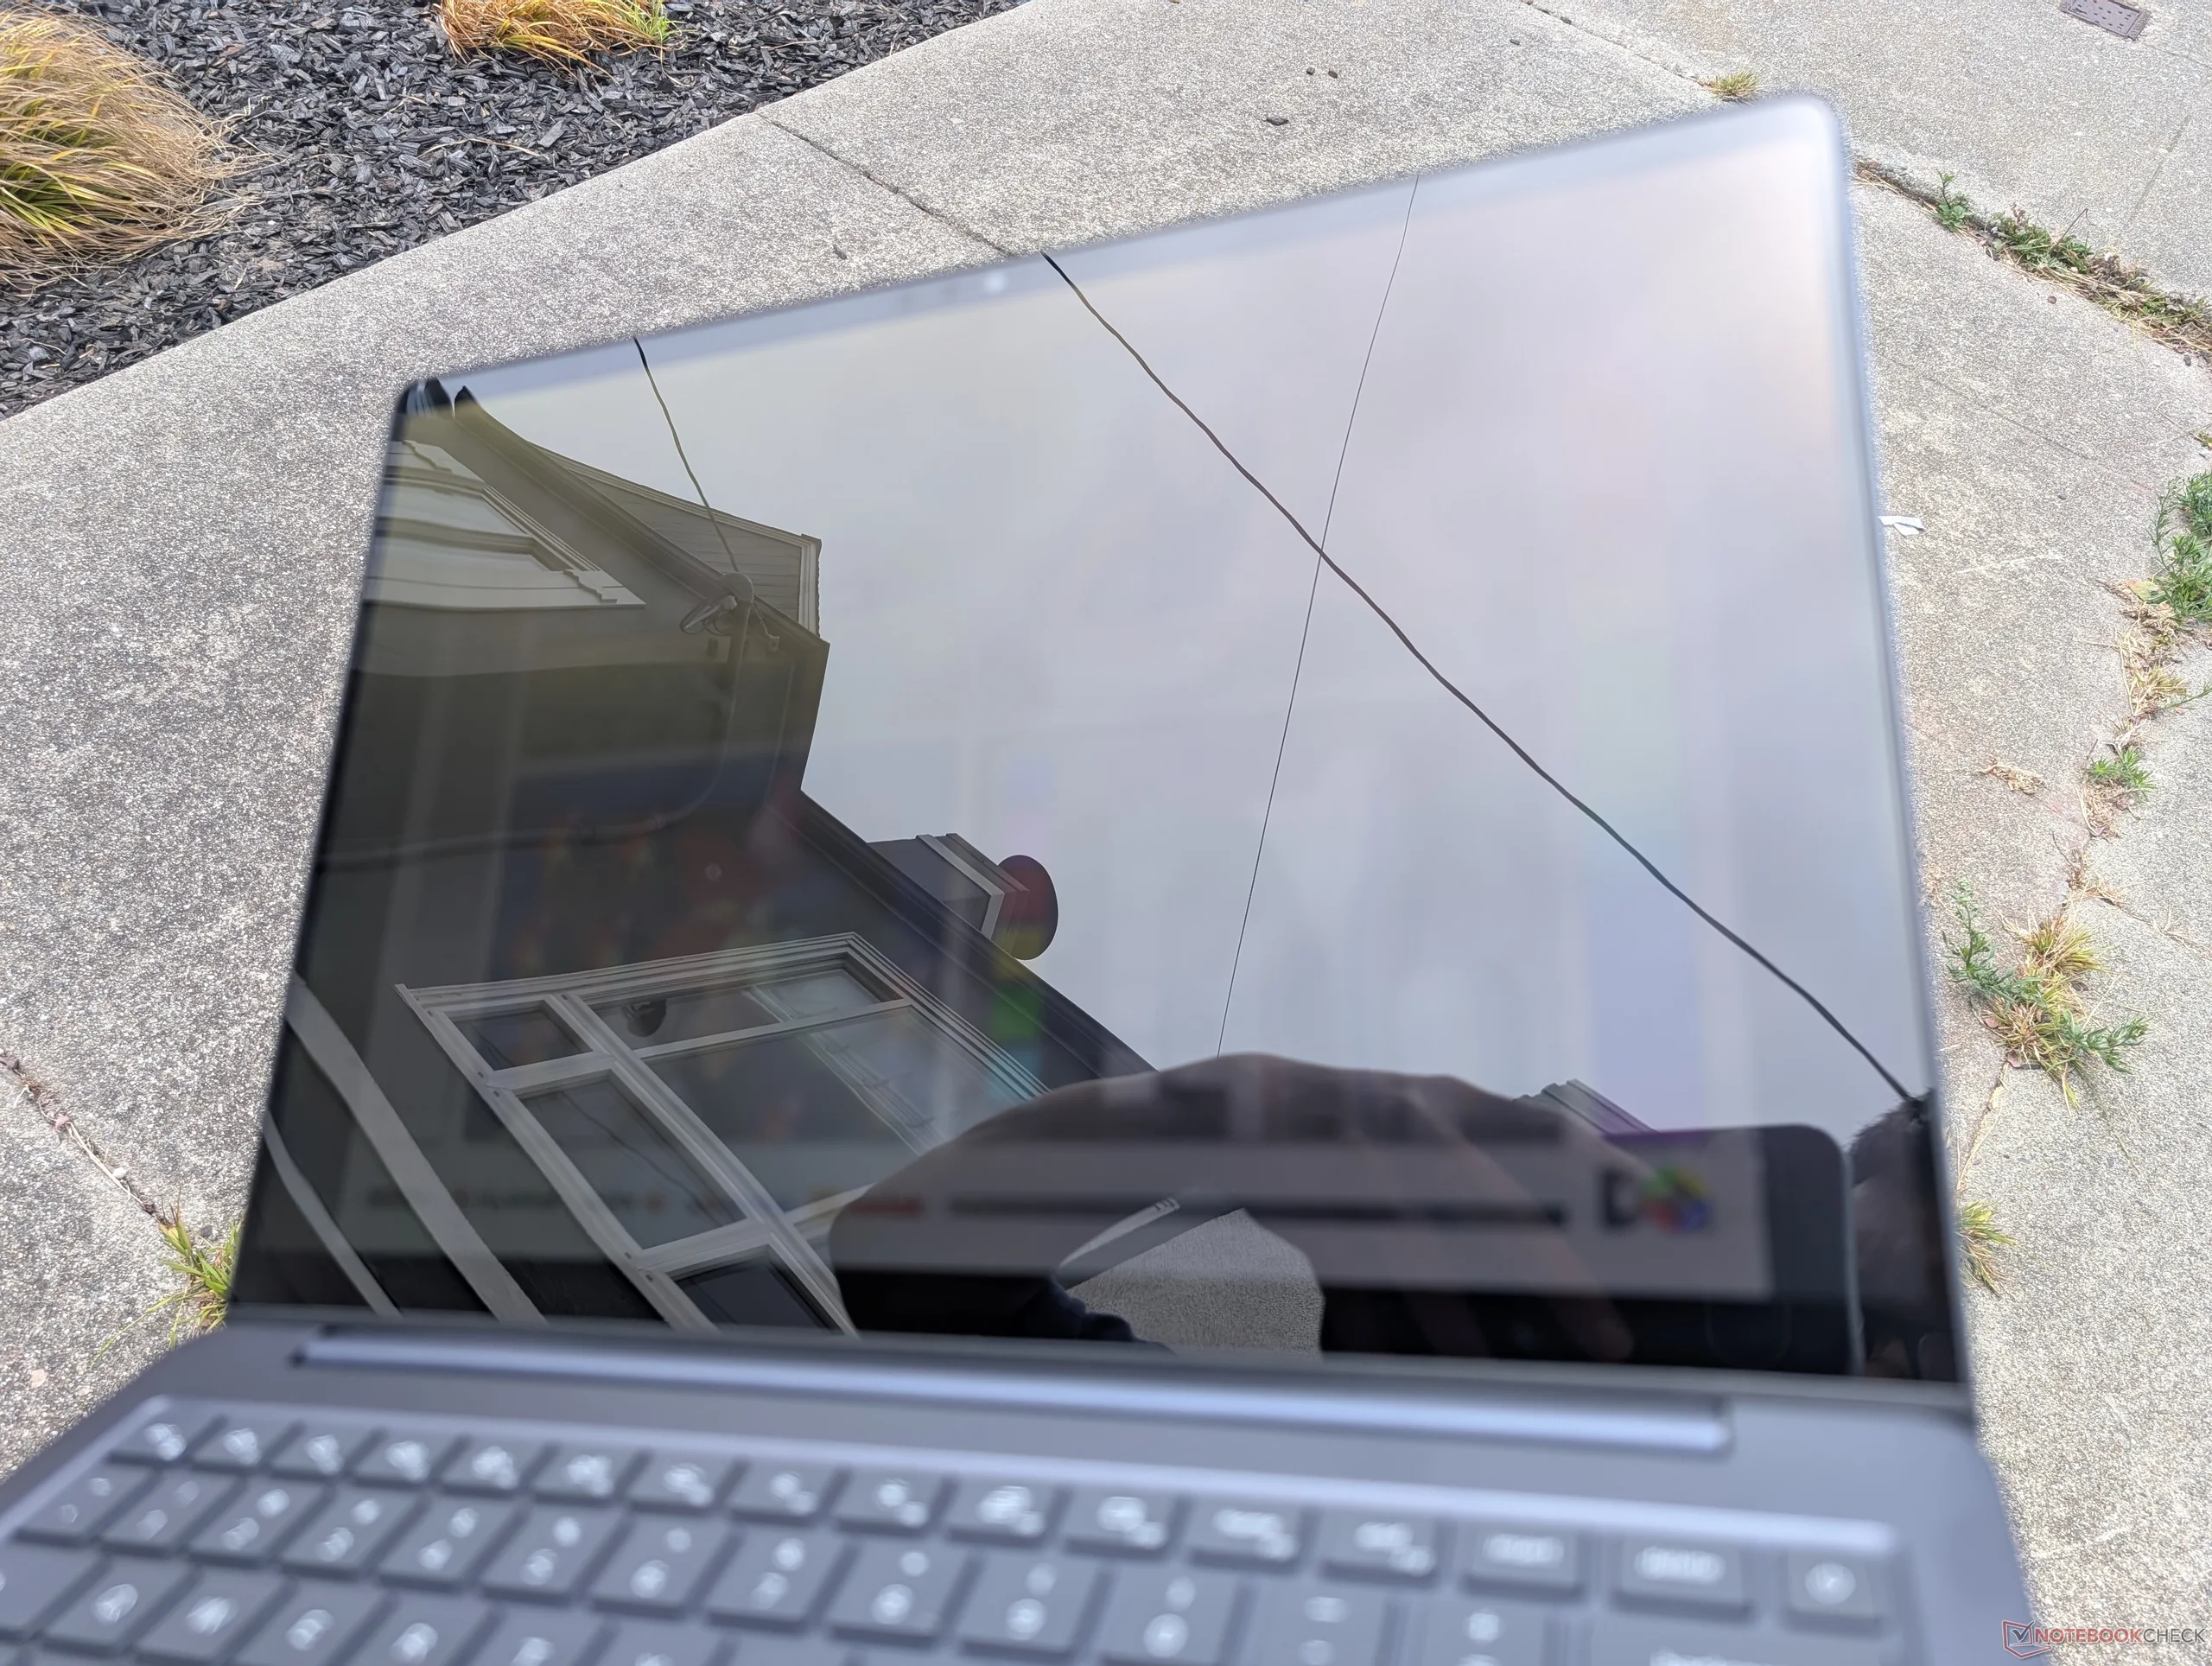
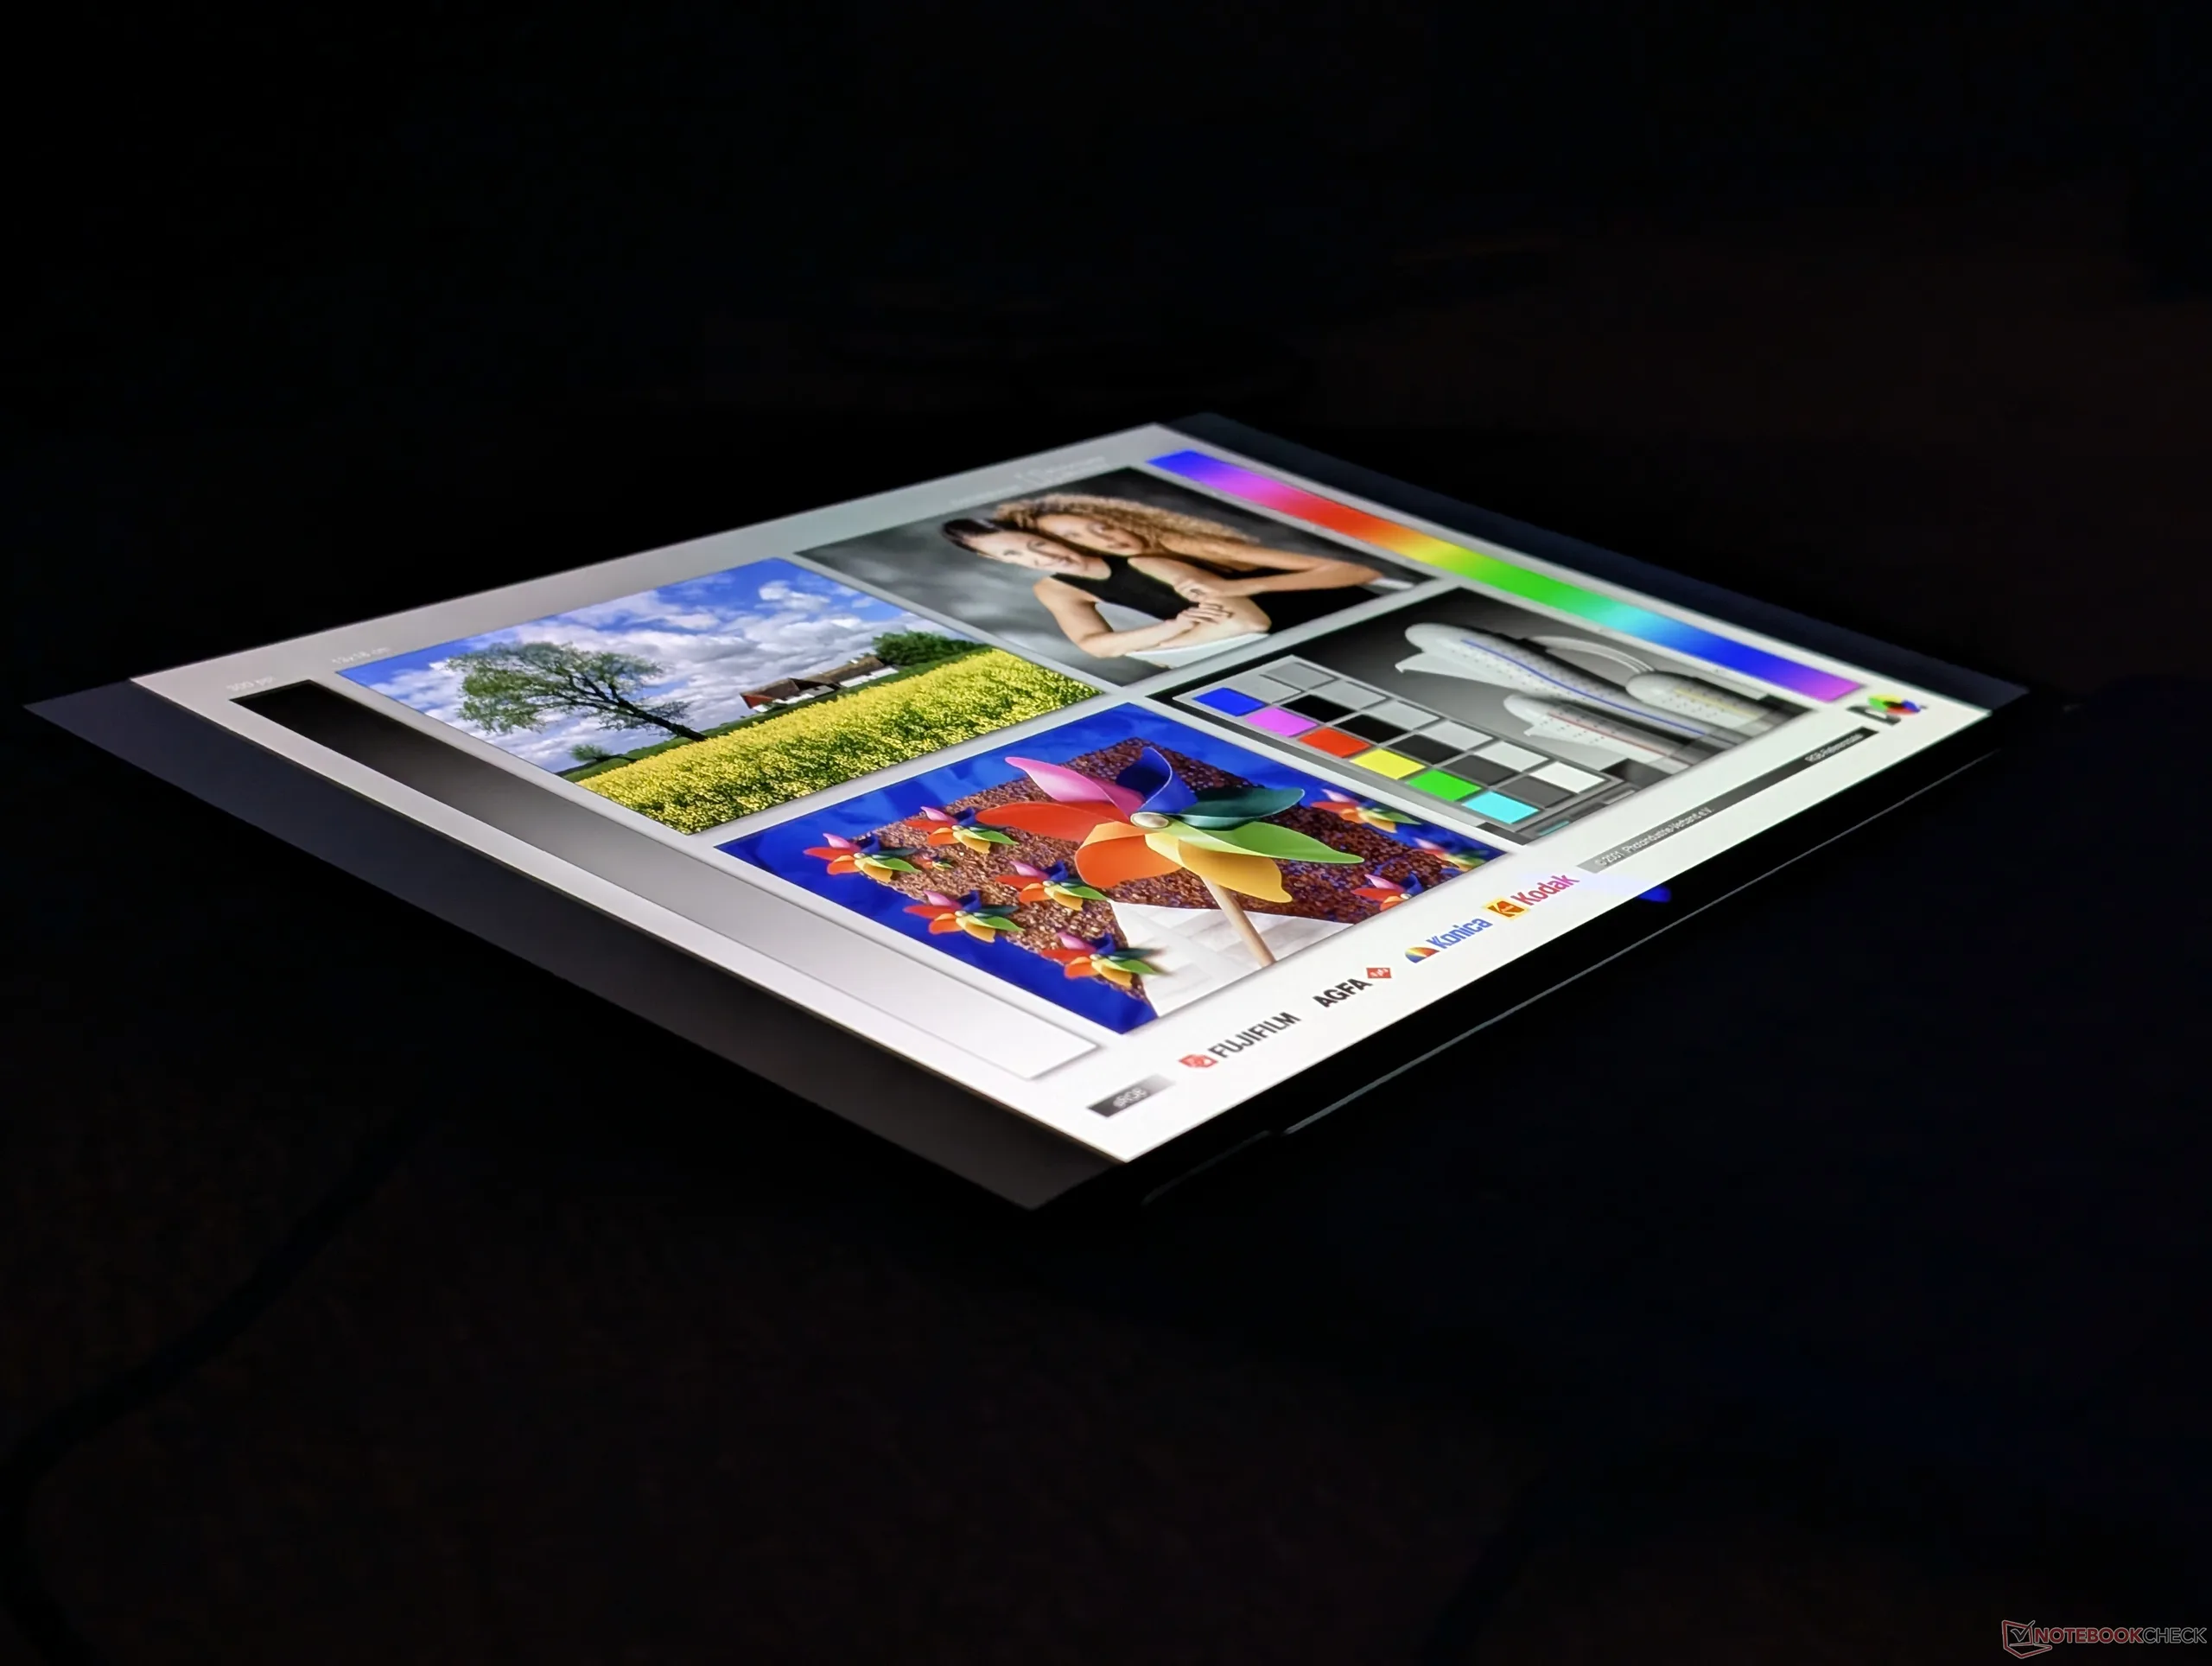
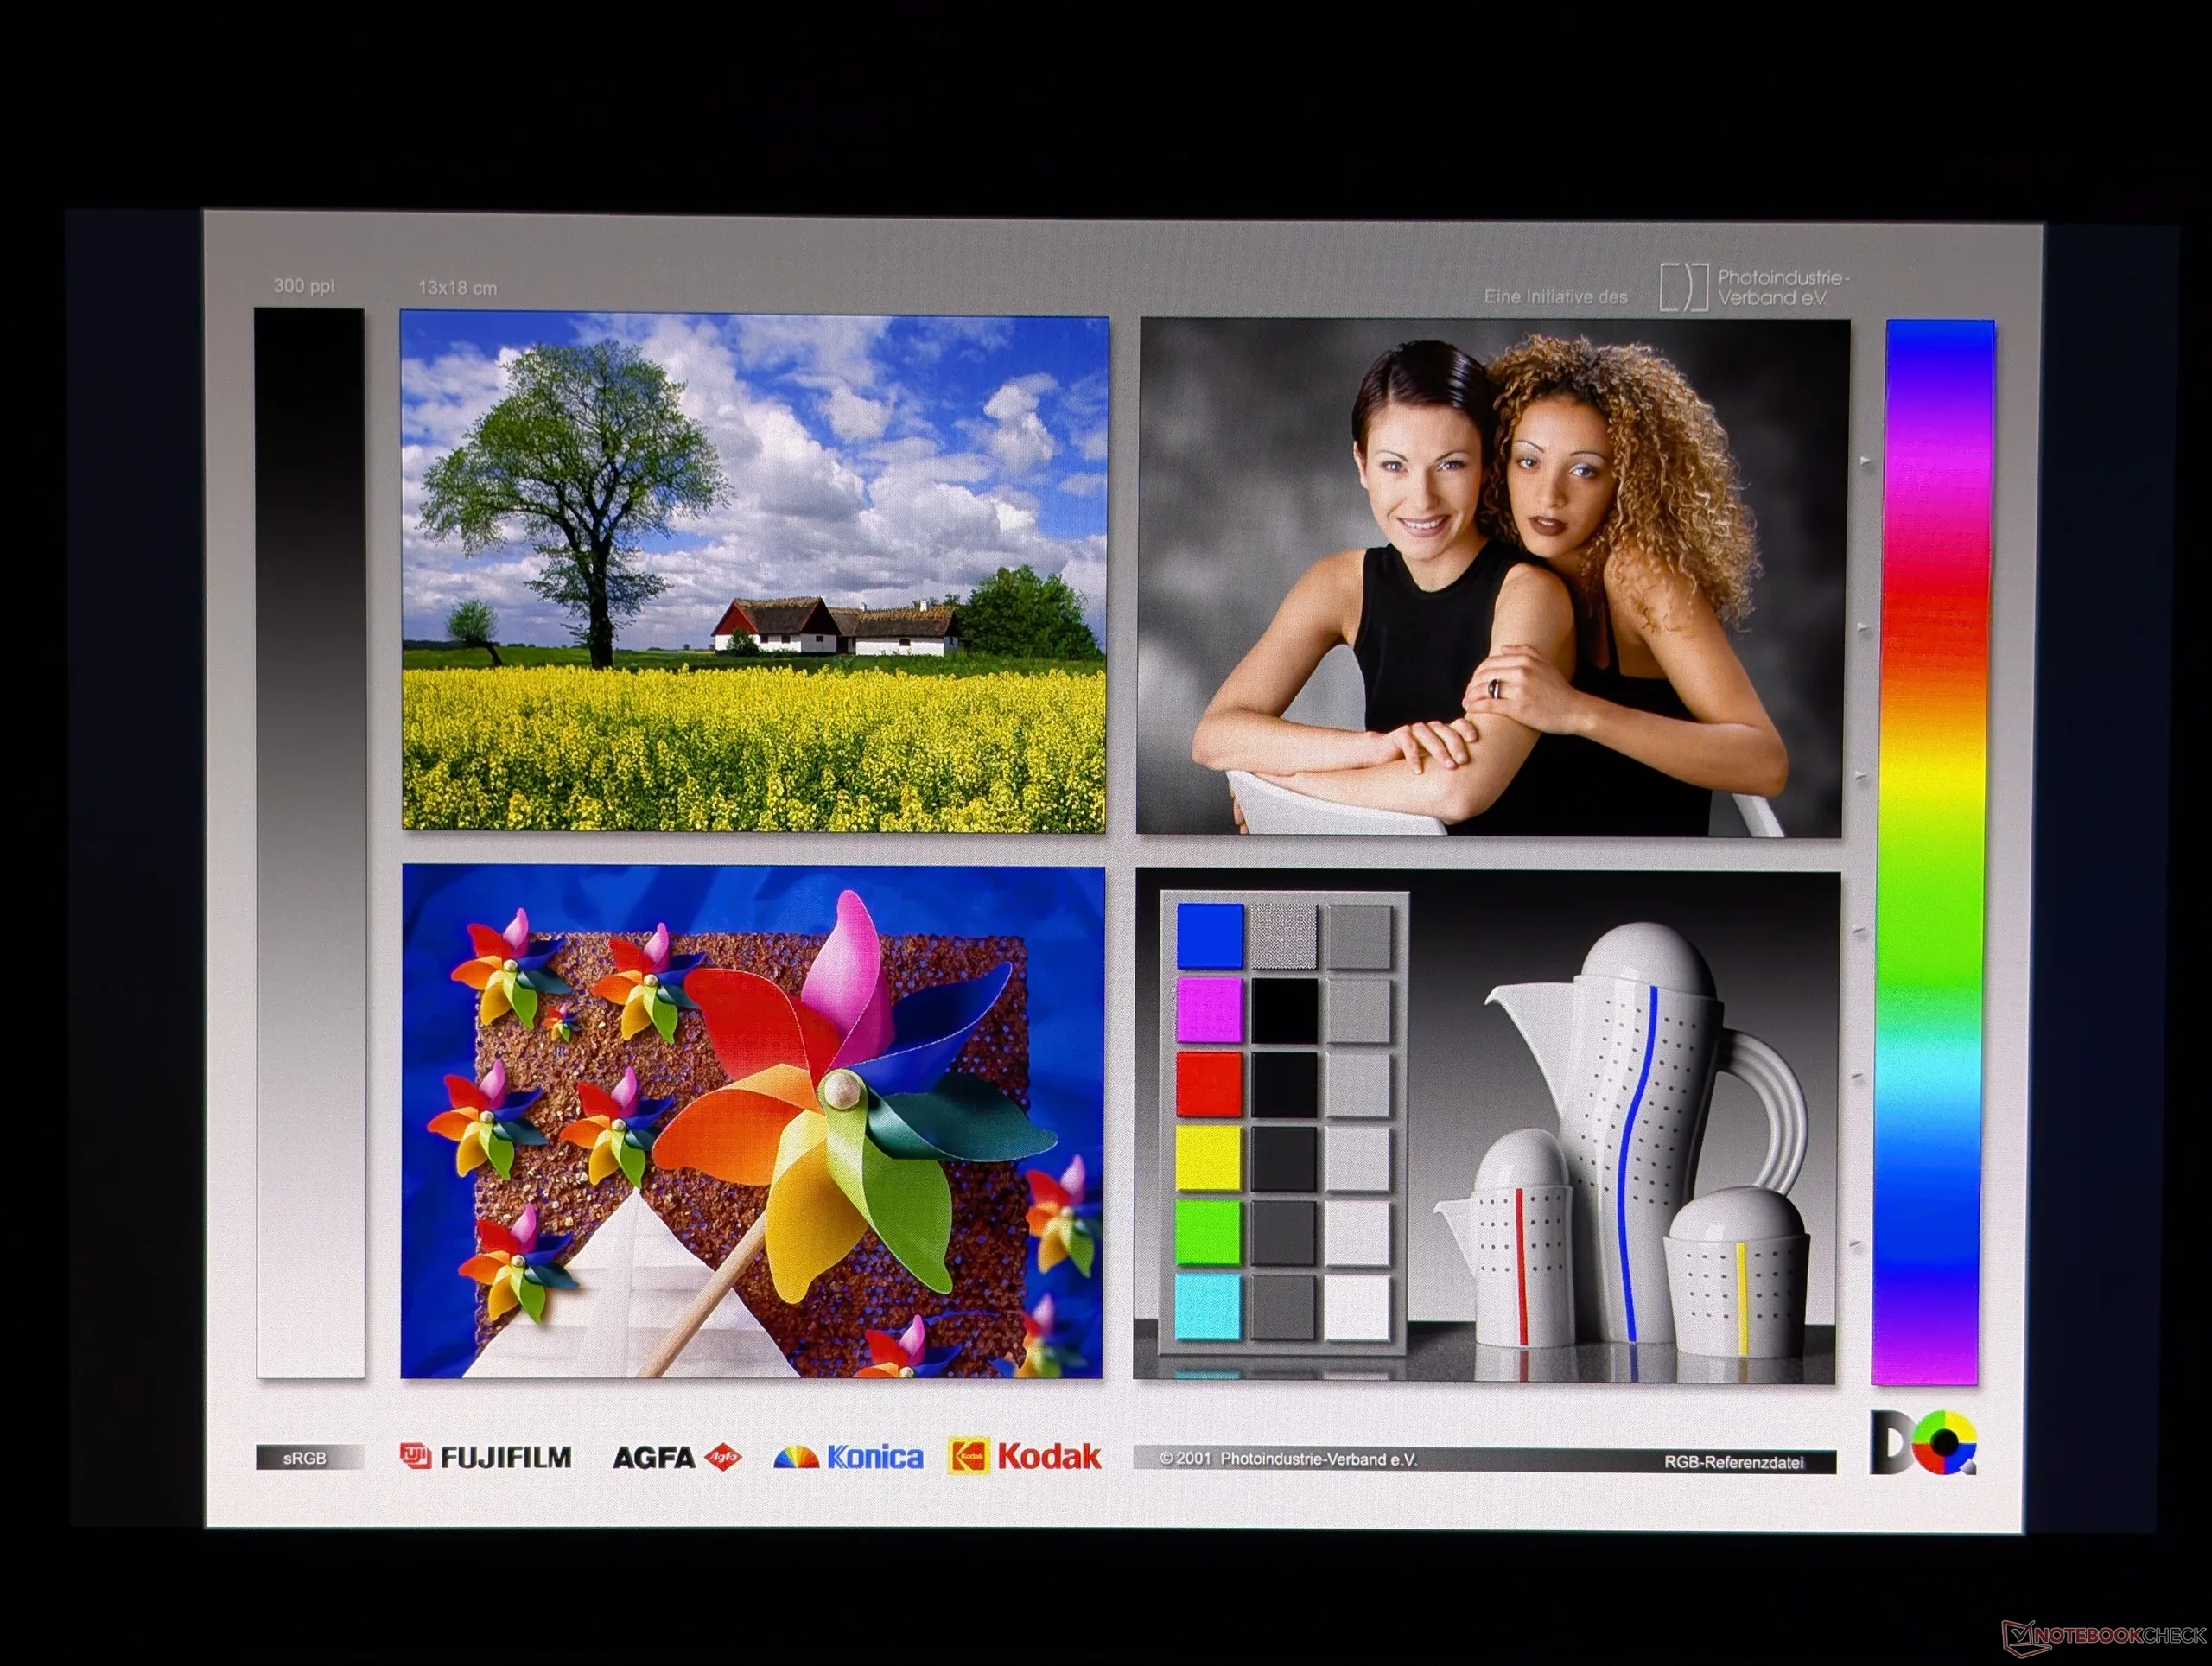
Five display options are available as follows:
- 1920 x 1200, 60 Hz, non-touch, ~60% sRGB, matte, IPS, 400 nits
- 1920 x 1200, 60 Hz, touchscreen, ~60% sRGB, glossy, IPS, 400 nits
- 2560 x 1600, 120 Hz, non-touch, 100% sRGB, matte, IPS, 500 nits
- 1920 x 1200, 60 Hz, non-touch, 100% DCI-P3, glossy, OLED, 300 nits
- 1920 x 1200, 60 Hz, touch, 100% DCI-P3, glossy, OLED, 300 nits
Our test unit has been configured with the option in bold.
| |||||||||||||||||||||||||
Brightness Distribution: 98 %
Center on Battery: 282.4 cd/m²
Contrast: ∞:1 (Black: 0 cd/m²)
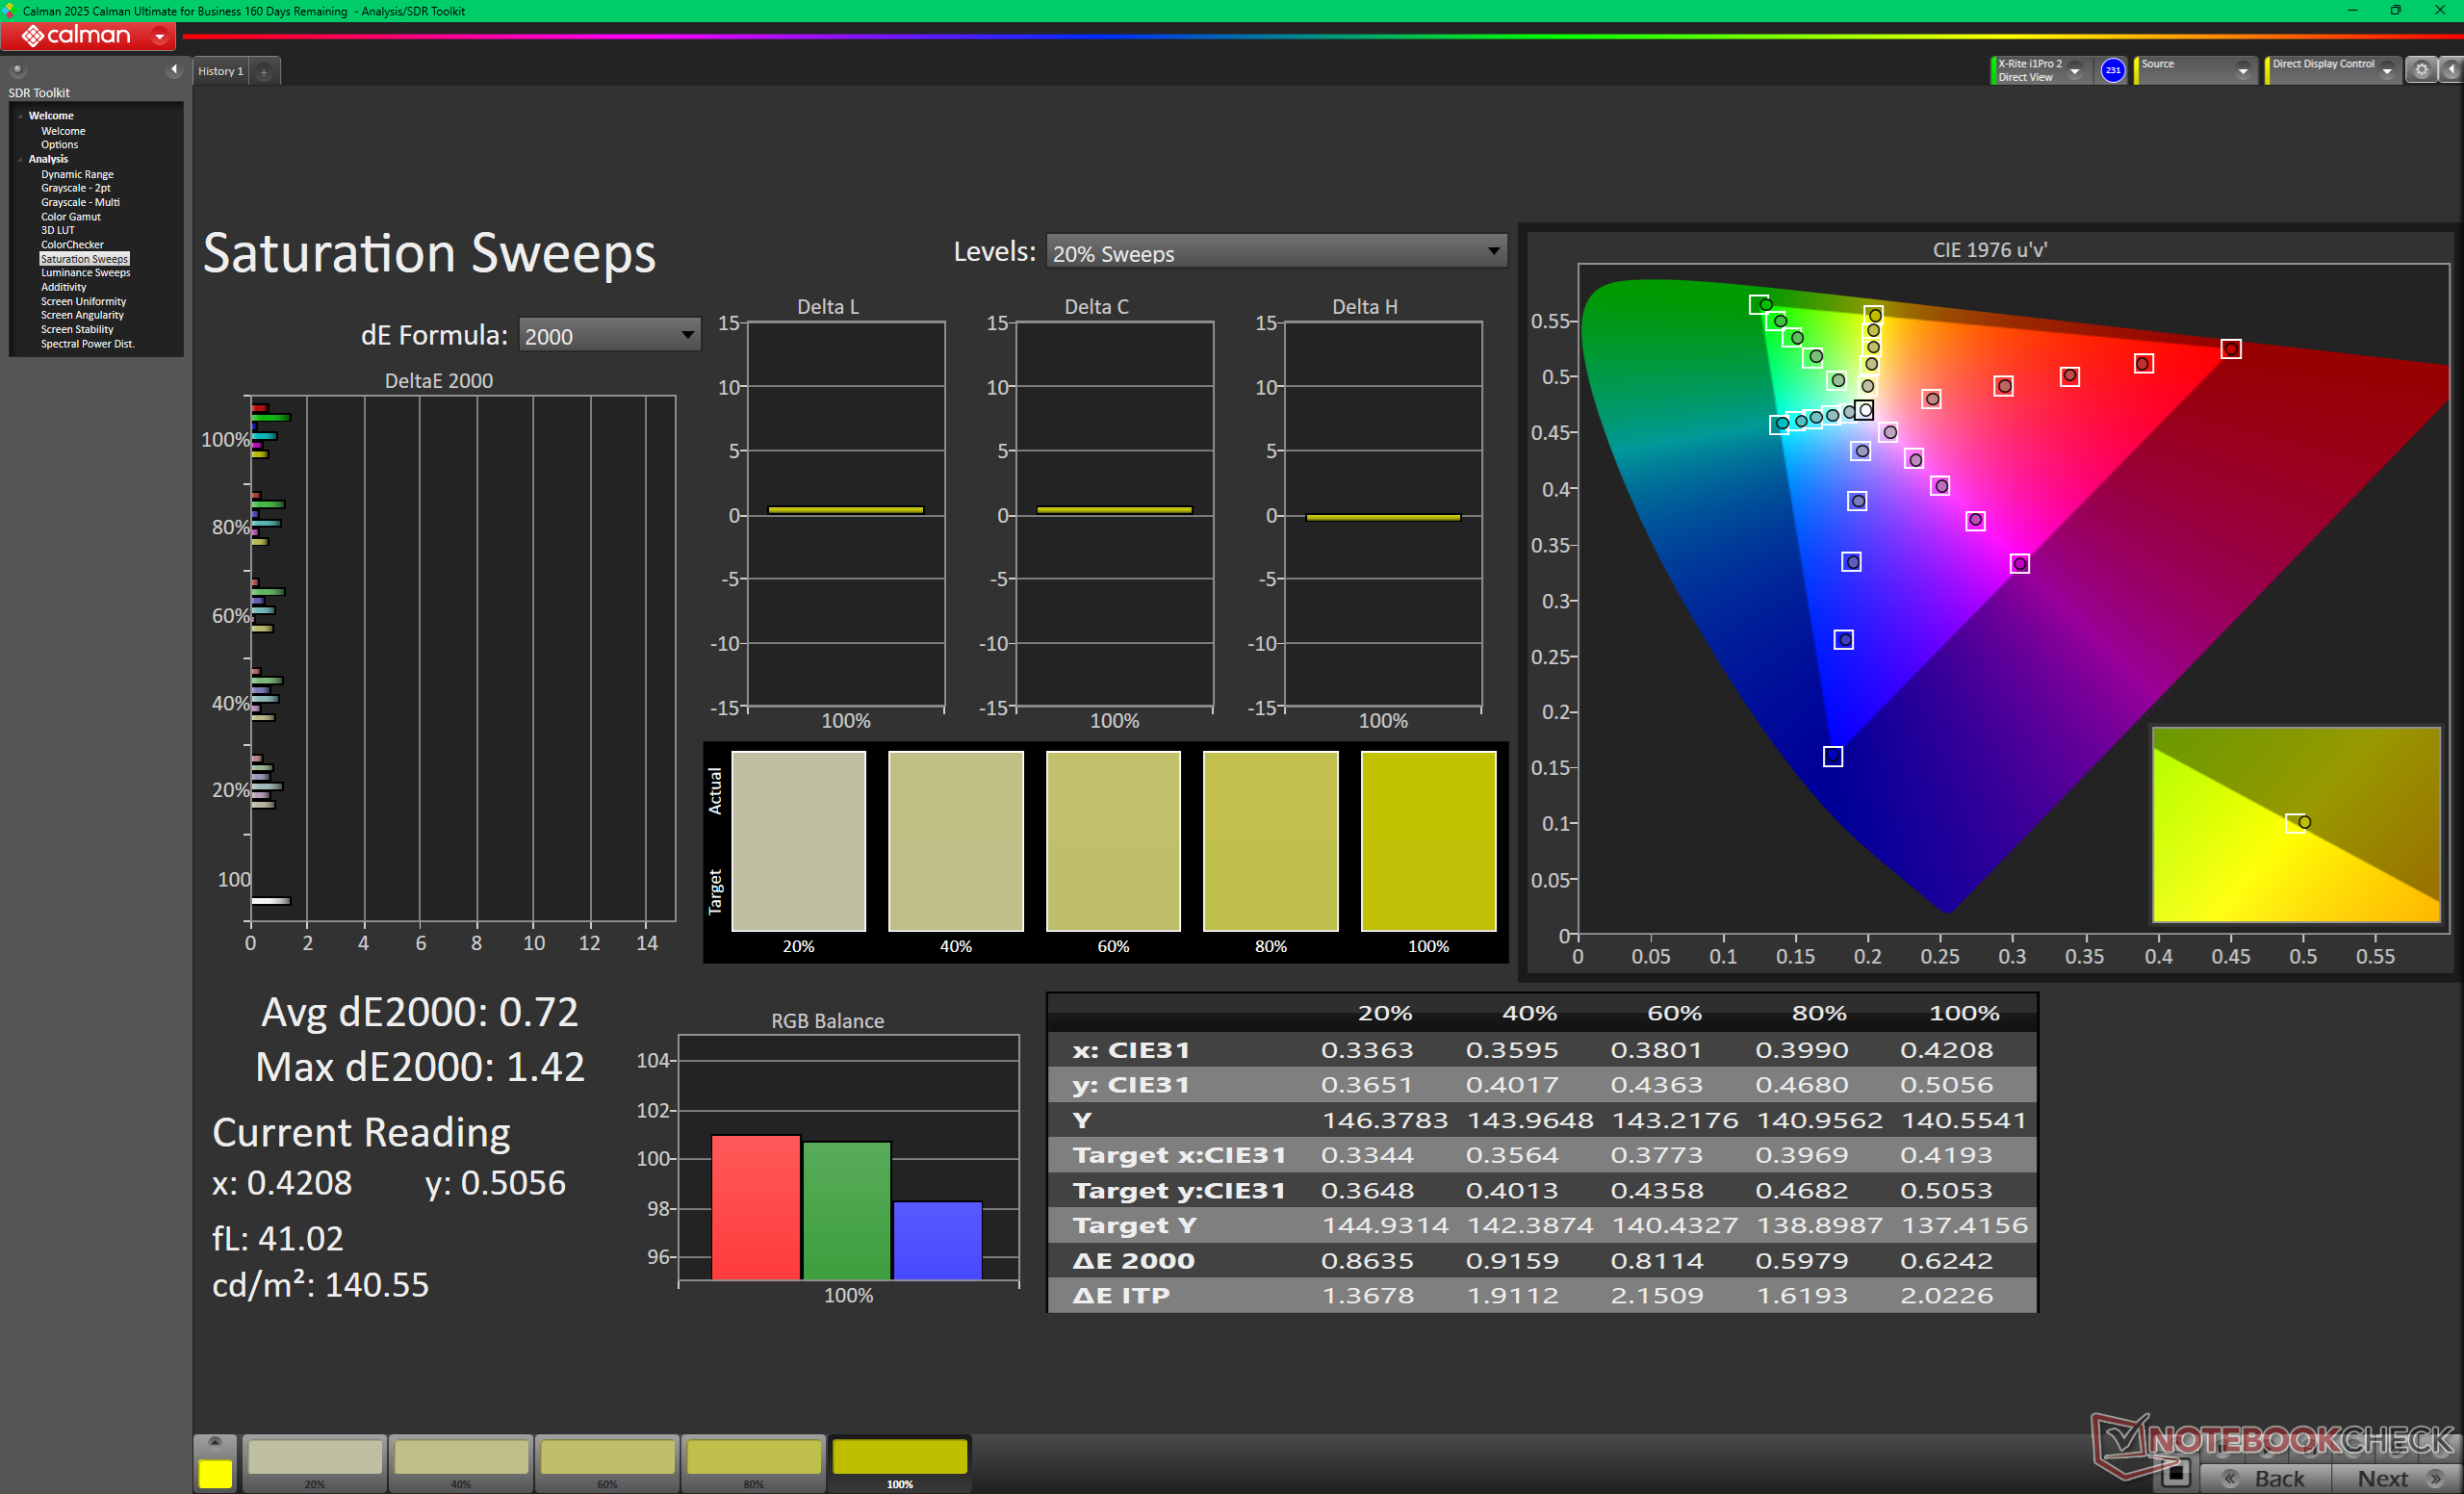
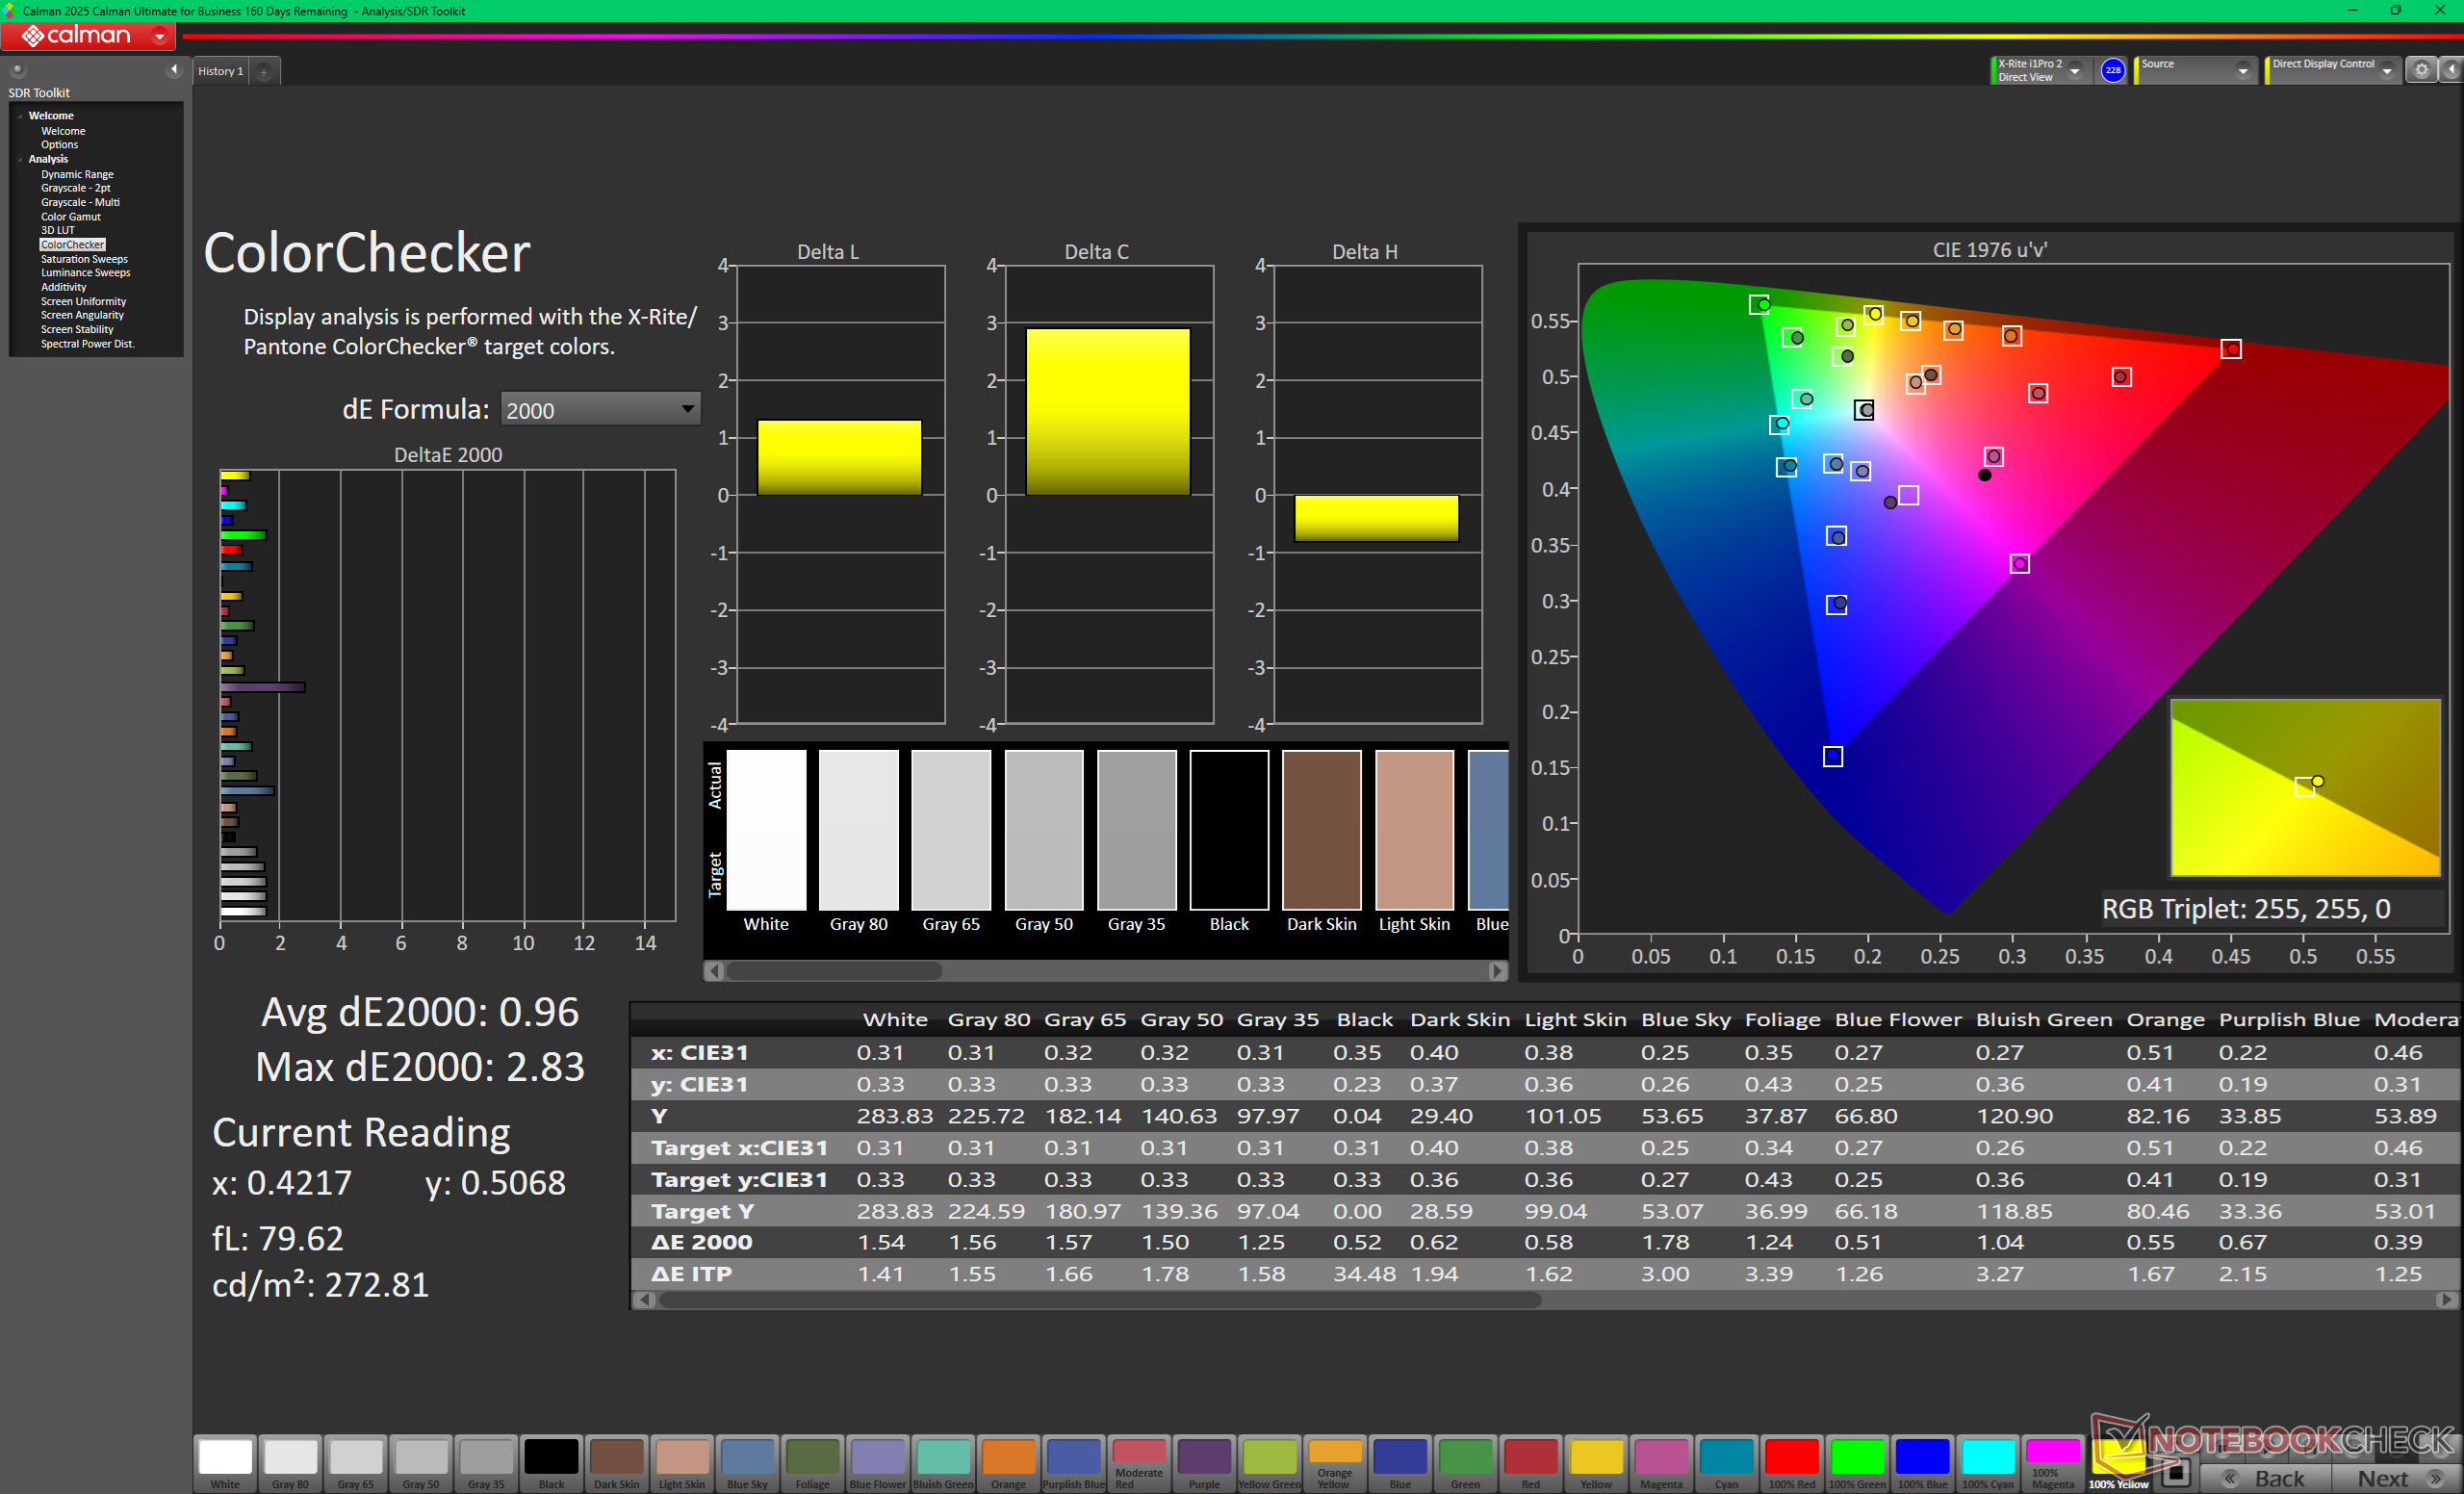
ΔE ColorChecker Calman: 0.96 | ∀{0.5-29.43 Ø4.69}
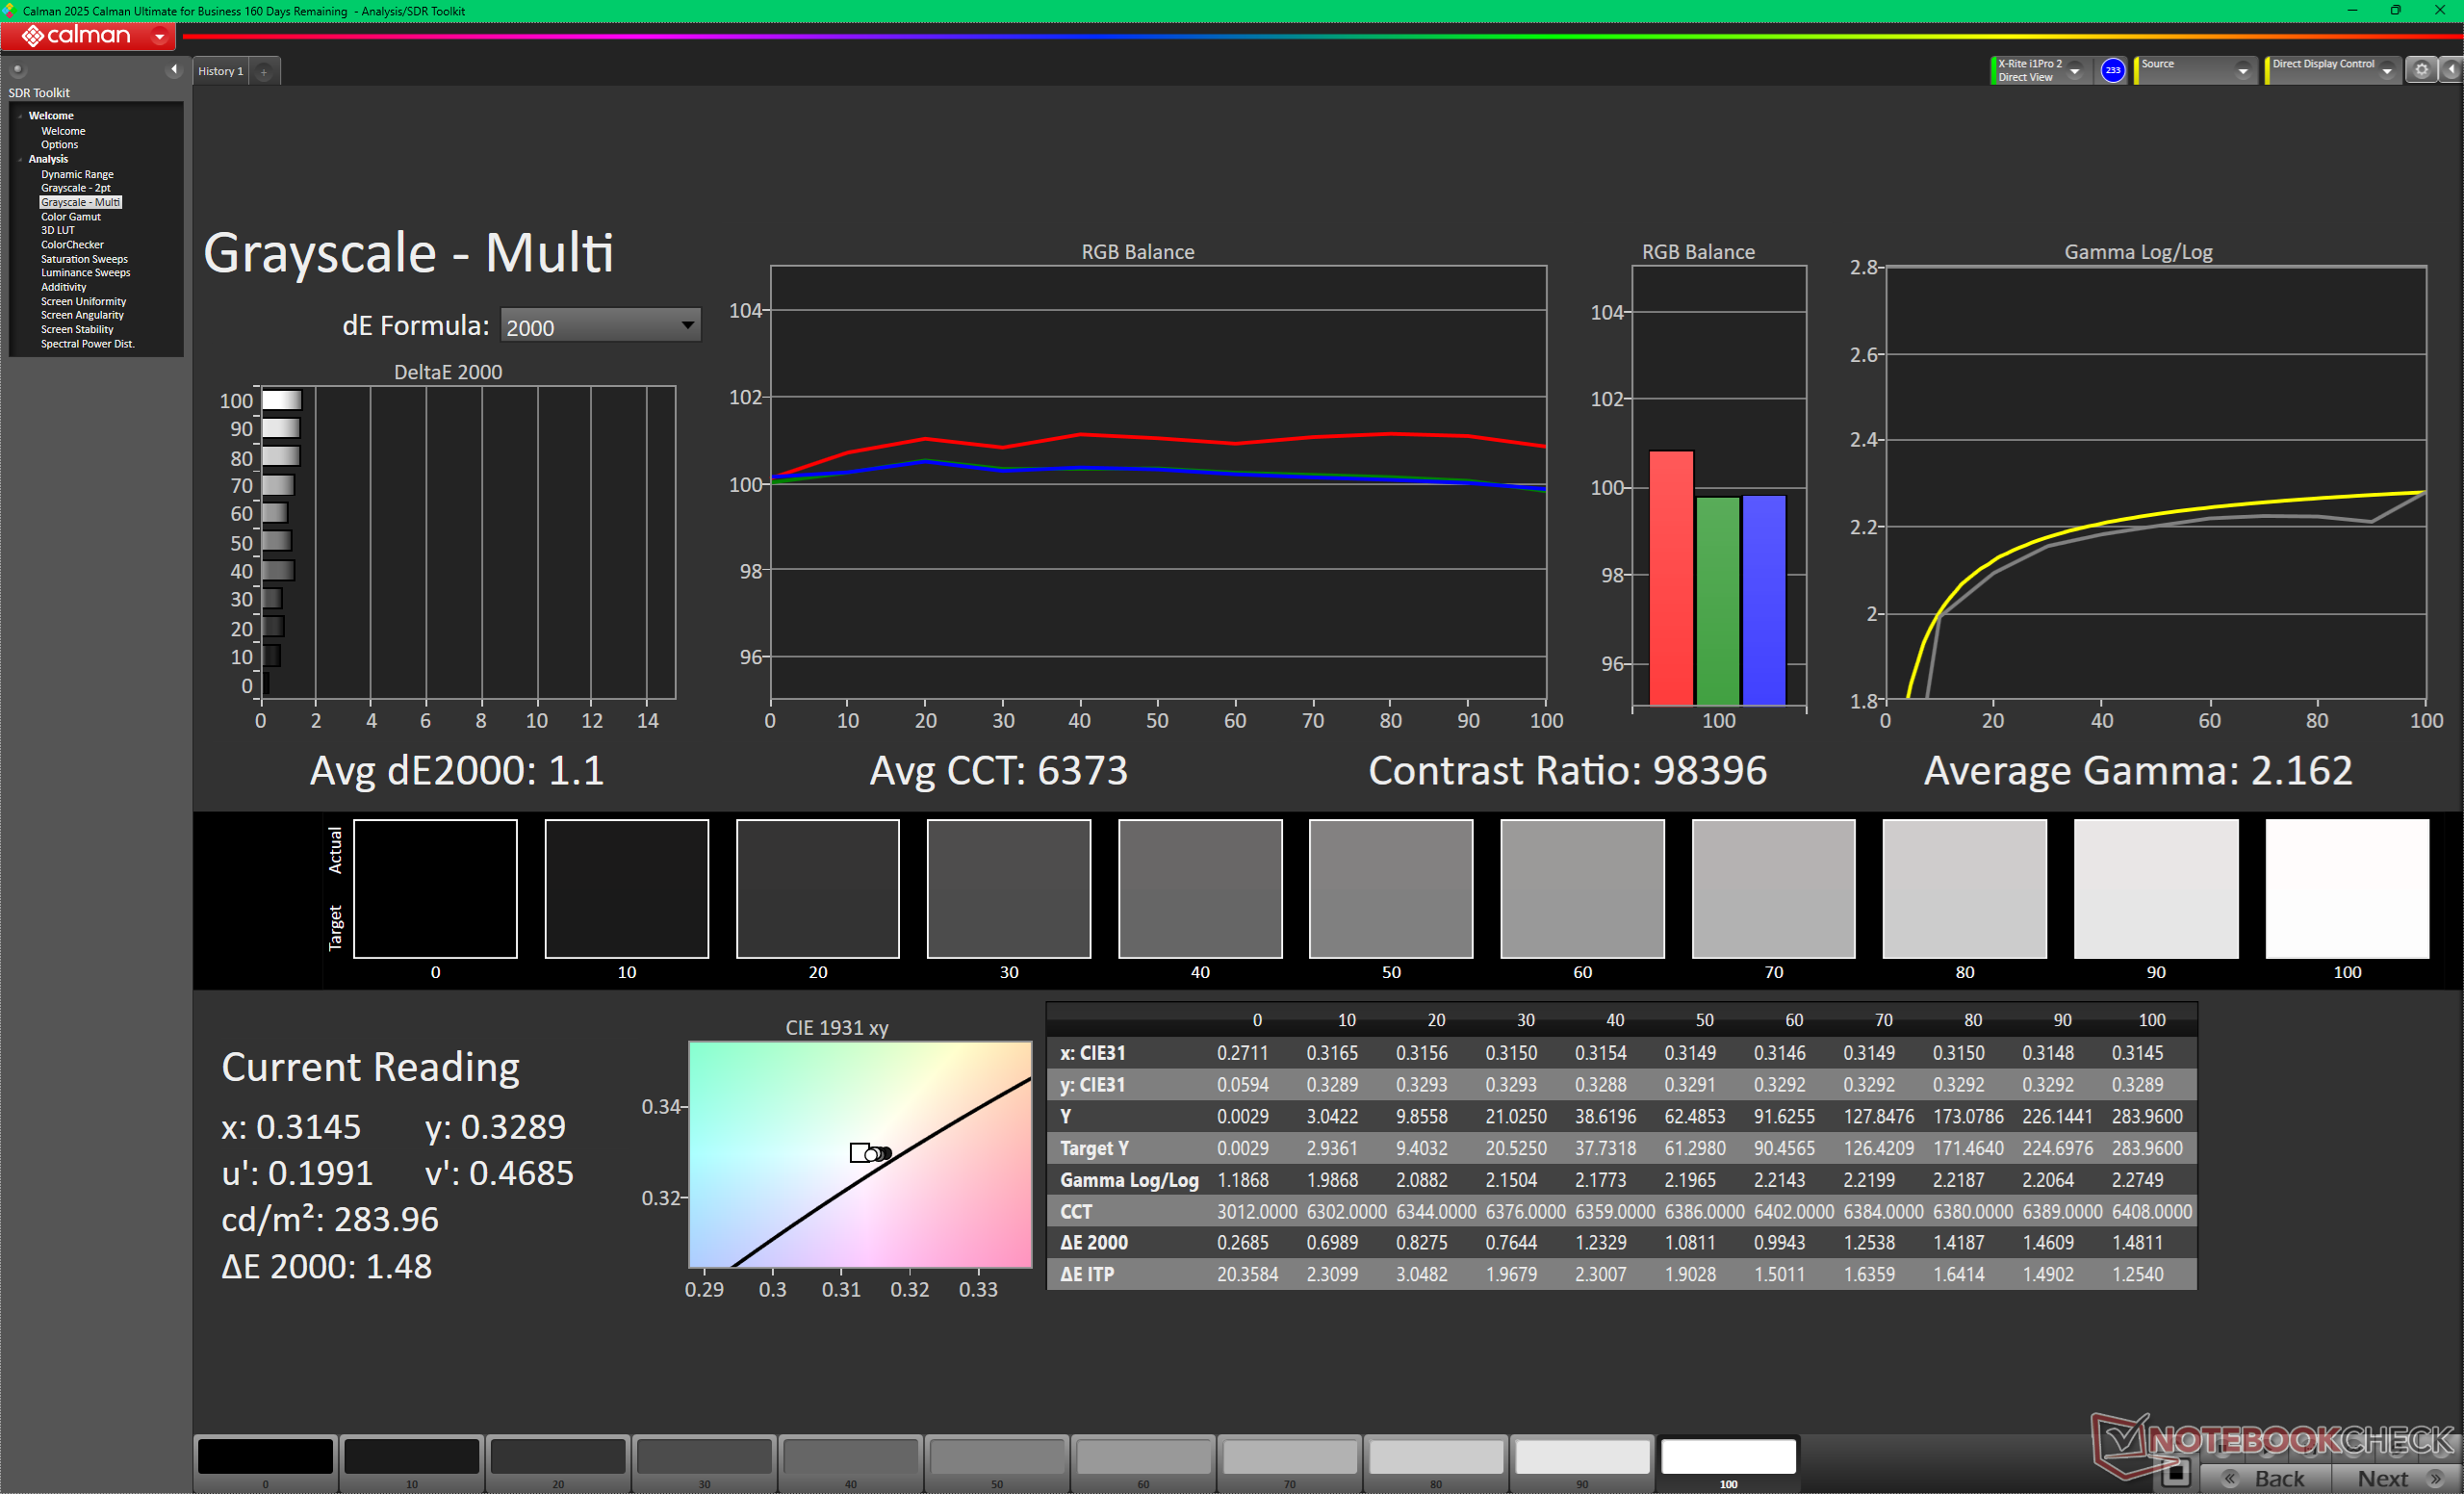
ΔE Greyscale Calman: 1.1 | ∀{0.09-98 Ø4.94}
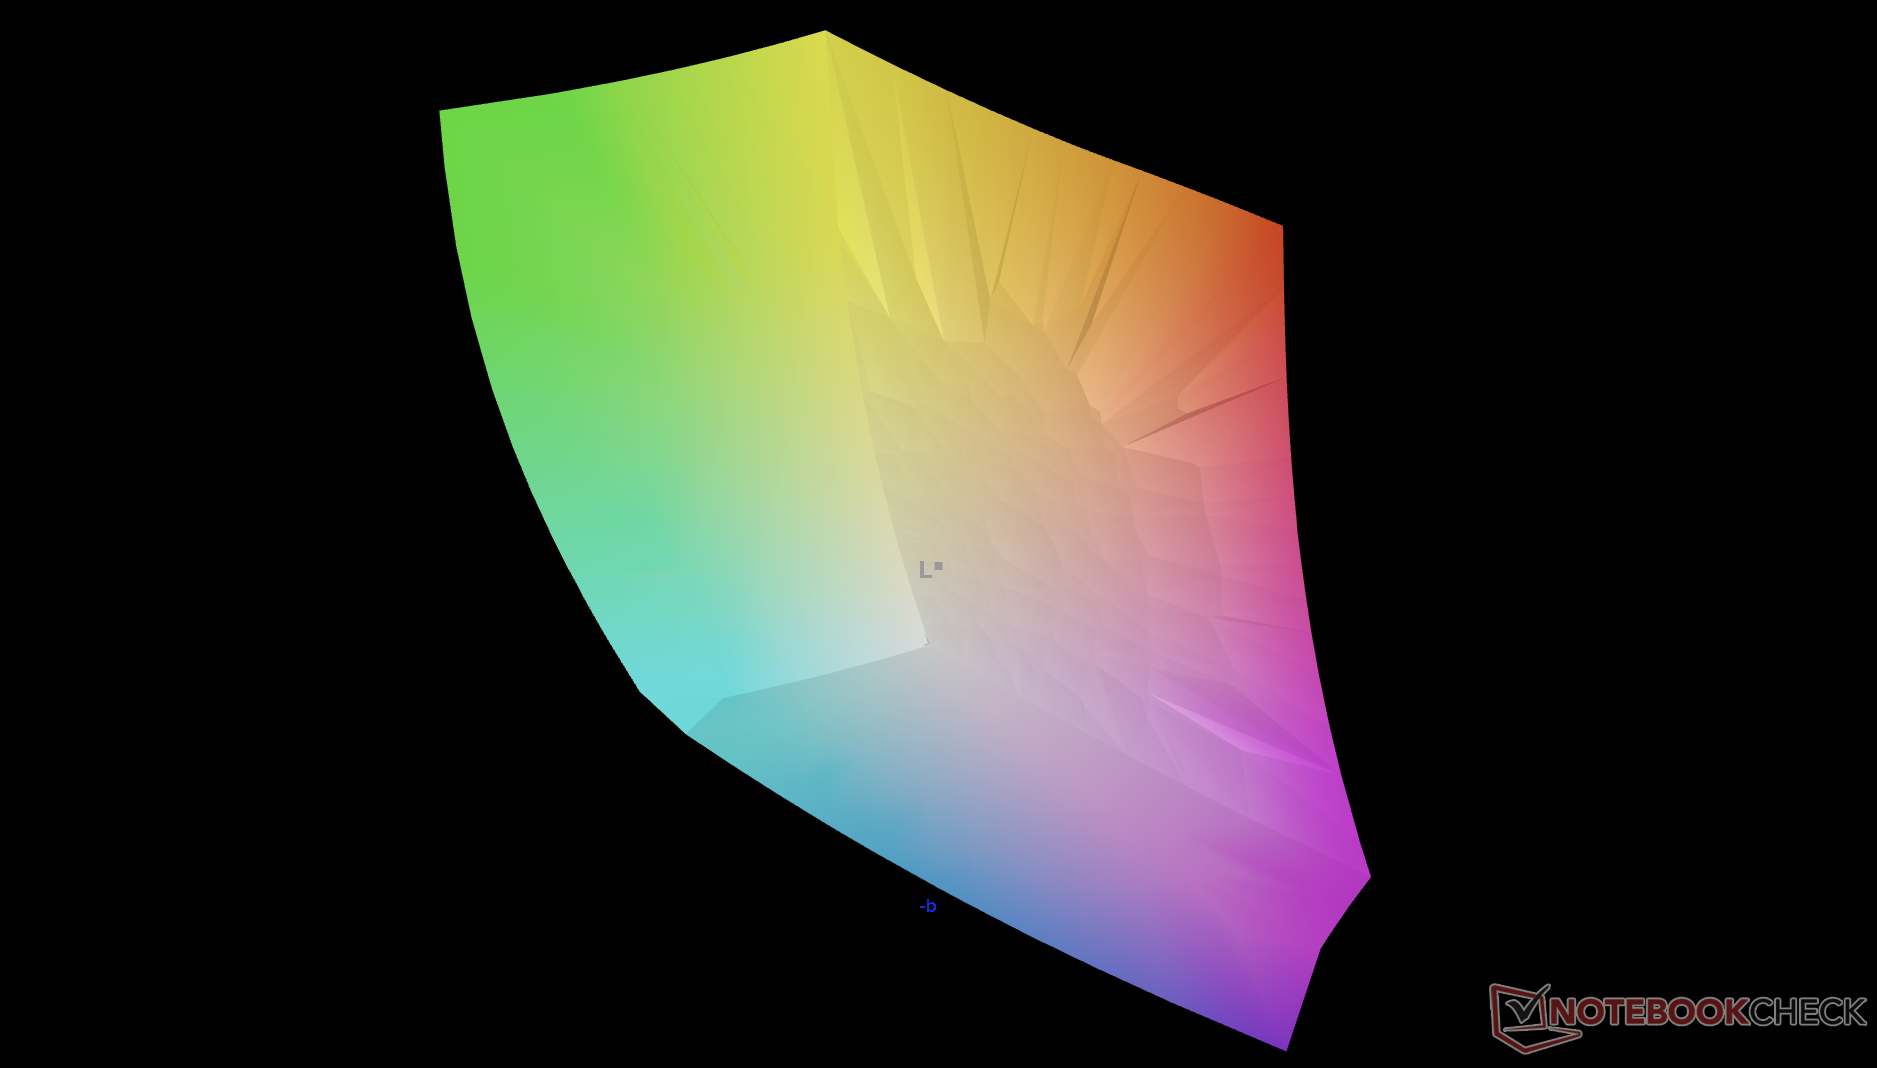
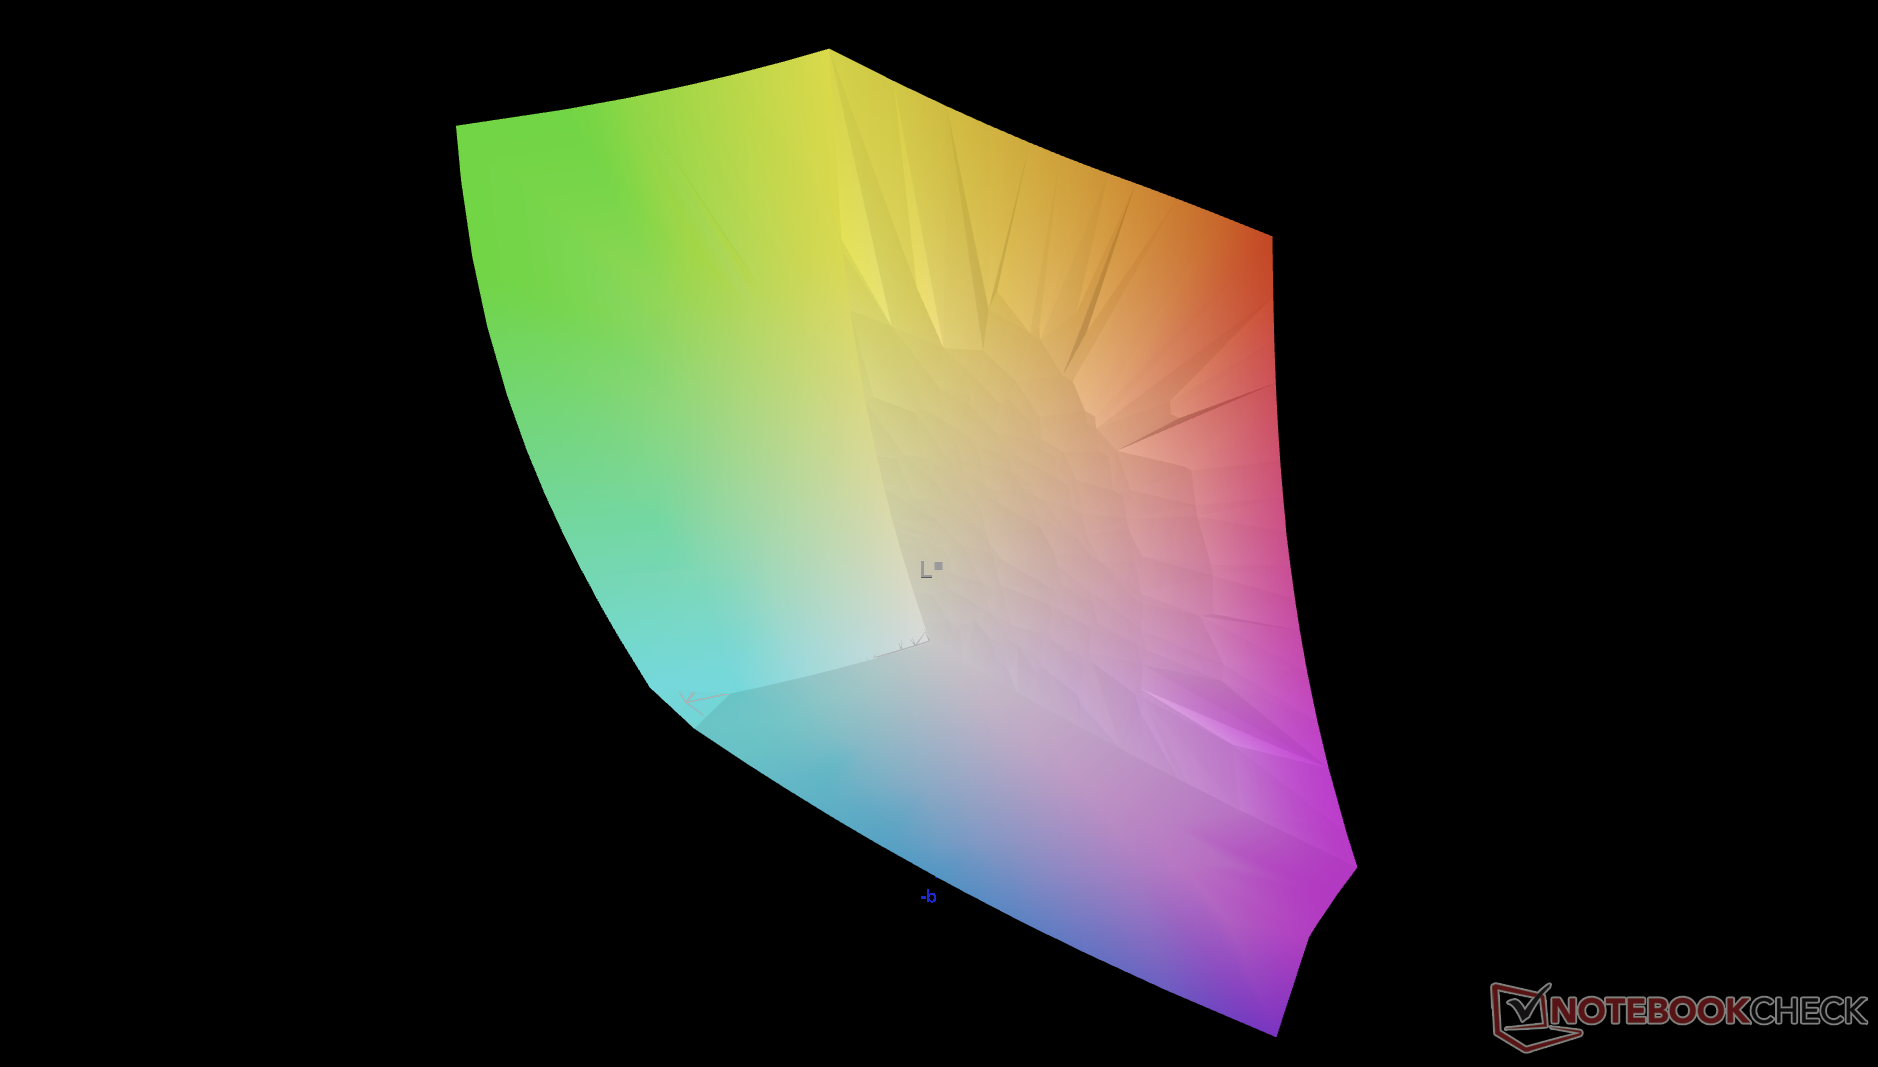
92.3% AdobeRGB 1998 (Argyll 3D)
100% sRGB (Argyll 3D)
100% Display P3 (Argyll 3D)
Gamma: 2.16
CCT: 6373 K
| Dell 14S DS14260 Samsung 140KW04, OLED, 1920x1200, 14", 60 Hz | Lenovo ThinkBook 14 G9 IPL 21UX005PGE LEN140WUXGA, IPS LED, 1920x1200, 14", 60 Hz | Dell XPS 14 Core Ultra X7 358H LG Philips 140WT2, OLED, 2880x1800, 14", 120 Hz | HP OmniBook Ultra 14 Core Ultra X9 Samsung SDC4215, OLED, 2880x1800, 14", 120 Hz | Dell Inspiron 14 7445 2-in-1 AU Optronics B14UAT, IPS, 1920x1200, 14", 60 Hz | Asus VivoBook S 14 OLED M5406WA ATNA40CT02-0 (SDC41A0), OLED, 1920x1200, 14", 60 Hz | |
|---|---|---|---|---|---|---|
| Display | -53% | 2% | 0% | -57% | 2% | |
| Display P3 Coverage (%) | 100 | 39.3 -61% | 99.7 0% | 99.9 0% | 35.7 -64% | 99.9 0% |
| sRGB Coverage (%) | 100 | 59 -41% | 100 0% | 100 0% | 53.6 -46% | 100 0% |
| AdobeRGB 1998 Coverage (%) | 92.3 | 40.7 -56% | 98.2 6% | 92.3 0% | 36.9 -60% | 97.2 5% |
| Response Times | -901% | 15% | 29% | -1009% | 29% | |
| Response Time Grey 50% / Grey 80% * (ms) | 1.71 ? | 19.2 ? -1023% | 0.75 ? 56% | 0.58 ? 66% | 23 ? -1245% | 1.3 ? 24% |
| Response Time Black / White * (ms) | 1.81 ? | 15.9 ? -778% | 1.03 ? 43% | 0.87 ? 52% | 15.8 ? -773% | 1.2 ? 34% |
| PWM Frequency (Hz) | 463.67 ? | 240.62 ? | 927.13 ? | 240 ? | ||
| PWM Amplitude * (%) | 19 | 29 -53% | 25 -32% | |||
| Screen | -163% | -10% | -15% | -170% | -7% | |
| Brightness middle (cd/m²) | 282.4 | 403 43% | 393.8 39% | 446 58% | 267.6 -5% | 385 36% |
| Brightness (cd/m²) | 281 | 386 37% | 389 38% | 447 59% | 240 -15% | 382 36% |
| Brightness Distribution (%) | 98 | 89 -9% | 96 -2% | 99 1% | 84 -14% | 95 -3% |
| Black Level * (cd/m²) | 0.4 | 0.31 | 0.03 | |||
| Colorchecker dE 2000 * | 0.96 | 4.5 -369% | 1.27 -32% | 1.76 -83% | 4.67 -386% | 1.99 -107% |
| Colorchecker dE 2000 max. * | 2.83 | 18 -536% | 3.35 -18% | 3.29 -16% | 17.52 -519% | 3.69 -30% |
| Greyscale dE 2000 * | 1.1 | 2.7 -145% | 2 -82% | 2.3 -109% | 2 -82% | 0.8 27% |
| Gamma | 2.16 102% | 2.22 99% | 2.19 100% | 2.25 98% | 2.15 102% | 2.204 100% |
| CCT | 6373 102% | 6832 95% | 6379 102% | 6470 100% | 6585 99% | 6474 100% |
| Contrast (:1) | 1008 | 863 | 12833 | |||
| Colorchecker dE 2000 calibrated * | 4.1 | 0.71 | 1.18 | 2.49 | 1.79 | |
| Total Average (Program / Settings) | -372% /
-267% | 2% /
-0% | 5% /
-0% | -412% /
-292% | 8% /
2% |
* ... smaller is better
Display Response Times
| ↔ Response Time Black to White | ||
|---|---|---|
| 1.81 ms ... rise ↗ and fall ↘ combined | ↗ 0.87 ms rise | 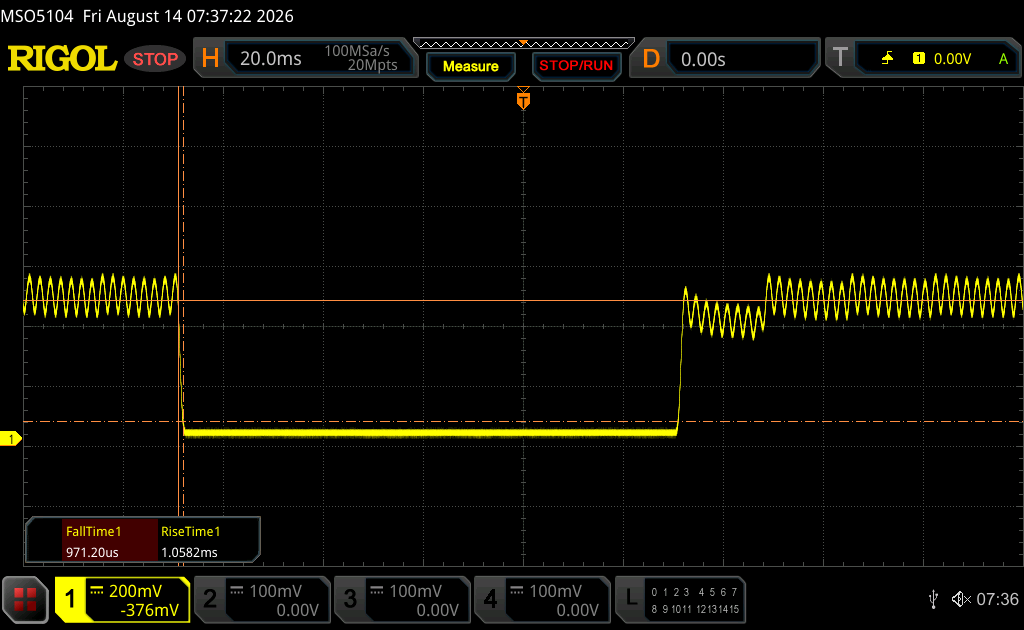 |
| ↘ 0.94 ms fall | ||
| The screen shows very fast response rates in our tests and should be very well suited for fast-paced gaming. In comparison, all tested devices range from 0.1 (minimum) to 240 (maximum) ms. » 11 % of all devices are better. This means that the measured response time is better than the average of all tested devices (19.7 ms). | ||
| ↔ Response Time 50% Grey to 80% Grey | ||
| 1.71 ms ... rise ↗ and fall ↘ combined | ↗ 0.88 ms rise | 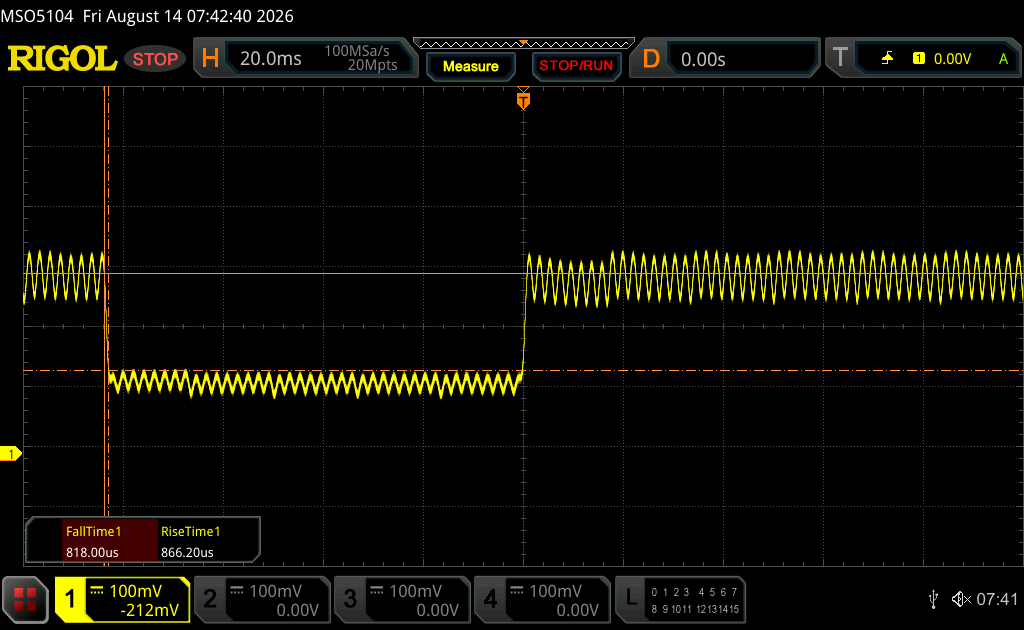 |
| ↘ 0.83 ms fall | ||
| The screen shows very fast response rates in our tests and should be very well suited for fast-paced gaming. In comparison, all tested devices range from 0.13 (minimum) to 636 (maximum) ms. » 9 % of all devices are better. This means that the measured response time is better than the average of all tested devices (30.7 ms). | ||
Screen Flickering / PWM (Pulse-Width Modulation)
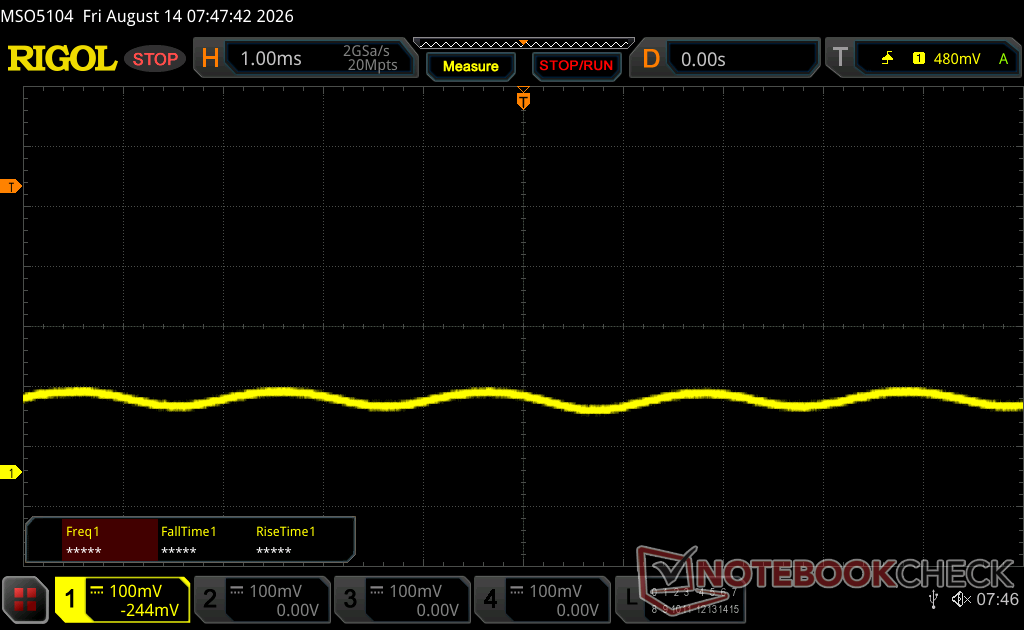
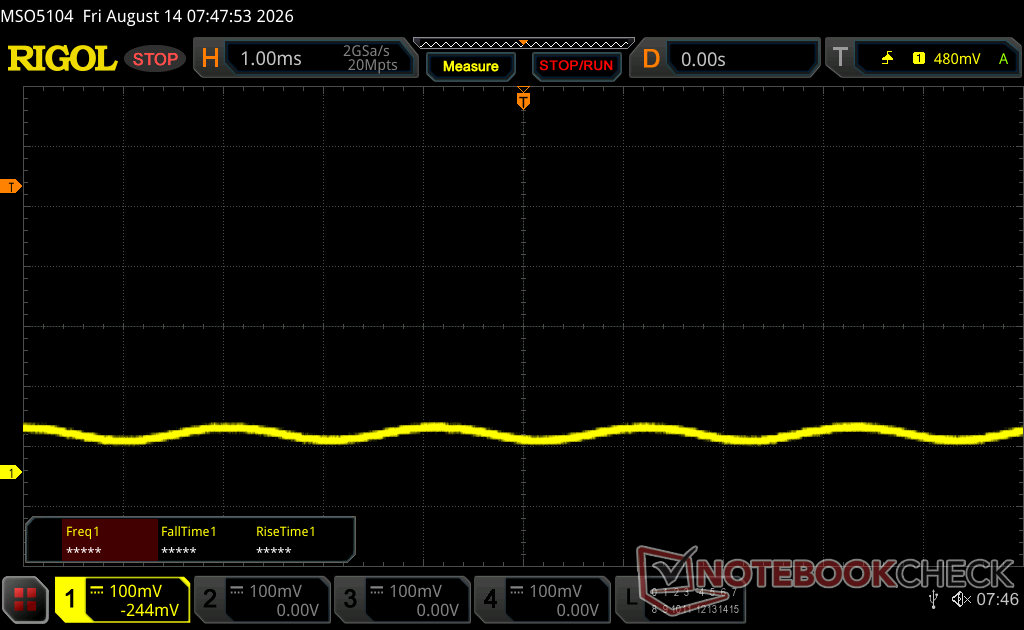
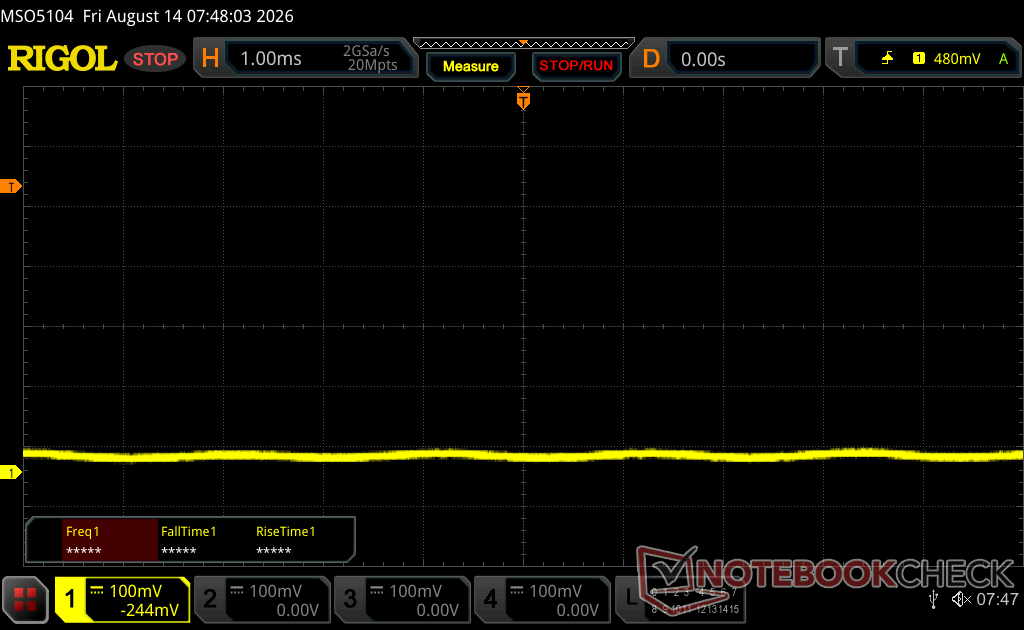
| Screen flickering / PWM detected | 463.67 Hz Amplitude: 19 % | ≤ 100 % brightness setting | 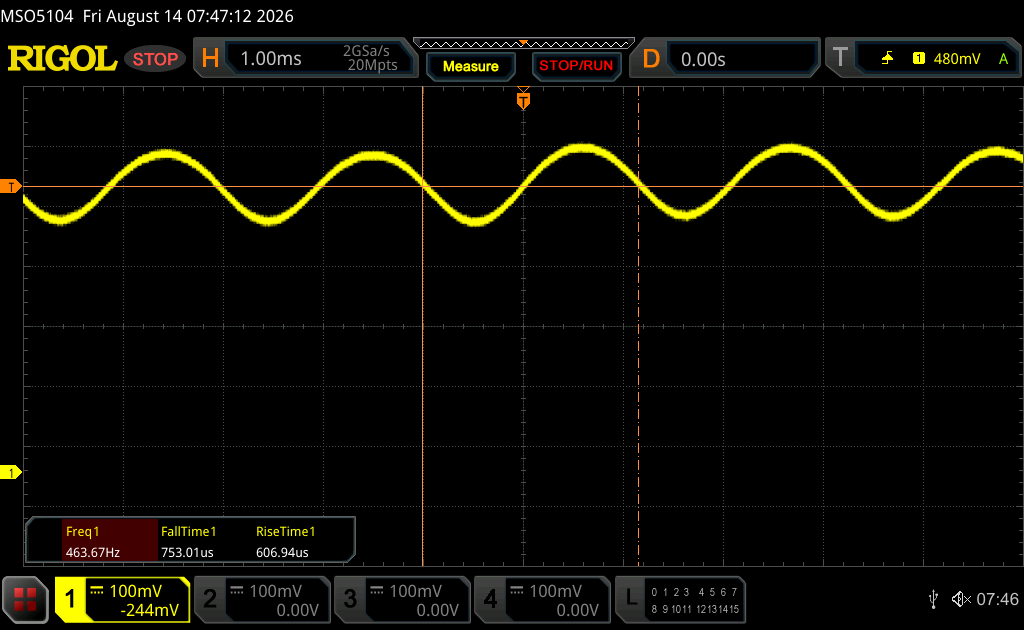 |
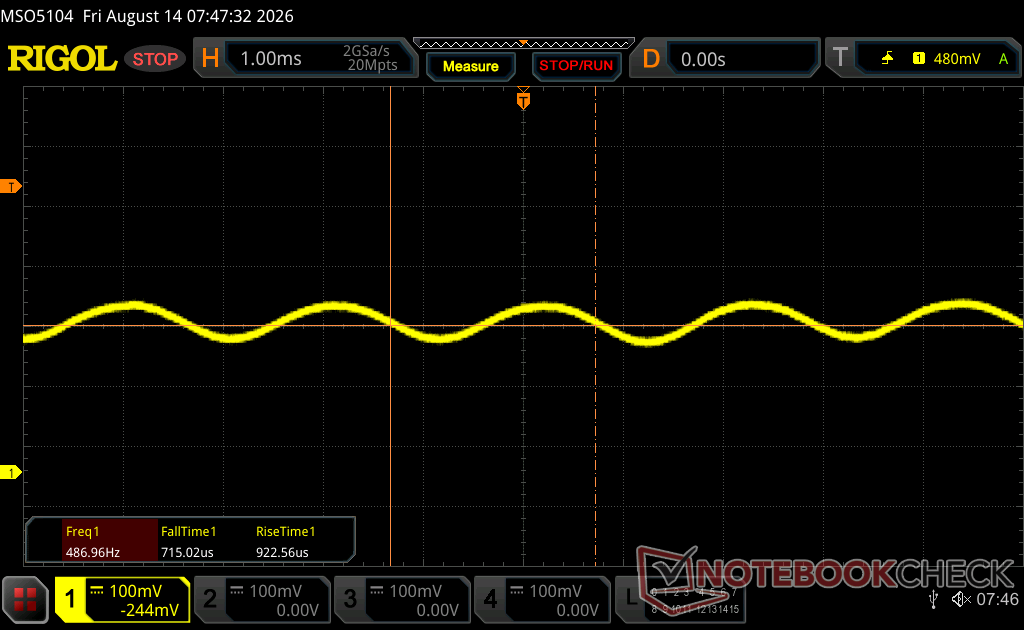
The display backlight flickers at 463.67 Hz (worst case, e.g., utilizing PWM) Flickering detected at a brightness setting of 100 % and below. There should be no flickering or PWM above this brightness setting. The frequency of 463.67 Hz is relatively high, so most users sensitive to PWM should not notice any flickering. However, there are reports that some users are still sensitive to PWM at 500 Hz and above, so be aware. In comparison: 52 % of all tested devices do not use PWM to dim the display. If PWM was detected, an average of 7622 (minimum: 5 - maximum: 343500) Hz was measured. | |||
Performance
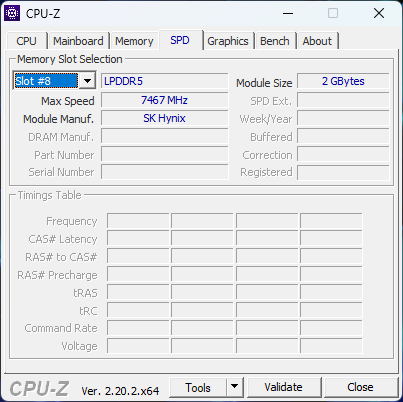
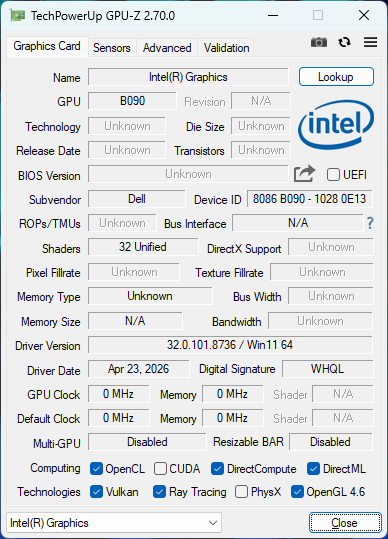
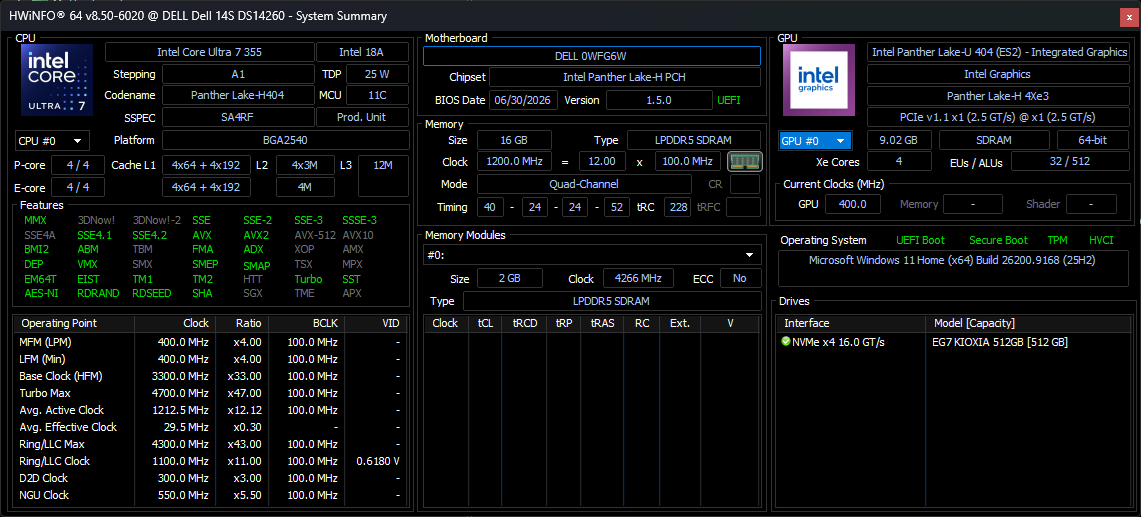
Testing Conditions
We set Windows to Performance mode prior to running the benchmarks below.
Processor Performance
Cinebench R15 Multi Loop
Cinebench R23: Multi Core | Single Core
Cinebench R20: CPU (Multi Core) | CPU (Single Core)
Cinebench R15: CPU Multi 64Bit | CPU Single 64Bit
Blender: v2.79 BMW27 CPU
7-Zip 18.03: 7z b 4 | 7z b 4 -mmt1
Geekbench 6.7: Multi-Core | Single-Core
Geekbench 5.5: Multi-Core | Single-Core
HWBOT x265 Benchmark v2.2: 4k Preset
LibreOffice : 20 Documents To PDF
R Benchmark 2.5: Overall mean
* ... smaller is better
AIDA64: FP32 Ray-Trace | FPU Julia | CPU SHA3 | CPU Queen | FPU SinJulia | FPU Mandel | CPU AES | CPU ZLib | FP64 Ray-Trace | CPU PhotoWorxx | CPU CheckMate
| Performance rating | |
| Asus VivoBook S 14 OLED M5406WA -1! | |
| Dell Inspiron 14 7445 2-in-1 -1! | |
| HP OmniBook Ultra 14 Core Ultra X9 -1! | |
| Dell XPS 14 Core Ultra X7 358H | |
| Dell 14S DS14260 -1! | |
| Average Intel Core Ultra 7 355 | |
| Lenovo ThinkBook 14 G9 IPL 21UX005PGE -1! | |
| AIDA64 / FP32 Ray-Trace | |
| Asus VivoBook S 14 OLED M5406WA (v6.92.6600) | |
| Dell Inspiron 14 7445 2-in-1 (v6.92.6600) | |
| HP OmniBook Ultra 14 Core Ultra X9 (v8.20.8100) | |
| Dell XPS 14 Core Ultra X7 358H (v8.20.8100) | |
| Average Intel Core Ultra 7 355 (12088 - 12838, n=5) | |
| Dell 14S DS14260 (v8.20.8100) | |
| Lenovo ThinkBook 14 G9 IPL 21UX005PGE (v8.20.8100) | |
| AIDA64 / FPU Julia | |
| Asus VivoBook S 14 OLED M5406WA (v6.92.6600) | |
| Dell Inspiron 14 7445 2-in-1 (v6.92.6600) | |
| HP OmniBook Ultra 14 Core Ultra X9 (v8.20.8100) | |
| Dell XPS 14 Core Ultra X7 358H (v8.20.8100) | |
| Average Intel Core Ultra 7 355 (60741 - 65963, n=5) | |
| Dell 14S DS14260 (v8.20.8100) | |
| Lenovo ThinkBook 14 G9 IPL 21UX005PGE (v8.20.8100) | |
| AIDA64 / CPU SHA3 | |
| Asus VivoBook S 14 OLED M5406WA (v6.92.6600) | |
| HP OmniBook Ultra 14 Core Ultra X9 (v8.20.8100) | |
| Dell XPS 14 Core Ultra X7 358H (v8.20.8100) | |
| Dell Inspiron 14 7445 2-in-1 (v6.92.6600) | |
| Average Intel Core Ultra 7 355 (2763 - 2845, n=5) | |
| Dell 14S DS14260 (v8.20.8100) | |
| Lenovo ThinkBook 14 G9 IPL 21UX005PGE (v8.20.8100) | |
| AIDA64 / CPU Queen | |
| Dell Inspiron 14 7445 2-in-1 (v6.92.6600) | |
| Asus VivoBook S 14 OLED M5406WA (v6.92.6600) | |
| Dell XPS 14 Core Ultra X7 358H (v6.92.6600) | |
| Average Intel Core Ultra 7 355 (n=1) | |
| AIDA64 / FPU SinJulia | |
| Asus VivoBook S 14 OLED M5406WA (v6.92.6600) | |
| Dell Inspiron 14 7445 2-in-1 (v6.92.6600) | |
| HP OmniBook Ultra 14 Core Ultra X9 (v8.20.8100) | |
| Dell XPS 14 Core Ultra X7 358H (v8.20.8100) | |
| Average Intel Core Ultra 7 355 (4585 - 4601, n=5) | |
| Dell 14S DS14260 (v8.20.8100) | |
| Lenovo ThinkBook 14 G9 IPL 21UX005PGE (v8.20.8100) | |
| AIDA64 / FPU Mandel | |
| Asus VivoBook S 14 OLED M5406WA (v6.92.6600) | |
| Dell Inspiron 14 7445 2-in-1 (v6.92.6600) | |
| HP OmniBook Ultra 14 Core Ultra X9 (v8.20.8100) | |
| Dell XPS 14 Core Ultra X7 358H (v8.20.8100) | |
| Average Intel Core Ultra 7 355 (32404 - 35293, n=5) | |
| Lenovo ThinkBook 14 G9 IPL 21UX005PGE (v8.20.8100) | |
| Dell 14S DS14260 (v8.20.8100) | |
| AIDA64 / CPU AES | |
| Asus VivoBook S 14 OLED M5406WA (v6.92.6600) | |
| Dell XPS 14 Core Ultra X7 358H (v8.20.8100) | |
| HP OmniBook Ultra 14 Core Ultra X9 (v8.20.8100) | |
| Dell Inspiron 14 7445 2-in-1 (v6.92.6600) | |
| Average Intel Core Ultra 7 355 (38981 - 39424, n=5) | |
| Dell 14S DS14260 (v8.20.8100) | |
| Lenovo ThinkBook 14 G9 IPL 21UX005PGE (v8.20.8100) | |
| AIDA64 / CPU ZLib | |
| Asus VivoBook S 14 OLED M5406WA (v6.92.6600) | |
| Dell XPS 14 Core Ultra X7 358H (v8.20.8100) | |
| HP OmniBook Ultra 14 Core Ultra X9 (v8.20.8100) | |
| Dell Inspiron 14 7445 2-in-1 (v6.92.6600) | |
| Average Intel Core Ultra 7 355 (635 - 646, n=5) | |
| Dell 14S DS14260 (v8.20.8100) | |
| Lenovo ThinkBook 14 G9 IPL 21UX005PGE (v8.20.8100) | |
| AIDA64 / FP64 Ray-Trace | |
| Asus VivoBook S 14 OLED M5406WA (v6.92.6600) | |
| Dell Inspiron 14 7445 2-in-1 (v6.92.6600) | |
| HP OmniBook Ultra 14 Core Ultra X9 (v8.20.8100) | |
| Dell XPS 14 Core Ultra X7 358H (v8.20.8100) | |
| Lenovo ThinkBook 14 G9 IPL 21UX005PGE (v8.20.8100) | |
| Average Intel Core Ultra 7 355 (6138 - 6833, n=5) | |
| Dell 14S DS14260 (v8.20.8100) | |
| AIDA64 / CPU PhotoWorxx | |
| Dell XPS 14 Core Ultra X7 358H (v8.20.8100) | |
| HP OmniBook Ultra 14 Core Ultra X9 (v8.20.8100) | |
| Average Intel Core Ultra 7 355 (57998 - 60440, n=5) | |
| Dell 14S DS14260 (v8.20.8100) | |
| Lenovo ThinkBook 14 G9 IPL 21UX005PGE (v8.20.8100) | |
| Asus VivoBook S 14 OLED M5406WA (v6.92.6600) | |
| Dell Inspiron 14 7445 2-in-1 (v6.92.6600) | |
| AIDA64 / CPU CheckMate | |
| Dell XPS 14 Core Ultra X7 358H (v8.20.8100) | |
| HP OmniBook Ultra 14 Core Ultra X9 (v8.20.8100) | |
| Average Intel Core Ultra 7 355 (2747 - 2813, n=5) | |
| Dell 14S DS14260 (v8.20.8100) | |
| Lenovo ThinkBook 14 G9 IPL 21UX005PGE (v8.20.8100) | |
System Performance
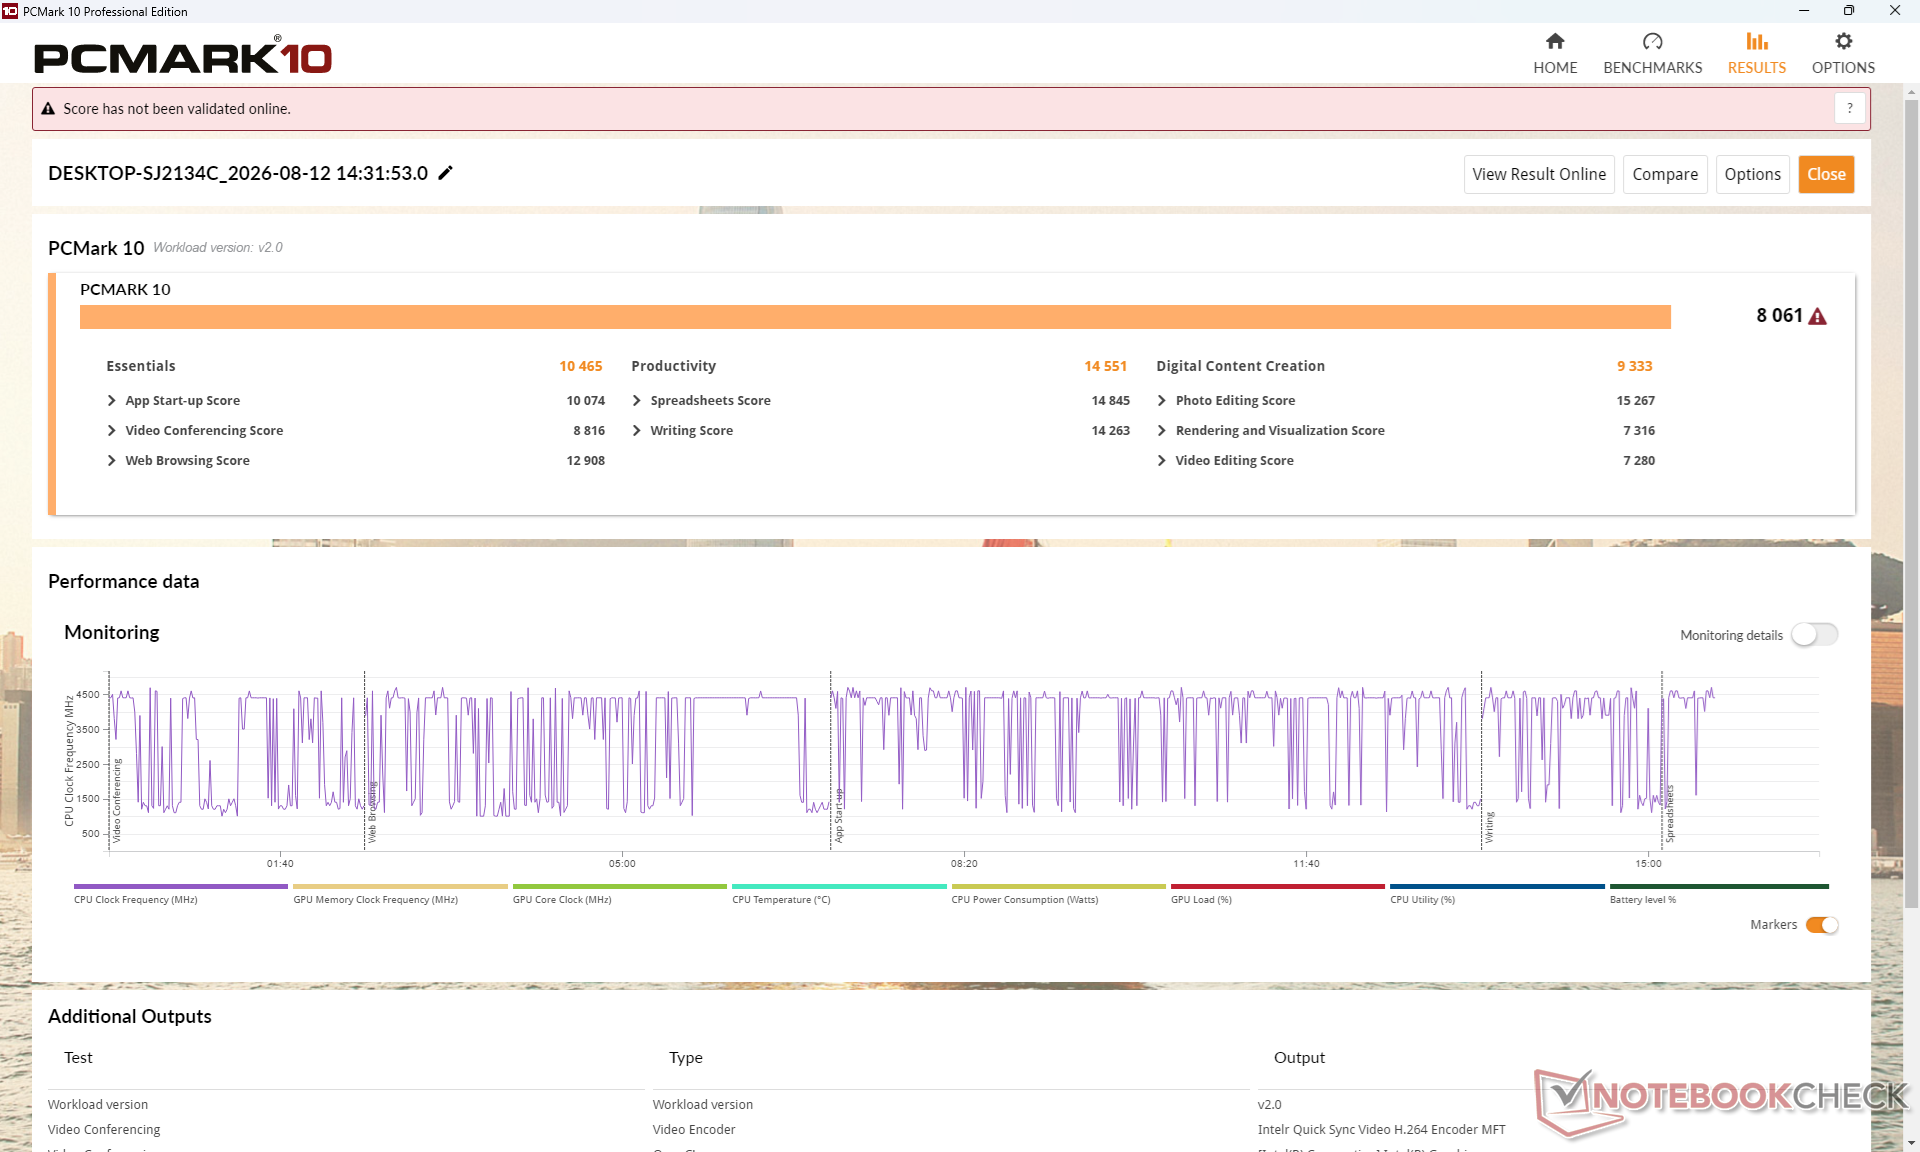
PCMark 10: Score | Essentials | Productivity | Digital Content Creation
CrossMark: Overall | Productivity | Creativity | Responsiveness
WebXPRT 3: Overall
WebXPRT 4: Overall
Mozilla Kraken 1.1: Total
| Performance rating | |
| HP OmniBook Ultra 14 Core Ultra X9 | |
| Dell XPS 14 Core Ultra X7 358H | |
| Dell 14S DS14260 | |
| Average Intel Core Ultra 7 355, Intel Graphics 4 Xe3 Panther Lake iGPU | |
| Dell Inspiron 14 7445 2-in-1 | |
| Lenovo ThinkBook 14 G9 IPL 21UX005PGE -4! | |
| Asus VivoBook S 14 OLED M5406WA -5! | |
| PCMark 10 / Score | |
| HP OmniBook Ultra 14 Core Ultra X9 | |
| Dell XPS 14 Core Ultra X7 358H | |
| Average Intel Core Ultra 7 355, Intel Graphics 4 Xe3 Panther Lake iGPU (7884 - 8201, n=5) | |
| Dell 14S DS14260 | |
| Lenovo ThinkBook 14 G9 IPL 21UX005PGE | |
| Asus VivoBook S 14 OLED M5406WA | |
| Dell Inspiron 14 7445 2-in-1 | |
| PCMark 10 / Essentials | |
| HP OmniBook Ultra 14 Core Ultra X9 | |
| Dell XPS 14 Core Ultra X7 358H | |
| Dell Inspiron 14 7445 2-in-1 | |
| Asus VivoBook S 14 OLED M5406WA | |
| Average Intel Core Ultra 7 355, Intel Graphics 4 Xe3 Panther Lake iGPU (10356 - 10820, n=5) | |
| Dell 14S DS14260 | |
| Lenovo ThinkBook 14 G9 IPL 21UX005PGE | |
| PCMark 10 / Productivity | |
| Dell XPS 14 Core Ultra X7 358H | |
| HP OmniBook Ultra 14 Core Ultra X9 | |
| Dell 14S DS14260 | |
| Average Intel Core Ultra 7 355, Intel Graphics 4 Xe3 Panther Lake iGPU (13871 - 14955, n=5) | |
| Lenovo ThinkBook 14 G9 IPL 21UX005PGE | |
| Asus VivoBook S 14 OLED M5406WA | |
| Dell Inspiron 14 7445 2-in-1 | |
| PCMark 10 / Digital Content Creation | |
| Dell XPS 14 Core Ultra X7 358H | |
| HP OmniBook Ultra 14 Core Ultra X9 | |
| Asus VivoBook S 14 OLED M5406WA | |
| Dell 14S DS14260 | |
| Average Intel Core Ultra 7 355, Intel Graphics 4 Xe3 Panther Lake iGPU (9258 - 9368, n=5) | |
| Lenovo ThinkBook 14 G9 IPL 21UX005PGE | |
| Dell Inspiron 14 7445 2-in-1 | |
| CrossMark / Overall | |
| HP OmniBook Ultra 14 Core Ultra X9 | |
| Dell XPS 14 Core Ultra X7 358H | |
| Dell 14S DS14260 | |
| Average Intel Core Ultra 7 355, Intel Graphics 4 Xe3 Panther Lake iGPU (1627 - 1892, n=5) | |
| Dell Inspiron 14 7445 2-in-1 | |
| CrossMark / Productivity | |
| HP OmniBook Ultra 14 Core Ultra X9 | |
| Dell 14S DS14260 | |
| Average Intel Core Ultra 7 355, Intel Graphics 4 Xe3 Panther Lake iGPU (1561 - 1826, n=5) | |
| Dell XPS 14 Core Ultra X7 358H | |
| Dell Inspiron 14 7445 2-in-1 | |
| CrossMark / Creativity | |
| Dell XPS 14 Core Ultra X7 358H | |
| HP OmniBook Ultra 14 Core Ultra X9 | |
| Dell 14S DS14260 | |
| Average Intel Core Ultra 7 355, Intel Graphics 4 Xe3 Panther Lake iGPU (1761 - 2052, n=5) | |
| Dell Inspiron 14 7445 2-in-1 | |
| CrossMark / Responsiveness | |
| HP OmniBook Ultra 14 Core Ultra X9 | |
| Dell 14S DS14260 | |
| Dell XPS 14 Core Ultra X7 358H | |
| Average Intel Core Ultra 7 355, Intel Graphics 4 Xe3 Panther Lake iGPU (1458 - 1671, n=5) | |
| Dell Inspiron 14 7445 2-in-1 | |
| WebXPRT 3 / Overall | |
| HP OmniBook Ultra 14 Core Ultra X9 | |
| Dell XPS 14 Core Ultra X7 358H | |
| Lenovo ThinkBook 14 G9 IPL 21UX005PGE | |
| Dell Inspiron 14 7445 2-in-1 | |
| Average Intel Core Ultra 7 355, Intel Graphics 4 Xe3 Panther Lake iGPU (300 - 303, n=5) | |
| Dell 14S DS14260 | |
| WebXPRT 4 / Overall | |
| HP OmniBook Ultra 14 Core Ultra X9 | |
| Dell XPS 14 Core Ultra X7 358H | |
| Dell 14S DS14260 | |
| Average Intel Core Ultra 7 355, Intel Graphics 4 Xe3 Panther Lake iGPU (279 - 284, n=5) | |
| Lenovo ThinkBook 14 G9 IPL 21UX005PGE | |
| Asus VivoBook S 14 OLED M5406WA | |
| Dell Inspiron 14 7445 2-in-1 | |
| Mozilla Kraken 1.1 / Total | |
| Dell Inspiron 14 7445 2-in-1 | |
| Lenovo ThinkBook 14 G9 IPL 21UX005PGE | |
| Average Intel Core Ultra 7 355, Intel Graphics 4 Xe3 Panther Lake iGPU (470 - 487, n=5) | |
| Dell 14S DS14260 | |
| Dell XPS 14 Core Ultra X7 358H | |
| Asus VivoBook S 14 OLED M5406WA | |
| Asus VivoBook S 14 OLED M5406WA | |
| HP OmniBook Ultra 14 Core Ultra X9 | |
* ... smaller is better
| PCMark 10 Score | 8061 points | |
Help | ||
| AIDA64 / Memory Copy | |
| Dell XPS 14 Core Ultra X7 358H | |
| HP OmniBook Ultra 14 Core Ultra X9 | |
| Average Intel Core Ultra 7 355 (97301 - 105135, n=5) | |
| Dell 14S DS14260 | |
| Asus VivoBook S 14 OLED M5406WA | |
| Lenovo ThinkBook 14 G9 IPL 21UX005PGE | |
| Dell Inspiron 14 7445 2-in-1 | |
| AIDA64 / Memory Read | |
| HP OmniBook Ultra 14 Core Ultra X9 | |
| Dell XPS 14 Core Ultra X7 358H | |
| Asus VivoBook S 14 OLED M5406WA | |
| Dell 14S DS14260 | |
| Average Intel Core Ultra 7 355 (79551 - 85807, n=5) | |
| Lenovo ThinkBook 14 G9 IPL 21UX005PGE | |
| Dell Inspiron 14 7445 2-in-1 | |
| AIDA64 / Memory Write | |
| HP OmniBook Ultra 14 Core Ultra X9 | |
| Dell XPS 14 Core Ultra X7 358H | |
| Dell 14S DS14260 | |
| Average Intel Core Ultra 7 355 (103056 - 108621, n=5) | |
| Asus VivoBook S 14 OLED M5406WA | |
| Dell Inspiron 14 7445 2-in-1 | |
| Lenovo ThinkBook 14 G9 IPL 21UX005PGE | |
| AIDA64 / Memory Latency | |
| Asus VivoBook S 14 OLED M5406WA | |
| Lenovo ThinkBook 14 G9 IPL 21UX005PGE | |
| Average Intel Core Ultra 7 355 (99.7 - 105.8, n=5) | |
| Dell 14S DS14260 | |
| Dell Inspiron 14 7445 2-in-1 | |
| Dell XPS 14 Core Ultra X7 358H | |
| HP OmniBook Ultra 14 Core Ultra X9 | |
* ... smaller is better
DPC Latency
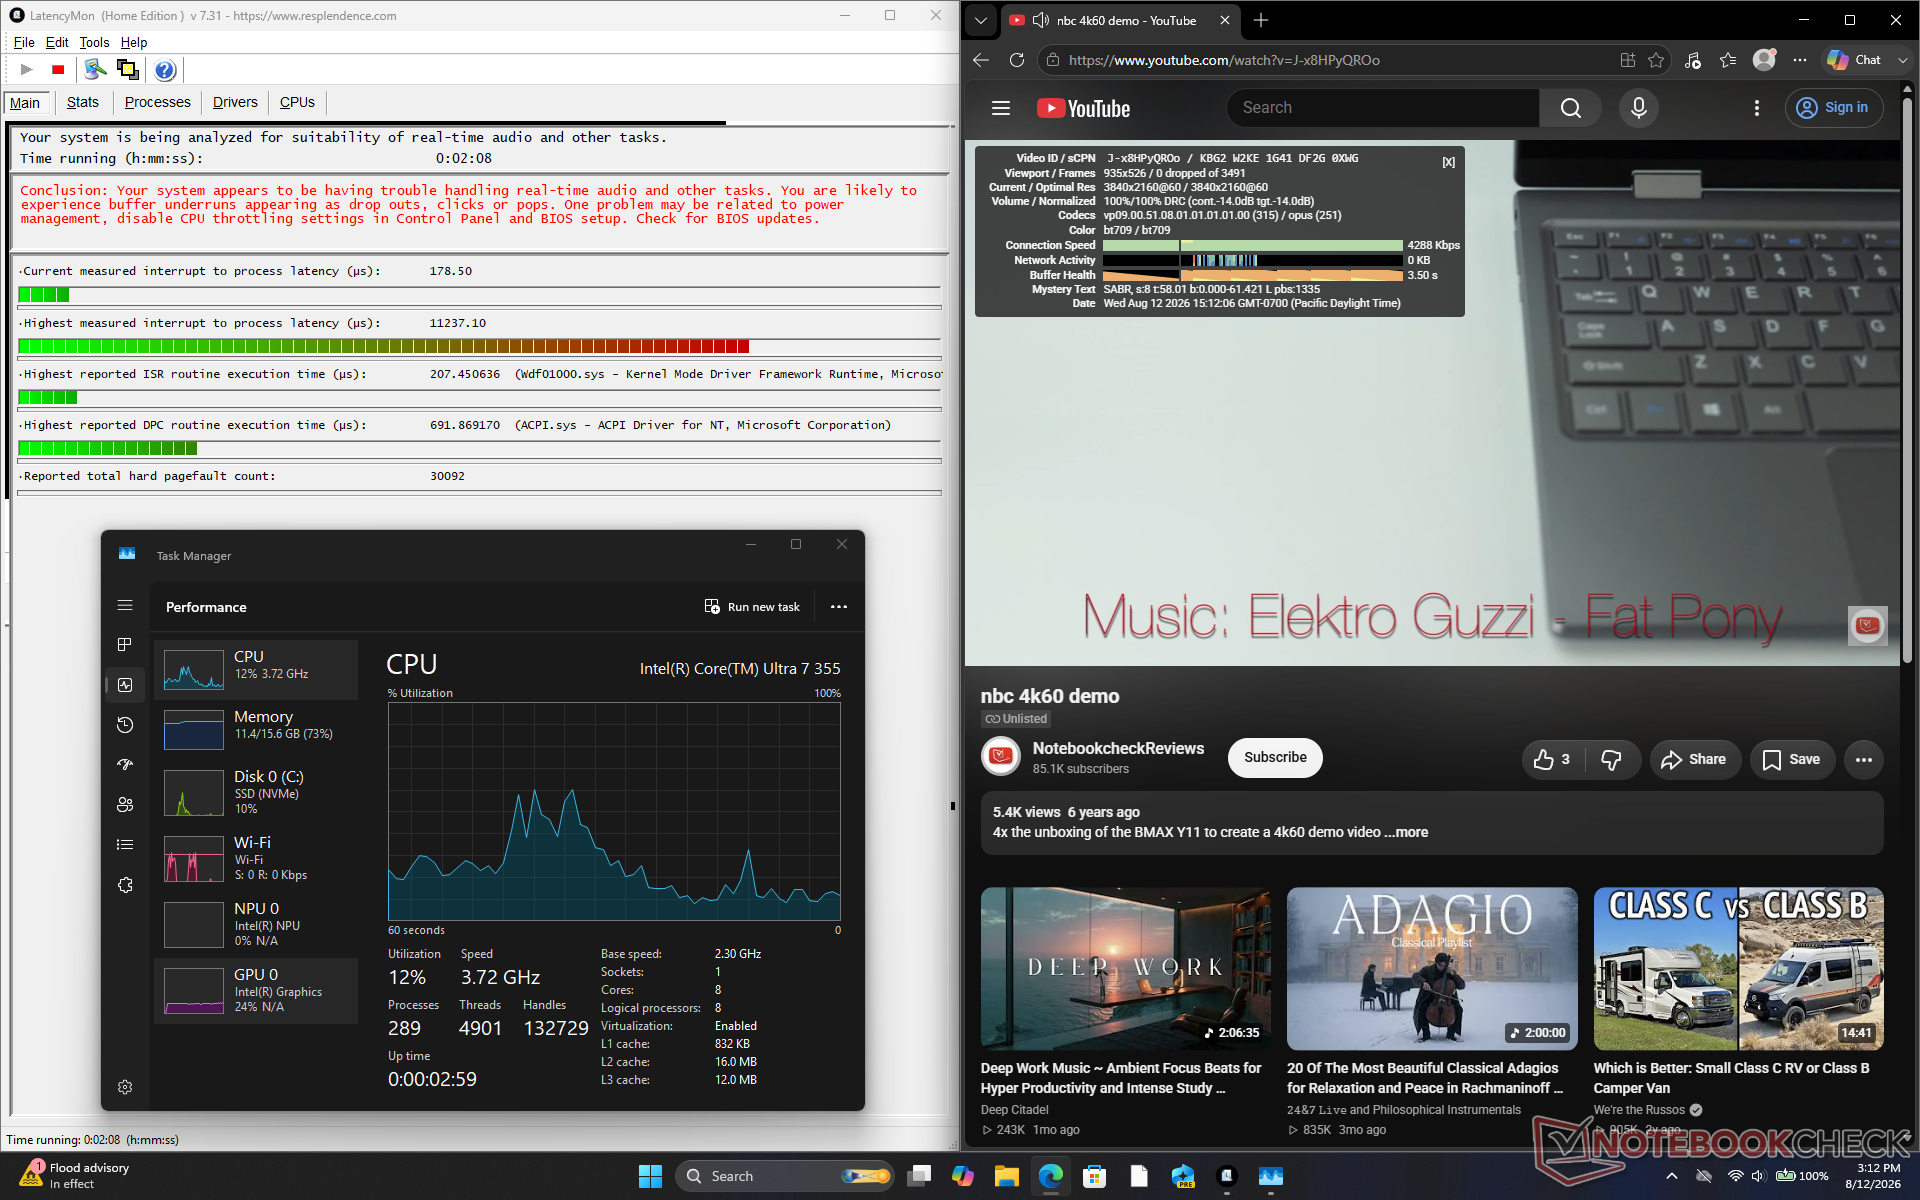
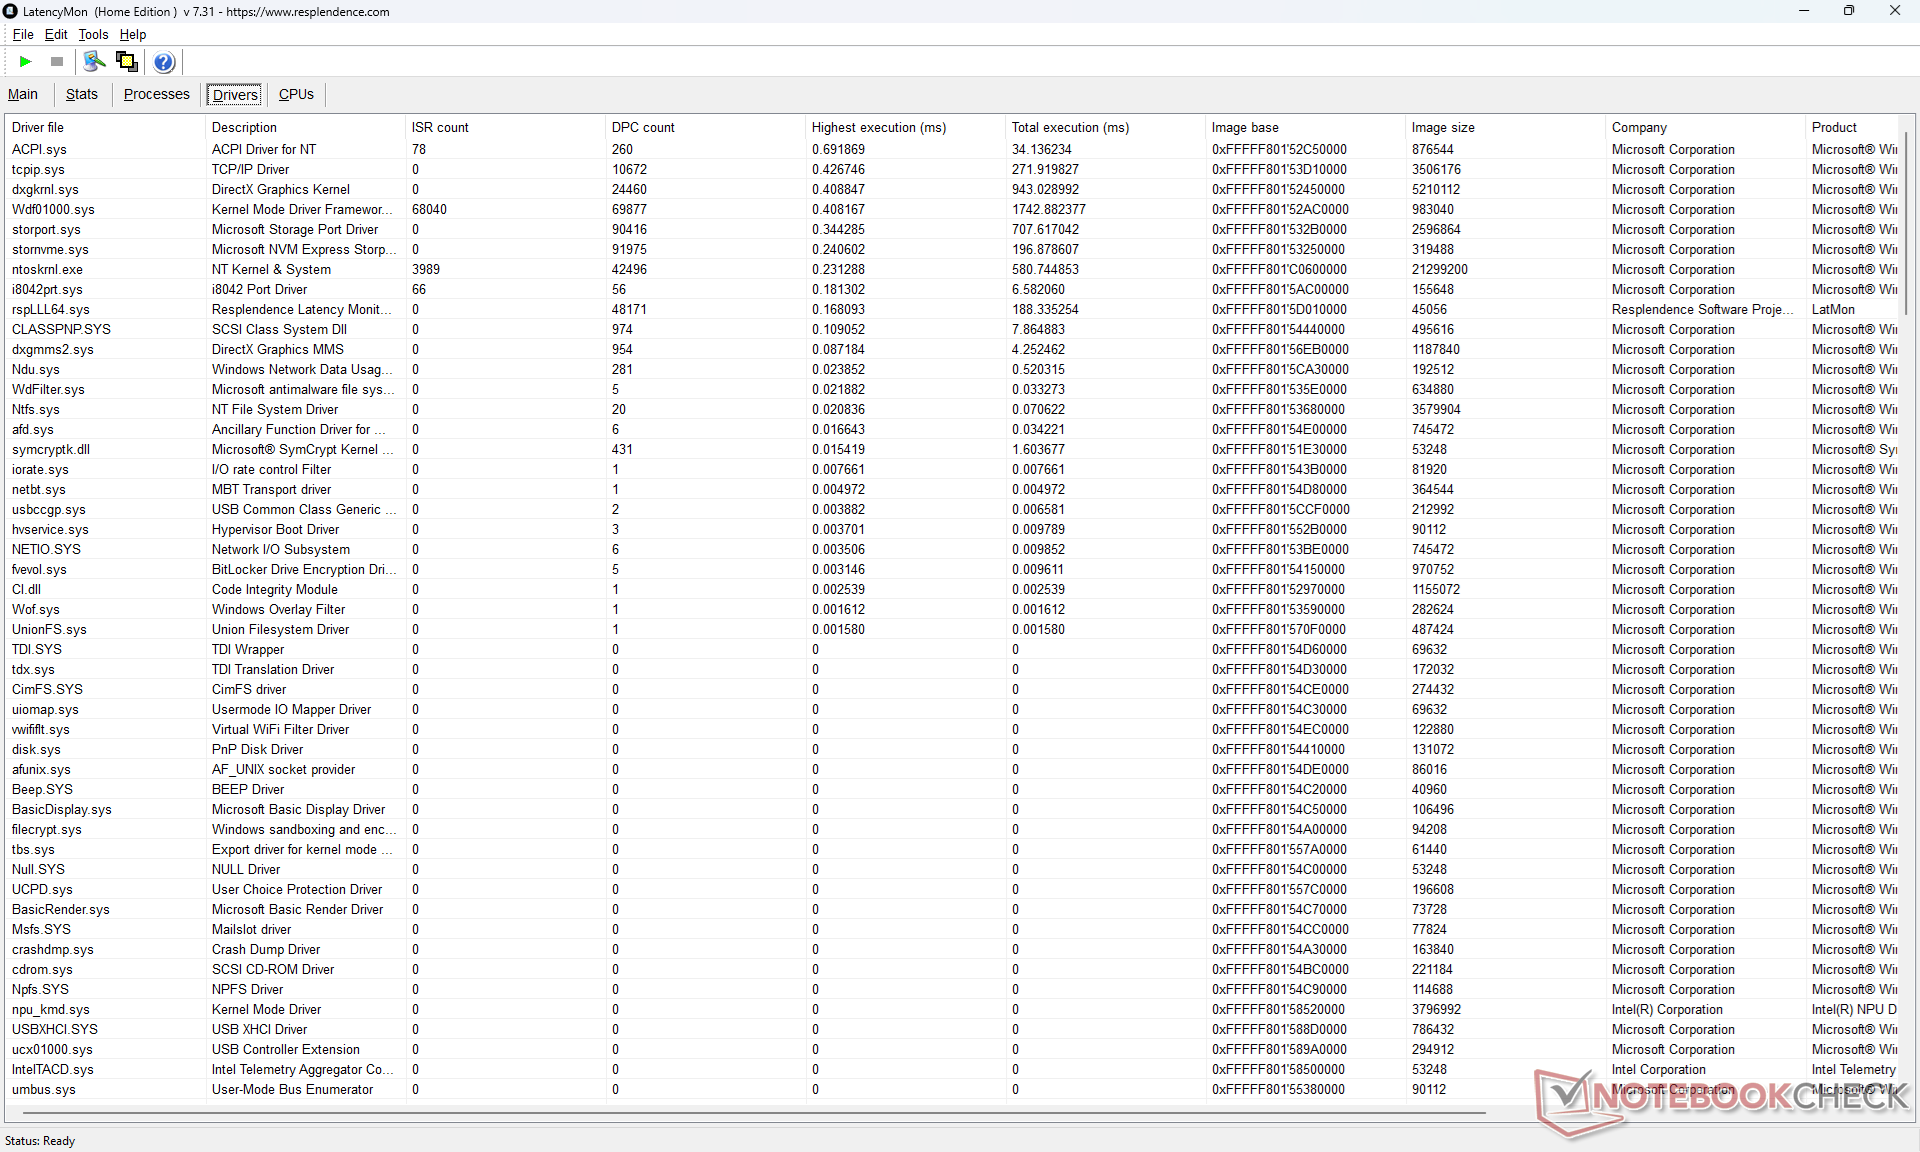
| DPC Latencies / LatencyMon - interrupt to process latency (max), Web, Youtube, Prime95 | |
| Dell 14S DS14260 | |
| HP OmniBook Ultra 14 Core Ultra X9 | |
| Dell XPS 14 Core Ultra X7 358H | |
| Dell Inspiron 14 7445 2-in-1 | |
| Asus VivoBook S 14 OLED M5406WA | |
| Lenovo ThinkBook 14 G9 IPL 21UX005PGE | |
* ... smaller is better
Storage Devices
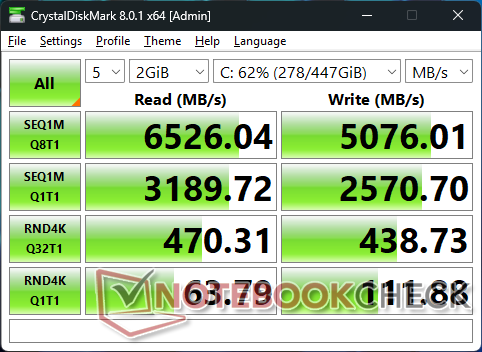
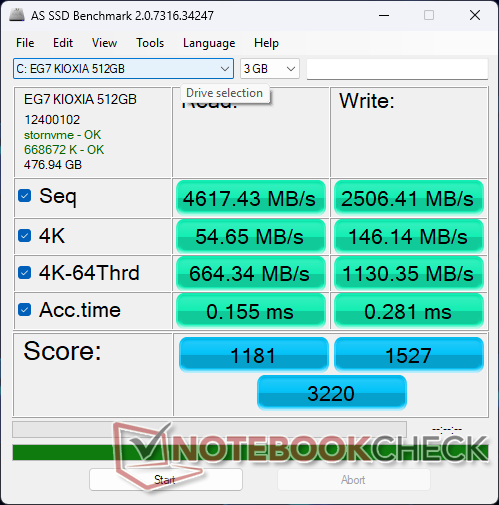

* ... smaller is better
Disk Throttling: DiskSpd Read Loop, Queue Depth 8
GPU Performance
| Power Profile | Fire Strike Graphics Score | Physics Score | Combined Score |
| Performance Mode | 7123 | 21682 | 2182 |
| Battery Power | 6996 (-2%) | 17440 (-20%) | 2156 |
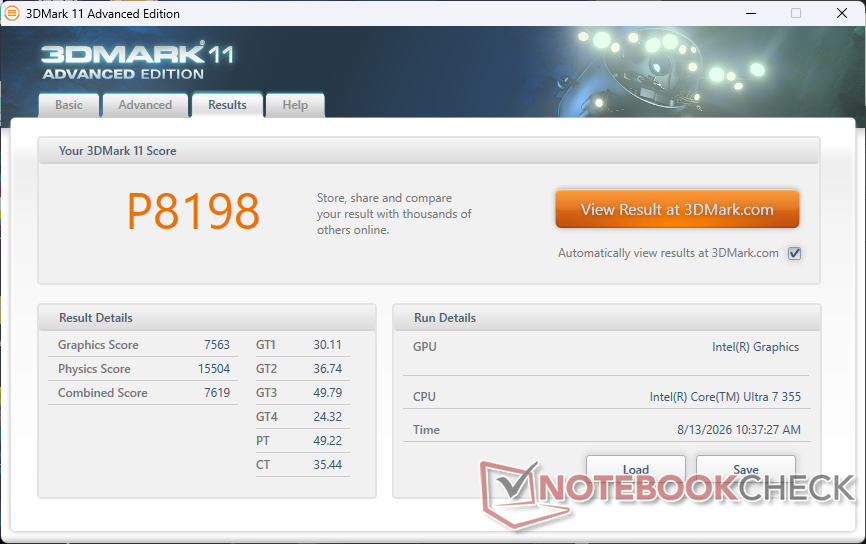
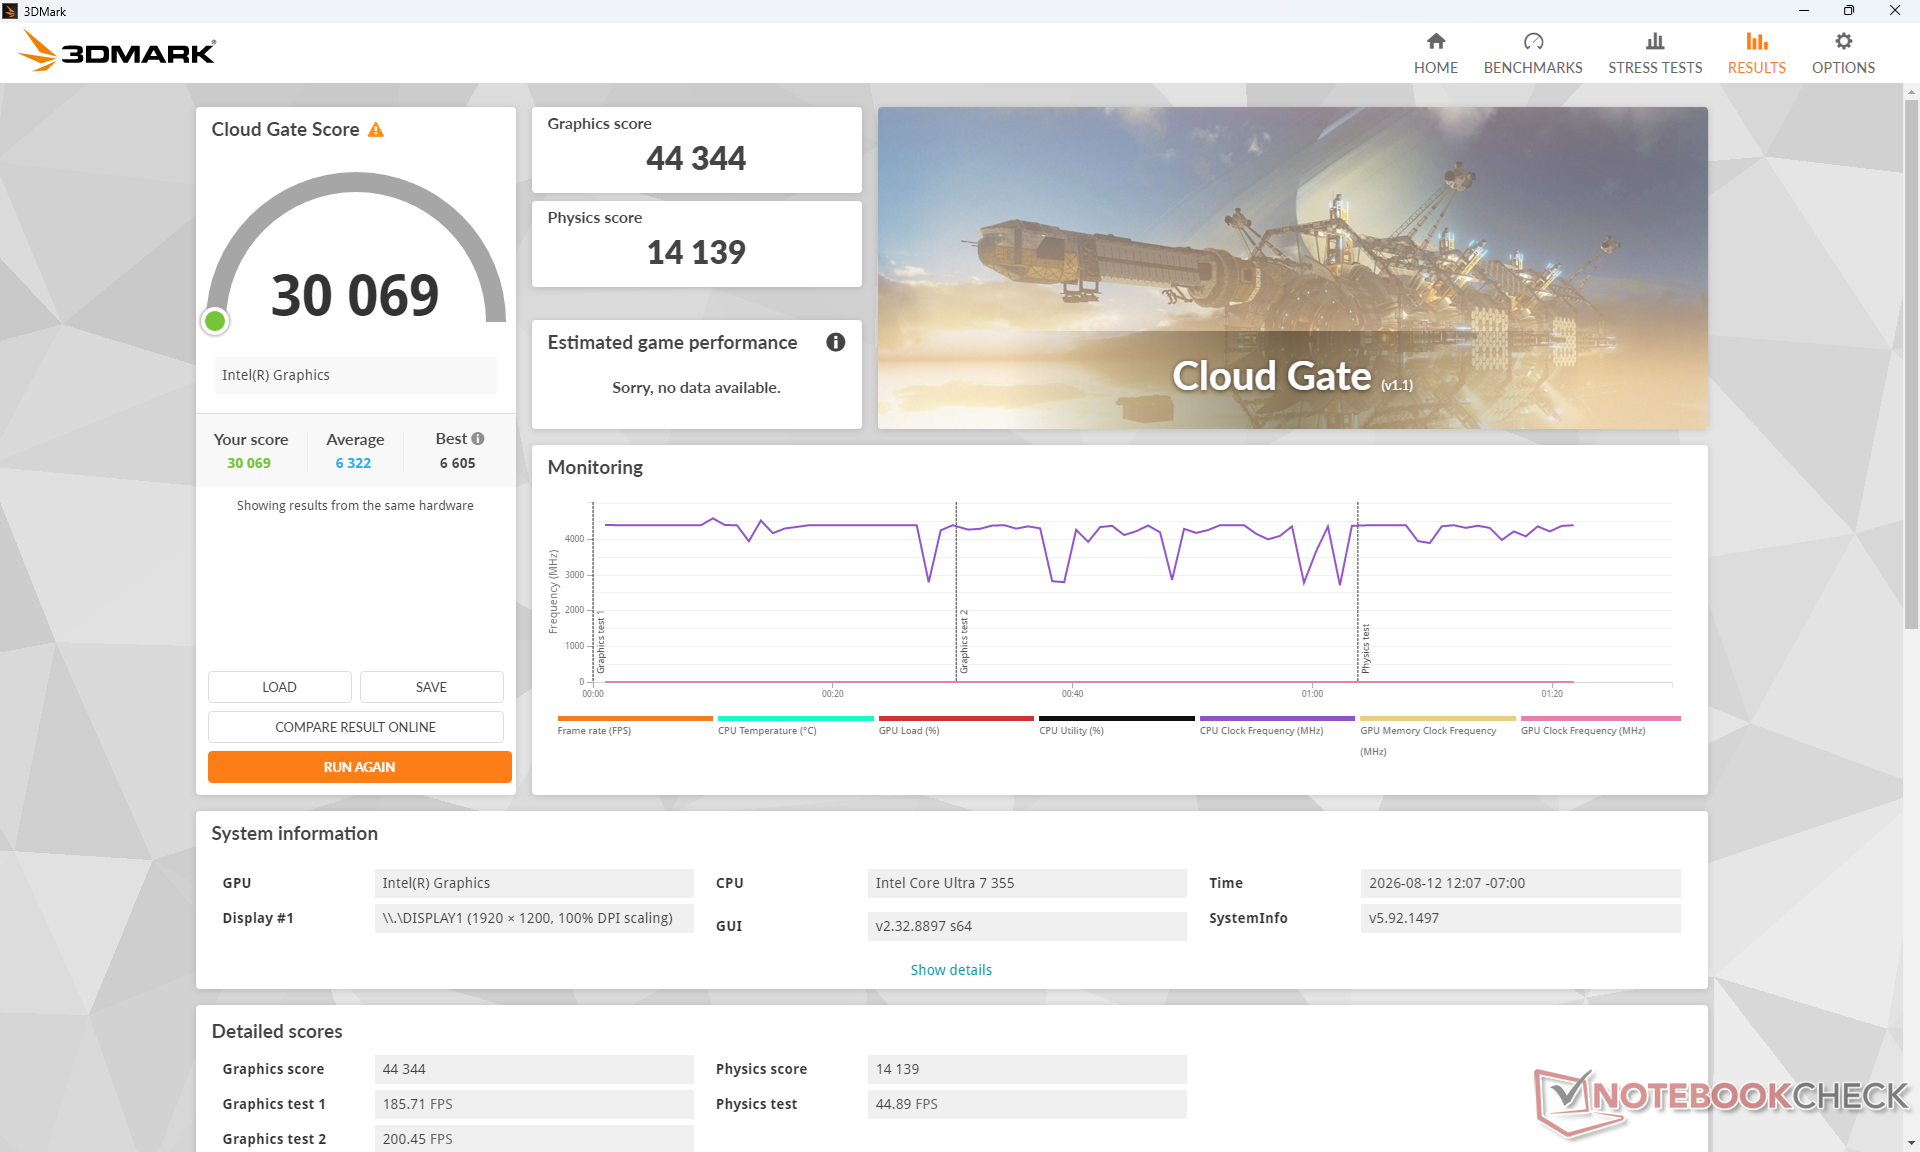
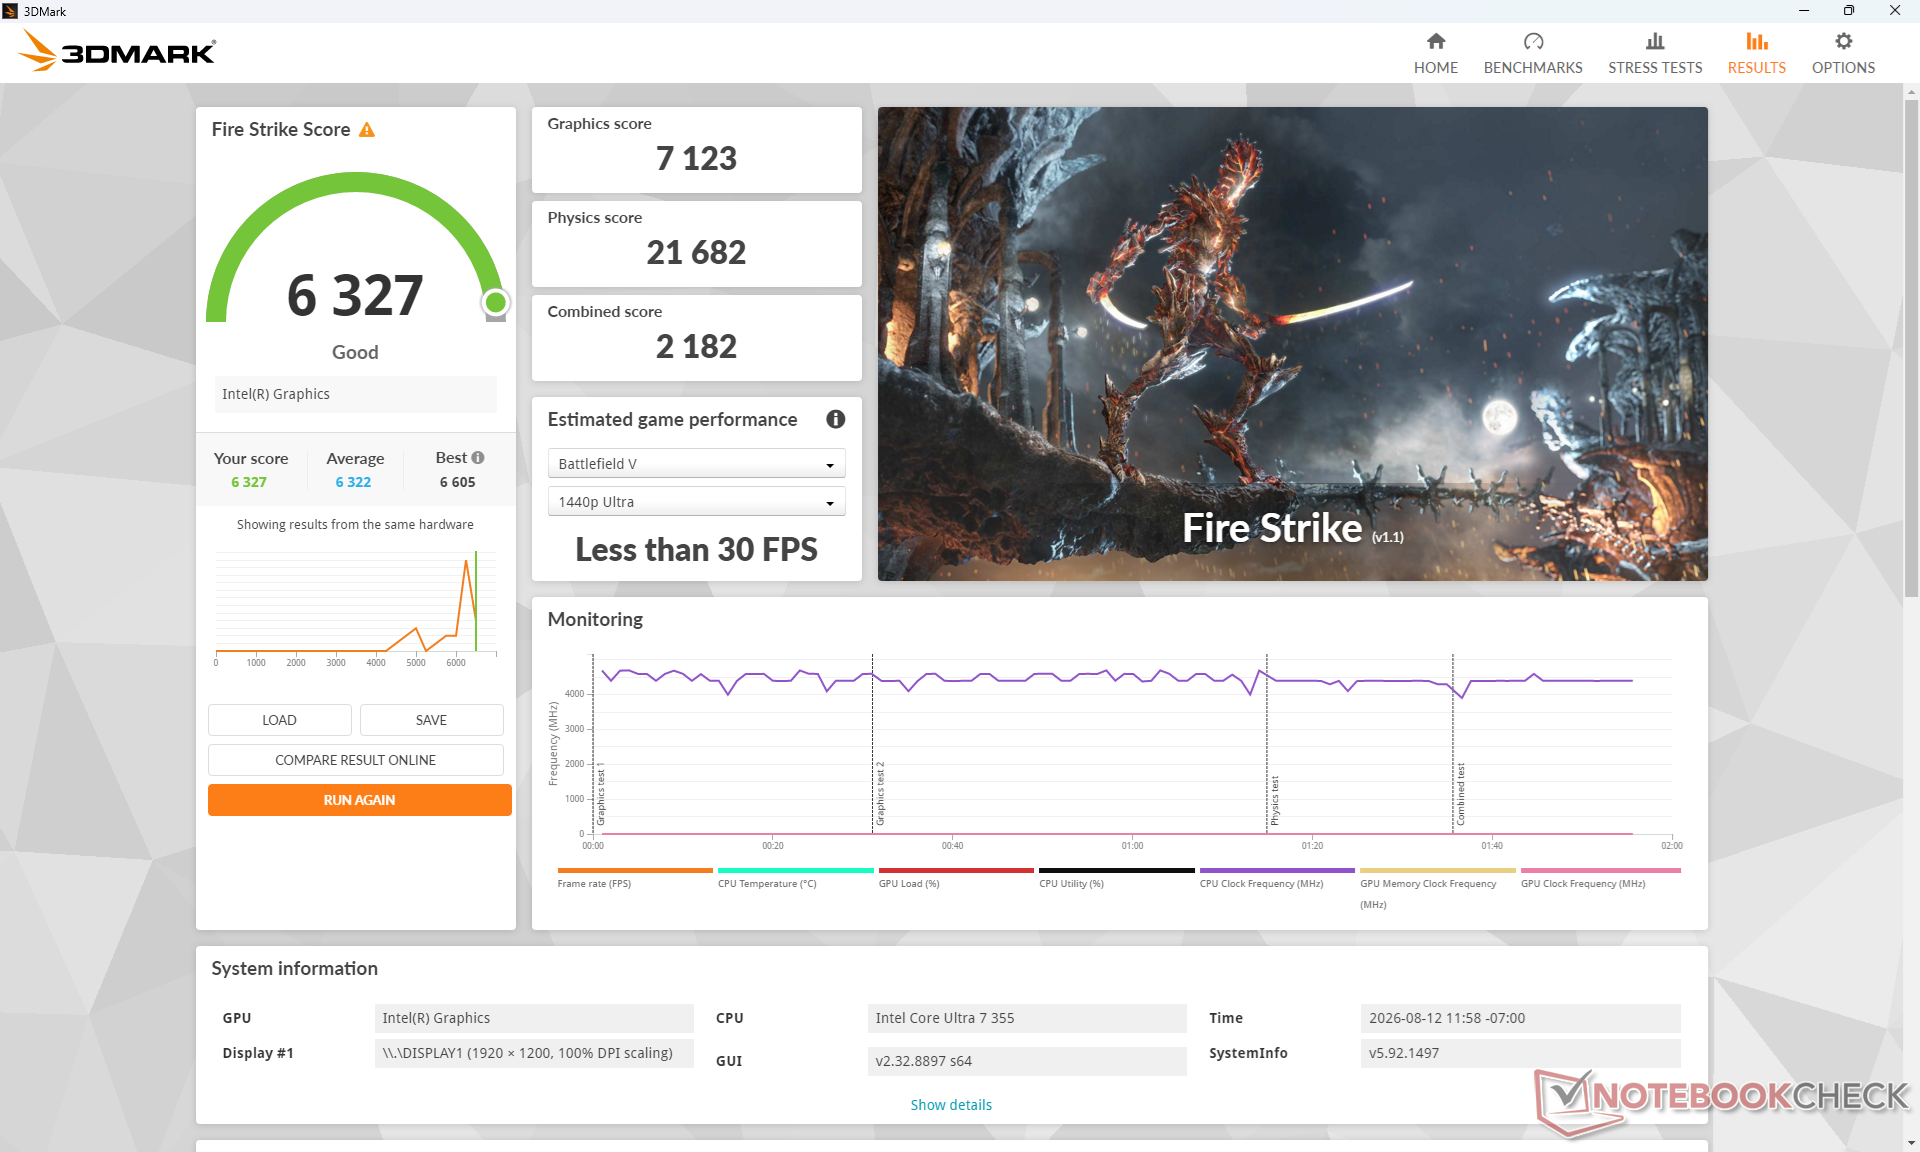
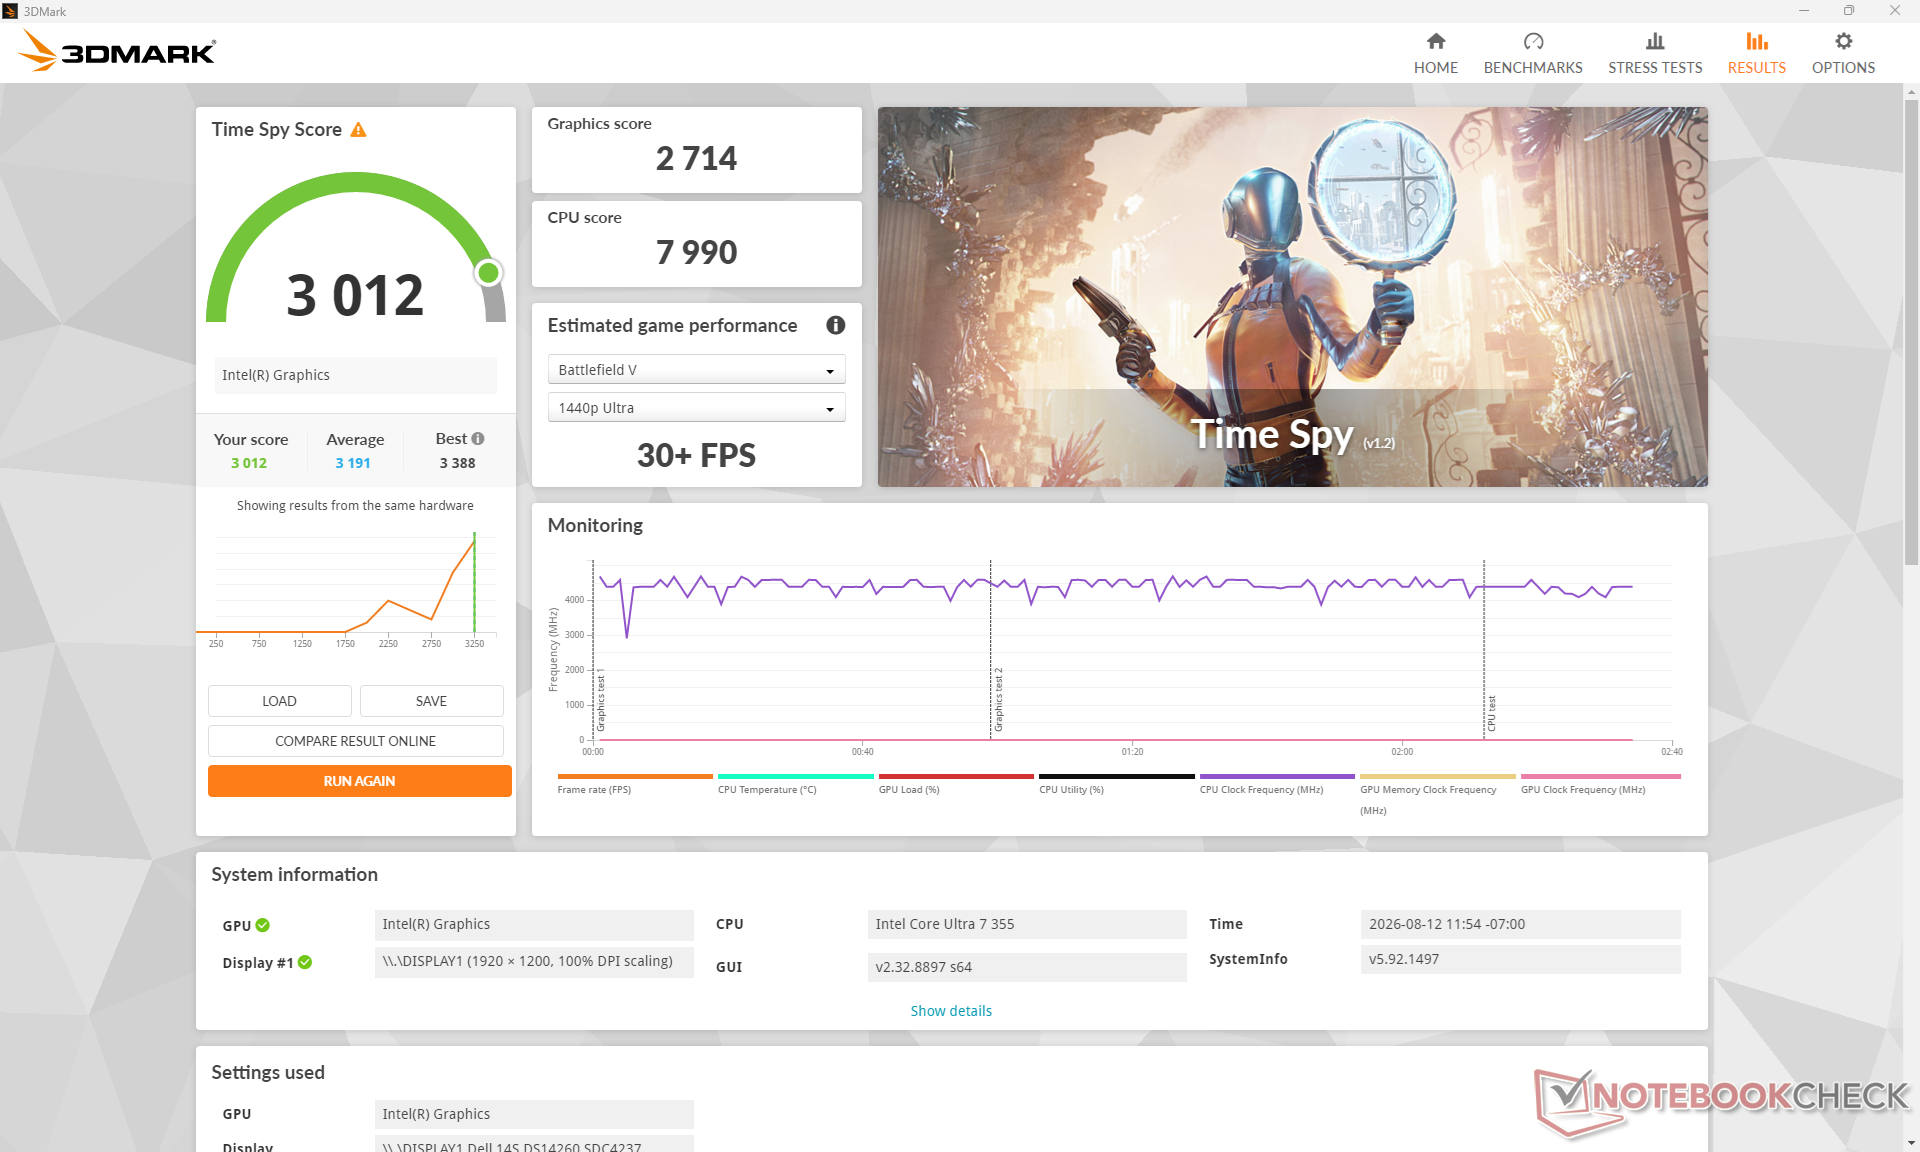
| 3DMark 11 Performance | 8198 points | |
| 3DMark Cloud Gate Standard Score | 30069 points | |
| 3DMark Fire Strike Score | 6327 points | |
| 3DMark Time Spy Score | 3012 points | |
Help | ||
* ... smaller is better
| Cyberpunk 2077 - 1920x1080 Ultra Preset (FSR off) | |
| HP OmniBook Ultra 14 Core Ultra X9 | |
| Dell XPS 14 Core Ultra X7 358H | |
| Asus VivoBook S 14 OLED M5406WA | |
| Lenovo ThinkBook 14 G9 IPL 21UX005PGE | |
| Dell Inspiron 14 7445 2-in-1 | |
| Dell 14S DS14260 | |
| Baldur's Gate 3 - 1920x1080 Ultra Preset AA:T | |
| HP OmniBook Ultra 14 Core Ultra X9 | |
| Dell XPS 14 Core Ultra X7 358H | |
| Asus VivoBook S 14 OLED M5406WA | |
| Lenovo ThinkBook 14 G9 IPL 21UX005PGE | |
| Dell Inspiron 14 7445 2-in-1 | |
| Dell 14S DS14260 | |
| GTA V - 1920x1080 Highest AA:4xMSAA + FX AF:16x | |
| HP OmniBook Ultra 14 Core Ultra X9 | |
| Dell XPS 14 Core Ultra X7 358H | |
| Asus VivoBook S 14 OLED M5406WA | |
| Dell 14S DS14260 | |
| Lenovo ThinkBook 14 G9 IPL 21UX005PGE | |
| Final Fantasy XV Benchmark - 1920x1080 High Quality | |
| HP OmniBook Ultra 14 Core Ultra X9 | |
| Dell XPS 14 Core Ultra X7 358H | |
| Asus VivoBook S 14 OLED M5406WA | |
| Dell 14S DS14260 | |
| Dell Inspiron 14 7445 2-in-1 | |
| Lenovo ThinkBook 14 G9 IPL 21UX005PGE | |
| Strange Brigade - 1920x1080 ultra AA:ultra AF:16 | |
| HP OmniBook Ultra 14 Core Ultra X9 | |
| Dell XPS 14 Core Ultra X7 358H | |
| Asus VivoBook S 14 OLED M5406WA | |
| Dell 14S DS14260 | |
| Dell Inspiron 14 7445 2-in-1 | |
| Dota 2 Reborn - 1920x1080 ultra (3/3) best looking | |
| Dell XPS 14 Core Ultra X7 358H | |
| HP OmniBook Ultra 14 Core Ultra X9 | |
| Dell 14S DS14260 | |
| Lenovo ThinkBook 14 G9 IPL 21UX005PGE | |
| Dell Inspiron 14 7445 2-in-1 | |
| Asus VivoBook S 14 OLED M5406WA | |
| X-Plane 11.11 - 1920x1080 high (fps_test=3) | |
| Asus VivoBook S 14 OLED M5406WA | |
| HP OmniBook Ultra 14 Core Ultra X9 | |
| Dell XPS 14 Core Ultra X7 358H | |
| Dell Inspiron 14 7445 2-in-1 | |
| Dell 14S DS14260 | |
| Lenovo ThinkBook 14 G9 IPL 21UX005PGE | |
Cyberpunk 2077 ultra FPS Chart
| low | med. | high | ultra | |
|---|---|---|---|---|
| GTA V (2015) | 167.7 | 156.4 | 50.6 | 21 |
| Dota 2 Reborn (2015) | 107.1 | 96.1 | 81.9 | 90.7 |
| Final Fantasy XV Benchmark (2018) | 66.9 | 36.2 | 26 | |
| X-Plane 11.11 (2018) | 34.8 | 29.2 | 27.8 | |
| Strange Brigade (2018) | 187.5 | 70.4 | 56.7 | 48 |
| Baldur's Gate 3 (2023) | 28.1 | 22.9 | 19.4 | 19.2 |
| Cyberpunk 2077 (2023) | 37.3 | 26.4 | 21.2 | 16.8 |
| F1 24 (2024) | 64.1 | 57 | 42.4 | 14.2 |
Emissions
System Noise
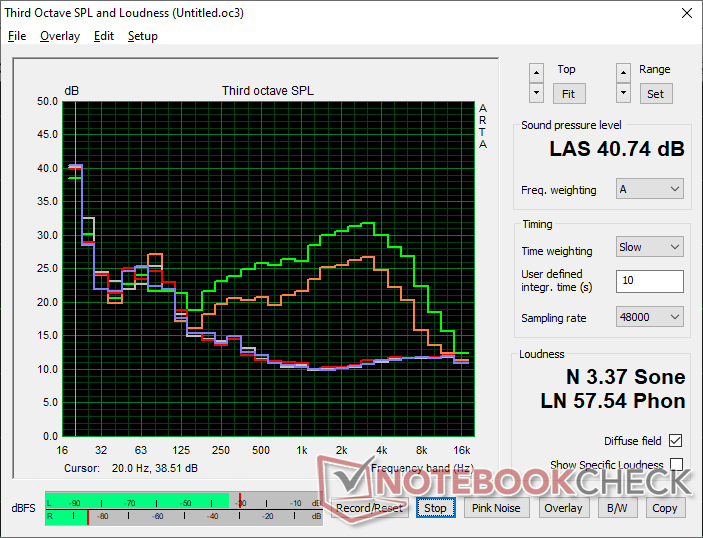
Noise level
| Idle |
| 23.4 / 23.4 / 23.4 dB(A) |
| Load |
| 30.3 / 47.4 dB(A) |
 | ||
30 dB silent 40 dB(A) audible 50 dB(A) loud |
||
min:  , med: , med:  , max: , max:  Earthworks M23R, Arta (15 cm distance) environment noise: 23.3 dB(A) Earthworks M23R, Arta (15 cm distance) environment noise: 23.3 dB(A) | ||
| Dell 14S DS14260 Ultra 7 355, Intel Graphics 4 Xe3 PTL | Lenovo ThinkBook 14 G9 IPL 21UX005PGE Ultra 5 325, Intel Graphics 4 Xe3 PTL | Dell XPS 14 Core Ultra X7 358H Ultra X7 358H, Arc B390 Panther Lake iGPU | HP OmniBook Ultra 14 Core Ultra X9 Ultra X9 388H, Arc B390 Panther Lake iGPU | Dell Inspiron 14 7445 2-in-1 R7 8840HS, Radeon 780M | Asus VivoBook S 14 OLED M5406WA Ryzen AI 9 HX 370, Radeon 890M | |
|---|---|---|---|---|---|---|
| Noise | -15% | -2% | -7% | -3% | -6% | |
| off / environment * (dB) | 23.3 | 24.8 -6% | 22.9 2% | 23.3 -0% | 23.6 -1% | 24 -3% |
| Idle Minimum * (dB) | 23.4 | 24.8 -6% | 23.3 -0% | 23.3 -0% | 24.3 -4% | 24 -3% |
| Idle Average * (dB) | 23.4 | 24.8 -6% | 23.3 -0% | 23.3 -0% | 24.3 -4% | 25 -7% |
| Idle Maximum * (dB) | 23.4 | 24.8 -6% | 23.3 -0% | 23.3 -0% | 24.8 -6% | 27 -15% |
| Load Average * (dB) | 30.3 | 46.1 -52% | 34 -12% | 42.9 -42% | 33.5 -11% | 40 -32% |
| Cyberpunk 2077 ultra * (dB) | 39.1 | 49.7 -27% | 43.5 -11% | 44.4 -14% | 39 -0% | |
| Load Maximum * (dB) | 47.4 | 48.2 -2% | 45.7 4% | 44.1 7% | 43.8 8% | 40 16% |
| Witcher 3 ultra * (dB) | 43.8 |
* ... smaller is better
Temperature
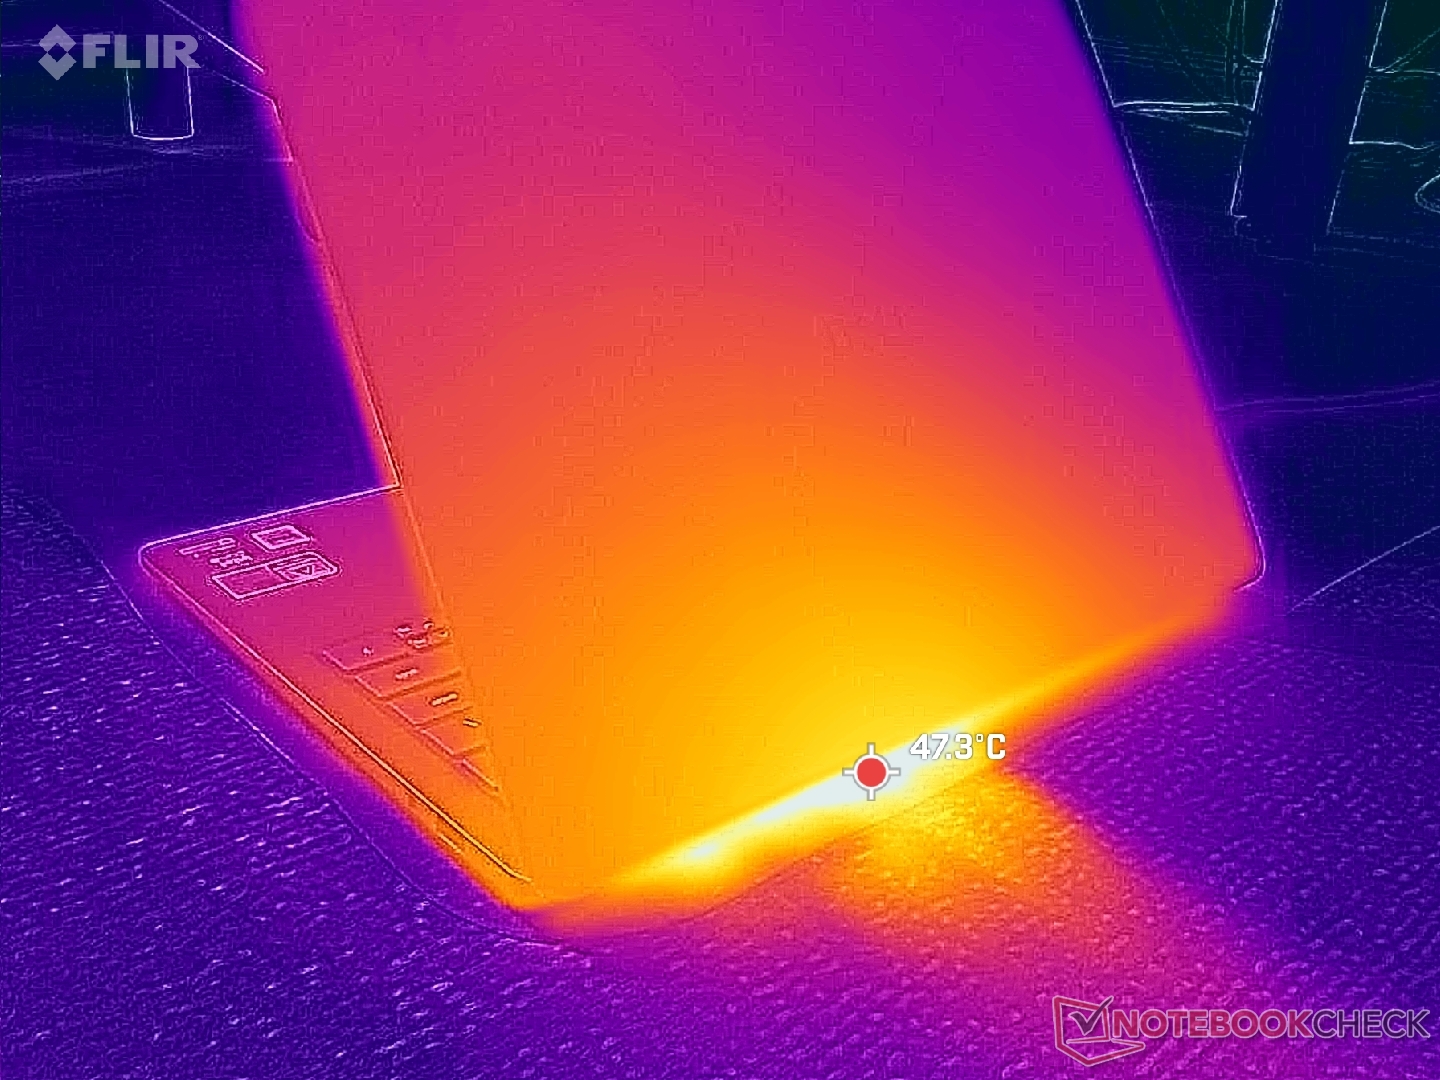
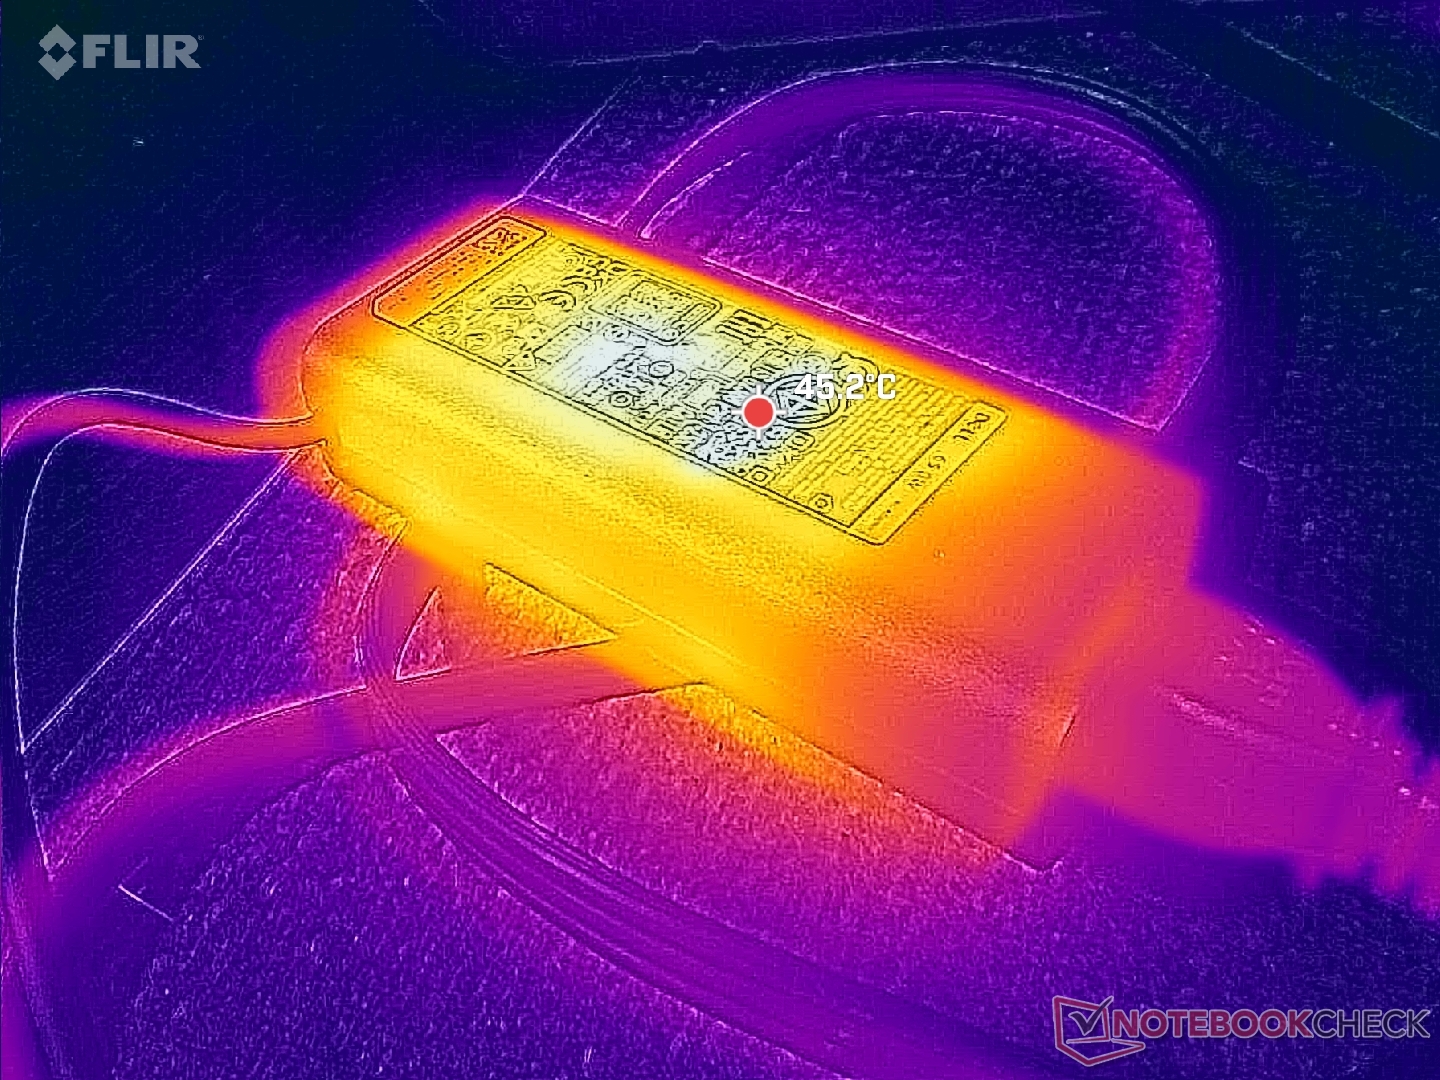
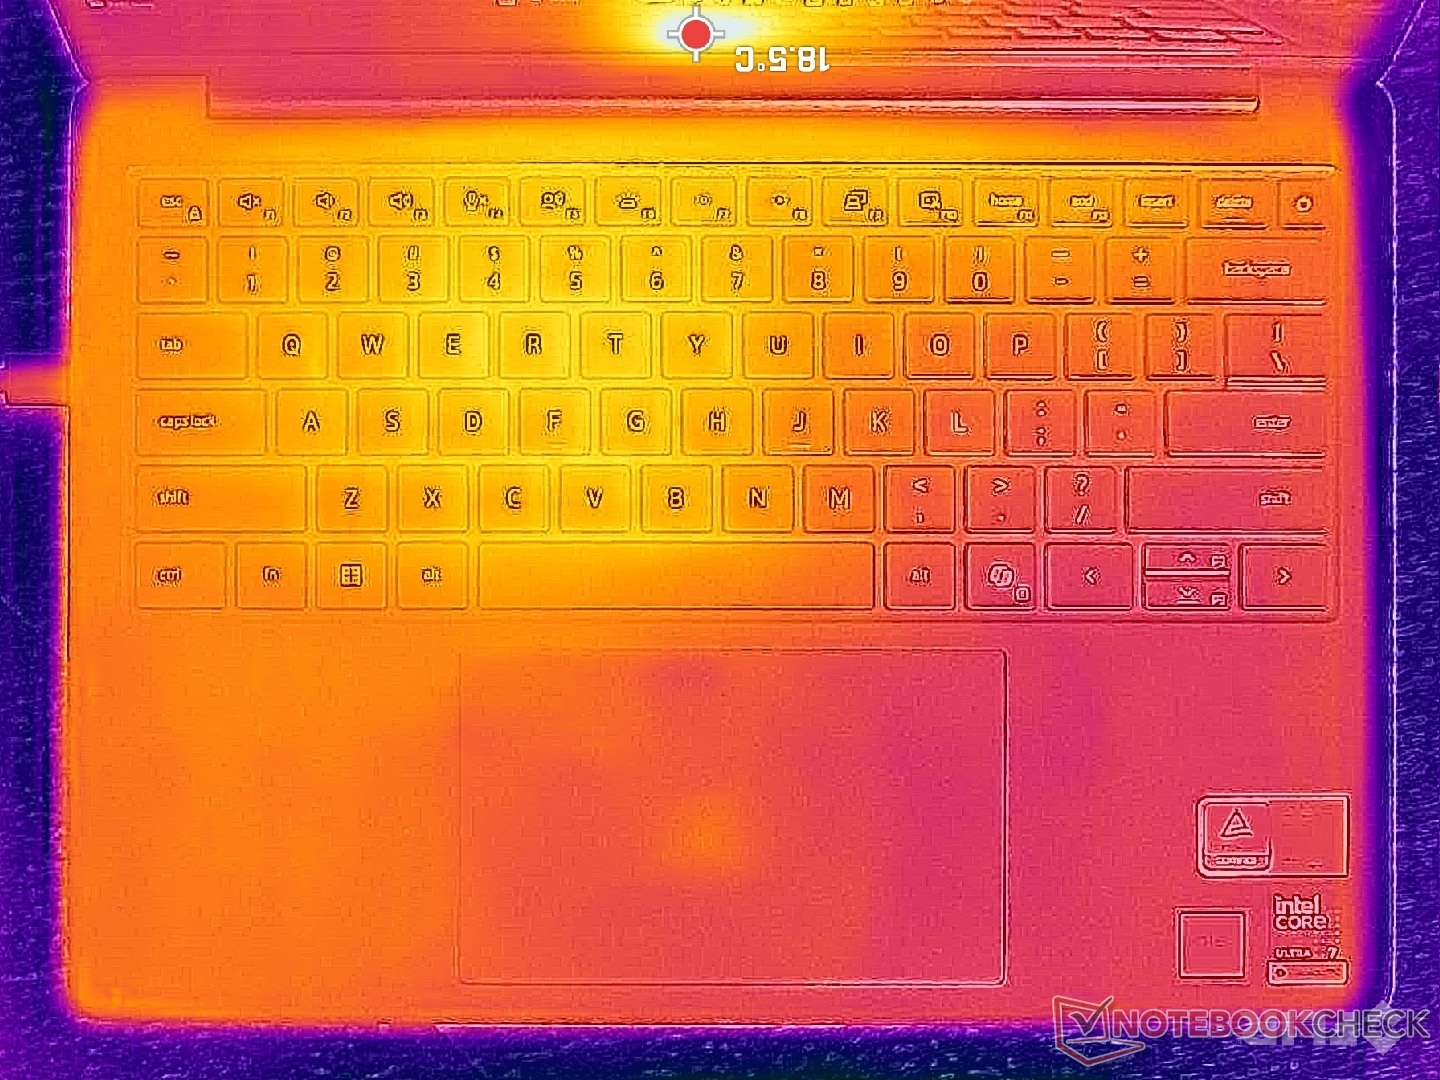
(±) The maximum temperature on the upper side is 44.4 °C / 112 F, compared to the average of 35.9 °C / 97 F, ranging from 21.4 to 59 °C for the class Subnotebook.
(±) The bottom heats up to a maximum of 41 °C / 106 F, compared to the average of 39.2 °C / 103 F
(+) In idle usage, the average temperature for the upper side is 25.6 °C / 78 F, compared to the device average of 30.8 °C / 87 F.
(+) The palmrests and touchpad are reaching skin temperature as a maximum (33 °C / 91.4 F) and are therefore not hot.
(-) The average temperature of the palmrest area of similar devices was 28.2 °C / 82.8 F (-4.8 °C / -8.6 F).
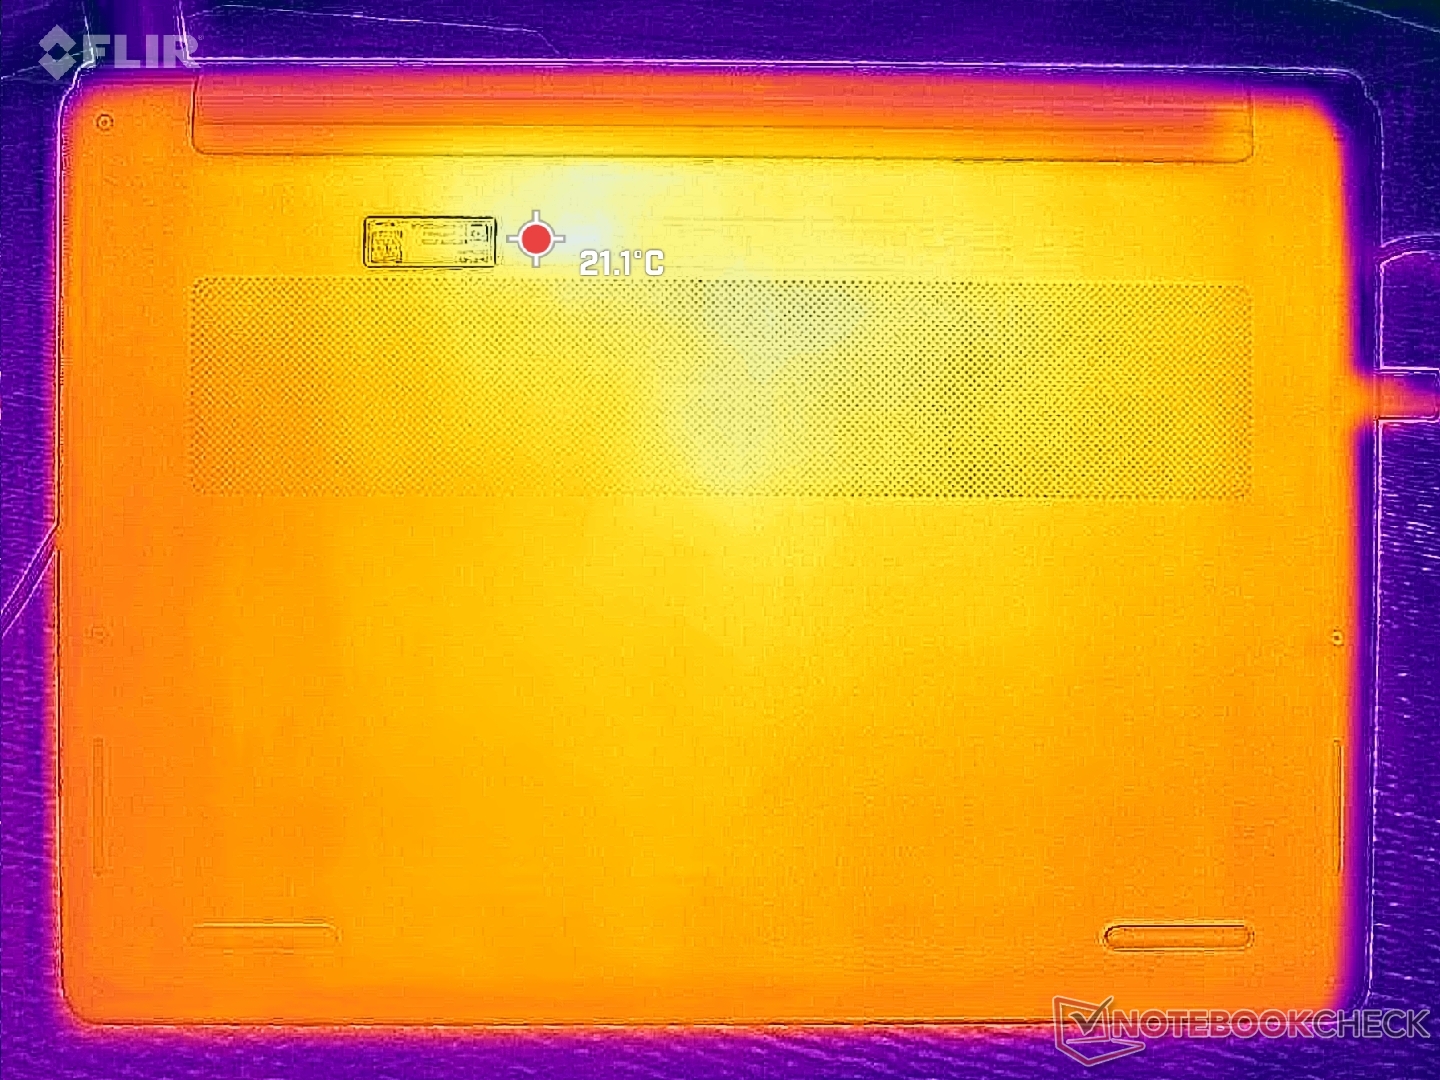
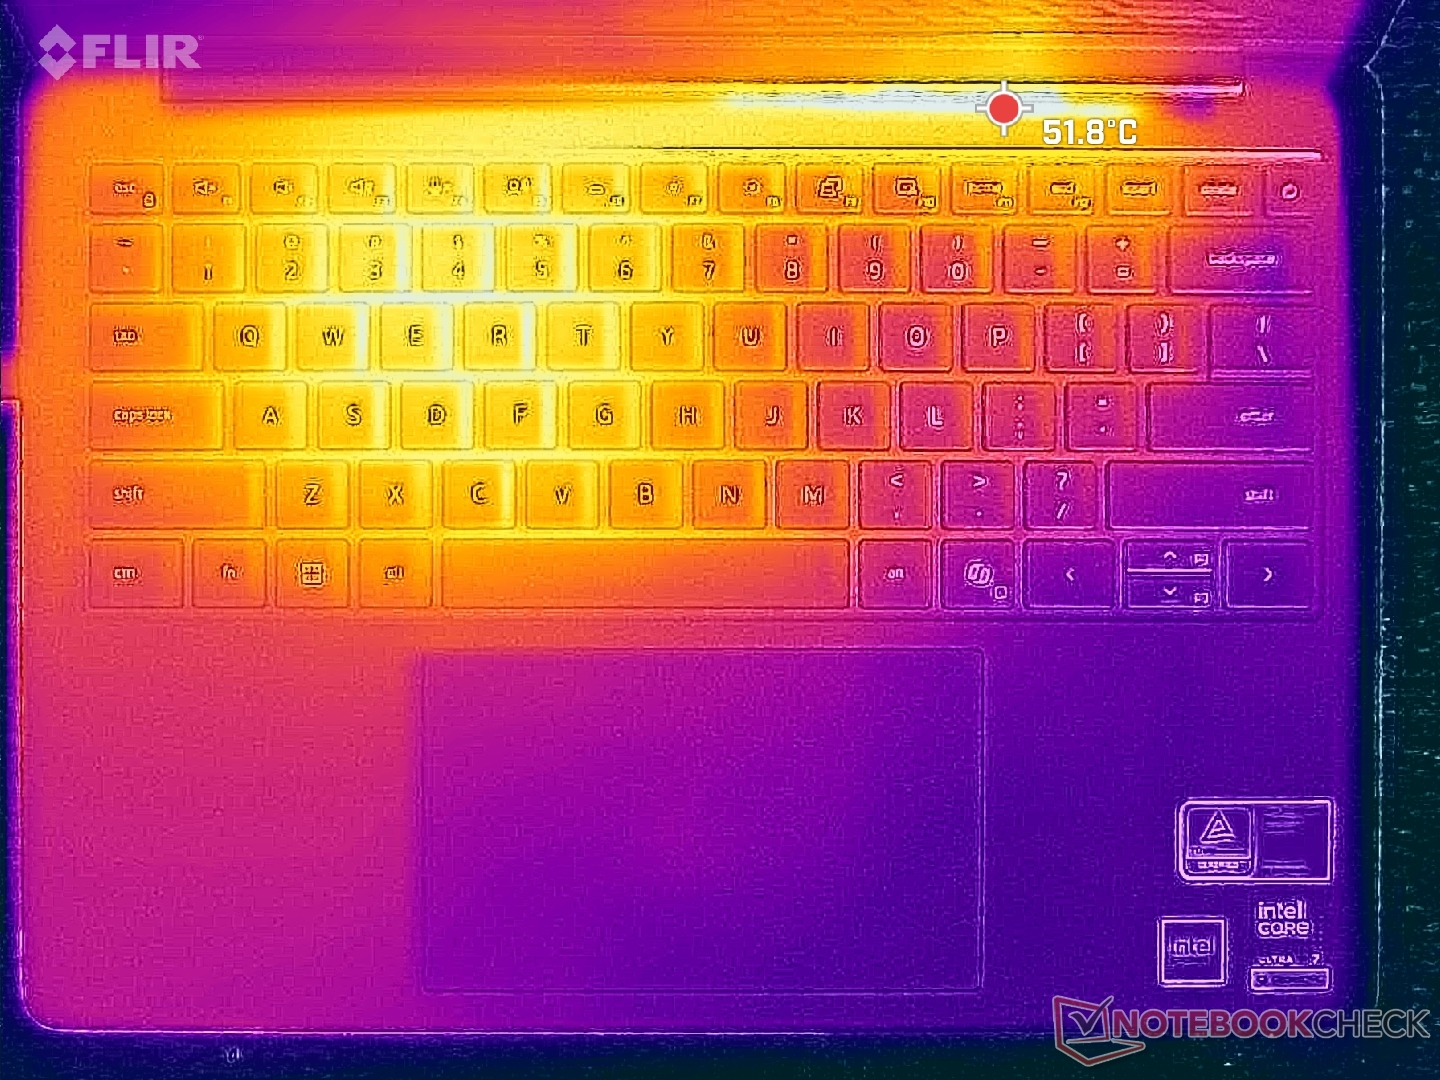
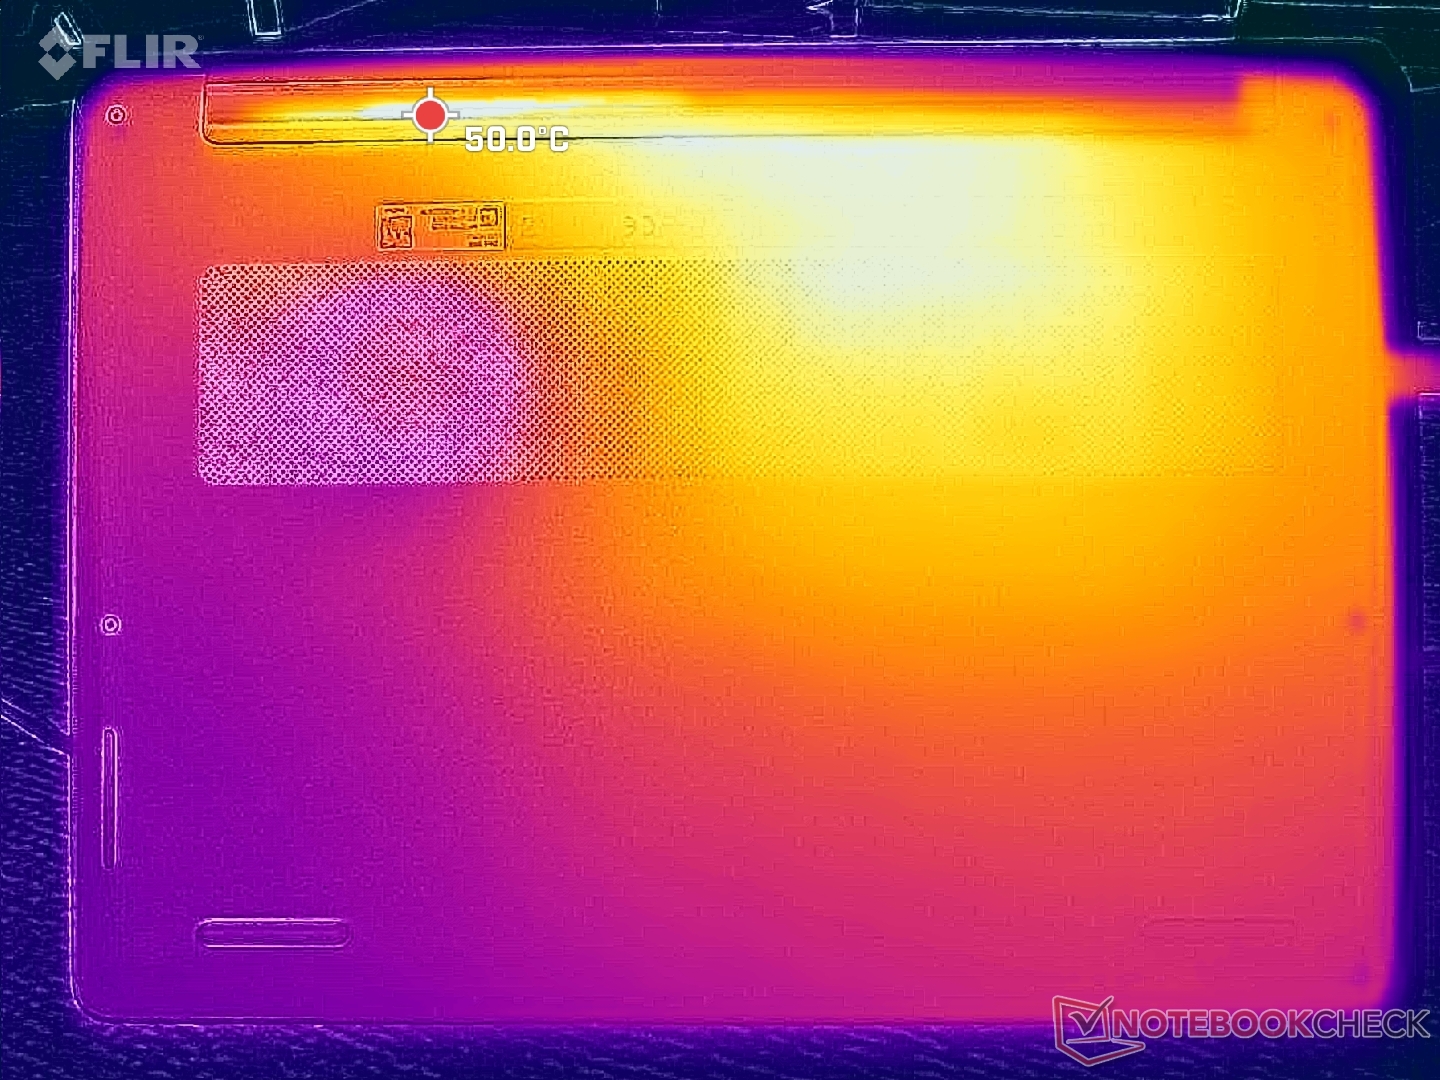
| Dell 14S DS14260 Ultra 7 355, Intel Graphics 4 Xe3 PTL | Lenovo ThinkBook 14 G9 IPL 21UX005PGE Ultra 5 325, Intel Graphics 4 Xe3 PTL | Dell XPS 14 Core Ultra X7 358H Ultra X7 358H, Arc B390 Panther Lake iGPU | HP OmniBook Ultra 14 Core Ultra X9 Ultra X9 388H, Arc B390 Panther Lake iGPU | Dell Inspiron 14 7445 2-in-1 R7 8840HS, Radeon 780M | Asus VivoBook S 14 OLED M5406WA Ryzen AI 9 HX 370, Radeon 890M | |
|---|---|---|---|---|---|---|
| Heat | -12% | 11% | 8% | -13% | -16% | |
| Maximum Upper Side * (°C) | 44.4 | 43.5 2% | 34 23% | 40.2 9% | 41.2 7% | 49 -10% |
| Maximum Bottom * (°C) | 41 | 42.5 -4% | 35.8 13% | 44.2 -8% | 48.4 -18% | 59 -44% |
| Idle Upper Side * (°C) | 26.6 | 33.6 -26% | 25.6 4% | 22.8 14% | 29.4 -11% | 28 -5% |
| Idle Bottom * (°C) | 27.4 | 32.8 -20% | 26.4 4% | 23.4 15% | 35.2 -28% | 29 -6% |
* ... smaller is better
Stress Test
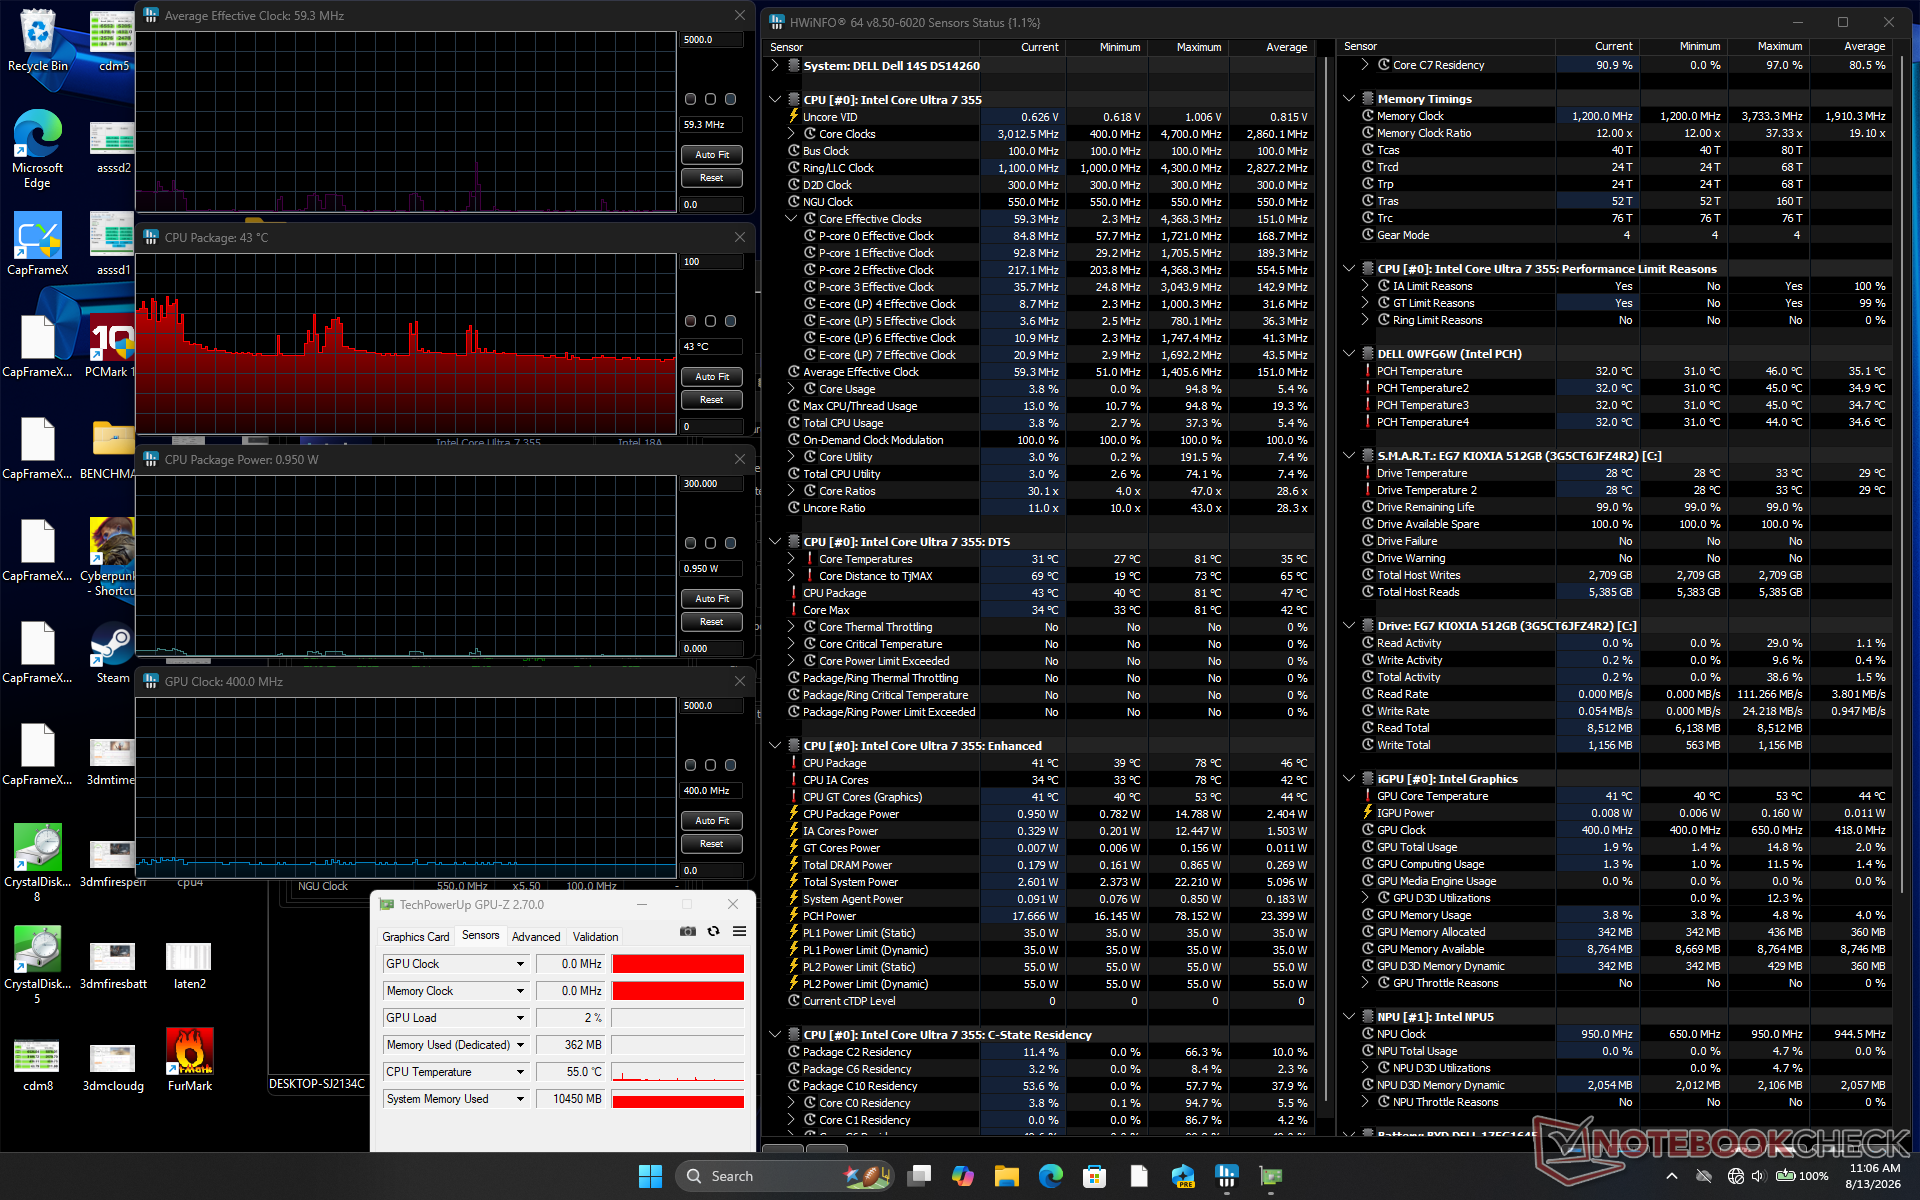
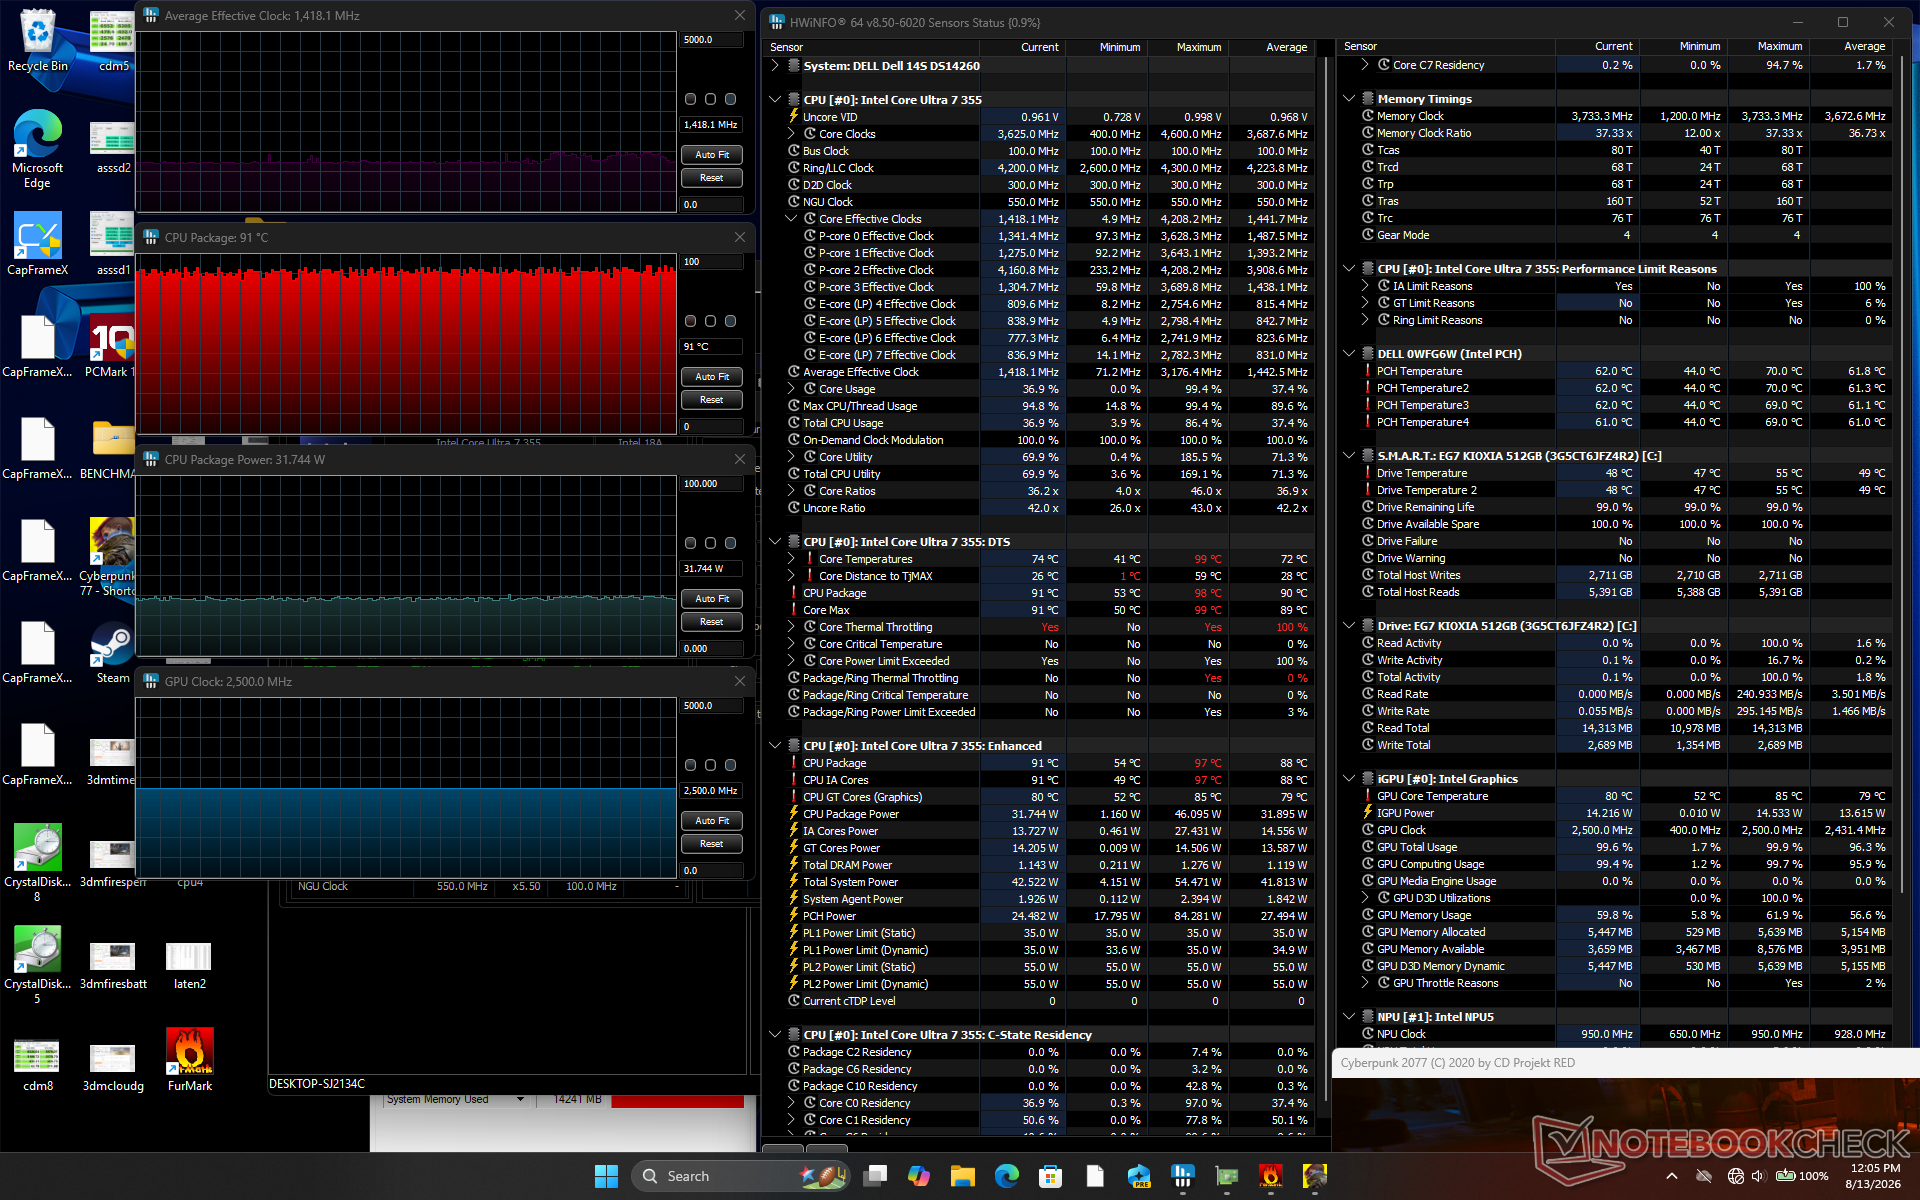
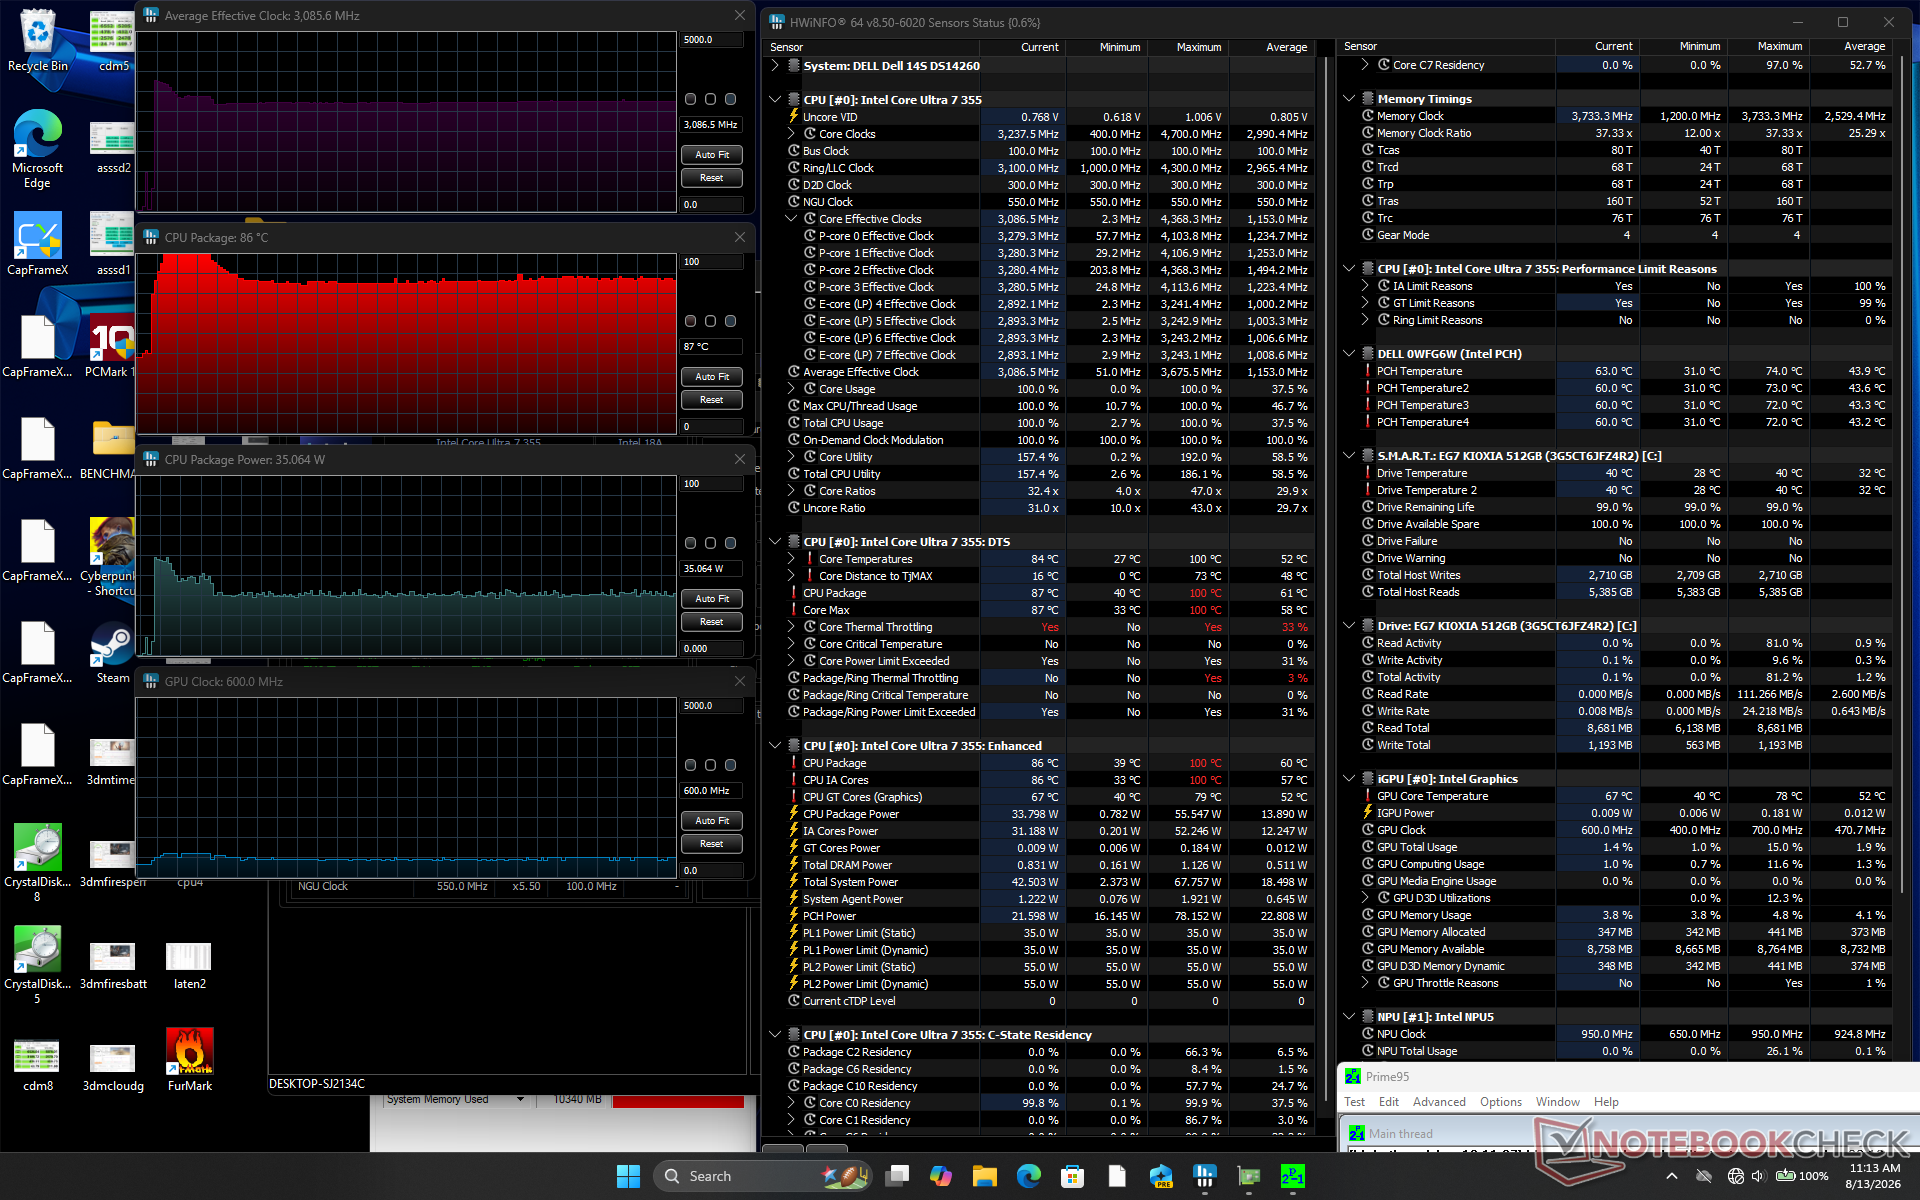
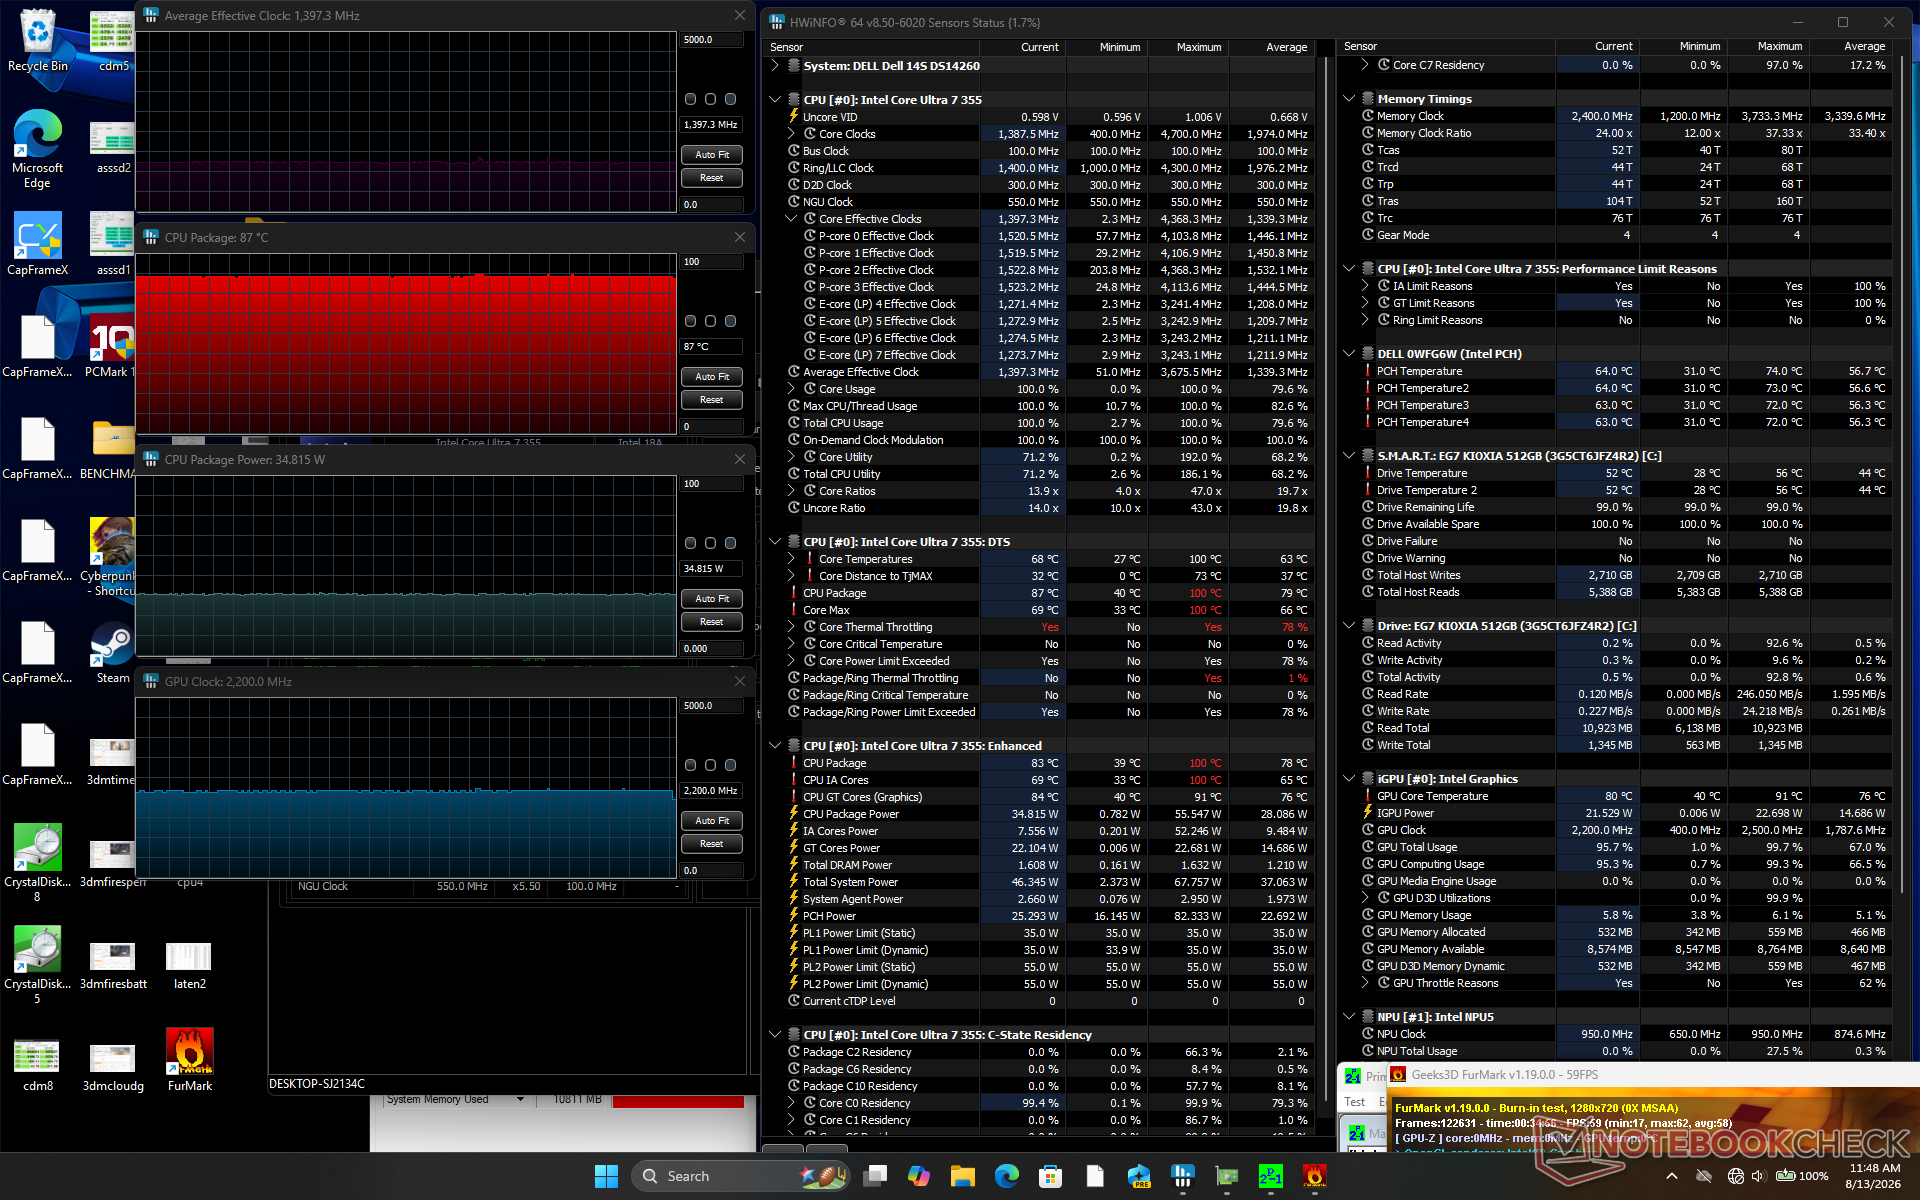
| Average CPU Clock (GHz) | GPU Clock (MHz) | Average CPU Temperature (°C) | |
| System Idle | -- | 400 | 43 |
| Prime95 Stress | 3.1 | -- | 87 |
| Prime95 + FurMark Stress | 1.4 | 2200 | 87 |
| Cyberpunk 2077 Stress | 1.5 | 2500 | 91 |
Speakers
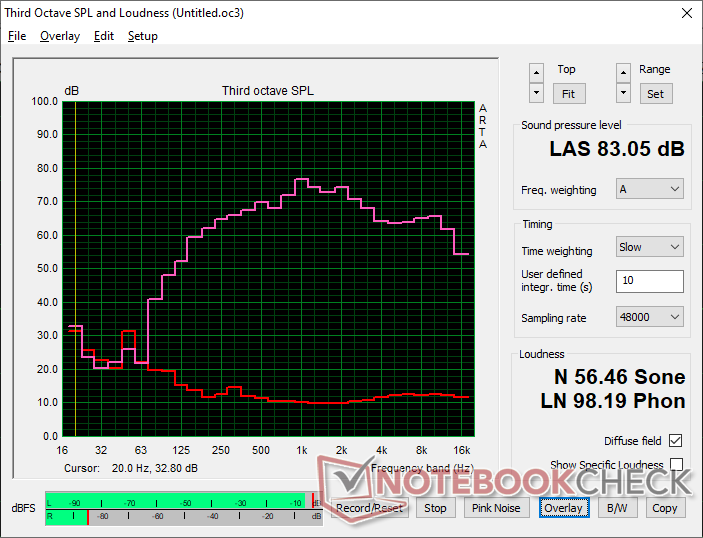
Dell 14S DS14260 audio analysis
(+) | speakers can play relatively loud (83.1 dB)
Bass 100 - 315 Hz
(±) | reduced bass - on average 7% lower than median
(±) | linearity of bass is average (7.8% delta to prev. frequency)
Mids 400 - 2000 Hz
(±) | higher mids - on average 6.3% higher than median
(+) | mids are linear (4.6% delta to prev. frequency)
Highs 2 - 16 kHz
(+) | balanced highs - only 1.9% away from median
(+) | highs are linear (3.3% delta to prev. frequency)
Overall 100 - 16.000 Hz
(+) | overall sound is linear (10.9% difference to median)
Compared to same class
» 10% of all tested devices in this class were better, 3% similar, 87% worse
» The best had a delta of 5%, average was 18%, worst was 53%
Compared to all devices tested
» 6% of all tested devices were better, 2% similar, 92% worse
» The best had a delta of 4%, average was 23%, worst was 136%
Apple MacBook Pro 16 2021 M1 Pro audio analysis
(+) | speakers can play relatively loud (84.7 dB)
Bass 100 - 315 Hz
(+) | good bass - only 3.8% away from median
(+) | bass is linear (5.2% delta to prev. frequency)
Mids 400 - 2000 Hz
(+) | balanced mids - only 1.3% away from median
(+) | mids are linear (2.1% delta to prev. frequency)
Highs 2 - 16 kHz
(+) | balanced highs - only 1.9% away from median
(+) | highs are linear (2.7% delta to prev. frequency)
Overall 100 - 16.000 Hz
(+) | overall sound is linear (4.6% difference to median)
Compared to same class
» 0% of all tested devices in this class were better, 0% similar, 100% worse
» The best had a delta of 5%, average was 17%, worst was 45%
Compared to all devices tested
» 0% of all tested devices were better, 0% similar, 100% worse
» The best had a delta of 4%, average was 23%, worst was 136%
Energy Management
Power Consumption
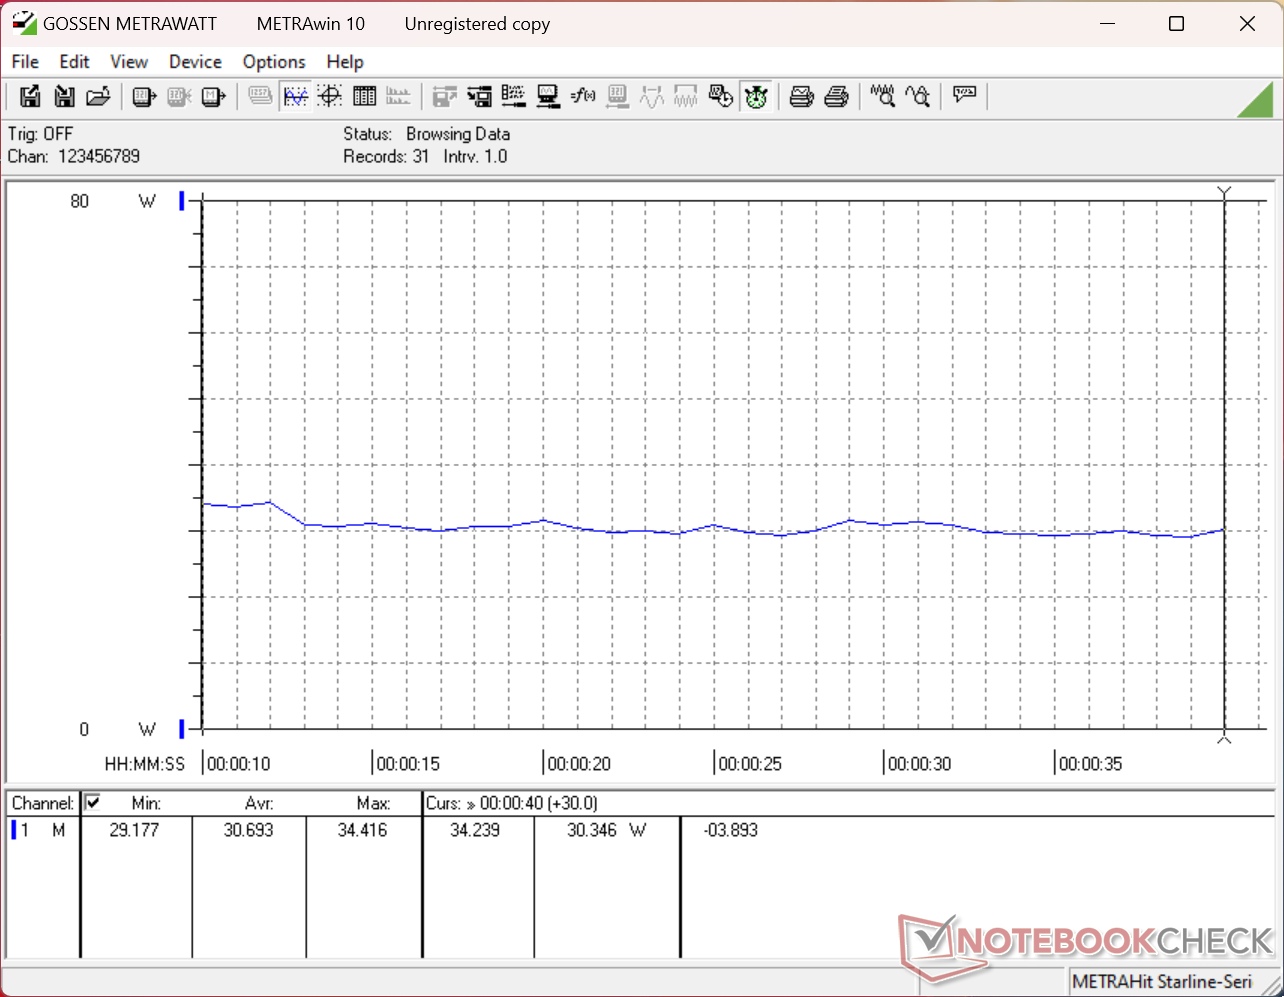
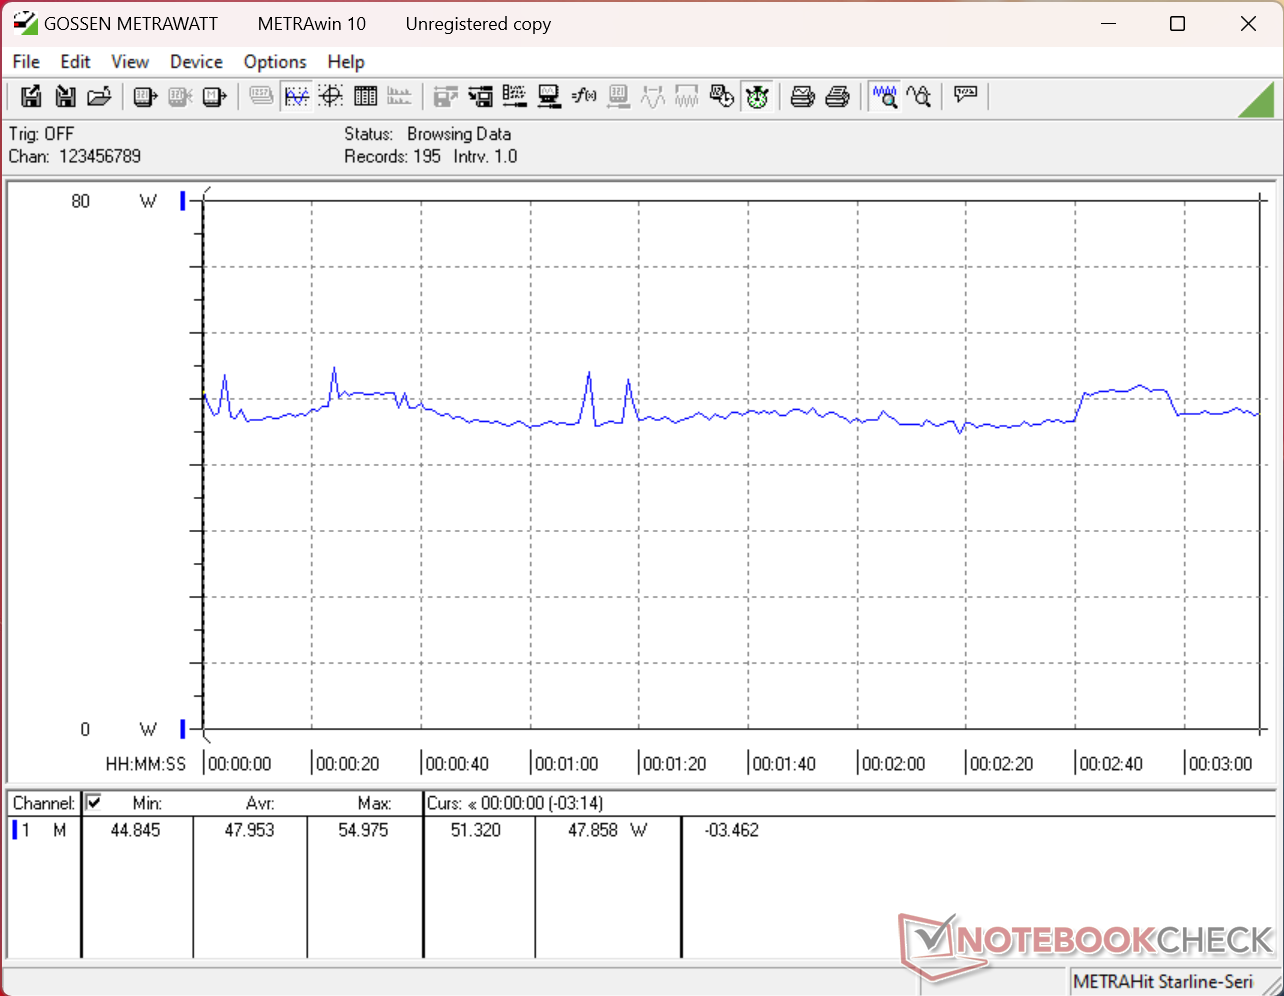
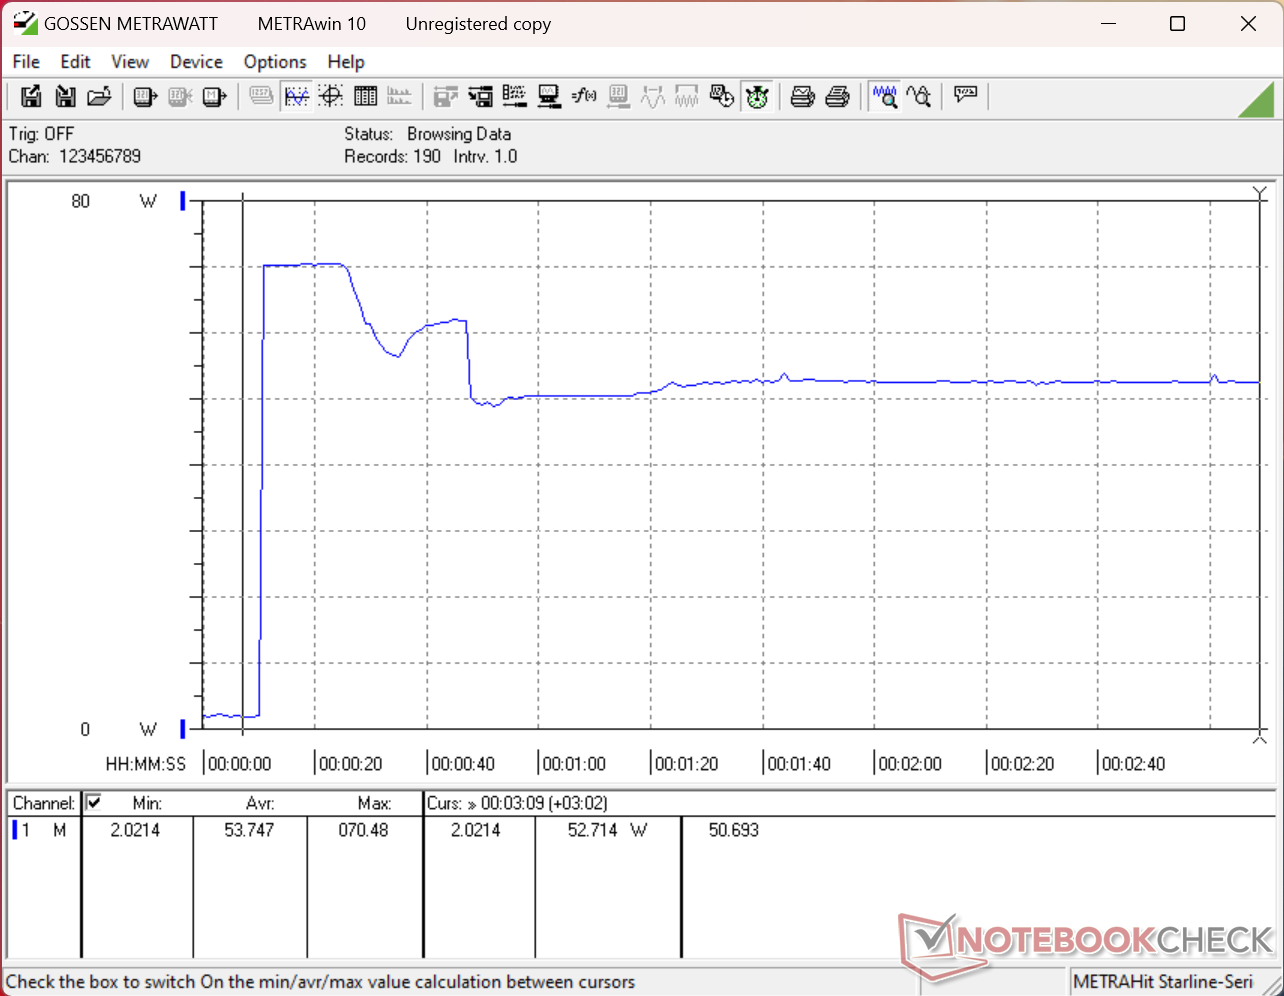
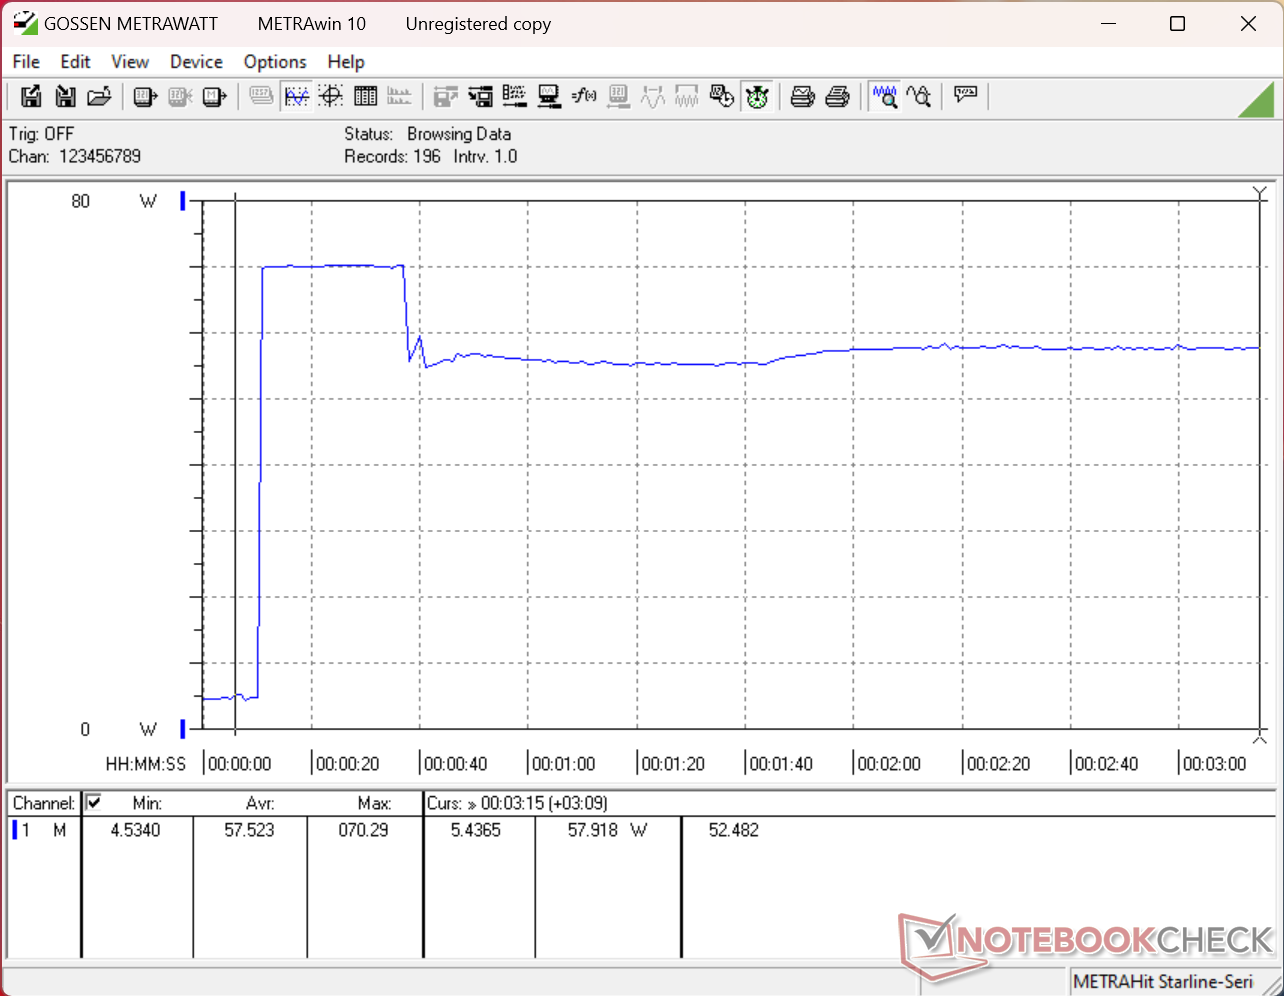
| Off / Standby | 0.15 / 0.56 Watt |
| Idle | 1.8 / 6.6 / 11.4 Watt |
| Load |
30.7 / 71 Watt |
   
| |
Key:
min: ,
med: ,
max: Metrahit Energy | |
| Dell 14S DS14260 Ultra 7 355, Intel Graphics 4 Xe3 PTL, , OLED, 1920x1200, 14" | Lenovo ThinkBook 14 G9 IPL 21UX005PGE Ultra 5 325, Intel Graphics 4 Xe3 PTL, YMTC PC42Q512GBG4Q, IPS LED, 1920x1200, 14" | Dell XPS 14 Core Ultra X7 358H Ultra X7 358H, Arc B390 Panther Lake iGPU, Samsung PM9C1b MZVL81T0HFLB-00BH1, OLED, 2880x1800, 14" | HP OmniBook Ultra 14 Core Ultra X9 Ultra X9 388H, Arc B390 Panther Lake iGPU, , OLED, 2880x1800, 14" | Dell Inspiron 14 7445 2-in-1 R7 8840HS, Radeon 780M, Micron 2400 MTFDKBK1T0QFM, IPS, 1920x1200, 14" | Asus VivoBook S 14 OLED M5406WA Ryzen AI 9 HX 370, Radeon 890M, Micron 2400 MTFDKBA1T0QFM, OLED, 1920x1200, 14" | |
|---|---|---|---|---|---|---|
| Power Consumption | -5% | -14% | -8% | -42% | -73% | |
| Idle Minimum * (Watt) | 1.8 | 2.4 -33% | 3.1 -72% | 2.5 -39% | 4.5 -150% | 6 -233% |
| Idle Average * (Watt) | 6.6 | 6.9 -5% | 3.6 45% | 5.1 23% | 8.4 -27% | 8 -21% |
| Idle Maximum * (Watt) | 11.4 | 7.9 31% | 10 12% | 5.8 49% | 8.9 22% | 14 -23% |
| Load Average * (Watt) | 30.7 | 41.5 -35% | 39.2 -28% | 49.8 -62% | 50.7 -65% | 76 -148% |
| Cyberpunk 2077 ultra external monitor * (Watt) | 47.6 | 48.3 -1% | 51.2 -8% | 55.1 -16% | 61.9 -30% | |
| Cyberpunk 2077 ultra * (Watt) | 48 | 48 -0% | 51.4 -7% | 55 -15% | 58.6 -22% | |
| Load Maximum * (Watt) | 71 | 66.9 6% | 101.4 -43% | 68 4% | 62.4 12% | 94 -32% |
| Witcher 3 ultra * (Watt) | 50.8 |
* ... smaller is better
Power Consumption Cyberpunk / Stress Test
Power Consumption external Monitor
Battery Life
| Dell 14S DS14260 Ultra 7 355, Intel Graphics 4 Xe3 PTL, 70 Wh | Lenovo ThinkBook 14 G9 IPL 21UX005PGE Ultra 5 325, Intel Graphics 4 Xe3 PTL, 48 Wh | Dell XPS 14 Core Ultra X7 358H Ultra X7 358H, Arc B390 Panther Lake iGPU, 70 Wh | HP OmniBook Ultra 14 Core Ultra X9 Ultra X9 388H, Arc B390 Panther Lake iGPU, 70 Wh | Dell Inspiron 14 7445 2-in-1 R7 8840HS, Radeon 780M, 54 Wh | Asus VivoBook S 14 OLED M5406WA Ryzen AI 9 HX 370, Radeon 890M, 75 Wh | |
|---|---|---|---|---|---|---|
| Battery runtime | -54% | -12% | -34% | -31% | -14% | |
| WiFi v1.3 (h) | 19.1 | 8.7 -54% | 16.8 -12% | 12.6 -34% | 13.1 -31% | 16.5 -14% |
| Load (h) | 1.4 | 2.2 | 2.8 | |||
| Reader / Idle (h) | 22.2 | 31.7 |
Notebookcheck Rating
The "true" successor to the Inspiron 14 series with both new looks and relatively faster Panther Lake CPU options.
Dell 14S DS14260
- 08/17/2026 v8
Allen Ngo
 Total Sustainability Score:
 Potential Competitors in Comparison
Image | Model / Review | Price | Weight | Height | Display |
|---|---|---|---|---|---|
1. 81.9% 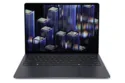 | Dell 14S DS14260 Intel Core Ultra 7 355 ⎘ Intel Graphics 4 Xe3 Panther Lake iGPU ⎘ 16 GB Memory | List Price: 1500 USD | 1.5 kg | 15.3 mm | 14.00" 1920x1200 162 PPI OLED |
2. 84.2% 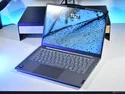 | Lenovo ThinkBook 14 G9 IPL 21UX005PGE Intel Core Ultra 5 325 ⎘ Intel Graphics 4 Xe3 Panther Lake iGPU ⎘ 32 GB Memory, 512 GB SSD | List Price: 1150 Euro | 1.4 kg | 21 mm | 14.00" 1920x1200 162 PPI IPS LED |
3. 87.4% 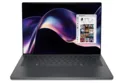 | Dell XPS 14 Core Ultra X7 358H Intel Core Ultra X7 358H ⎘ Intel Arc B390 12 Xe3 Panther Lake iGPU ⎘ 32 GB Memory, 1000 GB SSD | Amazon: 1. $1,849.99 Dell XPS 14 Premium Laptop 1... 2. $1,999.00 Dell XPS 14 Premium Laptop D... 3. $1,549.99 Dell XPS 13 9350 Laptop, 13.... List Price: 2200 USD | 1.4 kg | 14.62 mm | 14.00" 2880x1800 243 PPI OLED |
4. 87.9% 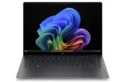 | HP OmniBook Ultra 14 Core Ultra X9 Intel Core Ultra X9 388H ⎘ Intel Arc B390 12 Xe3 Panther Lake iGPU ⎘ 32 GB Memory | List Price: 2800 USD | 1.3 kg | 10.7 mm | 14.00" 2880x1800 243 PPI OLED |
5. 80.1%  | Dell Inspiron 14 7445 2-in-1 AMD Ryzen 7 8840HS ⎘ AMD Radeon 780M ⎘ 16 GB Memory, 1024 GB SSD | Amazon: 1. $849.99 Dell Inspiron 14 7440, 14" 2... 2. $1,054.00 Dell 14 2-in-1 Laptop, FHD+,... 3. $889.00 Delca Customized Laptop Made... List Price: 950€ | 1.7 kg | 18.9 mm | 14.00" 1920x1200 162 PPI IPS |
6. 84.9%  | Asus VivoBook S 14 OLED M5406WA AMD Ryzen AI 9 HX 370 ⎘ AMD Radeon 890M ⎘ 24 GB Memory, 1024 GB SSD | List Price: 1400 EUR | 1.3 kg | 15.9 mm | 14.00" 1920x1200 162 PPI OLED |
Transparency
The selection of devices to be reviewed is made by our editorial team. The test sample was provided to the author as a loan by the manufacturer or retailer for the purpose of this review. The lender had no influence on this review, nor did the manufacturer receive a copy of this review before publication. There was no obligation to publish this review. As an independent media company, Notebookcheck is not subjected to the authority of manufacturers, retailers or publishers.
This is how Notebookcheck is testing
Every year, Notebookcheck independently reviews hundreds of laptops and smartphones using standardized procedures to ensure that all results are comparable. We have continuously developed our test methods for around 20 years and set industry standards in the process. In our test labs, high-quality measuring equipment is utilized by experienced technicians and editors. These tests involve a multi-stage validation process. Our complex rating system is based on hundreds of well-founded measurements and benchmarks, which maintains objectivity. Further information on our test methods can be found here.
 Add as a preferred source on Google


