Notebookcheck Logo

Intel Core i7-11700K vs AMD Ryzen 9 5900X vs AMD Ryzen 7 5800X3D

Intel Core i7-11700K

► remove from comparison Intel i7-11700K

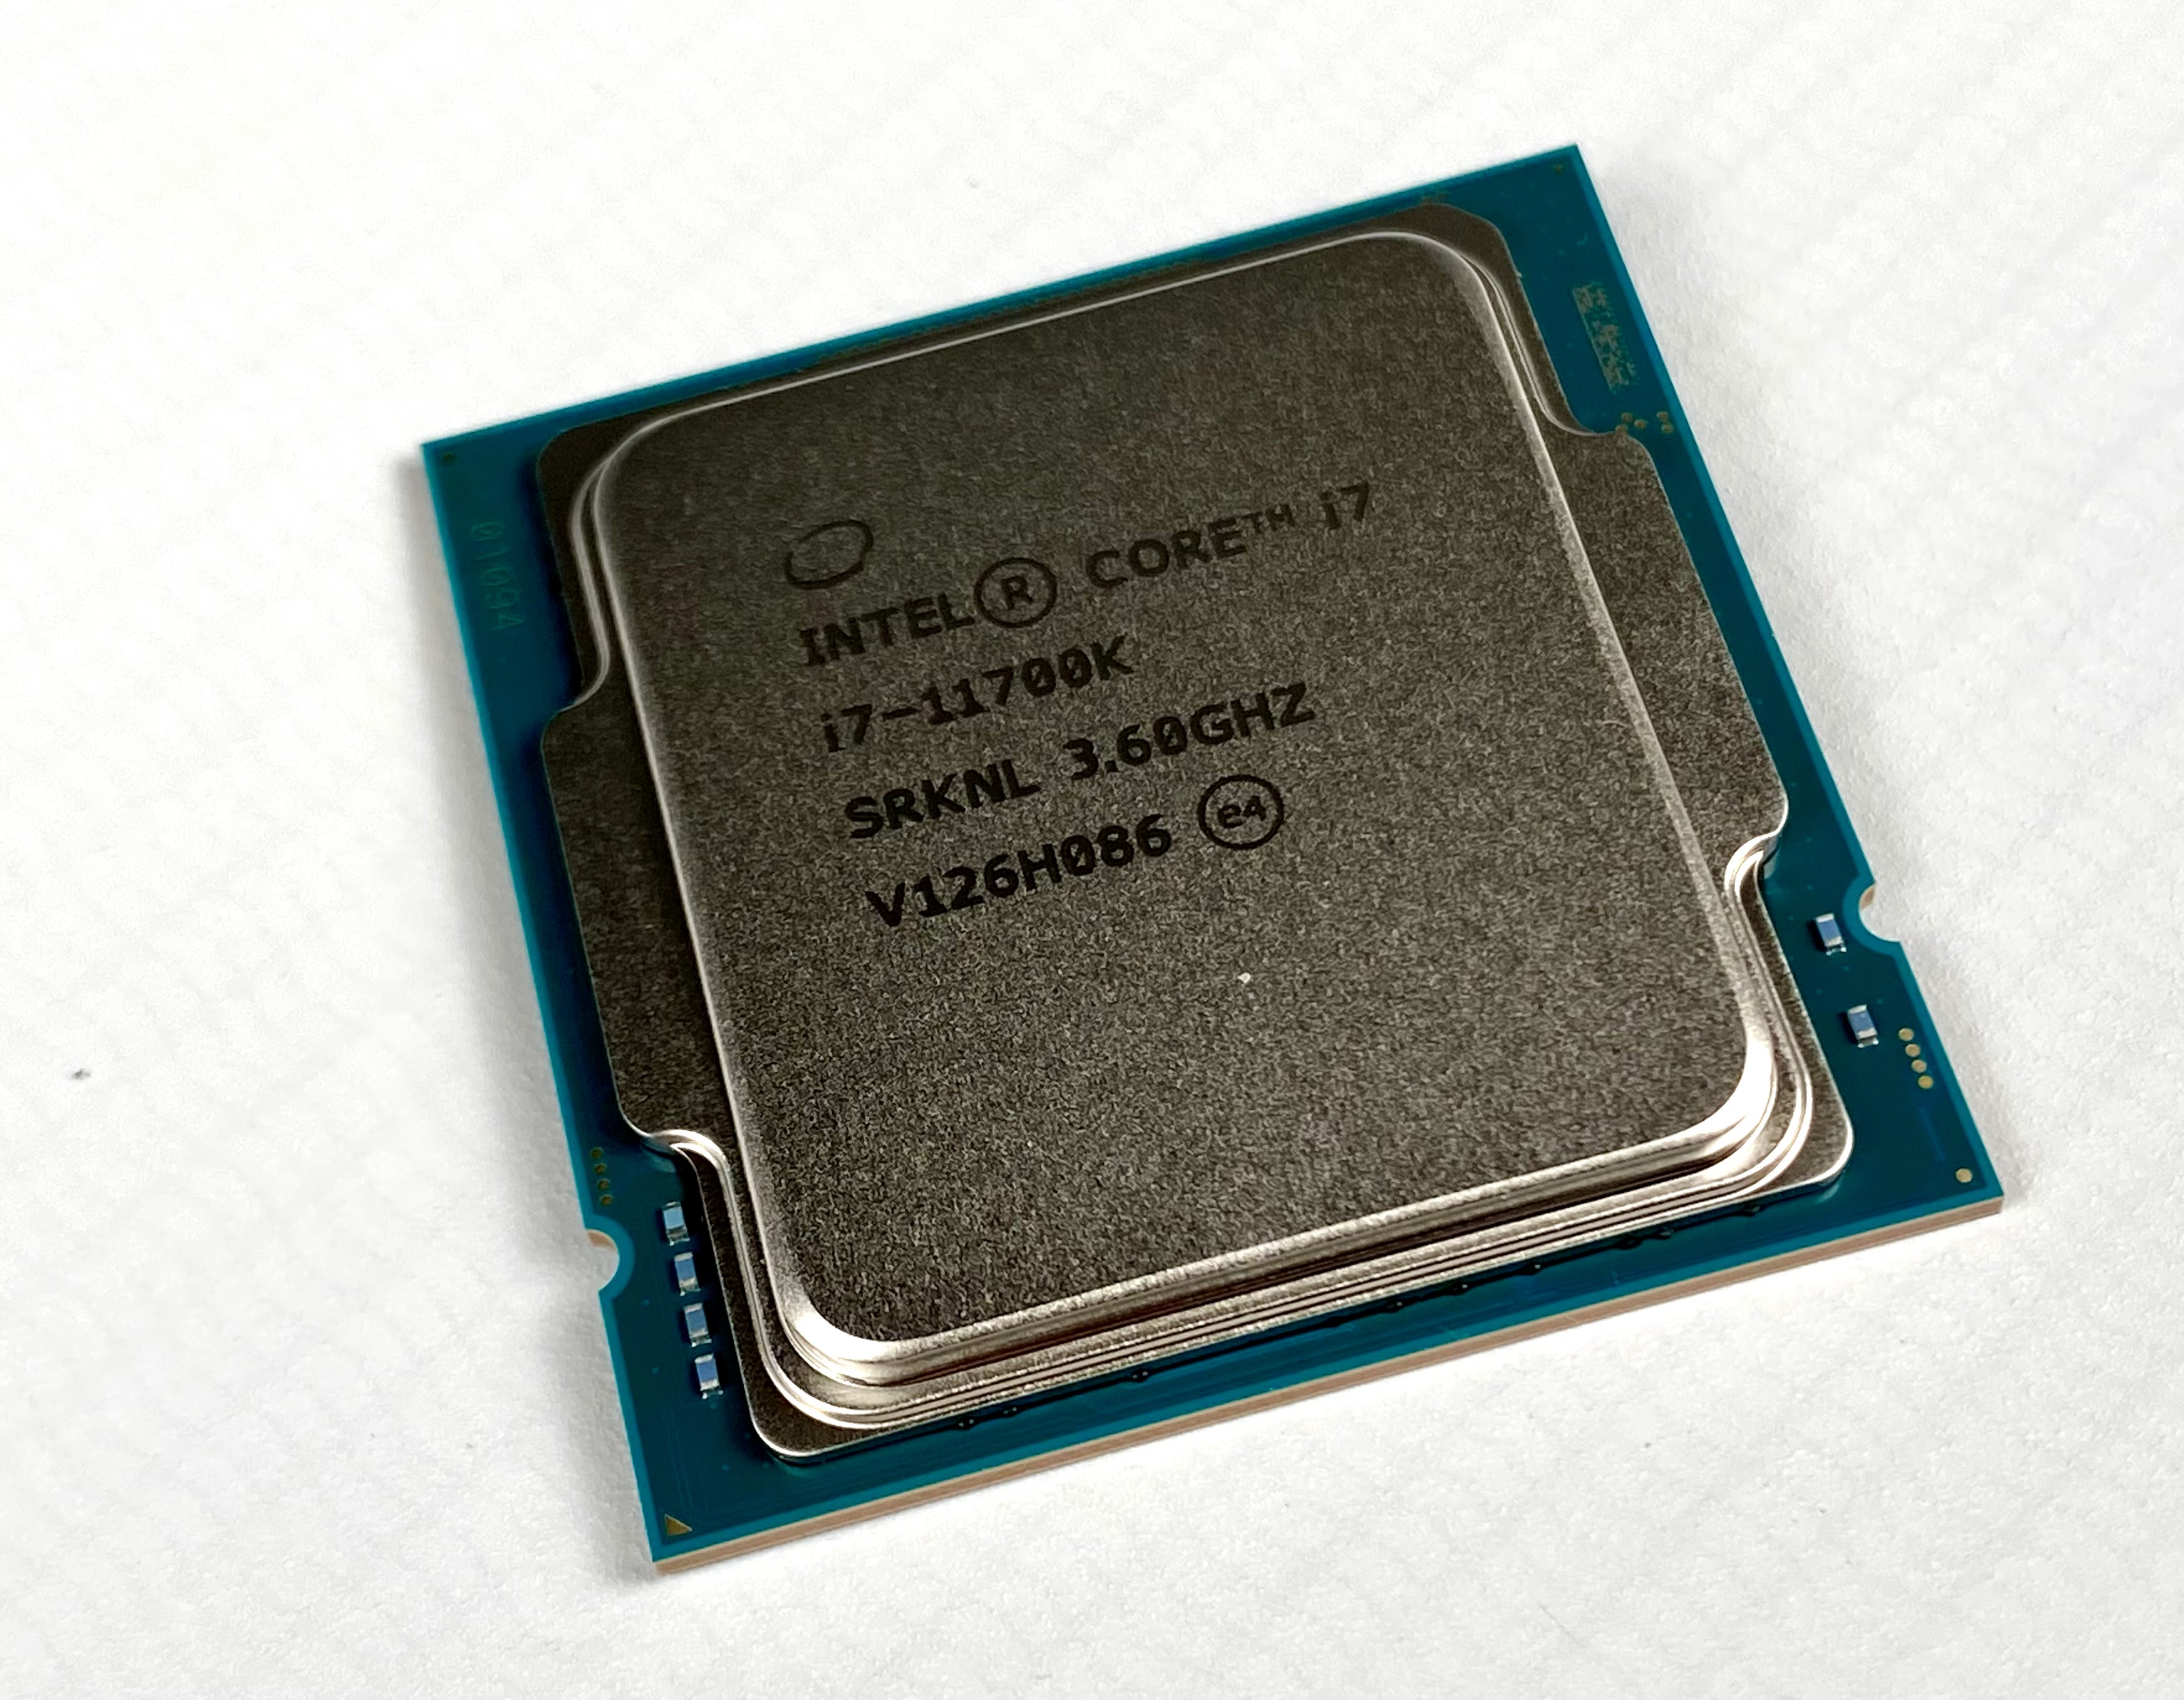
The Intel Core i7-11700K is a high-end desktop CPU based on the Rocket Lake architecture. The CPU offers 8 cores and 16 threads clocked at 3.6 - 4.9 GHz. The TDP is rated at 125 Watt (PL1, power limit sustained load) but the PL2 is set to around 250 Watt for short term boosts (up to 56 seconds). 

The Sunny Cove processor cores (known from the Ice Lake mobile CPUs) offer larger caches and an improved IPC (up to 19%). Furthermore, the chip also includes (partly) integrated WiFi 6E and Thunderbolt 4. The platform supports PCIe 4.0 and Intel DL Boost for AI acceleration.

The faster Rocket Lake-S CPUs also integrate a new Intel UHD Graphics 750 that is based on the current Intel Xe architecture (e.g. mobile Tiger Lake).

The CPU is manufactured on an old 14 nm process like the Comet Lake predecessors.

AMD Ryzen 9 5900X

► remove from comparison AMD R9 5900X

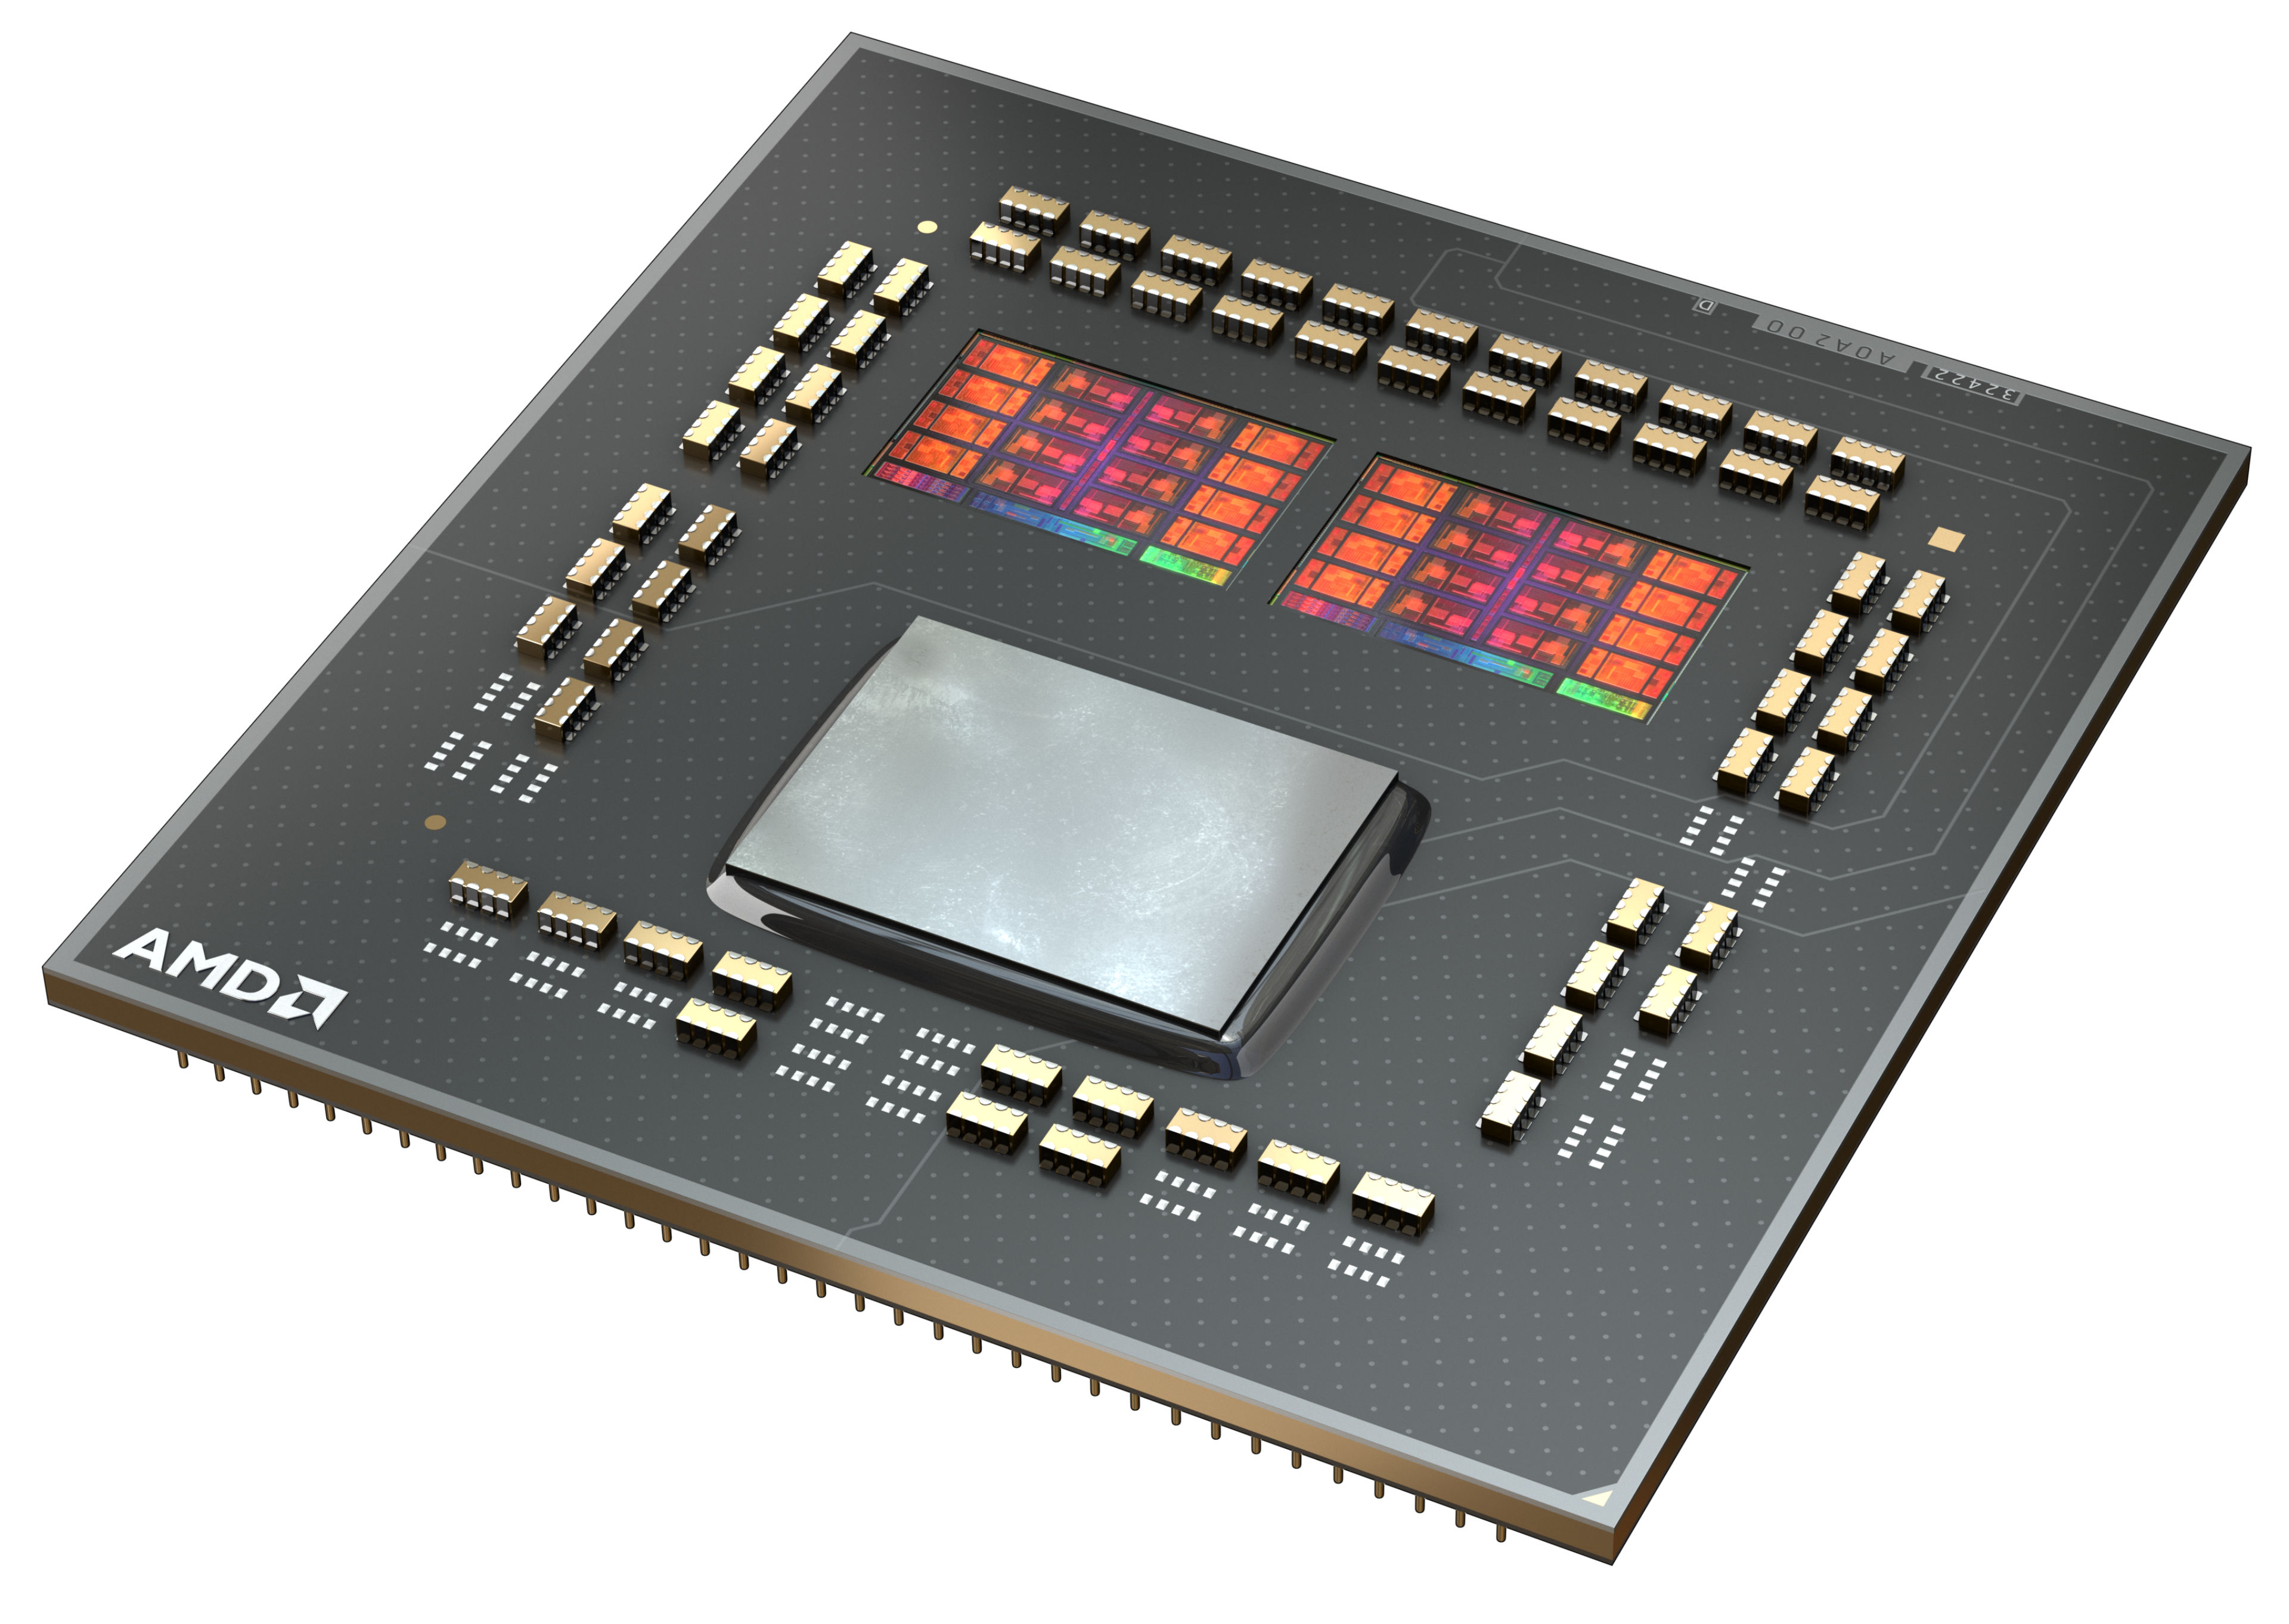
The AMD Ryzen 9 5900X is a high-end 12-core, hyperthreaded (SMT) Vermeer series desktop processor that can process 24 threads simultaneously. Introduced on October 8, 2020, the Ryzen 9 5900X is the fastest 12-core processor and is specified at 105 watts TDP. The top model, the AMD Ryzen 9 5950X, offers even more power and at the same time offers another 4 cores and 8 threads. 

The Ryzen 9 5900X clocks with 3.7 GHz base clock and reaches up to 4.8 GHz on one core in turbo mode. However, when all 12 cores are loaded, up to 4.5 GHz is still possible.

The performance of the AMD Ryzen 9 5900X is consistently excellent in all applications and significantly better than the AMD Ryzen 9 3900X. AMD has been able to significantly improve its single thread performance in particular and even beats the Intel Core i9-10900K in this discipline. The multi-thread performance could also be improved. In an in-house duel, the AMD Ryzen 9 5900X can even take on an AMD Threadripper 2950X.

The internal structure of the processor has not changed fundamentally at first glance. The CCX structure has changed a bit compared to Zen2, because now a CCX consists of up to 8 CPU cores. So each individual core can access the complete L3 cache (32 MByte). Furthermore the CCX modules are connected to each other via the same I/O die, which we already know from Zen2. According to AMD, the Infinity-Fabric should now reach clock rates of up to 2 GHz, which in turn allows a RAM clock of 4.000 MHz without performance loss.

For the manufacturing processes, AMD also relies on TSCM for the Vermeer processors for the 7nm production of the CPU cores, although the I/O die is still supplied in 12nm by Globalfoundries. 

In games, the AMD Ryzen 9 5900X is convincing thanks to the significantly improved IPC. With the AMD Ryzen 9 5900X, streaming can be done simultaneously with gaming. But if you only want to play games, you are well advised to take a closer look at the AMD Ryzen 7 5800X or the AMD Ryzen 5 5600X.

AMD Ryzen 7 5800X3D

► remove from comparison AMD R7 5800X3D

The AMD Ryzen 7 5800X3D is an 8-core desktop processor with a large level 3 cache (3DV cache) that is aimed mostly for increased gaming performance. It offers 8 Zen 3 based cores clocked at 3.4 - 4.5 GHz and therefore a bit slower than the 3.4 - 4.7 GHz of the R7 5800X. The power consumption of both chips is rated at 105 Watt (TDP) and the efficiency compared to Alder Lake desktop CPUs is rather good.

ModelIntel Core i7-11700KAMD Ryzen 9 5900XAMD Ryzen 7 5800X3D
CodenameRocket LakeVermeer (Zen3)Vermeer (Zen3)
SeriesIntel Rocket LakeAMD Vermeer (Ryzen 5000)AMD Vermeer (Ryzen 5000)
Series: Vermeer (Ryzen 5000) Vermeer (Zen3)
Intel Core i9-11900K3.5 - 5.3 GHz8 / 16 cores16 MB L3
Intel Core i7-11700K « 3.6 - 5 GHz8 / 16 cores16 MB L3
Intel Core i7-117002.5 - 4.9 GHz8 / 16 cores16 MB L3
Intel Core i5-11600K3.9 - 4.9 GHz6 / 12 cores12 MB L3
Intel Core i5-11400F2.6 - 4.4 GHz6 / 12 cores12 MB L3
Intel Core i5-11400T1.3 - 3.7 GHz6 / 12 cores12 MB L3
AMD Ryzen 9 5900X « 3.7 - 4.8 GHz12 / 24 cores64 MB L3
AMD Ryzen 7 5800X3D3.4 - 4.5 GHz8 / 16 cores96 MB L3
AMD Ryzen 9 5900X3.7 - 4.8 GHz12 / 24 cores64 MB L3
AMD Ryzen 7 5800X3D « 3.4 - 4.5 GHz8 / 16 cores96 MB L3
Clock3600 - 5000 MHz3700 - 4800 MHz3400 - 4500 MHz
L1 Cache640 KB768 KB512 KB
L2 Cache4 MB6 MB4 MB
L3 Cache16 MB64 MB96 MB
Cores / Threads8 / 1612 / 248 / 16
TDP125 Watt105 Watt105 Watt
Technology14 nm7 nm7 nm
max. Temp.100 °C90 °C
SocketLGA1200AM4 (1331)AM4 (1331)
FeaturesDDR4-3200 RAM, PCIe 4, 8 GT/s bus, DL Boost, GNA, vPro, MMX, SSE, SSE2, SSE3, SSSE3, SSE4.1, SSE4.2, AVX, AVX2, AVX-512, BMI2, ABM, FMA, ADX, VMX, SMX, SMEP, SMAP, MPX, EIST, TM1, TM2, HT, Turbo, SST, AES-NI, RDRAND, RDSEED, SHAMMX(+), SSE, SSE2, SSE3, SSSE3, SSE4.1, SSE4.2, SSE4A, x86-64, AMD-V, AES, AVX, AVX2, FMA3, SHA, Precision Boost 2MMX(+), SSE, SSE2, SSE3, SSSE3, SSE4.1, SSE4.2, SSE4A, x86-64, AMD-V, AES, AVX, AVX2, FMA3, SHA, Precision Boost 2
iGPUIntel UHD Graphics Xe 750 32EUs (Rocket Lake) (350 - 1300 MHz)
Architecturex86x86x86
Announced
Manufacturerark.intel.comwww.amd.com
Die Size2x 80.7 + 125 (I/O) mm2
$549 U.S.

Benchmarks

Performance Rating - CB R15 + R20 + 7-Zip + X265 + Blender + 3DM11 CPU - i7-11700K
36.8 pt (61%)
Restrict / Search: Model: Max. age: years
Performance Rating - CB R15 + R20 + 7-Zip + X265 + Blender + 3DM11 CPU - R9 5900X
38.4 pt (64%)
Restrict / Search: Model: Max. age: years
Performance Rating - CB R15 + R20 + 7-Zip + X265 + Blender + 3DM11 CPU - R7 5800X3D
37.5 pt (62%)
Restrict / Search: Model: Max. age: years
Cinebench R23 - Cinebench R23 Multi Core
14281 Points (13%)
min: 10531     avg: 15441     median: 16262 (15%)     max: 20634 Points
14317 Points (13%)
Cinebench R23 - Cinebench R23 Single Core
1558 Points (66%)
min: 1487     avg: 1526     median: 1527 (64%)     max: 1568 Points
Cinebench R20 - Cinebench R20 CPU (Single Core)
min: 580     avg: 588     median: 588 (64%)     max: 596 Points
min: 579     avg: 603     median: 598 (65%)     max: 639 Points
Cinebench R20 - Cinebench R20 CPU (Multi Core)
min: 5082     avg: 5361     median: 5361 (13%)     max: 5640 Points
min: 4077     avg: 6104     median: 6233 (15%)     max: 8629 Points
5479 Points (13%)
Cinebench R15 - Cinebench R15 CPU Multi 64 Bit
min: 2265     avg: 2299     median: 2299 (15%)     max: 2333 Points
min: 1744     avg: 2631     median: 2695 (17%)     max: 3717 Points
2413 Points (15%)
Cinebench R15 - Cinebench R15 CPU Single 64 Bit
240 Points (66%)
min: 242     avg: 252.6     median: 250 (69%)     max: 271 Points
Cinebench R11.5 - Cinebench R11.5 CPU Multi 64 Bit
25.6 Points (33%)
41.8 Points (54%)
27.2 Points (35%)
Cinebench R11.5 - Cinebench R11.5 CPU Single 64 Bit
2.9 Points (68%)
3.1 Points (75%)
Cinebench R10 - Cinebench R10 Rend. Single (32bit)
9621 Points (58%)
6828 Points (41%)
Cinebench R10 - Cinebench R10 Rend. Multi (32bit)
58342 Points (42%)
52076 Points (38%)
42010 Points (30%)
Cinebench R10 - Cinebench R10 Rend. Multi (64bit)
99651 Points (64%)
Cinebench R10 - Cinebench R10 Rend. Single (64bit)
12739 Points (16%)
wPrime 2.10 - wPrime 2.0 32m *
4.8 s (1%)
wPrime 2.10 - wPrime 2.0 1024m *
92.6 s (1%)
wPrime 1.55 - wPrime 1.55 1024m *
59.5 s (0%)
wPrime 1.55 - wPrime 1.55 32m *
2.5 s (1%)
WinRAR - WinRAR 4.0
13361 Points (21%)
14431 Points (23%)
7-Zip 18.03 - 7-Zip 18.03 Multi Thread 4 runs
57129 MIPS (33%)
min: 63583     avg: 88397     median: 90443 (52%)     max: 103095 MIPS
69518 MIPS (40%)
7-Zip 18.03 - 7-Zip 18.03 Single Thread 4 runs
6157 MIPS (73%)
min: 5613     avg: 6469     median: 6582 (78%)     max: 6930 MIPS
X264 HD Benchmark 4.0 - x264 Pass 2
128 fps (3%)
191 fps (5%)
X264 HD Benchmark 4.0 - x264 Pass 1
292.5 fps (7%)
335 fps (9%)
HWBOT x265 Benchmark v2.2 - HWBOT x265 4k Preset
16.3 fps (29%)
min: 12.4     avg: 23     median: 24.9 (44%)     max: 27.4 fps
TrueCrypt - TrueCrypt Serpent
1.2 GB/s (35%)
1.8 GB/s (53%)
TrueCrypt - TrueCrypt Twofish
1.9 GB/s (33%)
2.9 GB/s (50%)
TrueCrypt - TrueCrypt AES
12.7 GB/s (33%)
21.2 GB/s (55%)
Blender - Blender 2.79 BMW27 CPU *
221 Seconds (2%)
min: 138     avg: 161.5     median: 154.2 (1%)     max: 275 Seconds
212.6 Seconds (1%)
R Benchmark 2.5 - R Benchmark 2.5 *
0.5 sec (11%)
min: 0.4457     avg: 0.5     median: 0.5 (10%)     max: 0.992 sec
3DMark 06 - CPU - 3DMark 06 - CPU
16388 Points (35%)
min: 14624     avg: 17983     median: 16438 (35%)     max: 46989 Points
14479 Points (31%)
Super Pi mod 1.5 XS 1M - Super Pi mod 1.5 XS 1M *
20.2 s (4%)
7.2 s (2%)
Super Pi mod 1.5 XS 2M - Super Pi mod 1.5 XS 2M *
15.5 s (1%)
Super Pi Mod 1.5 XS 32M - Super Pi mod 1.5 XS 32M *
685 s (3%)
360.5 s (2%)
3DMark Vantage - 3DM Vant. Perf. CPU no Physx
min: 75591     avg: 79648     median: 80003 (61%)     max: 84938 Points
3DMark 11 - 3DM11 Performance Physics
17324 Points (43%)
min: 14512     avg: 20484     median: 21043.5 (52%)     max: 24451 Points
3DMark - 3DMark Ice Storm Physics
70388 Points (57%)
min: 78128     avg: 83169     median: 82567 (67%)     max: 89517 Points
3DMark - 3DMark Ice Storm Extreme Physics
min: 76234     avg: 83137     median: 82433.5 (67%)     max: 90527 Points
3DMark - 3DMark Ice Storm Unlimited Physics
min: 76690     avg: 84751     median: 85392 (69%)     max: 91451 Points
3DMark - 3DMark Cloud Gate Physics
18593 Points (47%)
min: 16889     avg: 21197     median: 21362 (54%)     max: 23560 Points
3DMark - 3DMark Fire Strike Standard Physics
25557 Points (46%)
min: 24944     avg: 32689     median: 32575 (58%)     max: 35932 Points
3DMark - 3DMark Time Spy CPU
min: 8552     avg: 11730     median: 11913 (50%)     max: 13232 Points
Geekbench 6.5 - Geekbench 6.5 Single-Core
2585 Points (63%)
2290 Points (55%)
2166 Points (52%)
Geekbench 6.5 - Geekbench 6.5 Multi-Core
11679 Points (45%)
13339 Points (52%)
12050 Points (47%)
Geekbench 5.5 - Geekbench 5.1 - 5.5 64 Bit Single-Core
min: 1721     avg: 1766     median: 1765.5 (67%)     max: 1810 Points
min: 1137     avg: 1574     median: 1604 (61%)     max: 1737 Points
Geekbench 5.5 - Geekbench 5.1 - 5.5 64 Bit Multi-Core
min: 10269     avg: 10787     median: 10786.5 (19%)     max: 11304 Points
min: 6512     avg: 11914     median: 11765 (21%)     max: 15119 Points
10856 Points (19%)
Geekbench 5.0 - Geekbench 5.0 64 Bit Single-Core
min: 1162     avg: 1534     median: 1588 (7%)     max: 1670 Points
1526 Points (7%)
Geekbench 5.0 - Geekbench 5.0 64 Bit Multi-Core
min: 6534     avg: 12041     median: 12813 (40%)     max: 14983 Points
10836 Points (34%)
Geekbench 4.4 - Geekbench 4.1 - 4.4 64 Bit Single-Core
min: 5479     avg: 6880     median: 7034 (70%)     max: 7392 Points
7187 Points (72%)
Geekbench 4.4 - Geekbench 4.1 - 4.4 64 Bit Multi-Core
min: 29337     avg: 48522     median: 52798.5 (52%)     max: 57137 Points
43687 Points (43%)
Mozilla Kraken 1.1 - Kraken 1.1 Total Score *
603 ms (1%)
min: 564     avg: 620     median: 582.5 (1%)     max: 905 ms
Sunspider - Sunspider 1.0 Total Score *
124.2 ms (1%)
Octane V2 - Octane V2 Total Score
71212 Points (52%)
WebXPRT 3 - WebXPRT 3 Score
254 Points (46%)
min: 178     avg: 266.4     median: 279 (50%)     max: 307 Points
CrossMark - CrossMark Overall
1775 Points (66%)
min: 1514     avg: 1579     median: 1580 (59%)     max: 1619 Points
1770 Points (66%)
Power Consumption - Prime95 Power Consumption - external Monitor *
210 Watt (36%)
min: 105.1     avg: 154.2     median: 122 (21%)     max: 235.6 Watt
Power Consumption - Cinebench R15 Multi Power Consumption - external Monitor *
244 Watt (45%)
min: 106.6     avg: 152.1     median: 114 (21%)     max: 235.8 Watt
Power Consumption - Idle Power Consumption - external Monitor *
min: 63.1     avg: 75     median: 73.6 (49%)     max: 88.3 Watt
102 Watt (67%)
Power Consumption - Power Efficiency - Cinebench R15 Multi external Monitor
9.6 Points per Watt (7%)
min: 15.8     avg: 17.3     median: 16.4 (12%)     max: 19.8 Points per Watt
11.5 Points per Watt (9%)

Average Benchmarks Intel Core i7-11700K → 100% n=32

Average Benchmarks AMD Ryzen 9 5900X → 126% n=32

Average Benchmarks AMD Ryzen 7 5800X3D → 110% n=32

- Range of benchmark values for this graphics card
red legend - Average benchmark values for this graphics card
* Smaller numbers mean a higher performance
1 This benchmark is not used for the average calculation

v1.34
log 11. 17:10:55

#0 ran 0s before starting gpusingle class +0s ... 0s

#1 checking url part for id 12999 +0s ... 0s

#2 checking url part for id 12782 +0s ... 0s

#3 checking url part for id 14390 +0s ... 0s

#4 redirected to Ajax server, took 1760195455s time from redirect:0 +0s ... 0s

#5 did not recreate cache, as it is less than 5 days old! Created at Fri, 10 Oct 2025 05:18:33 +0200 +0s ... 0s

#6 composed specs +0.005s ... 0.005s

#7 did output specs +0s ... 0.005s

#8 getting avg benchmarks for device 12999 +0.004s ... 0.009s

#9 got single benchmarks 12999 +0.004s ... 0.013s

#10 getting avg benchmarks for device 12782 +0.004s ... 0.017s

#11 got single benchmarks 12782 +0.046s ... 0.063s

#12 getting avg benchmarks for device 14390 +0.004s ... 0.067s

#13 got single benchmarks 14390 +0.006s ... 0.073s

#14 got avg benchmarks for devices +0s ... 0.073s

#15 min, max, avg, median took s +0.073s ... 0.146s

#16 return log +0s ... 0.146s

Please share our article, every link counts!
Mail Logo
> Expert Reviews and News on Laptops, Smartphones and Tech Innovations > Benchmarks / Tech > Processor Comparison - Head 2 Head
Redaktion, 2017-09- 8 (Update: 2023-07- 1)