Notebookcheck Logo
Teaser

Lenovo ThinkPad X13 Detachable Gen 1 review: Extraordinary in its ordinary

One of Lenovo's best detachables.

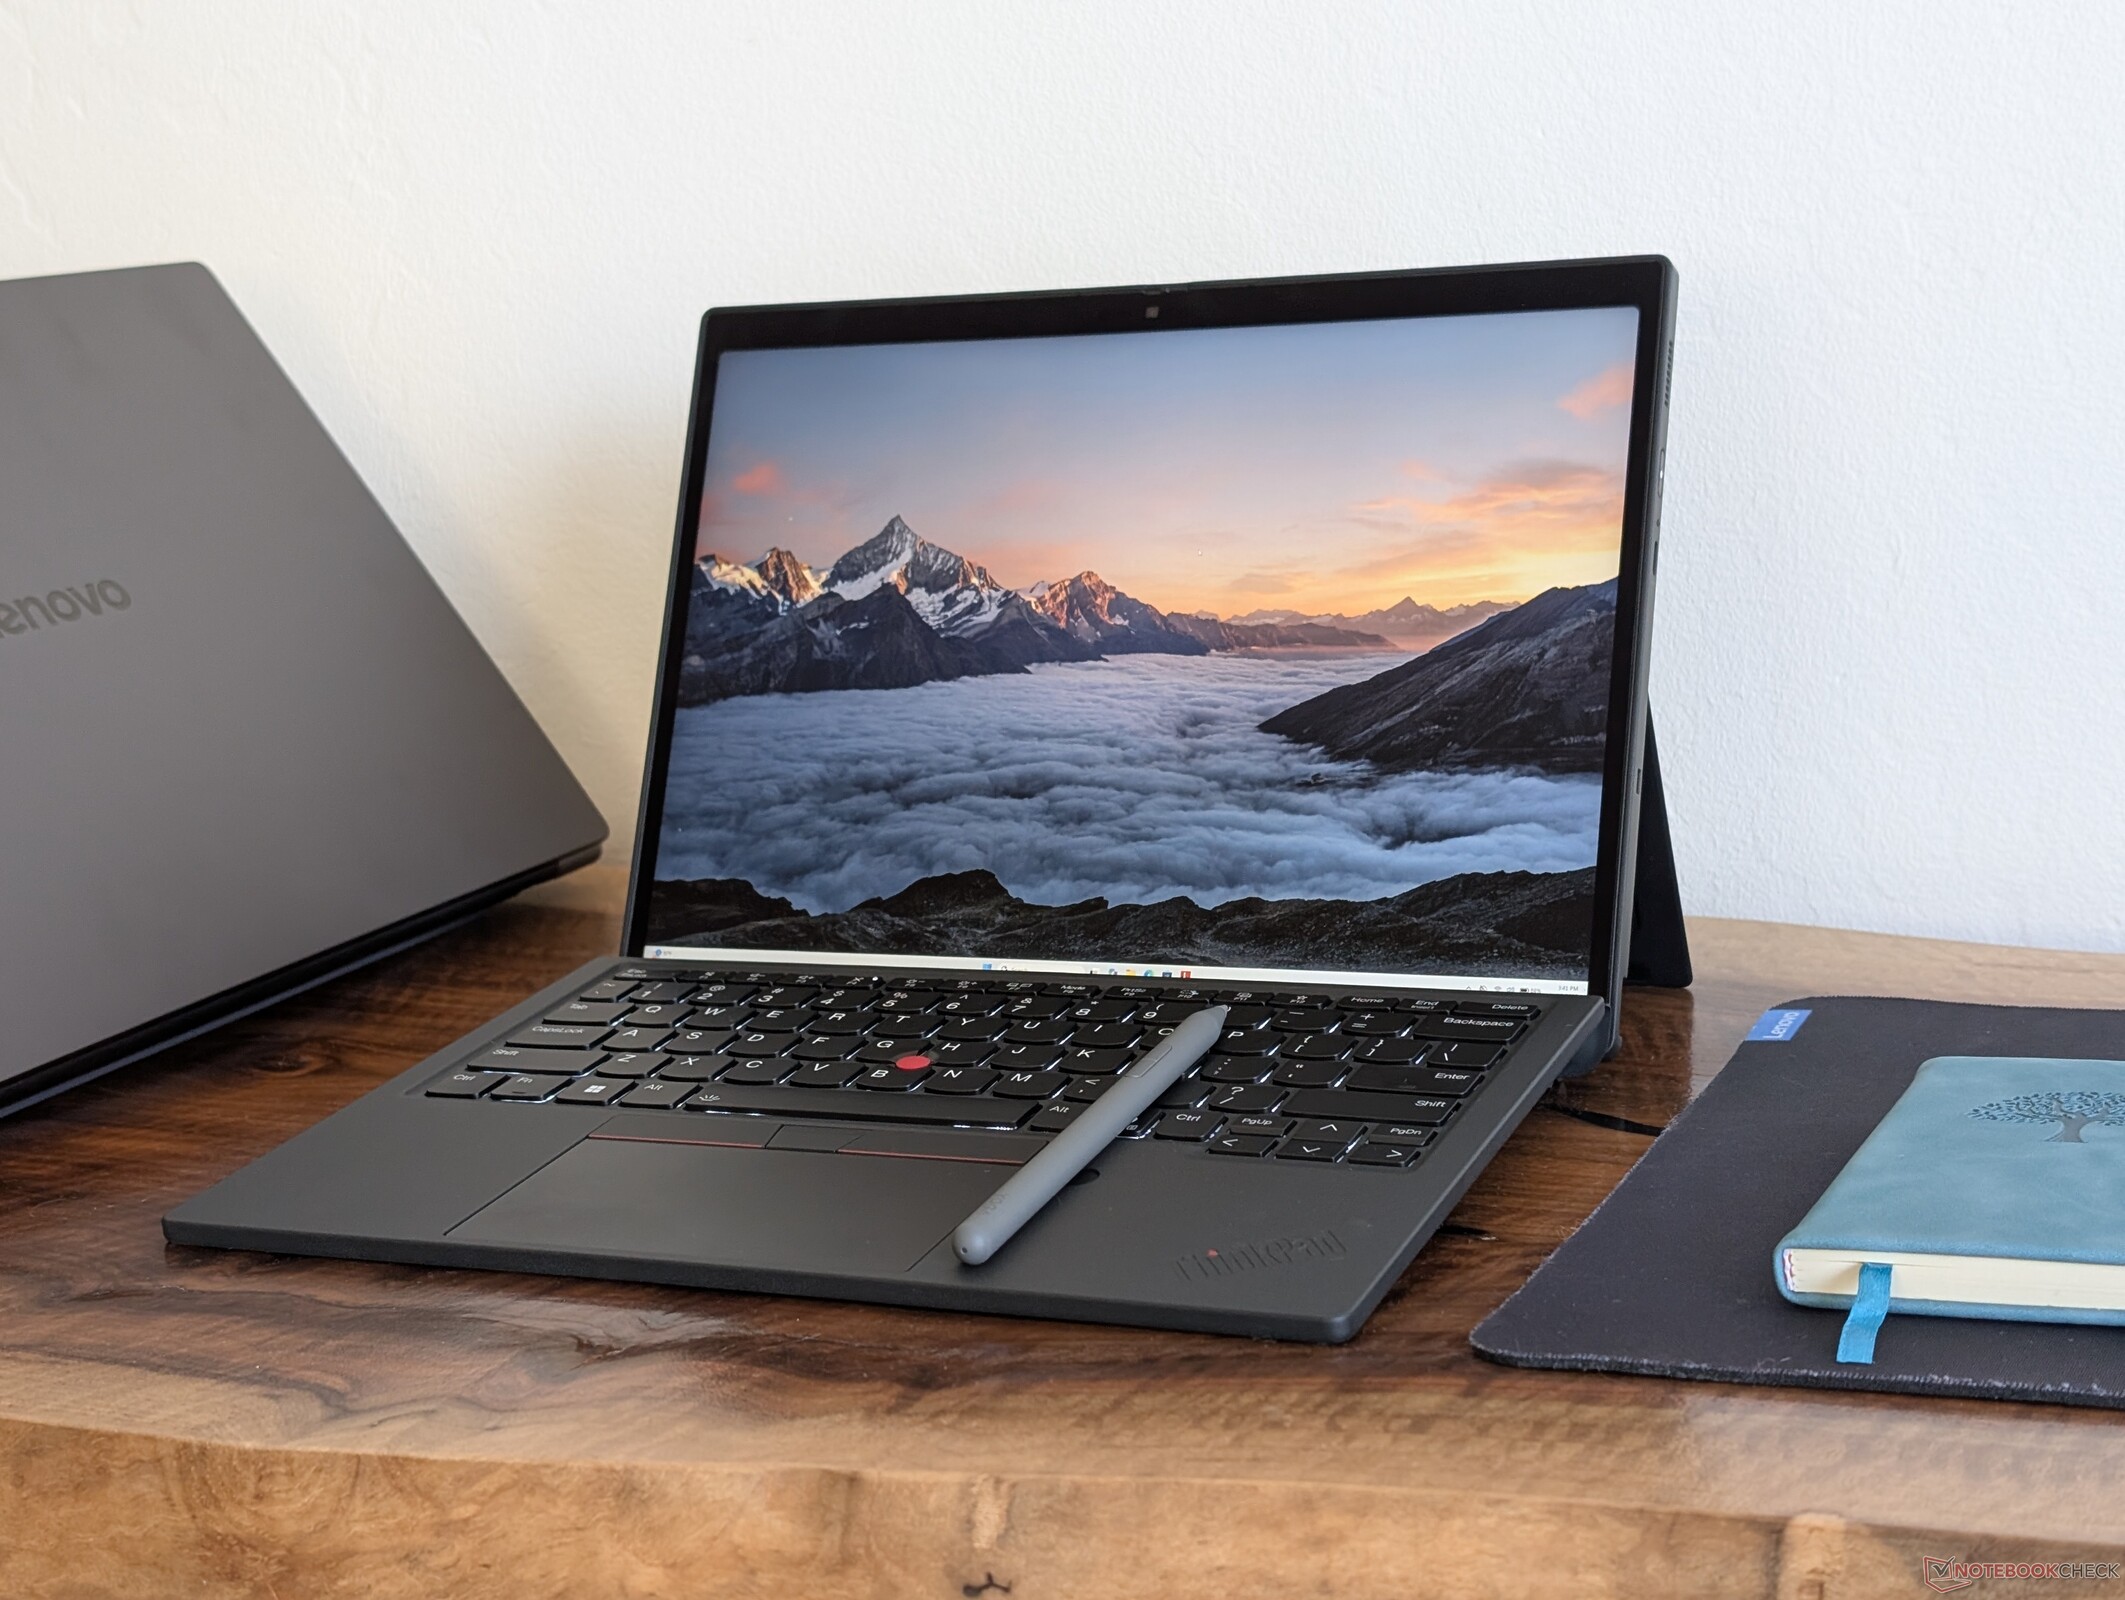
No folding screens or distracting gimmicks — The ThinkPad X13 Detachable is a purely traditional detachable done right that business users or professionals can appreciate.
Allen Ngo 👁 Published
Convertible / 2-in-1 Business Panther Lake Touchscreen

Verdict — When "Boring" Becomes A Compliment

The ThinkPad X13 Detachable Gen 1 is proof that rolling or folding screens aren't necessary for a great 2-in-1. It focuses on the core basics and excels at the things that really matter like build rigidity, image quality, ease-of-use, and a surprisingly good folio keyboard for a better-than-expected typing experience. Even the touchscreen is better and brighter than expected for an IPS panel with faster refresh rates and a higher native resolution than many other Windows tablets or 2-in-1s. While marketed as a ThinkPad, this is a model we can wholeheartedly recommend for casual users too simply because of its basic strengths.

Download your licensed rating image as SVG / PNG

Drawbacks are relatively minor depending on the usage scenario. Turbo Boost performance in particular is limited while HDR is not supported. Speaker quality is weaker than most HP Elite models and the lack of USB-A can be a thorn when the Surface Pro is able to include one. An easier way to access the SSD — a la the Surface Pro — would have also improved serviceability. If you do a lot of graphics editing or run CPU heavy tasks, then non-detachables like the Dell Pro 7 13 convertible or ThinkPad X13 Gen 7 can provide faster performance.

Pros

+ bright 120 Hz IPS touchscreen with full sRGB colors
+ one of the more comfortable folio keyboards
+ strong design with firm kickstand
+ good battery life

Cons

- weak Turbo Boost and GPU performance
- brightness uniformity could be better
- no P3 colors or HDR support
- limited ports; USB-C only
- tinny audio quality

Price and Availability

Lenovo is now shipping the ThinkPad X13 Detachable Gen 1 starting at $2230 up to $3150 as configured for this review.

Amazon Logo
  • $599.99 price as of 2026-11-17 18:04 UTC.
    Lenovo ThinkPad X13 Yoga Gen 2 2-in-1 Business Laptop (13.3" Touchscreen, Intel Core i7-1185G7, 32GB RAM, 512GB SSD), Backlit Keyboard, Fingerprint, Windows 11 Pro, Black (Renewed)
  • $291.00 price as of 2026-11-17 18:04 UTC.
    Lenovo ThinkPad X13 Gen1 Touchscreen Laptop, 13.3" Notebook Computer, 10th Gen Quad-Core i7-10610U up to 4.9 GHz, 16GB RAM, 256GB SSD, HDMI, Backlit Keyboard, Windows 11 Pro(Renewed)
  • $1,999.99 price as of 2026-11-17 18:04 UTC.
    Lenovo 2026 ThinkPad X1 Carbon Gen 14 with Core Ultra 5 335, OLED Non-Touch | 512GB SSD, 32GB LPDDR5X-8533MT/s RAM, Intel Series 3 vPro Processor, 14" 2.8K VRR 30-120Hz OLED, 3x Thunderbolt 4 -21V7006DUS

The ThinkPad X13 Detachable Gen 1 is the first detachable in the long-running ThinkPad X13 series. Unlike the ThinkPad T series, X series models tend to be even lighter and smaller albeit with more composite chassis materials and more limited configuration options.

Our test unit is the highest-end SKU with the Core Ultra 7 365 vPro CPU and 32 GB of soldered RAM for approximately $3150. Lesser SKUs start with the Core Ultra 5 332 instead, but all options come standard with vPro and the same 2.8K 120 Hz IPS touchscreen.

More Lenovo reviews:

Specifications

Lenovo ThinkPad X13 Detachable Gen 1 (ThinkPad X13 Series)
Processor
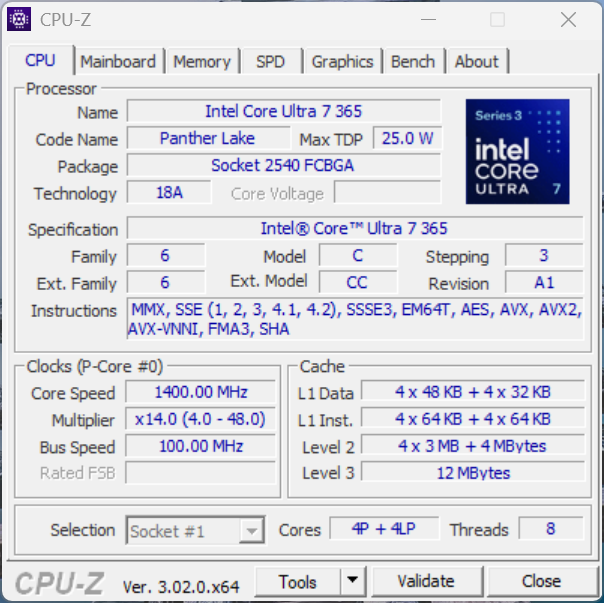
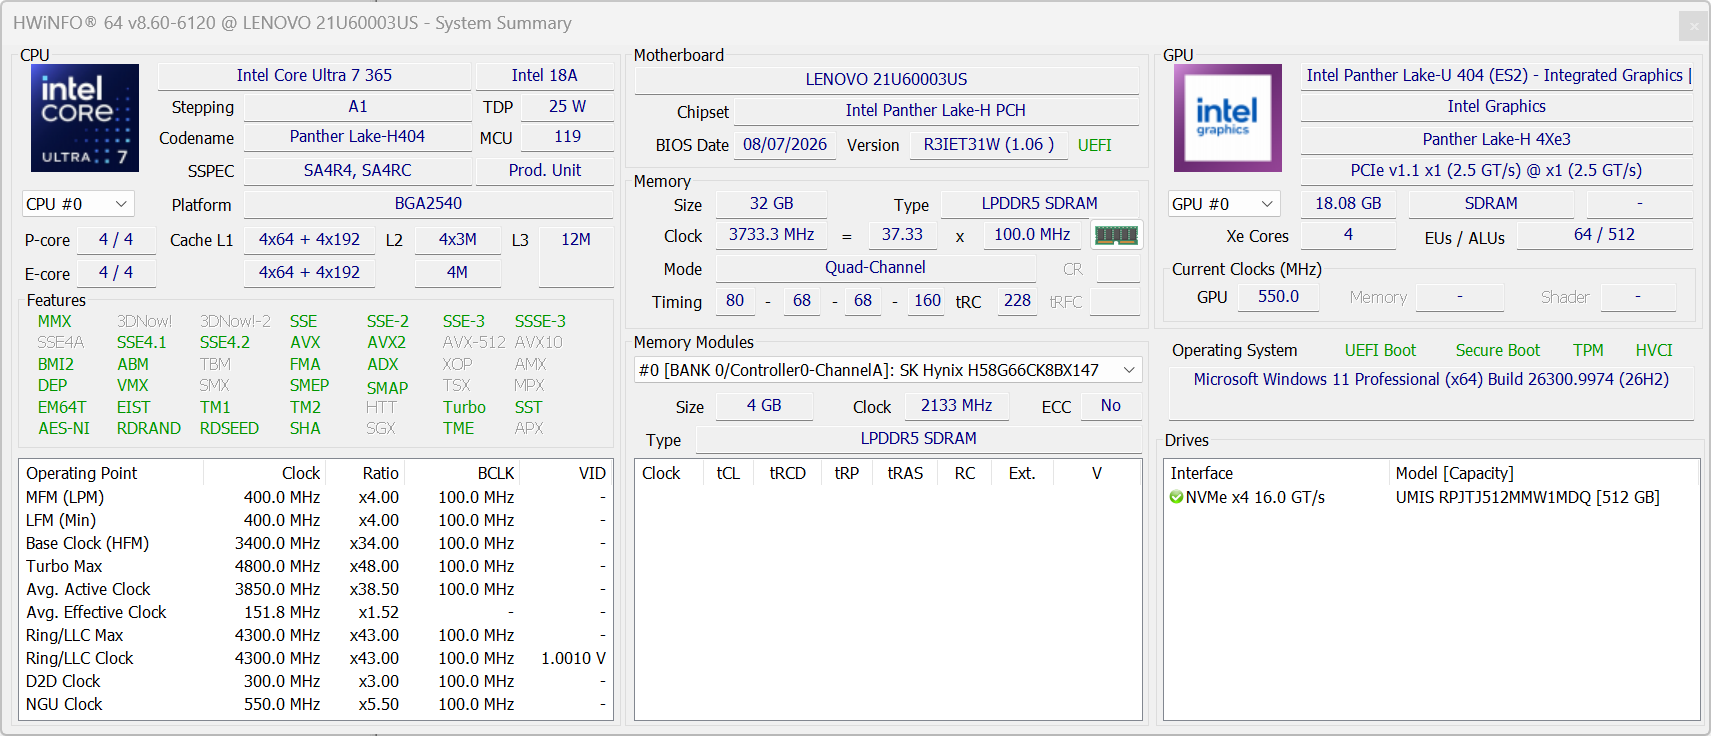
Intel Core Ultra 7 365 8c/8t, 4 x 4.8 GHz Intel Cougar Cove P-Core, 4 x 3.6 GHz Intel Darkmont LP E-Core, 37 W PL2 / Short Burst, 15 W PL1 / Sustained, Panther Lake
Graphics adapter
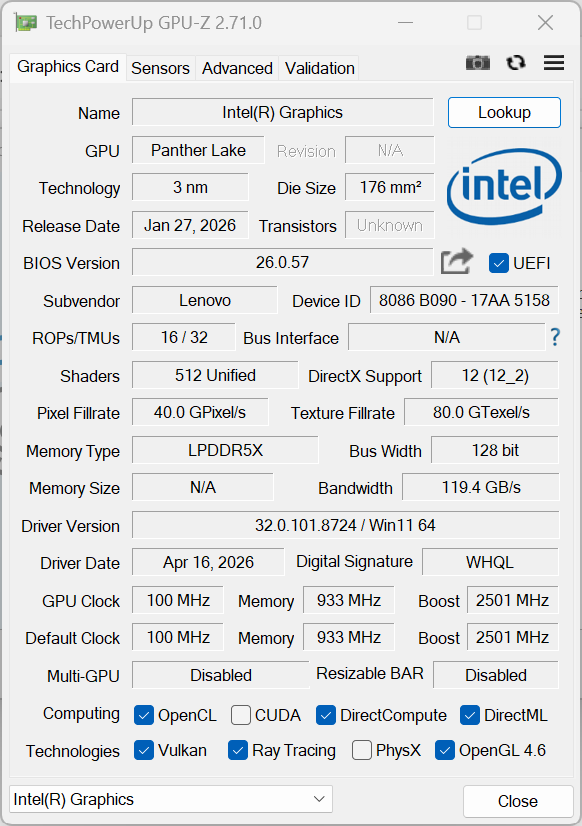
Intel Graphics 4 Xe3 Panther Lake iGPU, Core: 1950 MHz, LPDDR5X, 32.0.101.8724
Memory
32 GB 
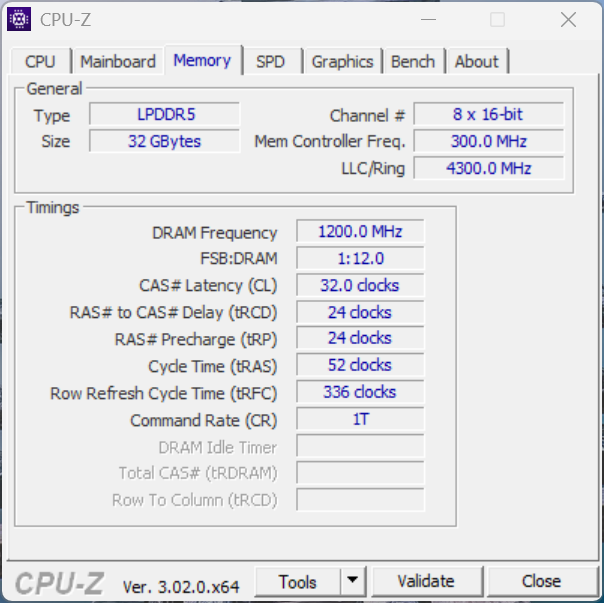
, LPDDR5X-7467, Soldered
Display
13.00 inch 3:2, 2880 x 1920 pixel 266 PPI, 10-point capacitive, native pen support, NS130A10-M60, IPS, glossy: yes, detachable screen, 120 Hz
Mainboard
Intel Panther Lake-H PCH
Soundcard
Intel Panther Lake-H PCH - High Definition Audio - AVS (Audio, Voice, Speech)
Connections
2 USB4 40 Gbps, 2 Thunderbolt 4, USB-C Power Delivery (PD), 2 DisplayPort, Audio Connections: 3.5 mm combo, 1 Fingerprint Reader, Sensors: Accelerometer, Gyroscope, Hall
Networking
Intel Wi-Fi 7 BE211 320MHz (a/b/g/n = Wi-Fi 4/ac = Wi-Fi 5/ax = Wi-Fi 6/ Wi-Fi 6E 6 GHz be = Wi-Fi 7), Bluetooth 5.4
Size
height x width x depth (in mm): 9.3 x 290 x 210 ( = 0.37 x 11.42 x 8.27 in)
Battery
45 Wh Lithium-Polymer
Operating System
Microsoft Windows 11 Pro
Camera
Primary Camera: 8 MPix
Secondary Camera: 5 MPix w/ IR + privacy shutter
Additional features
Speakers: 2x 2 W, Dolby Atmos, Keyboard: Chiclet, Keyboard Light: yes, Slim Pen 2, Folio keyboard, Lenovo Commercial Advantage, 12 Months Warranty
Weight
827 g ( = 29.17 oz / 1.82 pounds), Power Supply: 245 g ( = 8.64 oz / 0.54 pounds)
Price
3150 USD
Note: The manufacturer may use components from different suppliers including display panels, drives or memory sticks with similar specifications.


Case

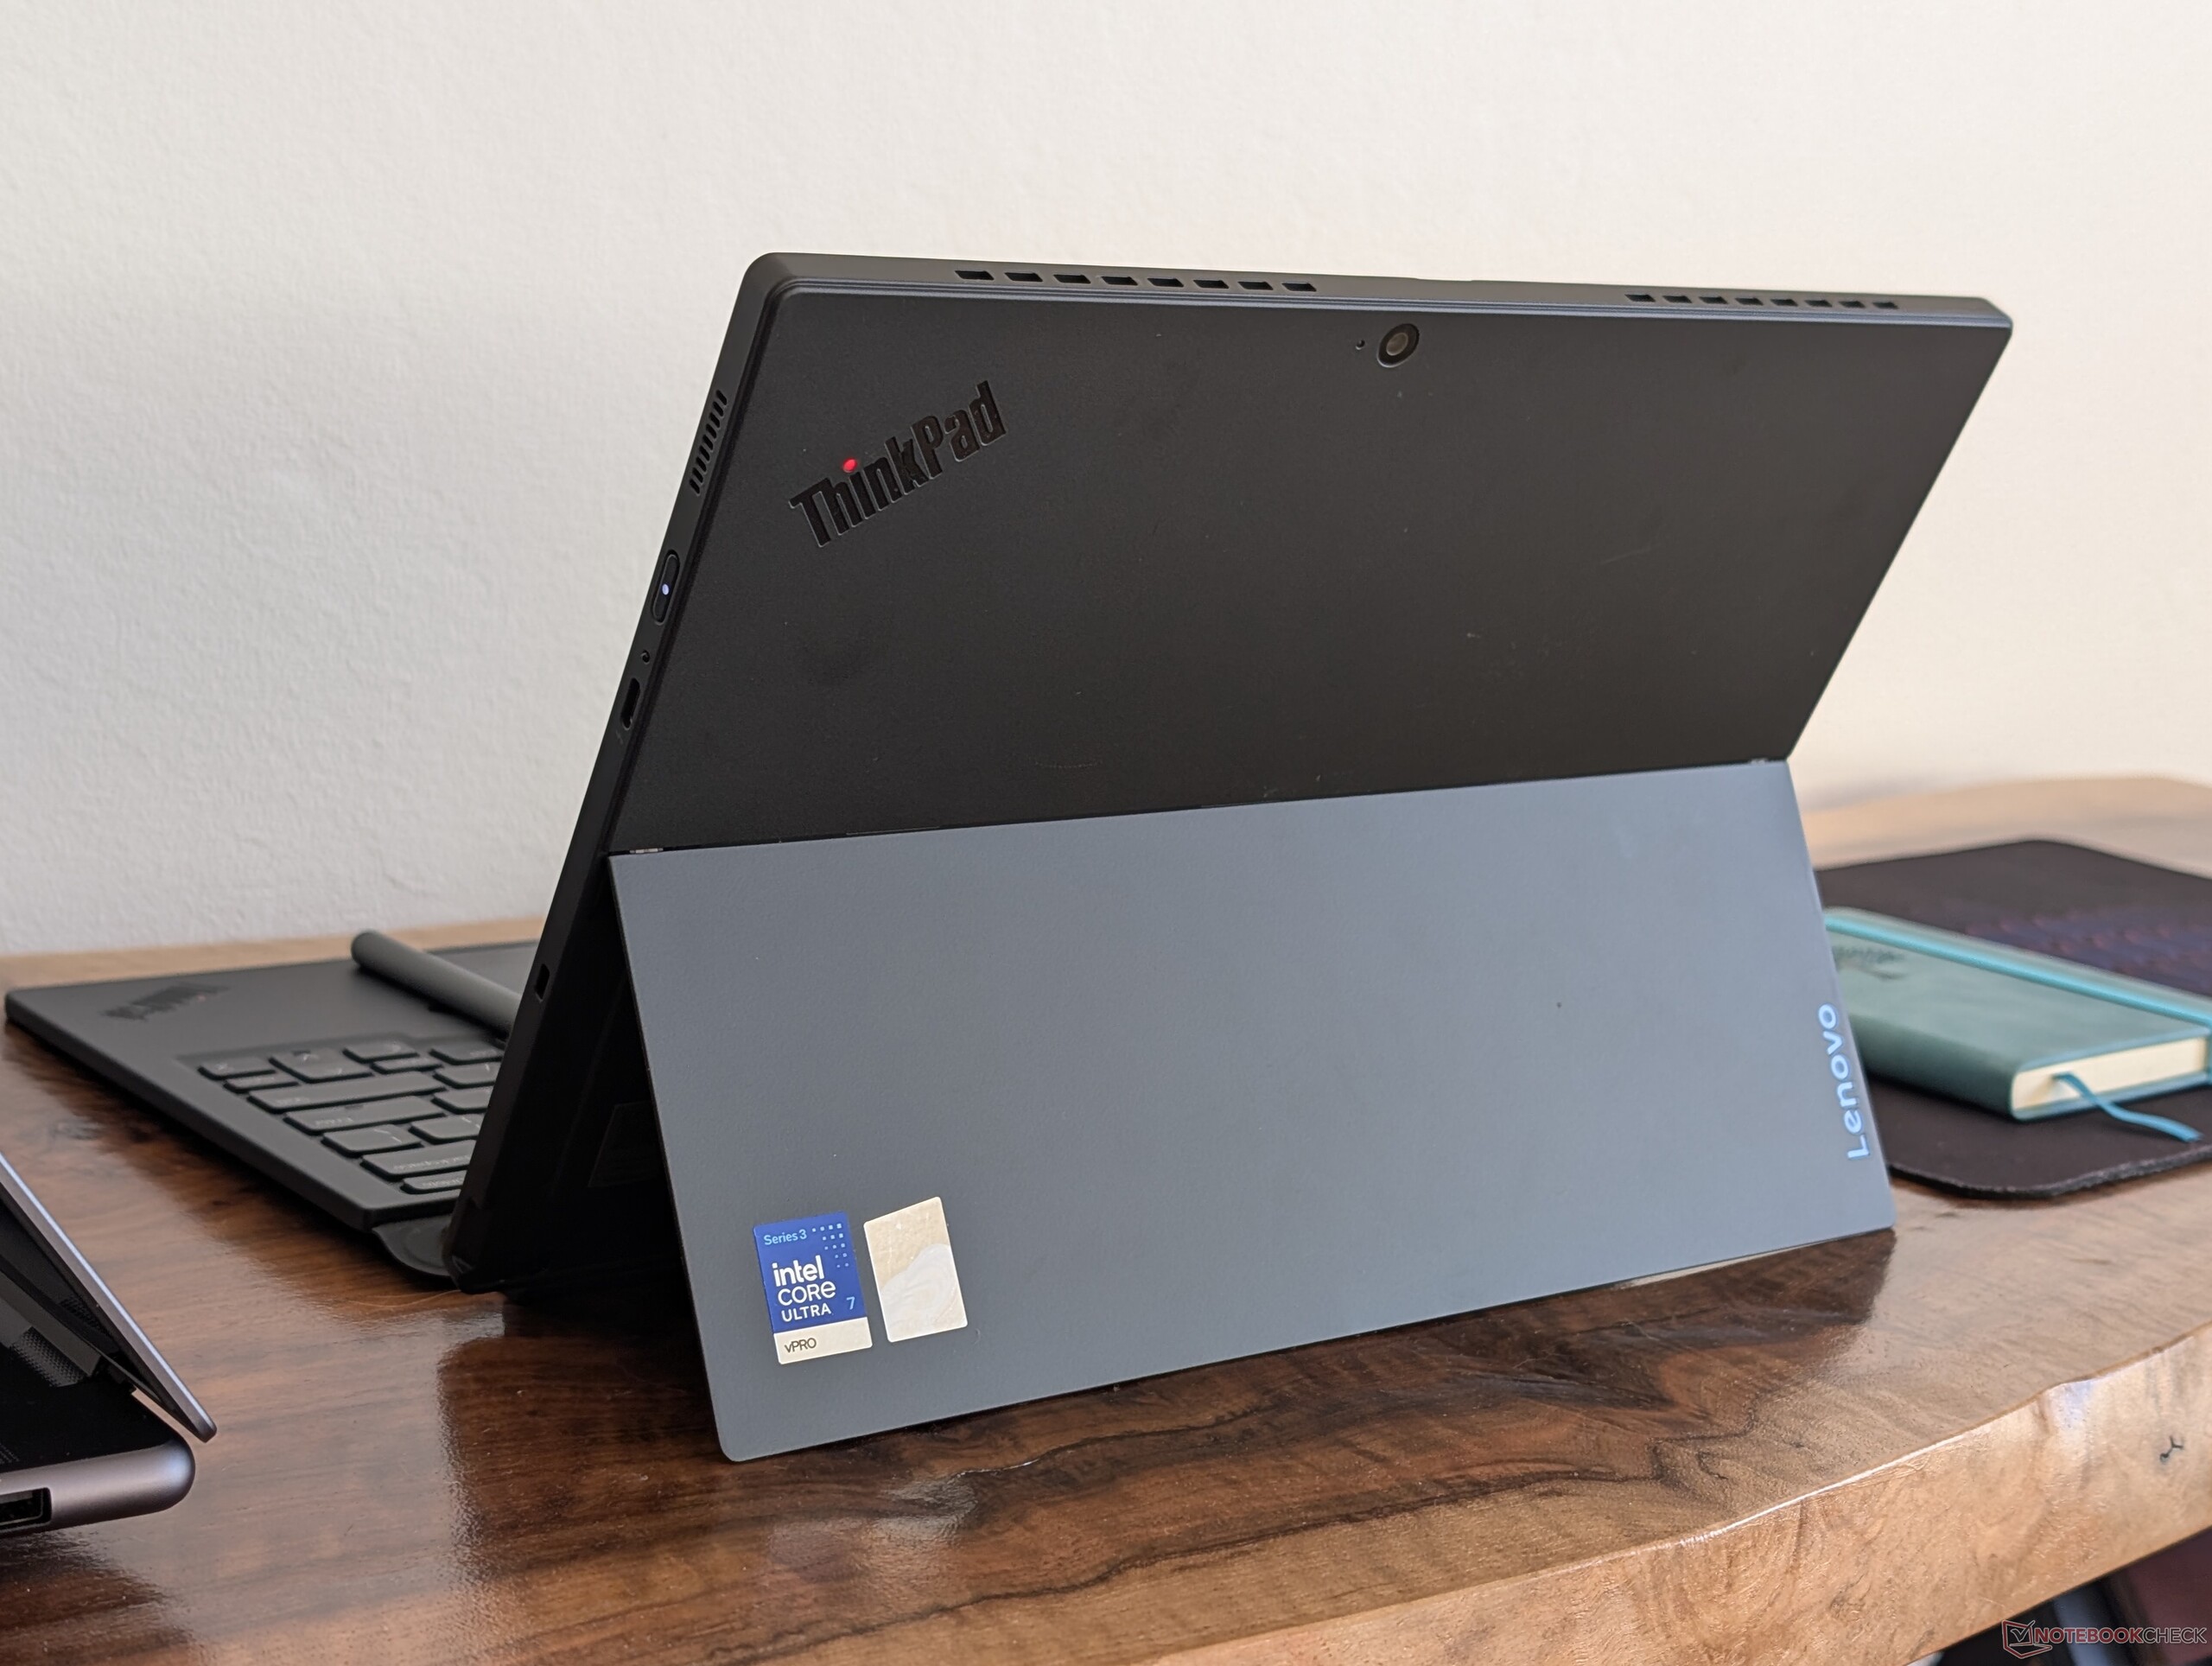
The metal alloy back and relatively thick display bezels make for an unyielding design worthy of the ThinkPad name. Even the keyboard flexes much less than expected due to its uniform thickness and glass fiber makeup.

Tablet290 x 210 x 9.3 mm827 g
Tablet with folio keyboard290 x 215 x 15.2 mm1186 g

Size Comparison

❌
300 mm / 11.8 in 216.3 mm / 8.52 in 17.95 mm / 0.707 in 1.4 kg3.13 lbs301.8 mm / 11.9 in 215.2 mm / 8.47 in 15.5 mm / 0.61 in 1.4 kg3.17 lbs299 mm / 11.8 in 210 mm / 8.27 in 15.9 mm / 0.626 in 888 g1.958 lbs296 mm / 11.7 in 208.9 mm / 8.22 in 17.2 mm / 0.677 in 1.1 kg2.52 lbs299 mm / 11.8 in 207 mm / 8.15 in 13 mm / 0.512 in 1.1 kg2.43 lbs290 mm / 11.4 in 210 mm / 8.27 in 9.3 mm / 0.3661 in 827 g1.823 lbs297 mm / 11.7 in 210 mm / 8.27 in 1 mm / 0.03937 in 5.7 g0.01257 lbs

Connectivity

Right: Power button, USB-C Thunderbolt 4 w/ DisplayPort 2.1 + Power Delivery (65 W), Kensington lock
Bottom: Magnetic pins for keyboard folio attachment
Left: Volume rocker, USB-C Thunderbolt 4 w/ DisplayPort 2.1 + Power Delivery (65 W), 3.5 mm headset
Top: Ventilation grilles

Communication

Networking
iperf3 transmit Wi-Fi6/7 RT-BE96U
Lenovo ThinkPad X13 Detachable Gen 1
Intel Wi-Fi 7 BE211 320MHz
3795 (3473min - 3989max) MBit/s
MSI Prestige 13 AI+ A3MG
Intel® Killer™ Wi-Fi 7 BE1775s
2156 (1157min - 2458max) MBit/s -43%
Lenovo ThinkPad X13 Gen 7 AMD
Mediatek Wi-Fi 7 MT7925 Wireless LAN Card
1703 (819min - 1820max) MBit/s -55%
iperf3 receive Wi-Fi6/7 RT-BE96U
Lenovo ThinkPad X13 Detachable Gen 1
Intel Wi-Fi 7 BE211 320MHz
2619 (2378min - 2704max) MBit/s
MSI Prestige 13 AI+ A3MG
Intel® Killer™ Wi-Fi 7 BE1775s
2236 (2052min - 2301max) MBit/s -15%
Lenovo ThinkPad X13 Gen 7 AMD
Mediatek Wi-Fi 7 MT7925 Wireless LAN Card
1892 (1806min - 1919max) MBit/s -28%
iperf3 receive AXE11000 6GHz
Dell Pro 7 13 2-in-1
Intel Wi-Fi 7 BE211 320MHz
1607 (1552min - 1645max) MBit/s
Dell Pro 13 Premium PA13250
Intel BE201 320MHz
1502 (1380min - 1534max) MBit/s
HP EliteBook 8 Flip G1i 13
Intel BE201 320MHz
1427 (1322min - 1556max) MBit/s
iperf3 transmit AXE11000 6GHz
Dell Pro 13 Premium PA13250
Intel BE201 320MHz
1673 (1594min - 1720max) MBit/s
Dell Pro 7 13 2-in-1
Intel Wi-Fi 7 BE211 320MHz
1625 (1344min - 1707max) MBit/s
HP EliteBook 8 Flip G1i 13
Intel BE201 320MHz
1144 (992min - 1311max) MBit/s
0100200300400500600700800900100011001200130014001500160017001800190020002100220023002400250026002700280029003000310032003300340035003600370038003900Tooltip
Lenovo ThinkPad X13 Detachable Gen 1; iperf3 transmit Wi-Fi6/7 RT-BE96U; iperf 3.1.3: Ø3795 (3473-3989) MBit/s
Lenovo ThinkPad X13 Detachable Gen 1; iperf3 receive Wi-Fi6/7 RT-BE96U; iperf 3.1.3: Ø2618 (2378-2704) MBit/s

Webcam

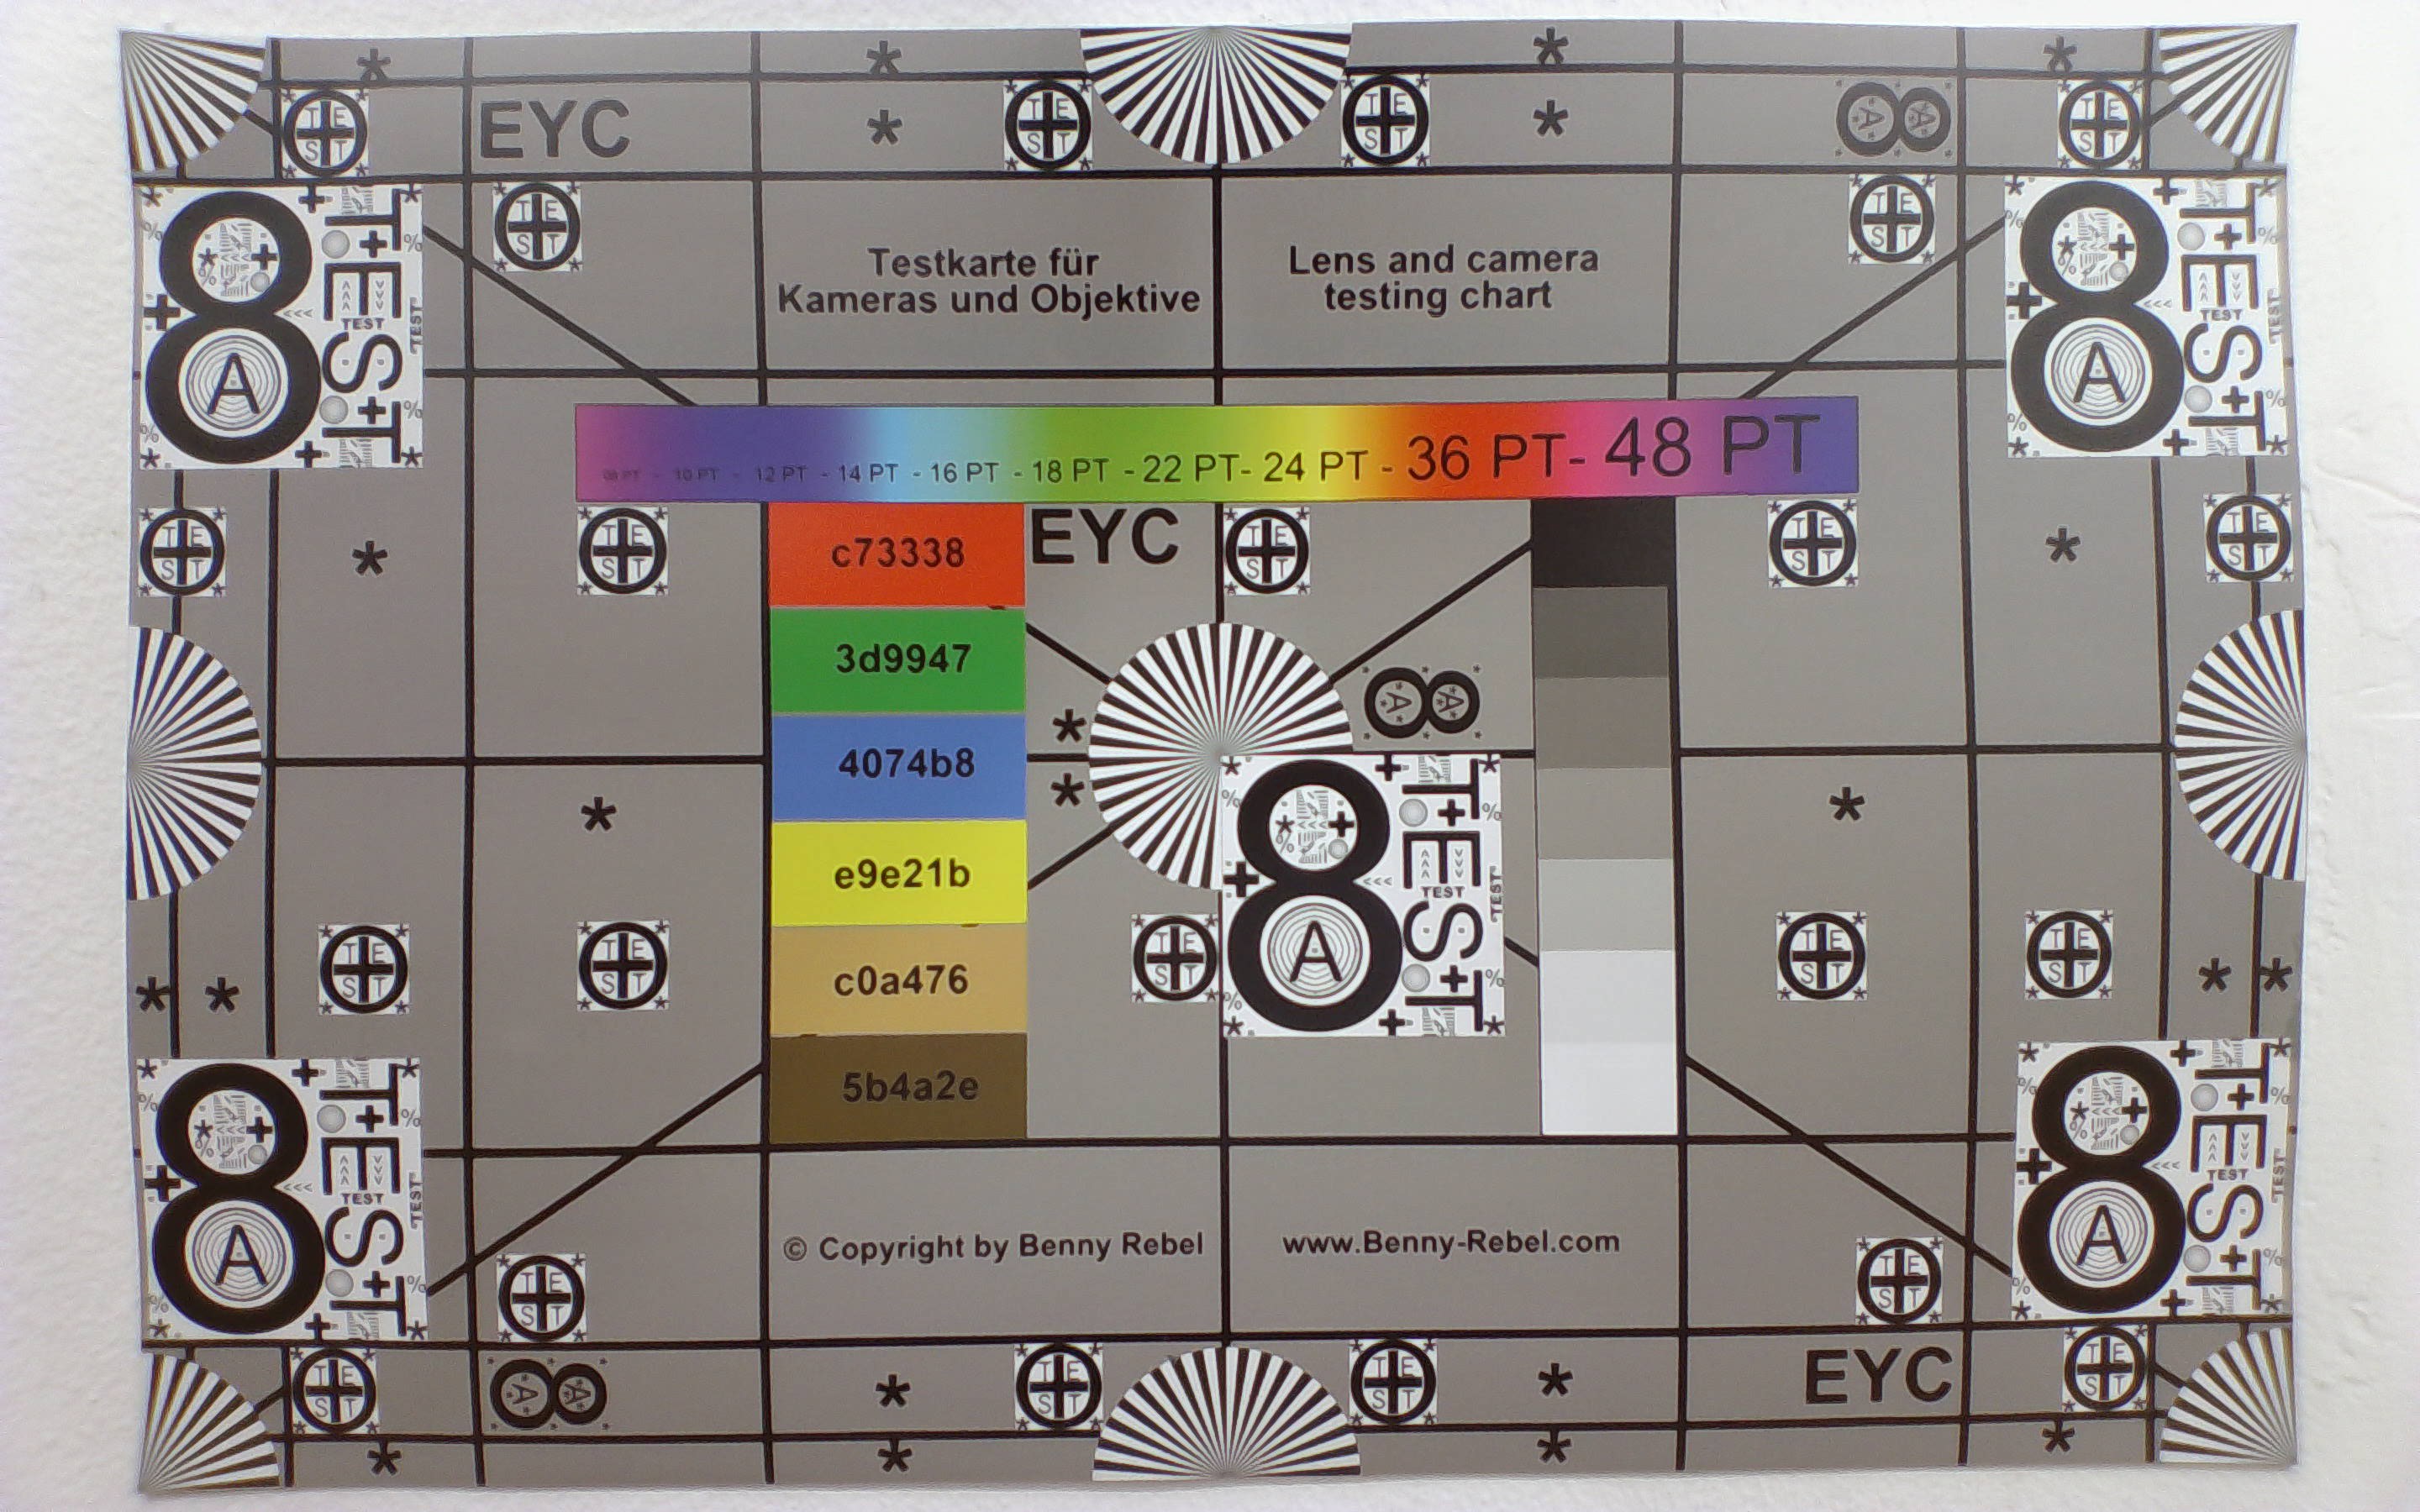
ColorChecker
4.3 ∆E
8.5 ∆E
9.4 ∆E
7.9 ∆E
10.6 ∆E
9.7 ∆E
3.8 ∆E
3.3 ∆E
16.9 ∆E
5 ∆E
6.2 ∆E
7.4 ∆E
3.4 ∆E
5.8 ∆E
14 ∆E
4 ∆E
7 ∆E
10.3 ∆E
10.8 ∆E
6.9 ∆E
6.3 ∆E
4.9 ∆E
4.6 ∆E
3.5 ∆E
ColorChecker Lenovo ThinkPad X13 Detachable Gen 1: 7.28 ∆E min: 3.25 - max: 16.94 ∆E

Maintenance

Components are not designed to be easily upgradeable. There is nevertheless a detailed disassembly manual here for replacing components or the SSD should the need arise.

Sustainability

All the cobalt and aluminum alloy found in the battery and kickstand are 100 percent recycled, respectively. The plastics and magnesium are up to 90 percent recycled depending on the component.

Accessories And Warranty

All configurations from Lenovo at the moment include the keyboard folio and Slim Pen 2 by default. Warranty is the base one-year in the US.

Input Devices
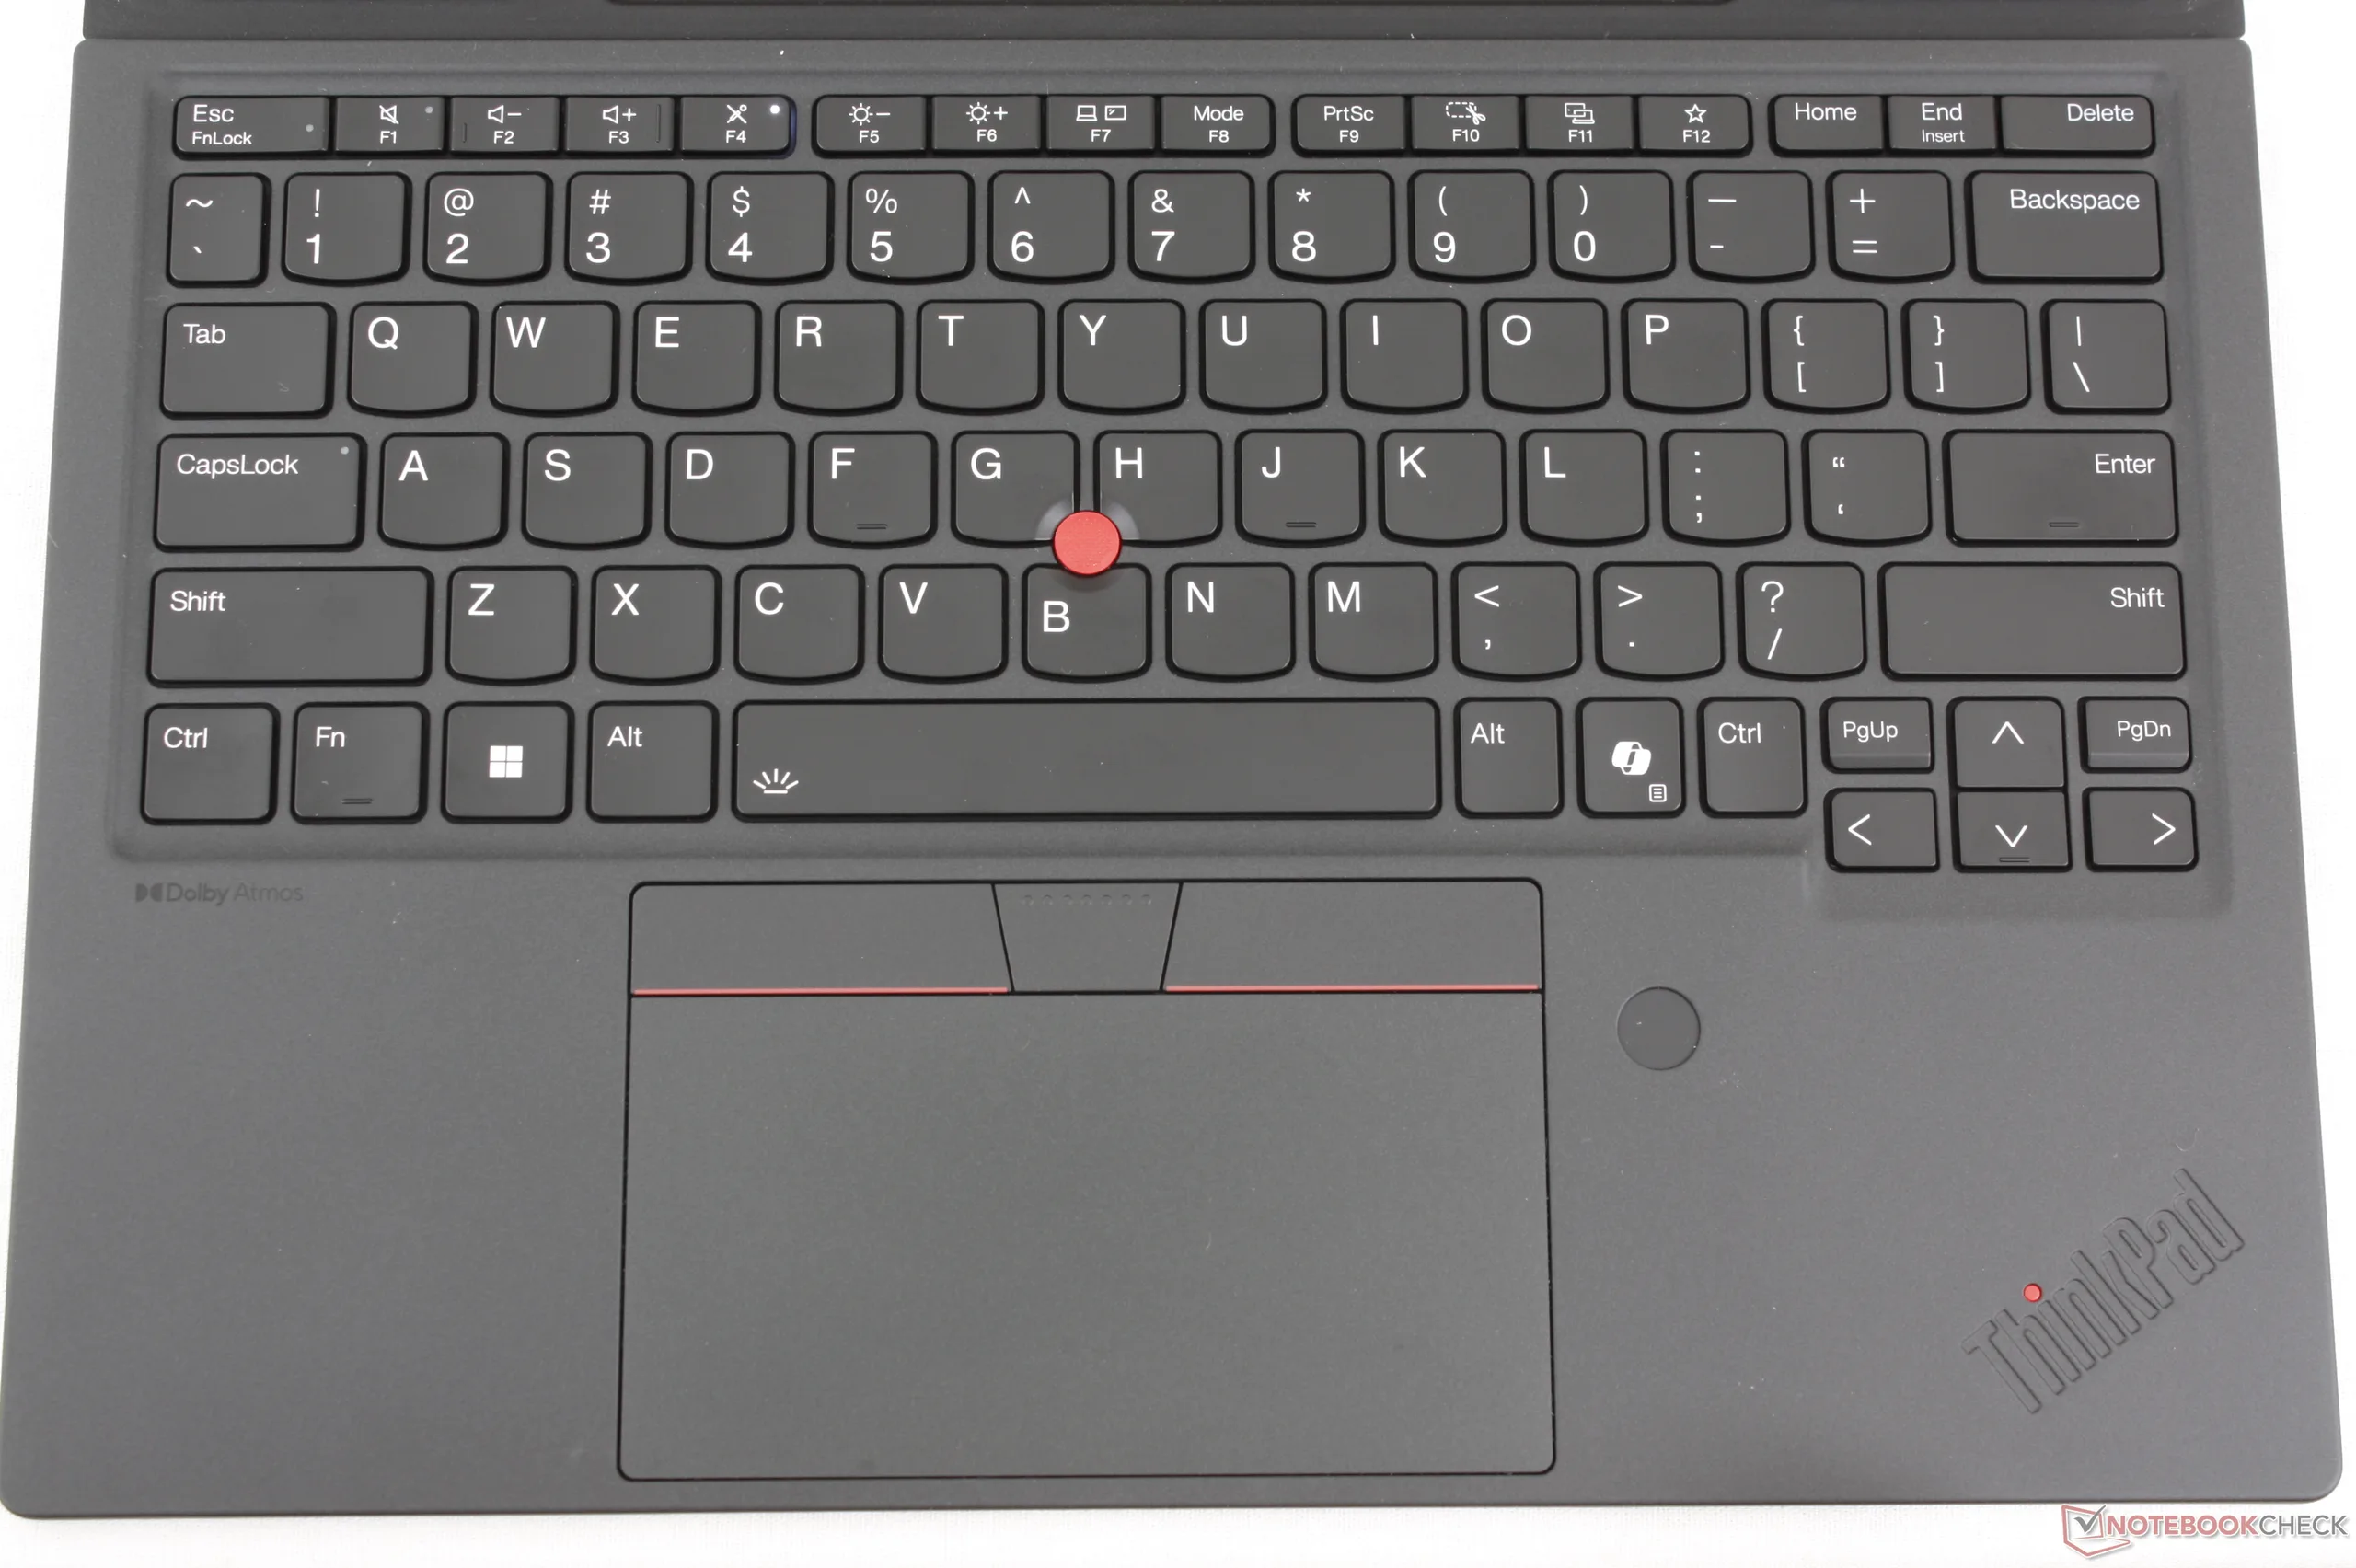
While not quite as solid as a traditional clamshell ThinkPad, the folio keyboard has clickier and deeper keys than most other detachable keyboards

Display

The touchscreen is nearly as bright as the screen on the Dell Pro 7 13 2-in-1 but with double the refresh rate for a smoother and more responsive UI. 
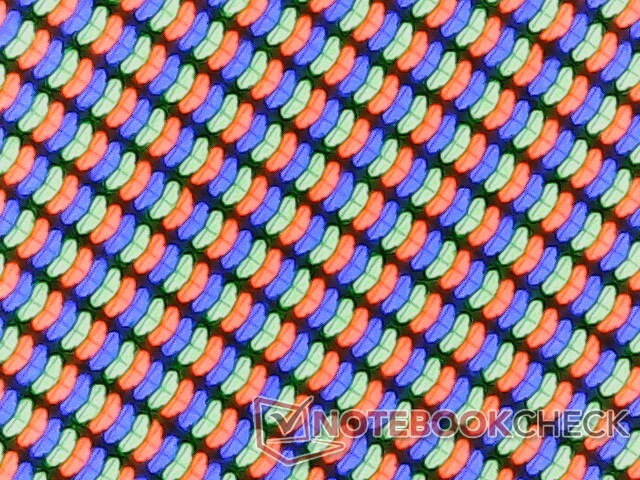
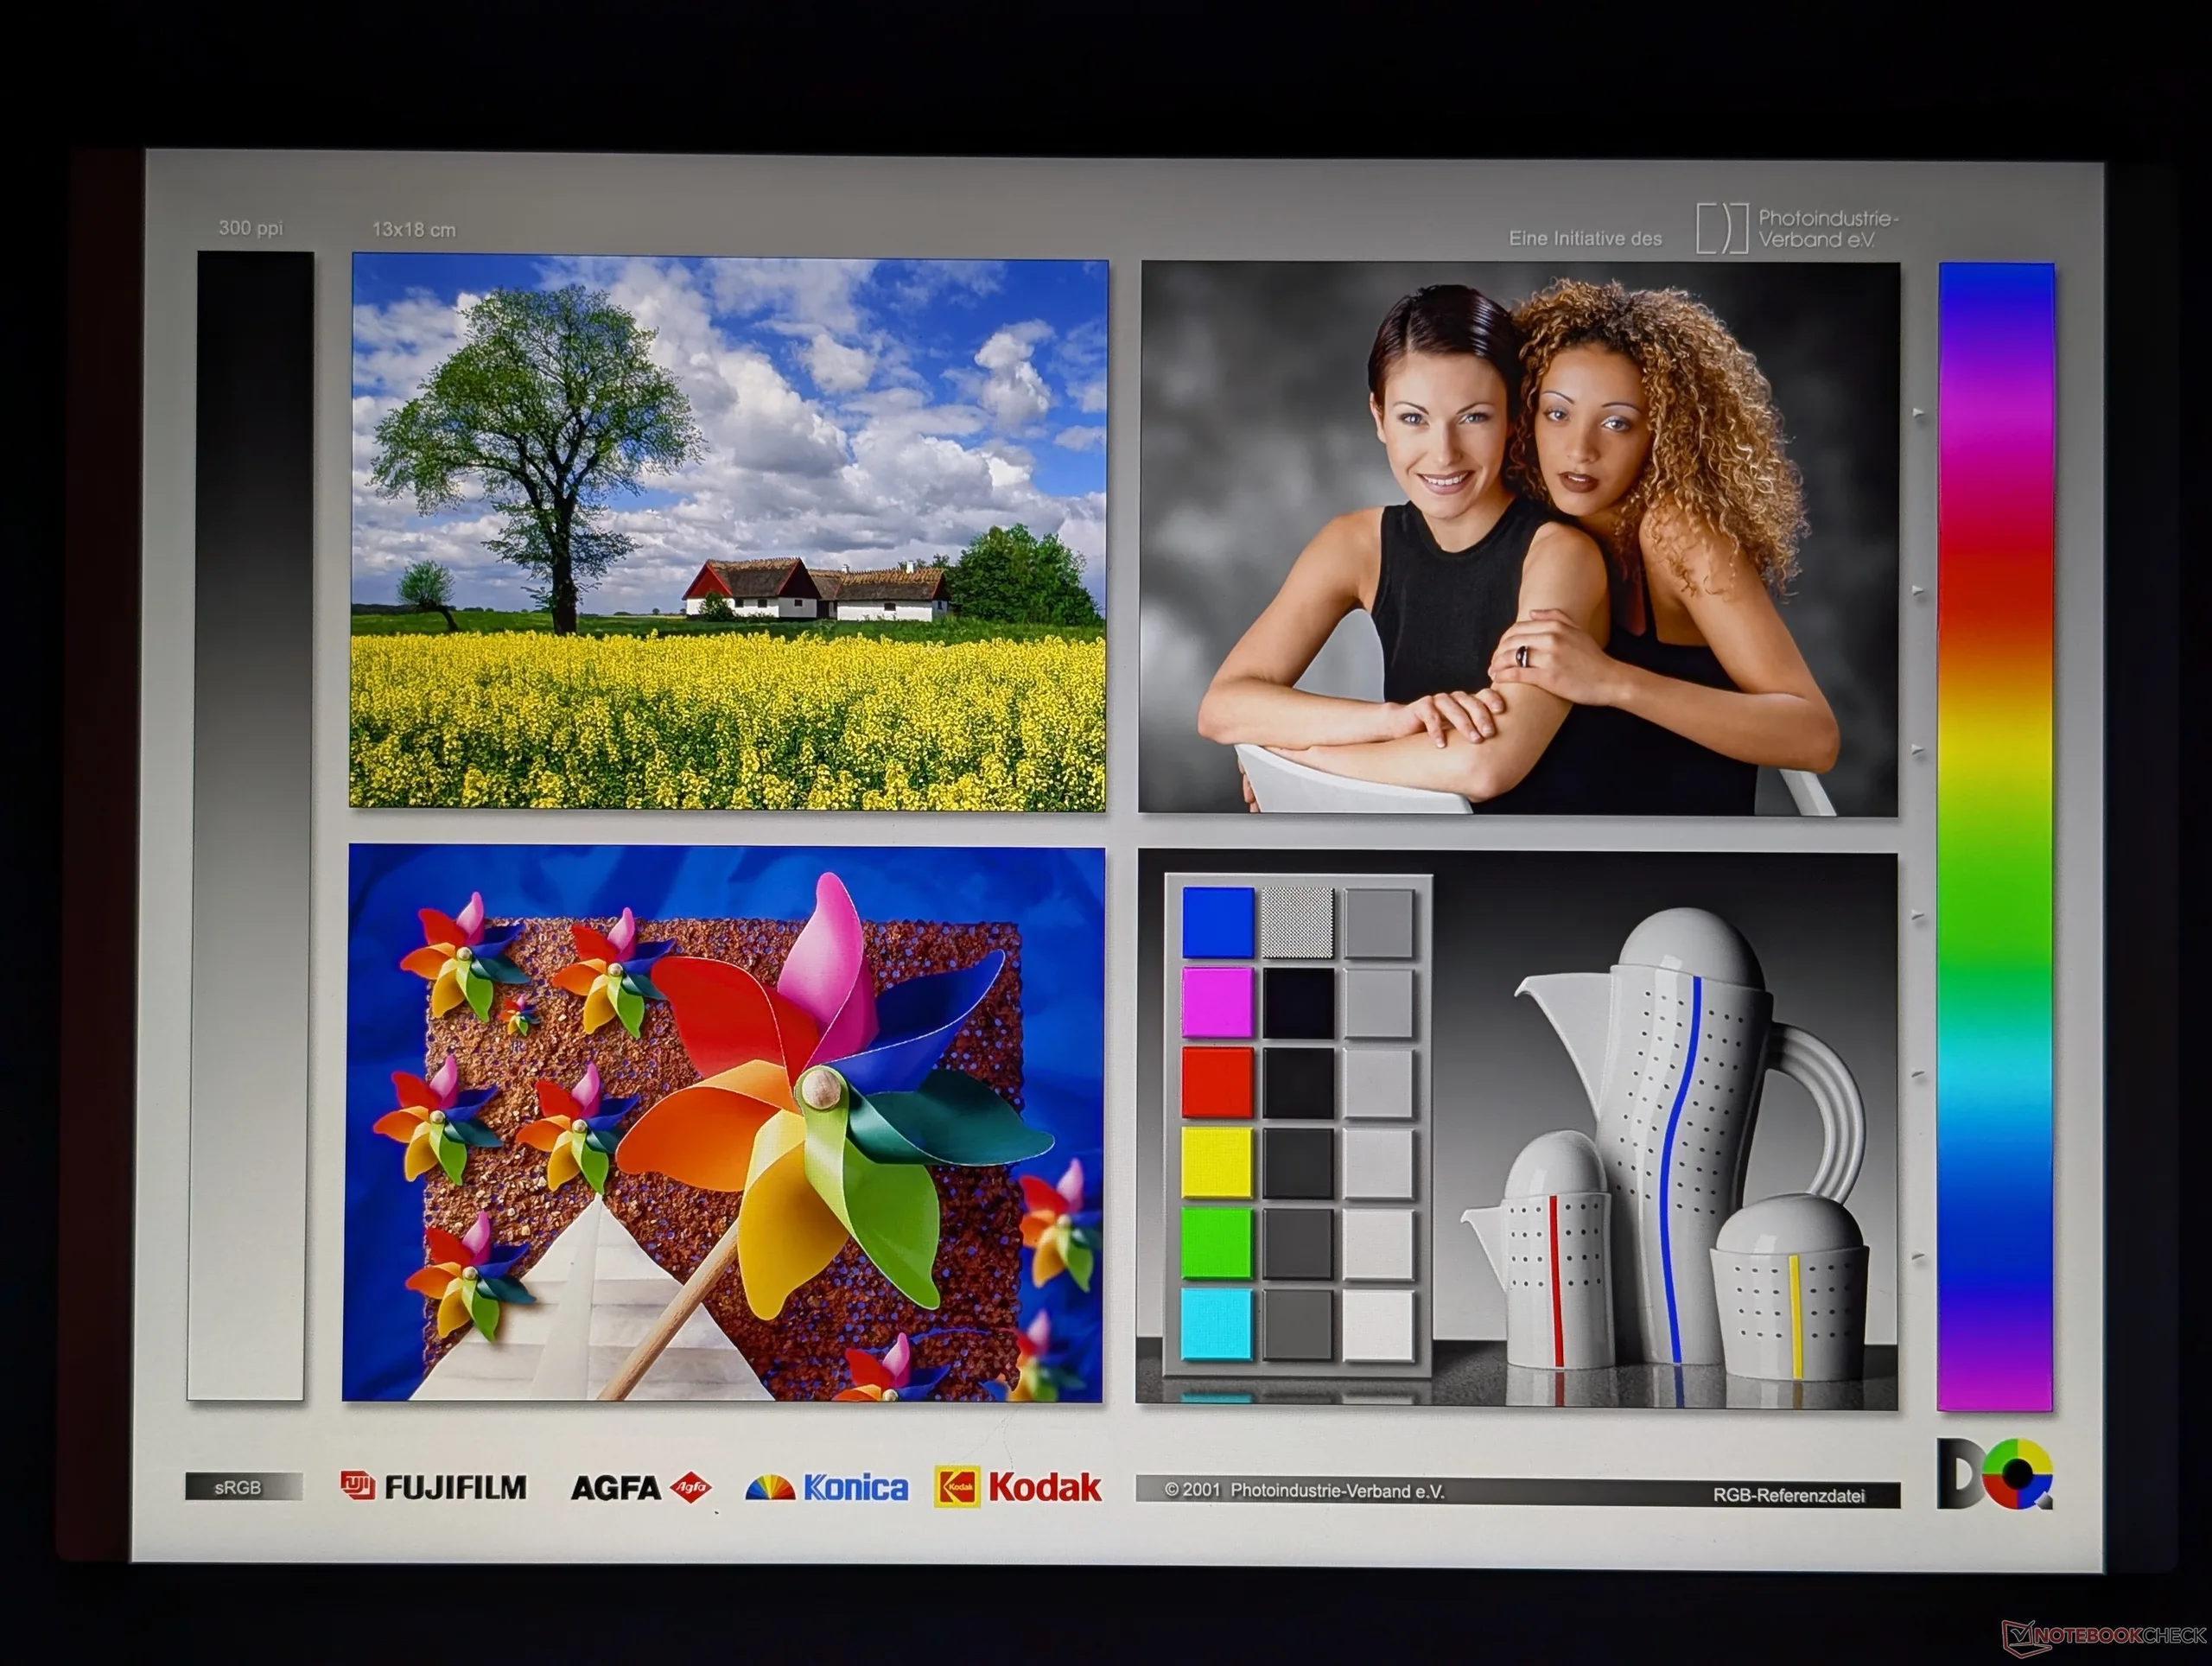
Crisp RGB subpixels
Crisp RGB subpixels
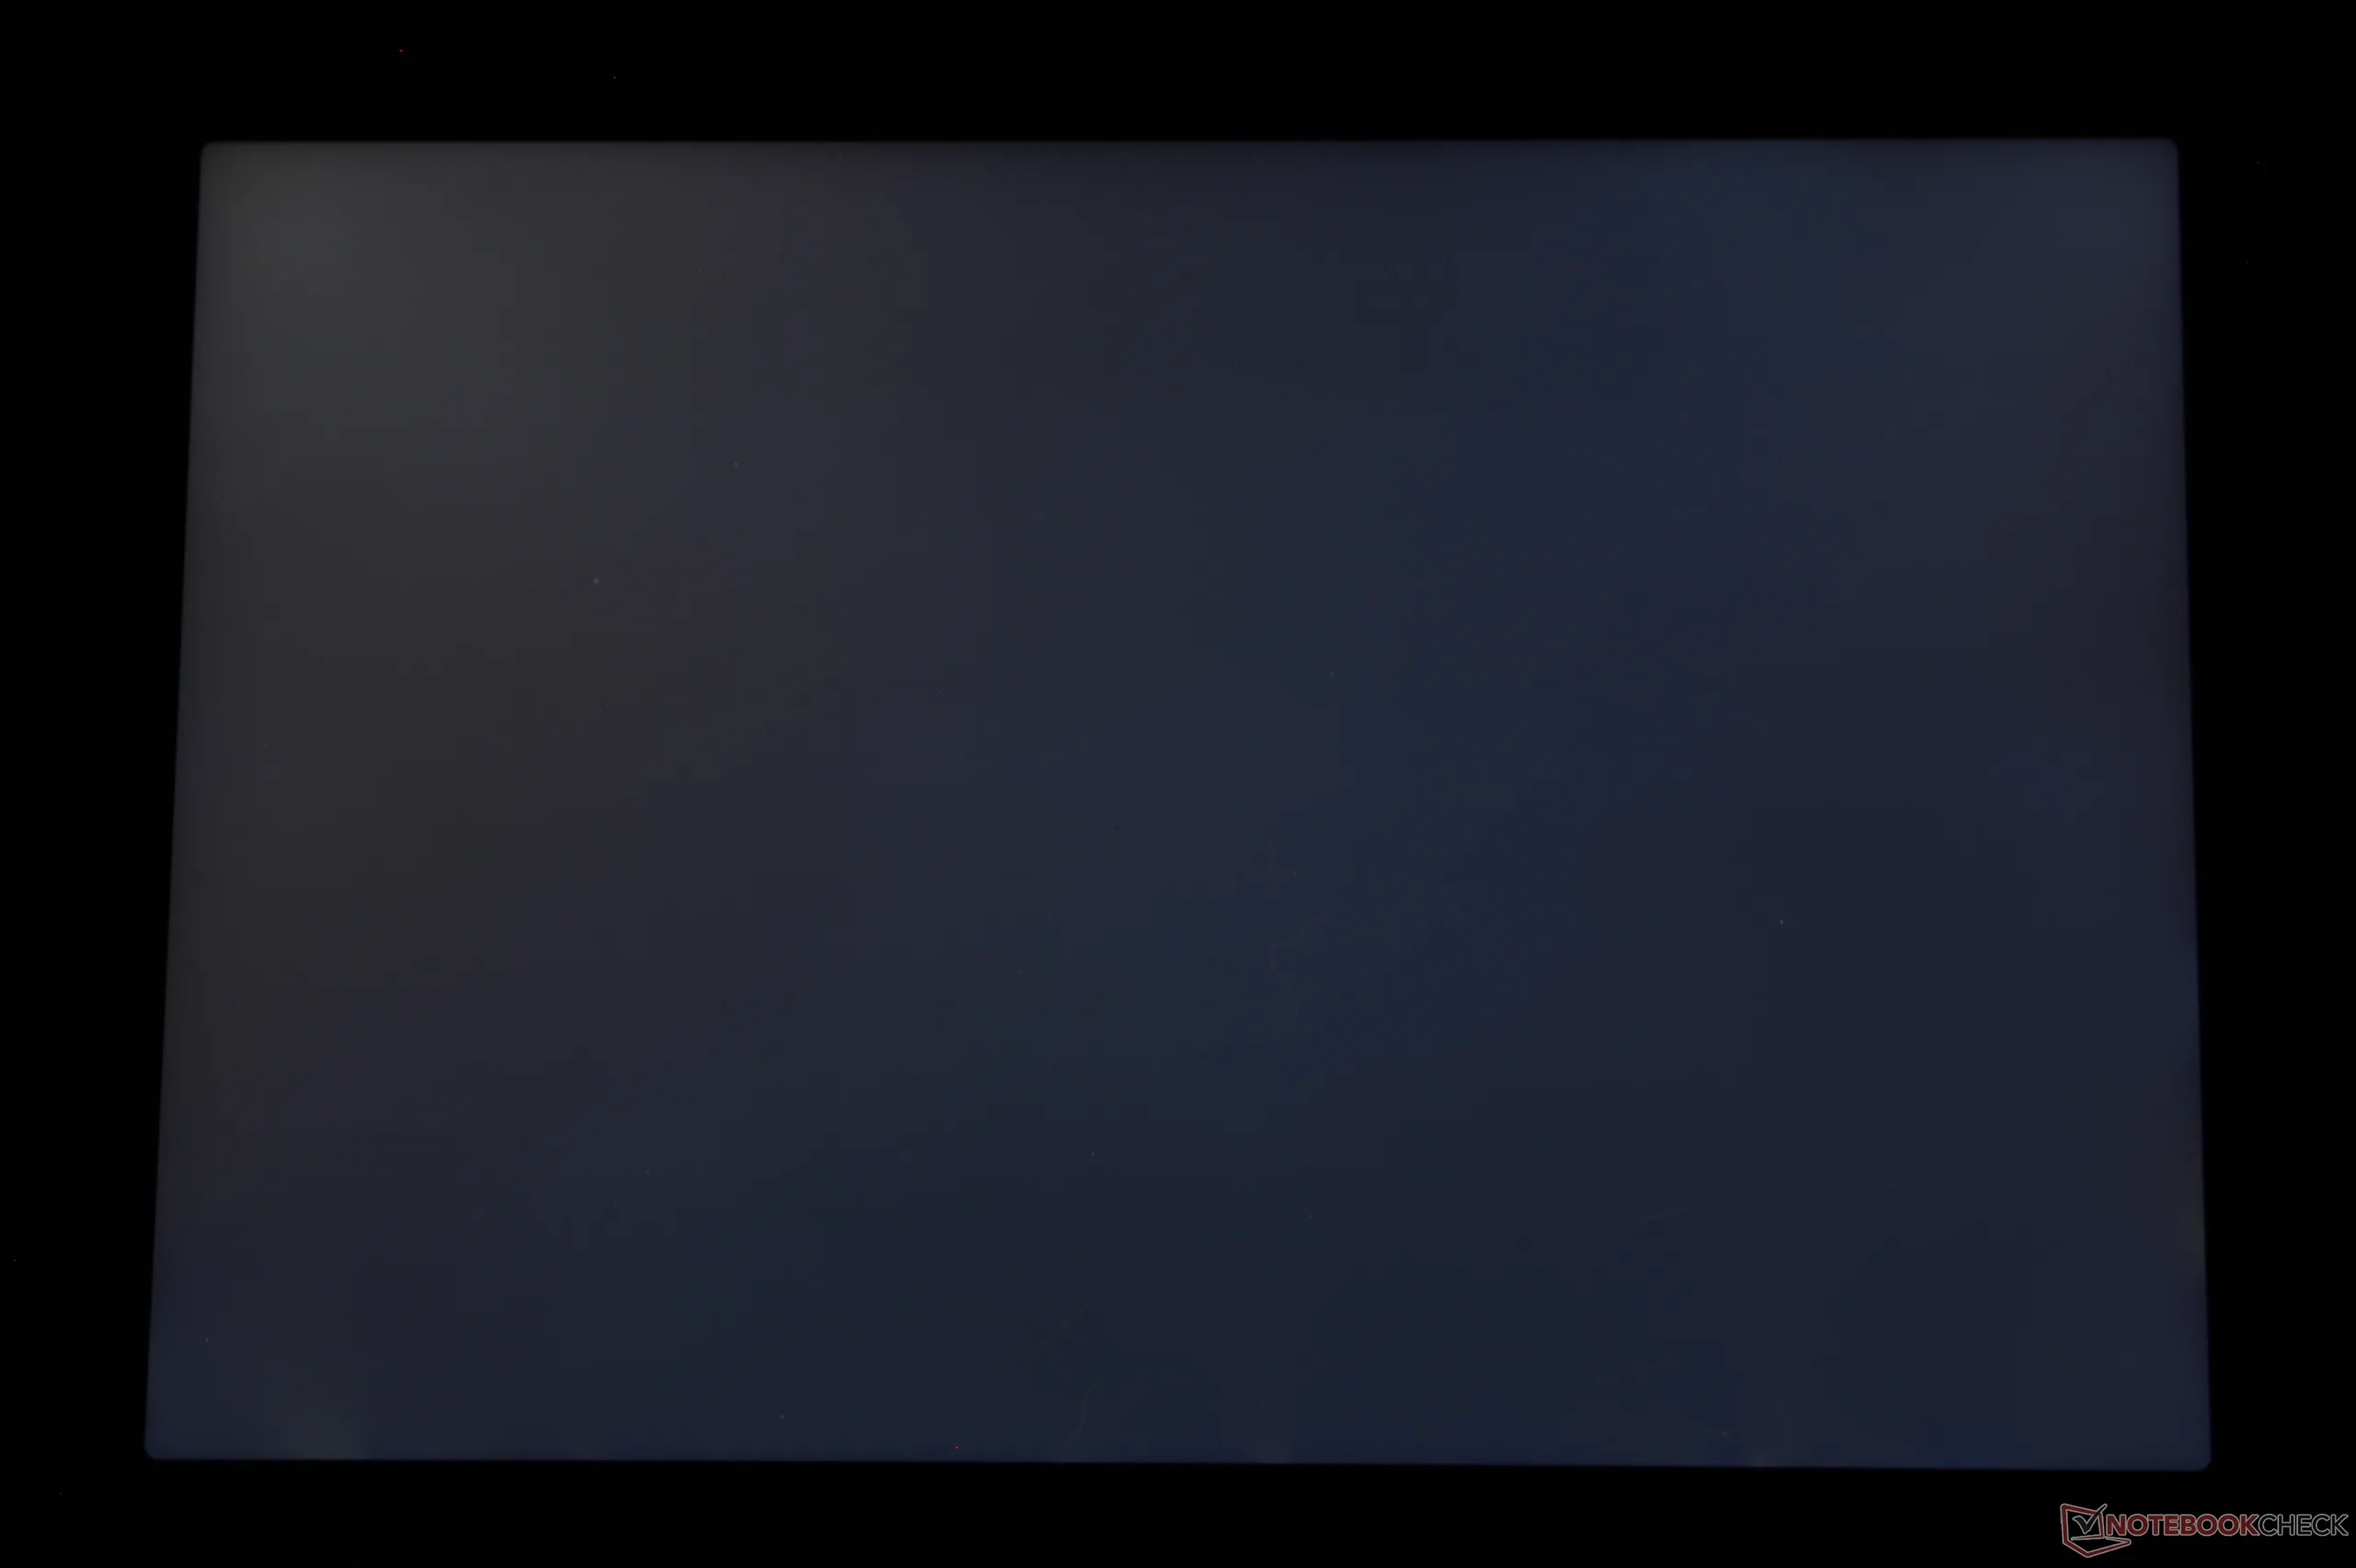
Slight-moderate uneven backlight bleeding along the corners
517.2
cd/m²
538.5
cd/m²
529.8
cd/m²
502.8
cd/m²
573
cd/m²
494
cd/m²
520.5
cd/m²
495.3
cd/m²
495.6
cd/m²
Distribution of brightness
NS130A10-M60 tested with X-Rite i1Pro 3
Maximum: 573 cd/m² (Nits) Average: 518.5 cd/m² Minimum: 7.73 cd/m²
Brightness Distribution: 86 %
Center on Battery: 573 cd/m²
Contrast: 1273:1 (Black: 0.45 cd/m²)
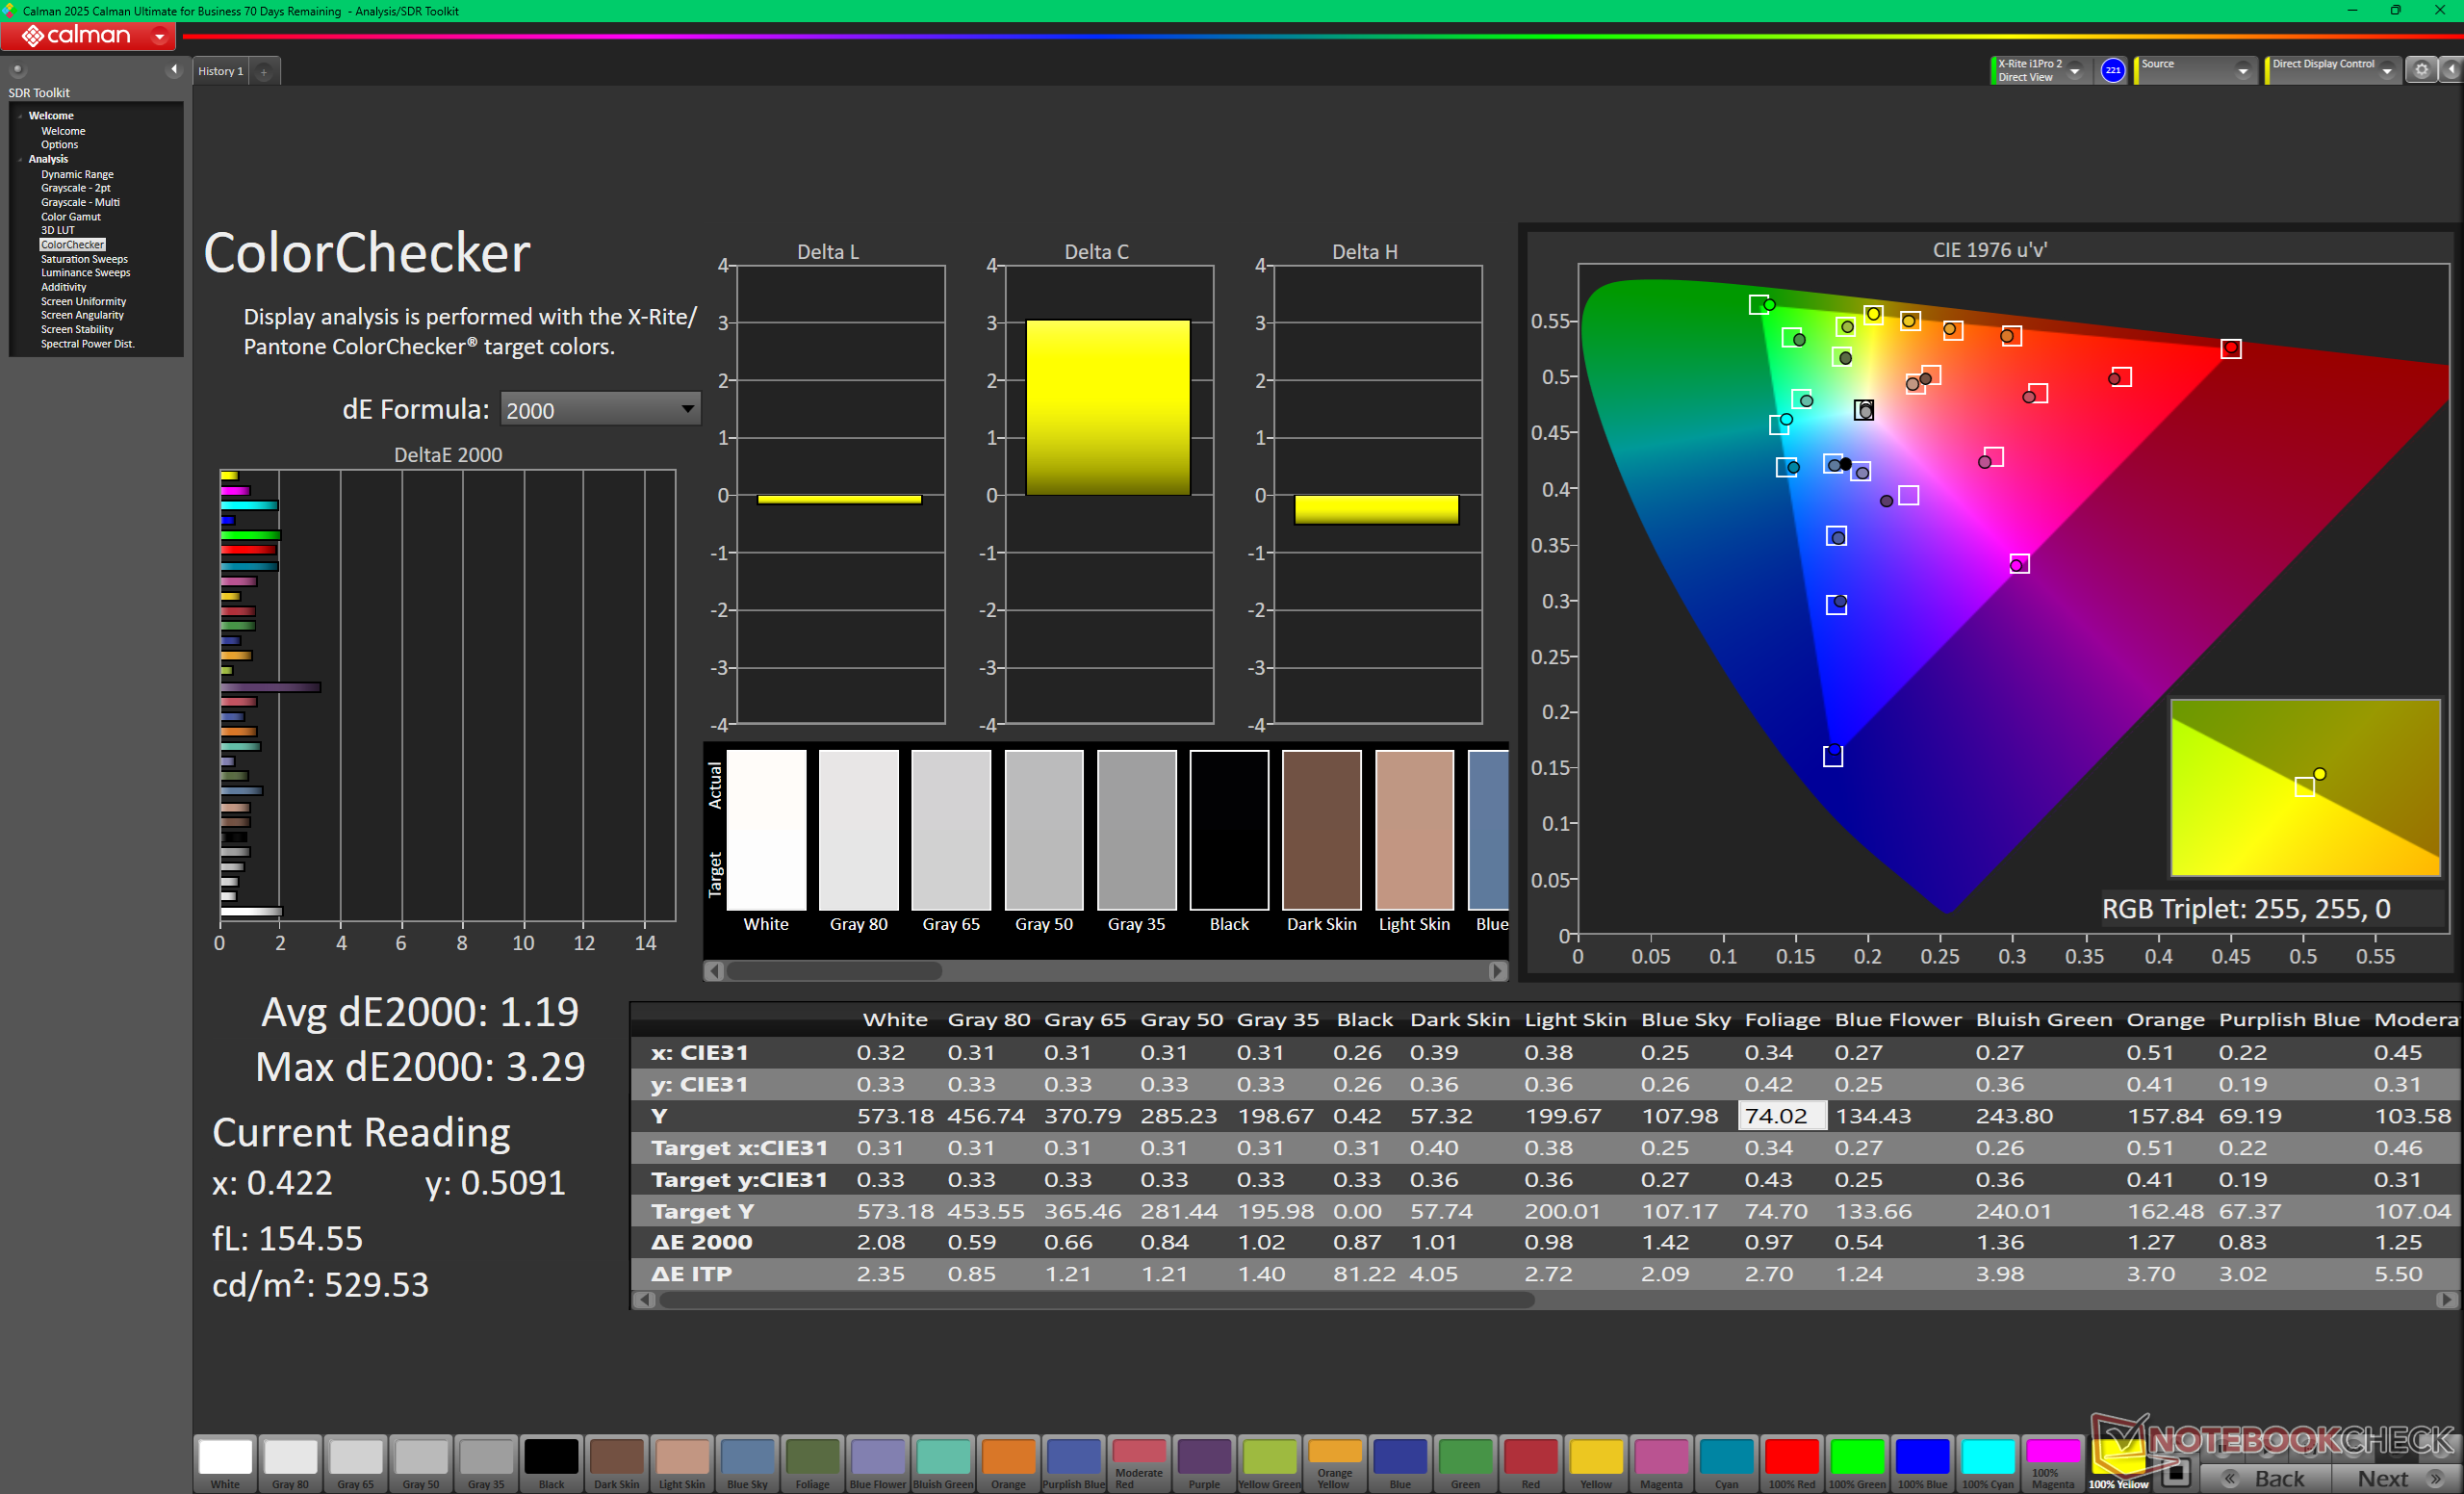
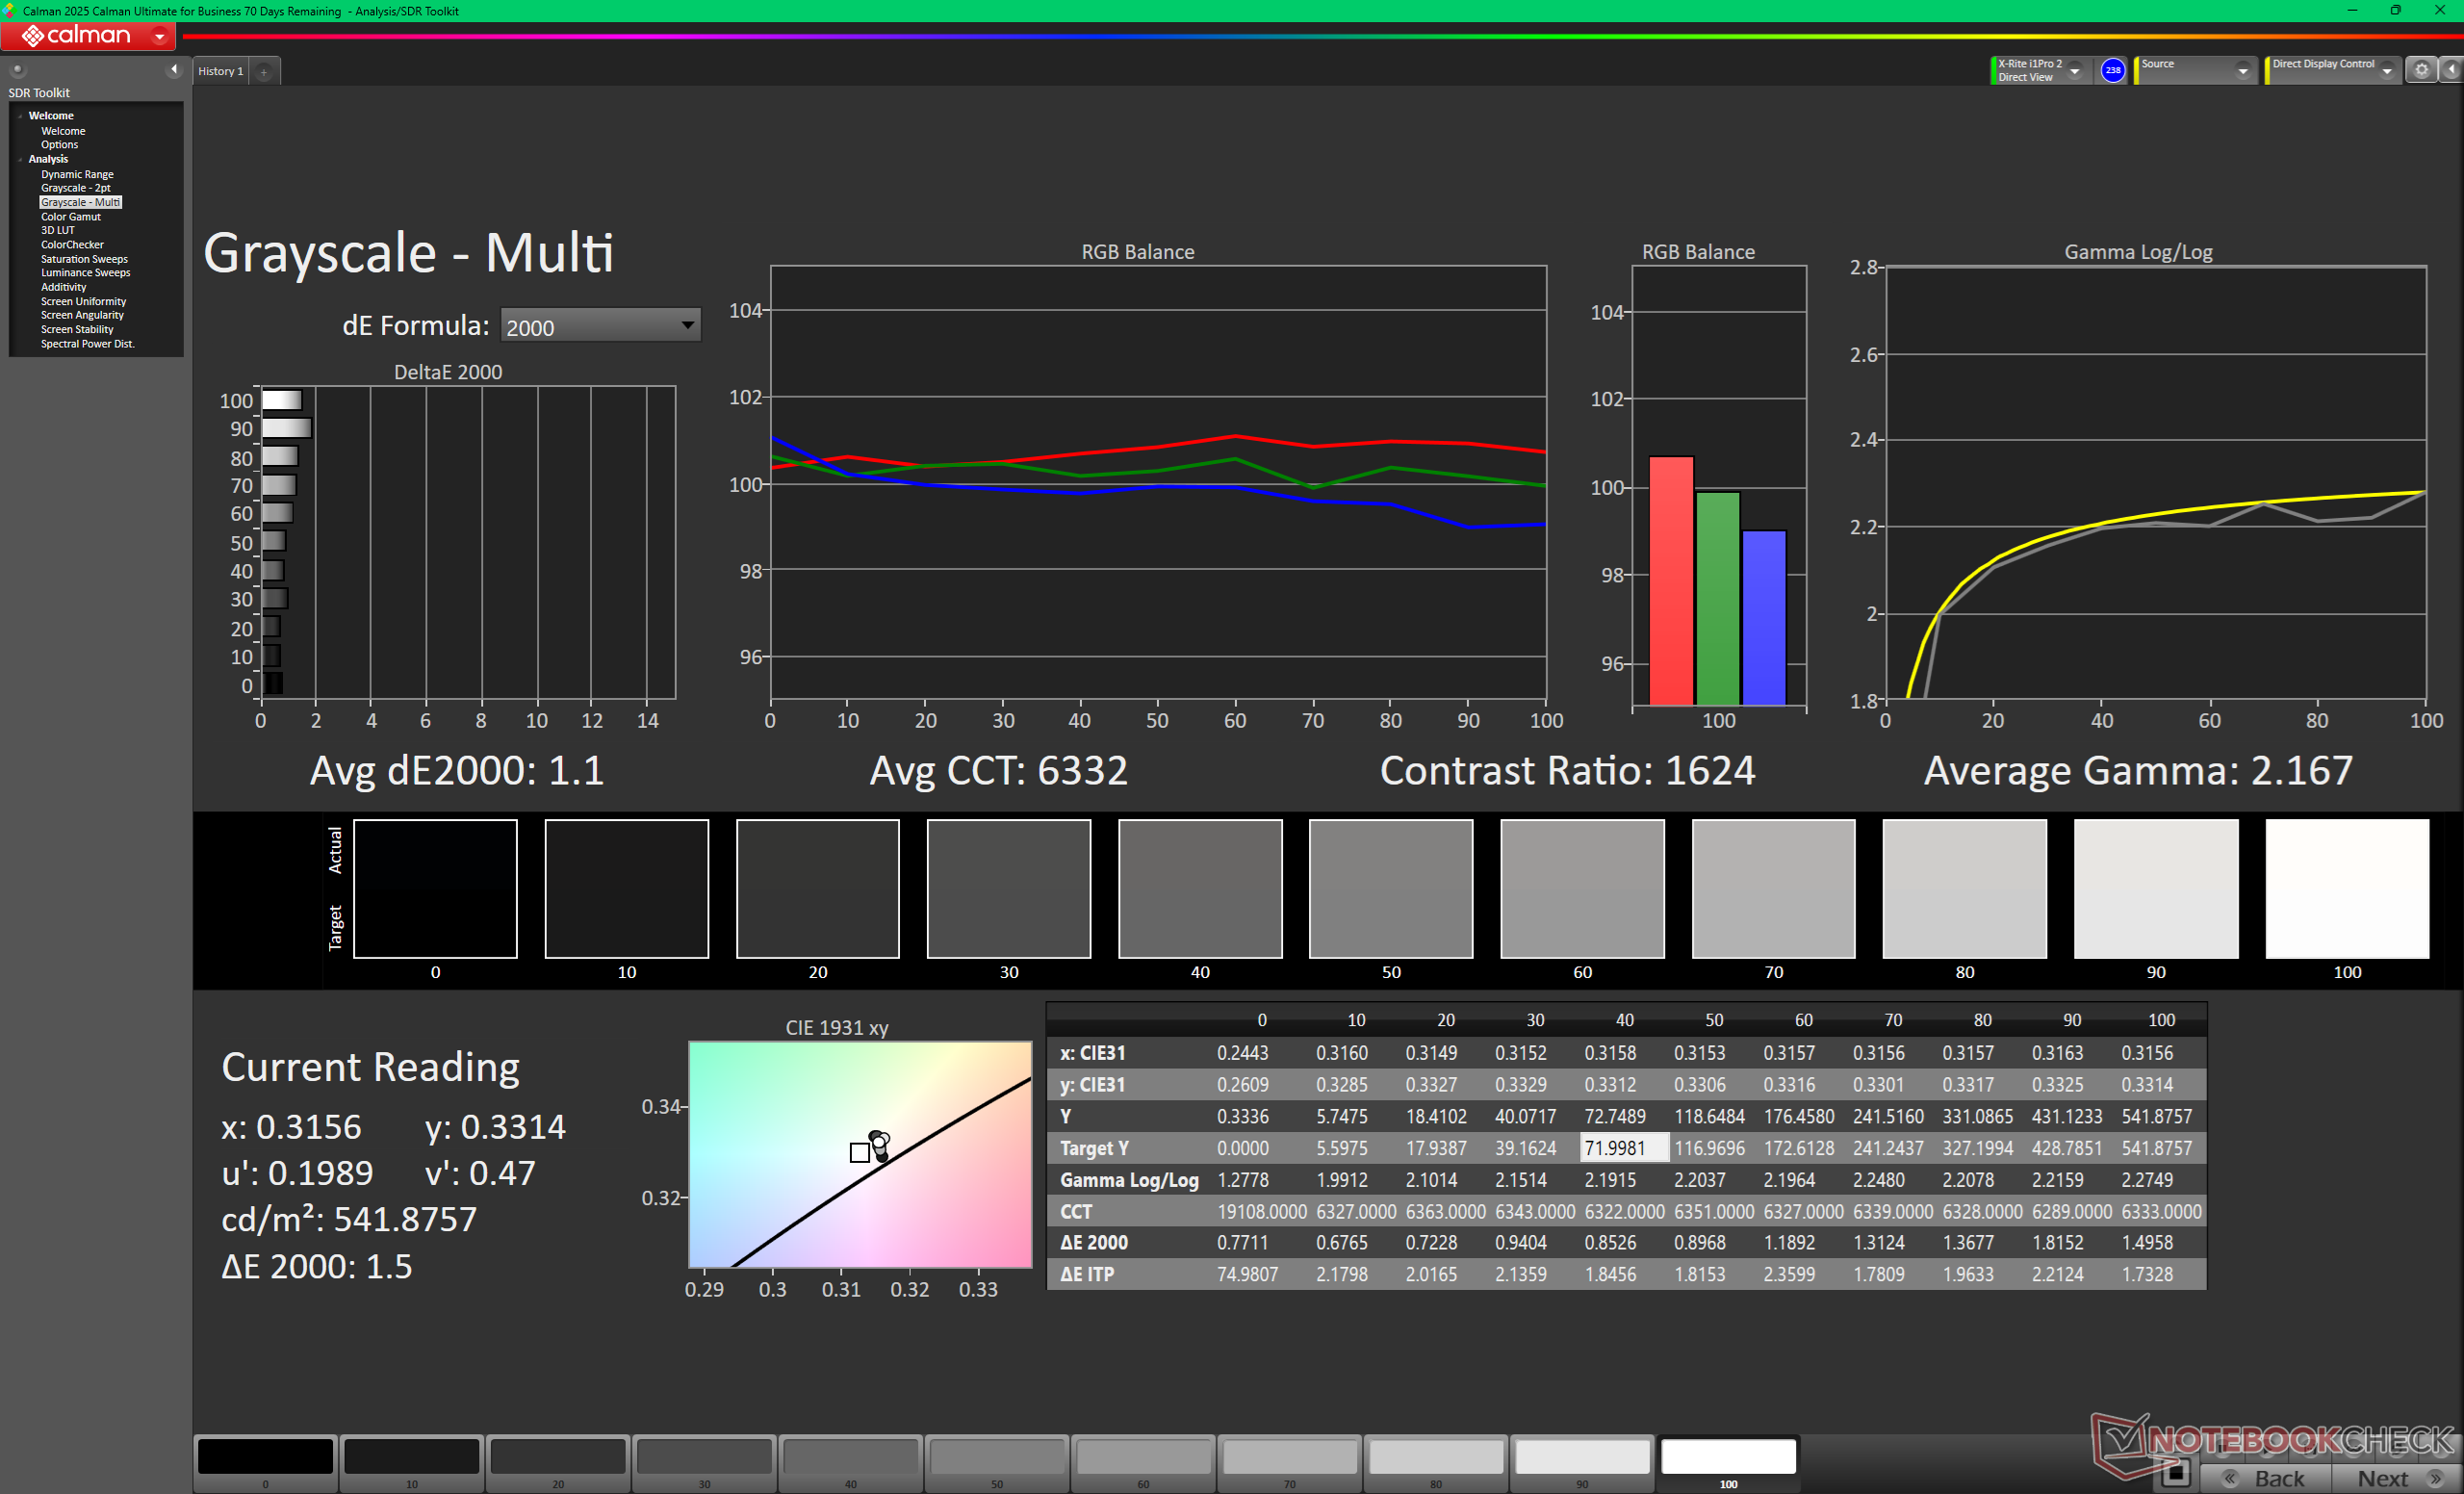
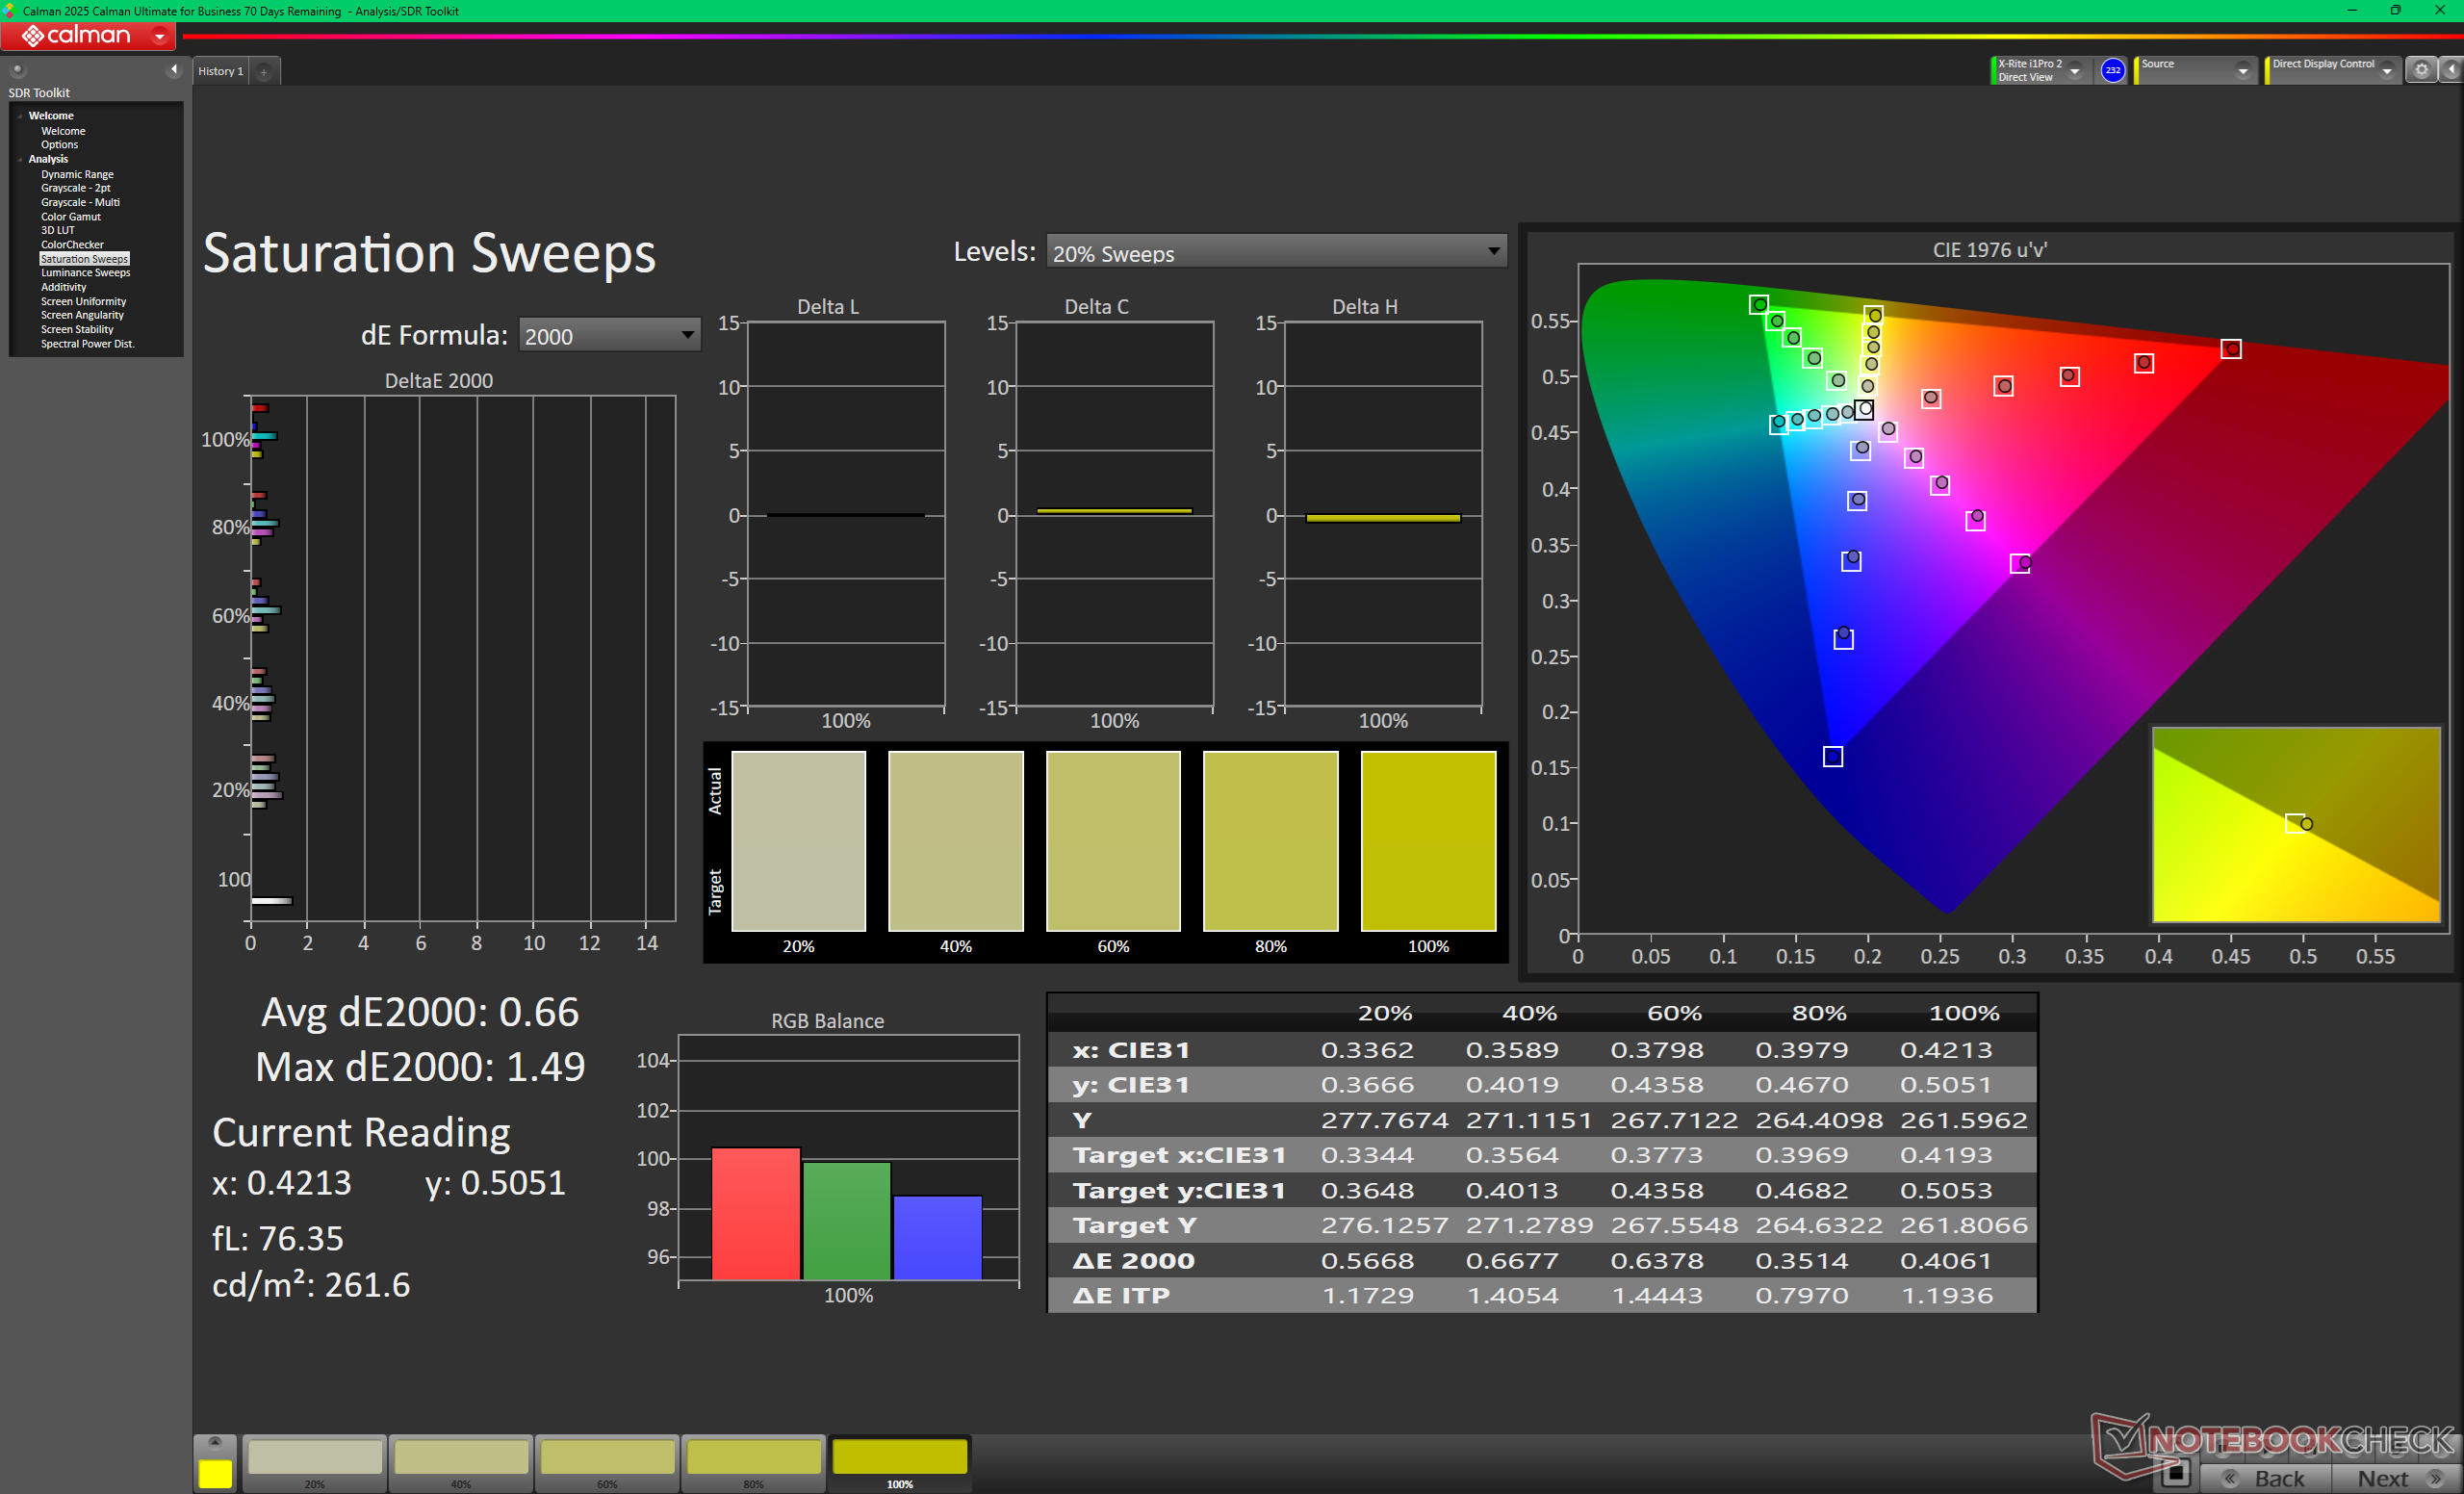
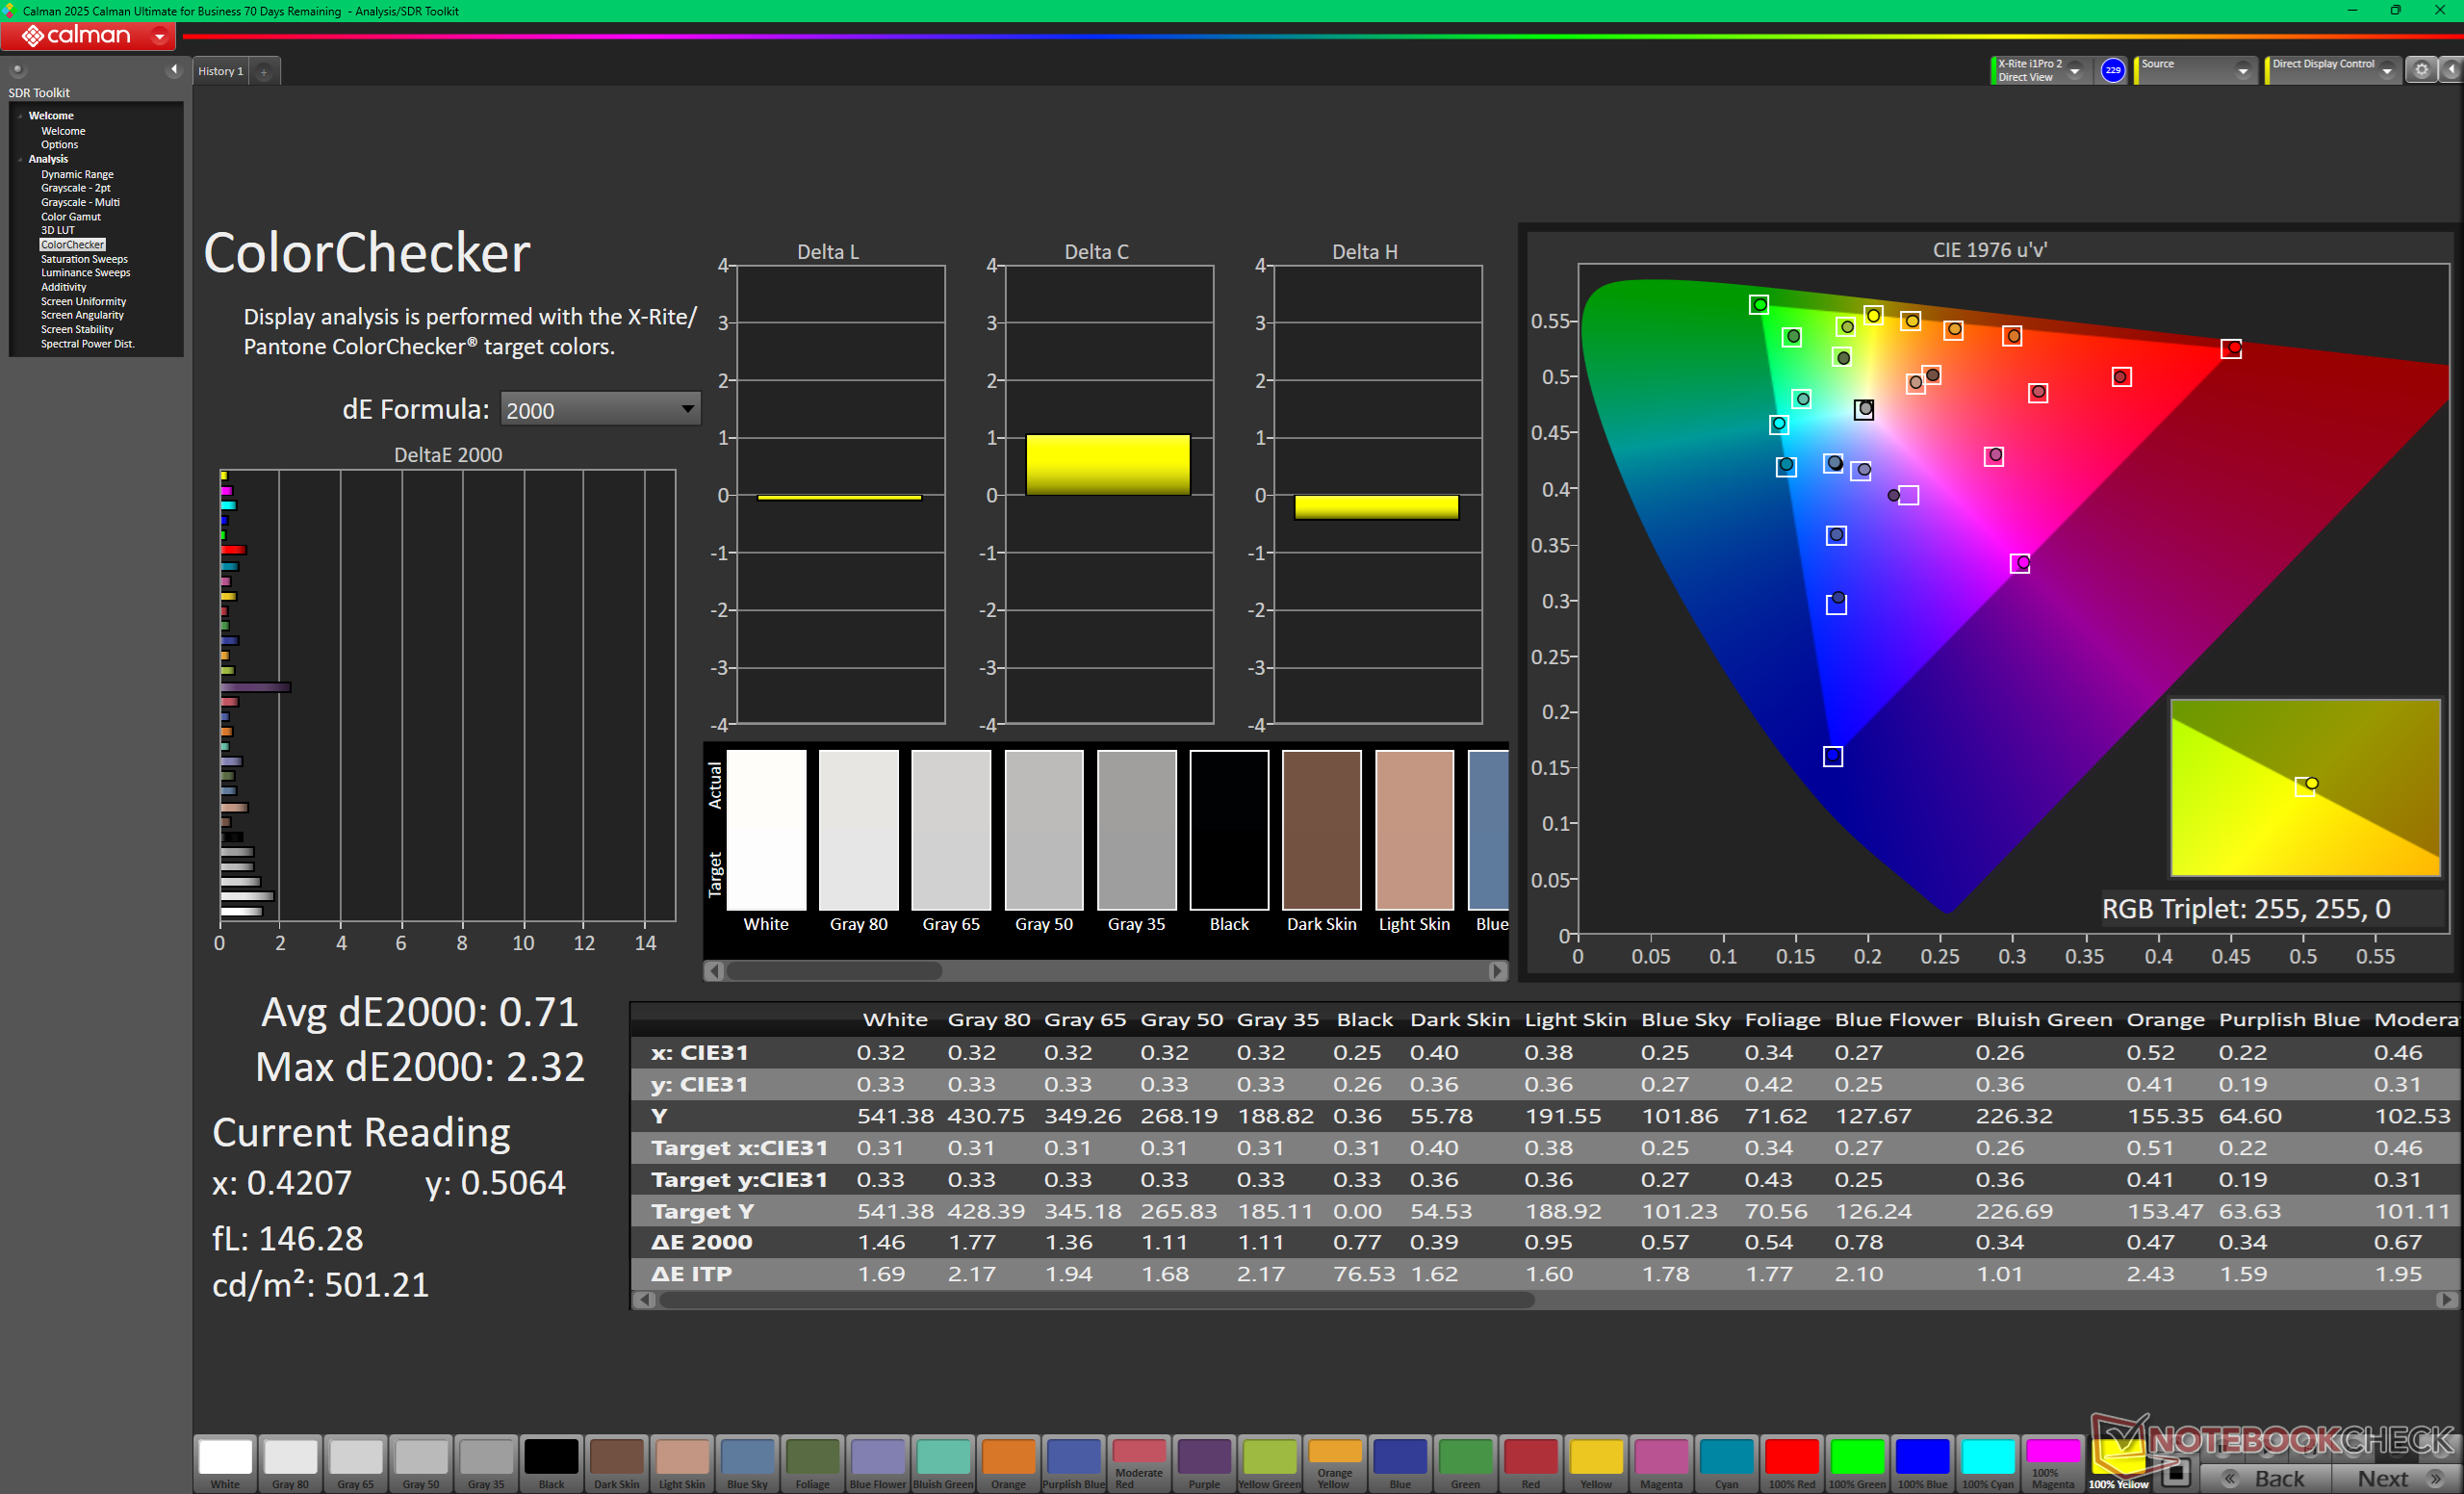
ΔE ColorChecker Calman: 1.19 | ∀{0.5-29.43 Ø4.68}
calibrated: 0.71
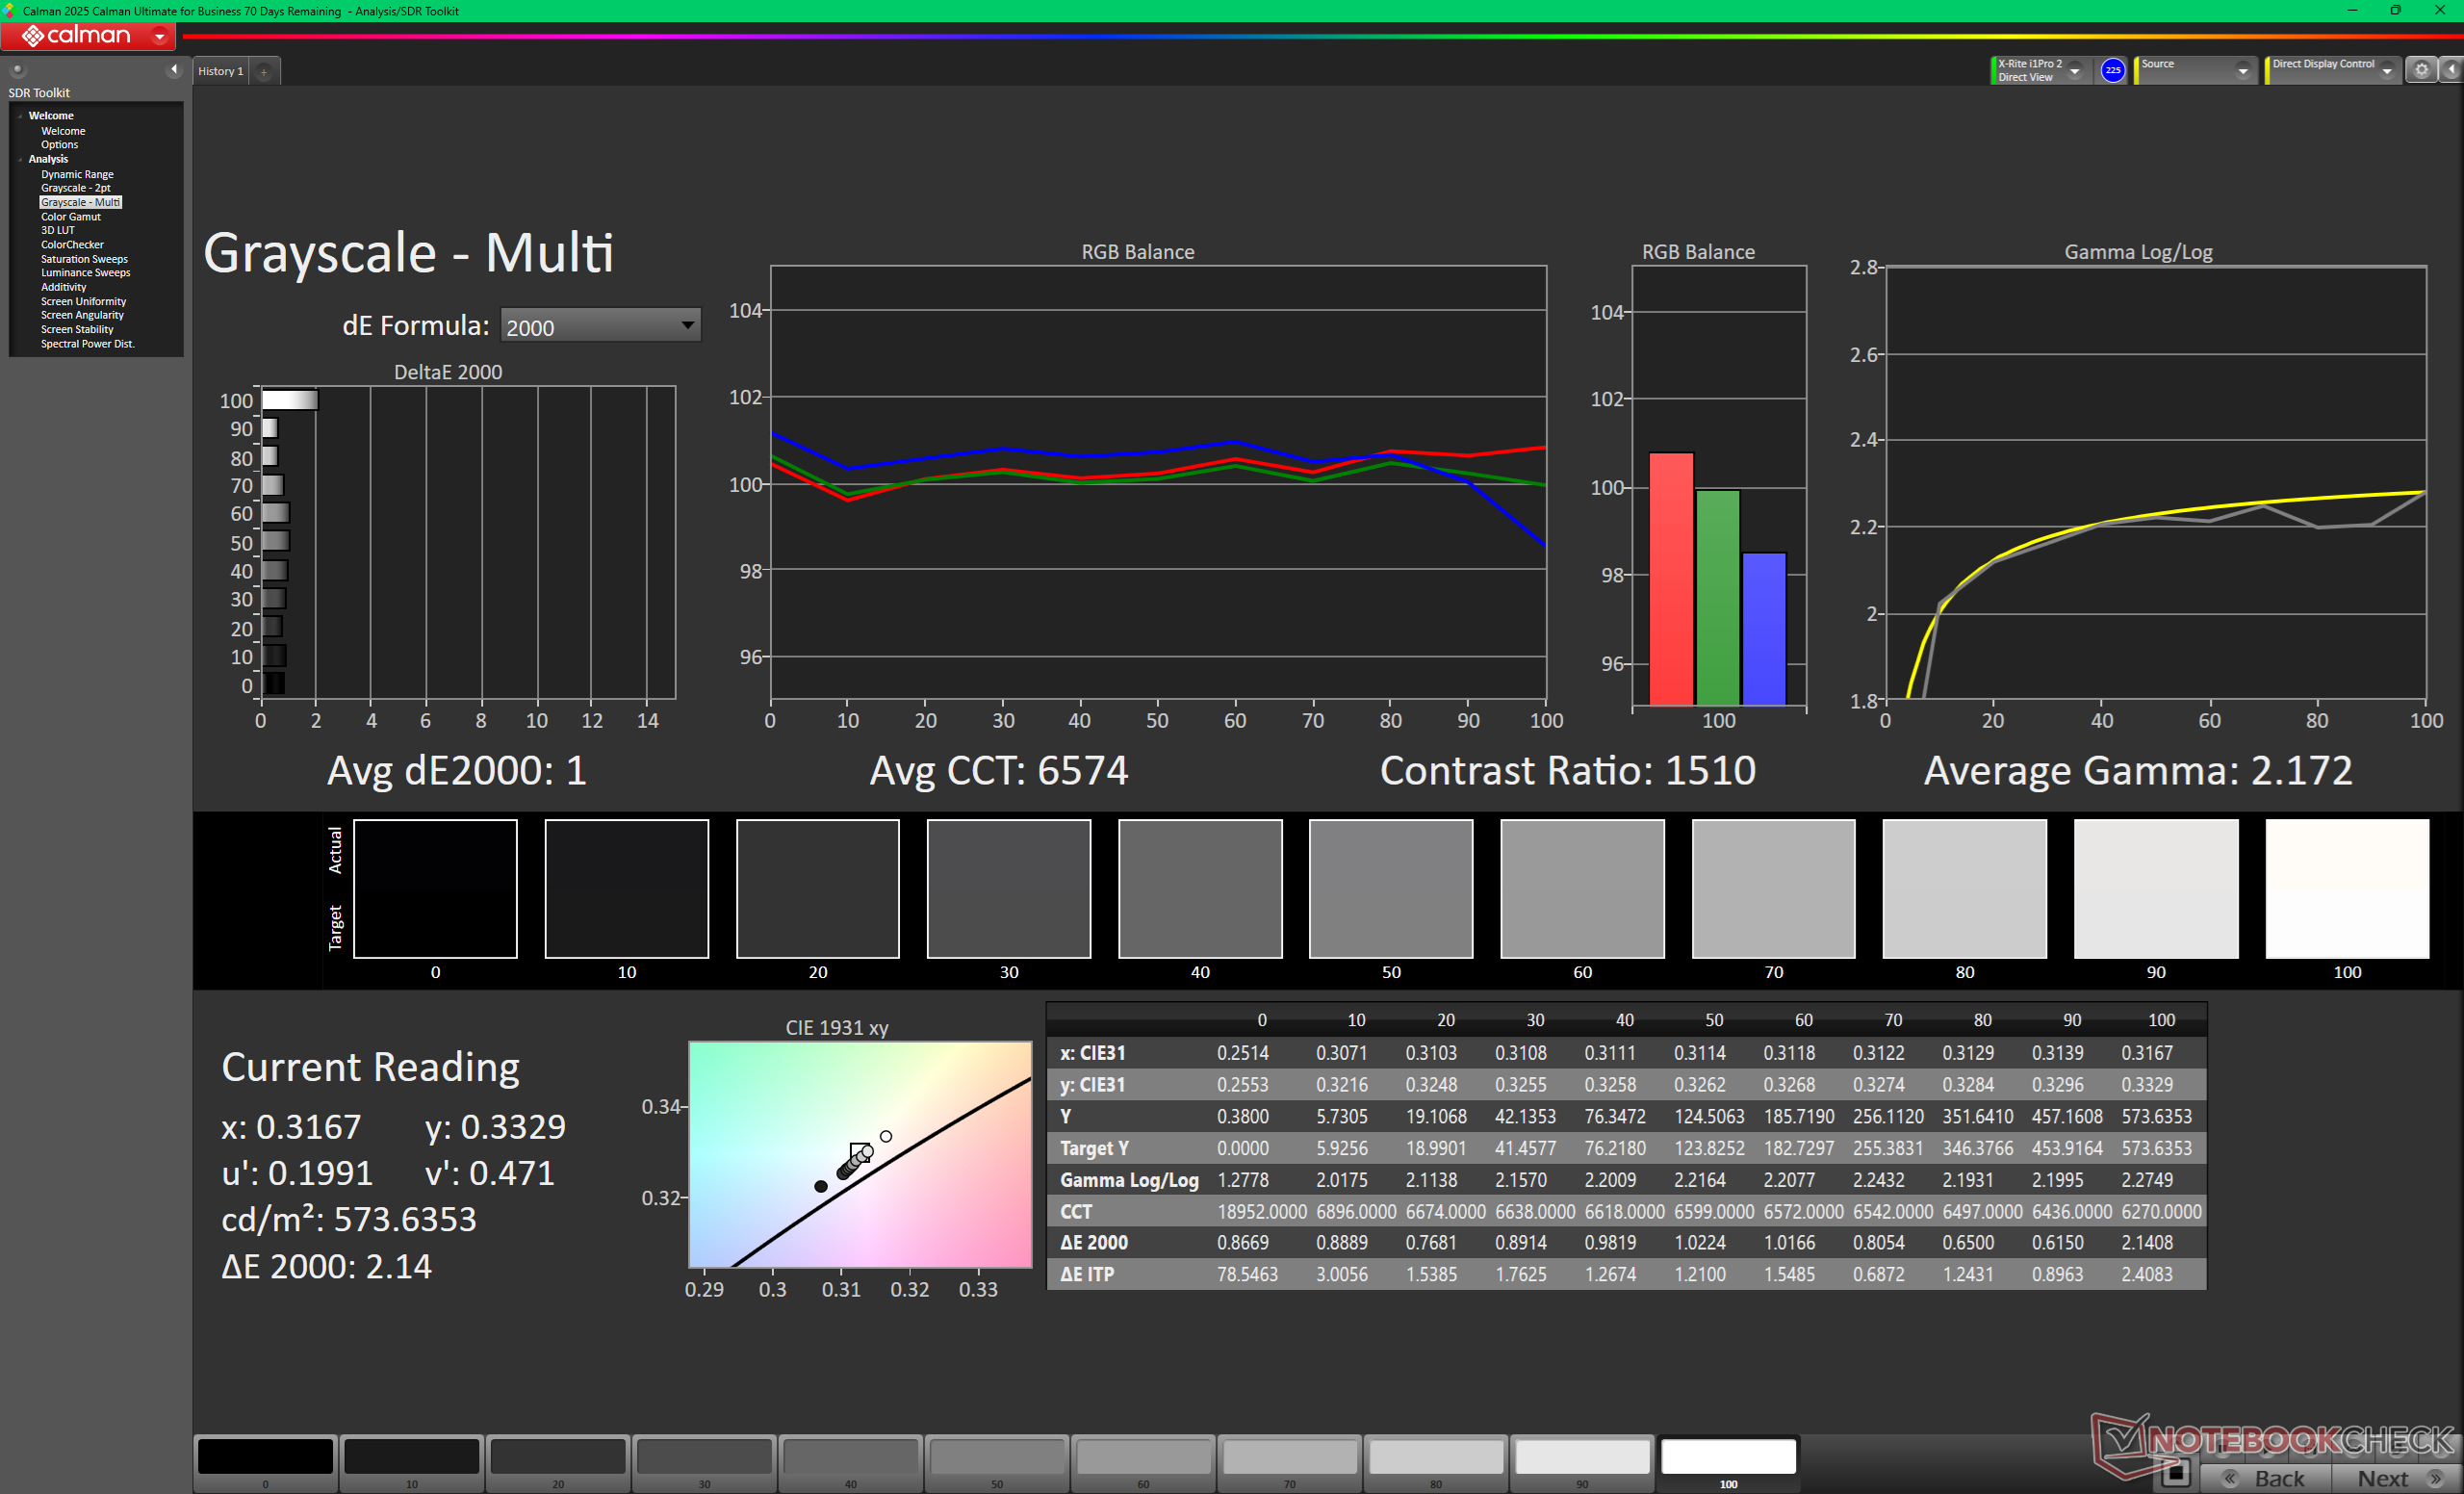
ΔE Greyscale Calman: 1 | ∀{0.09-98 Ø4.93}
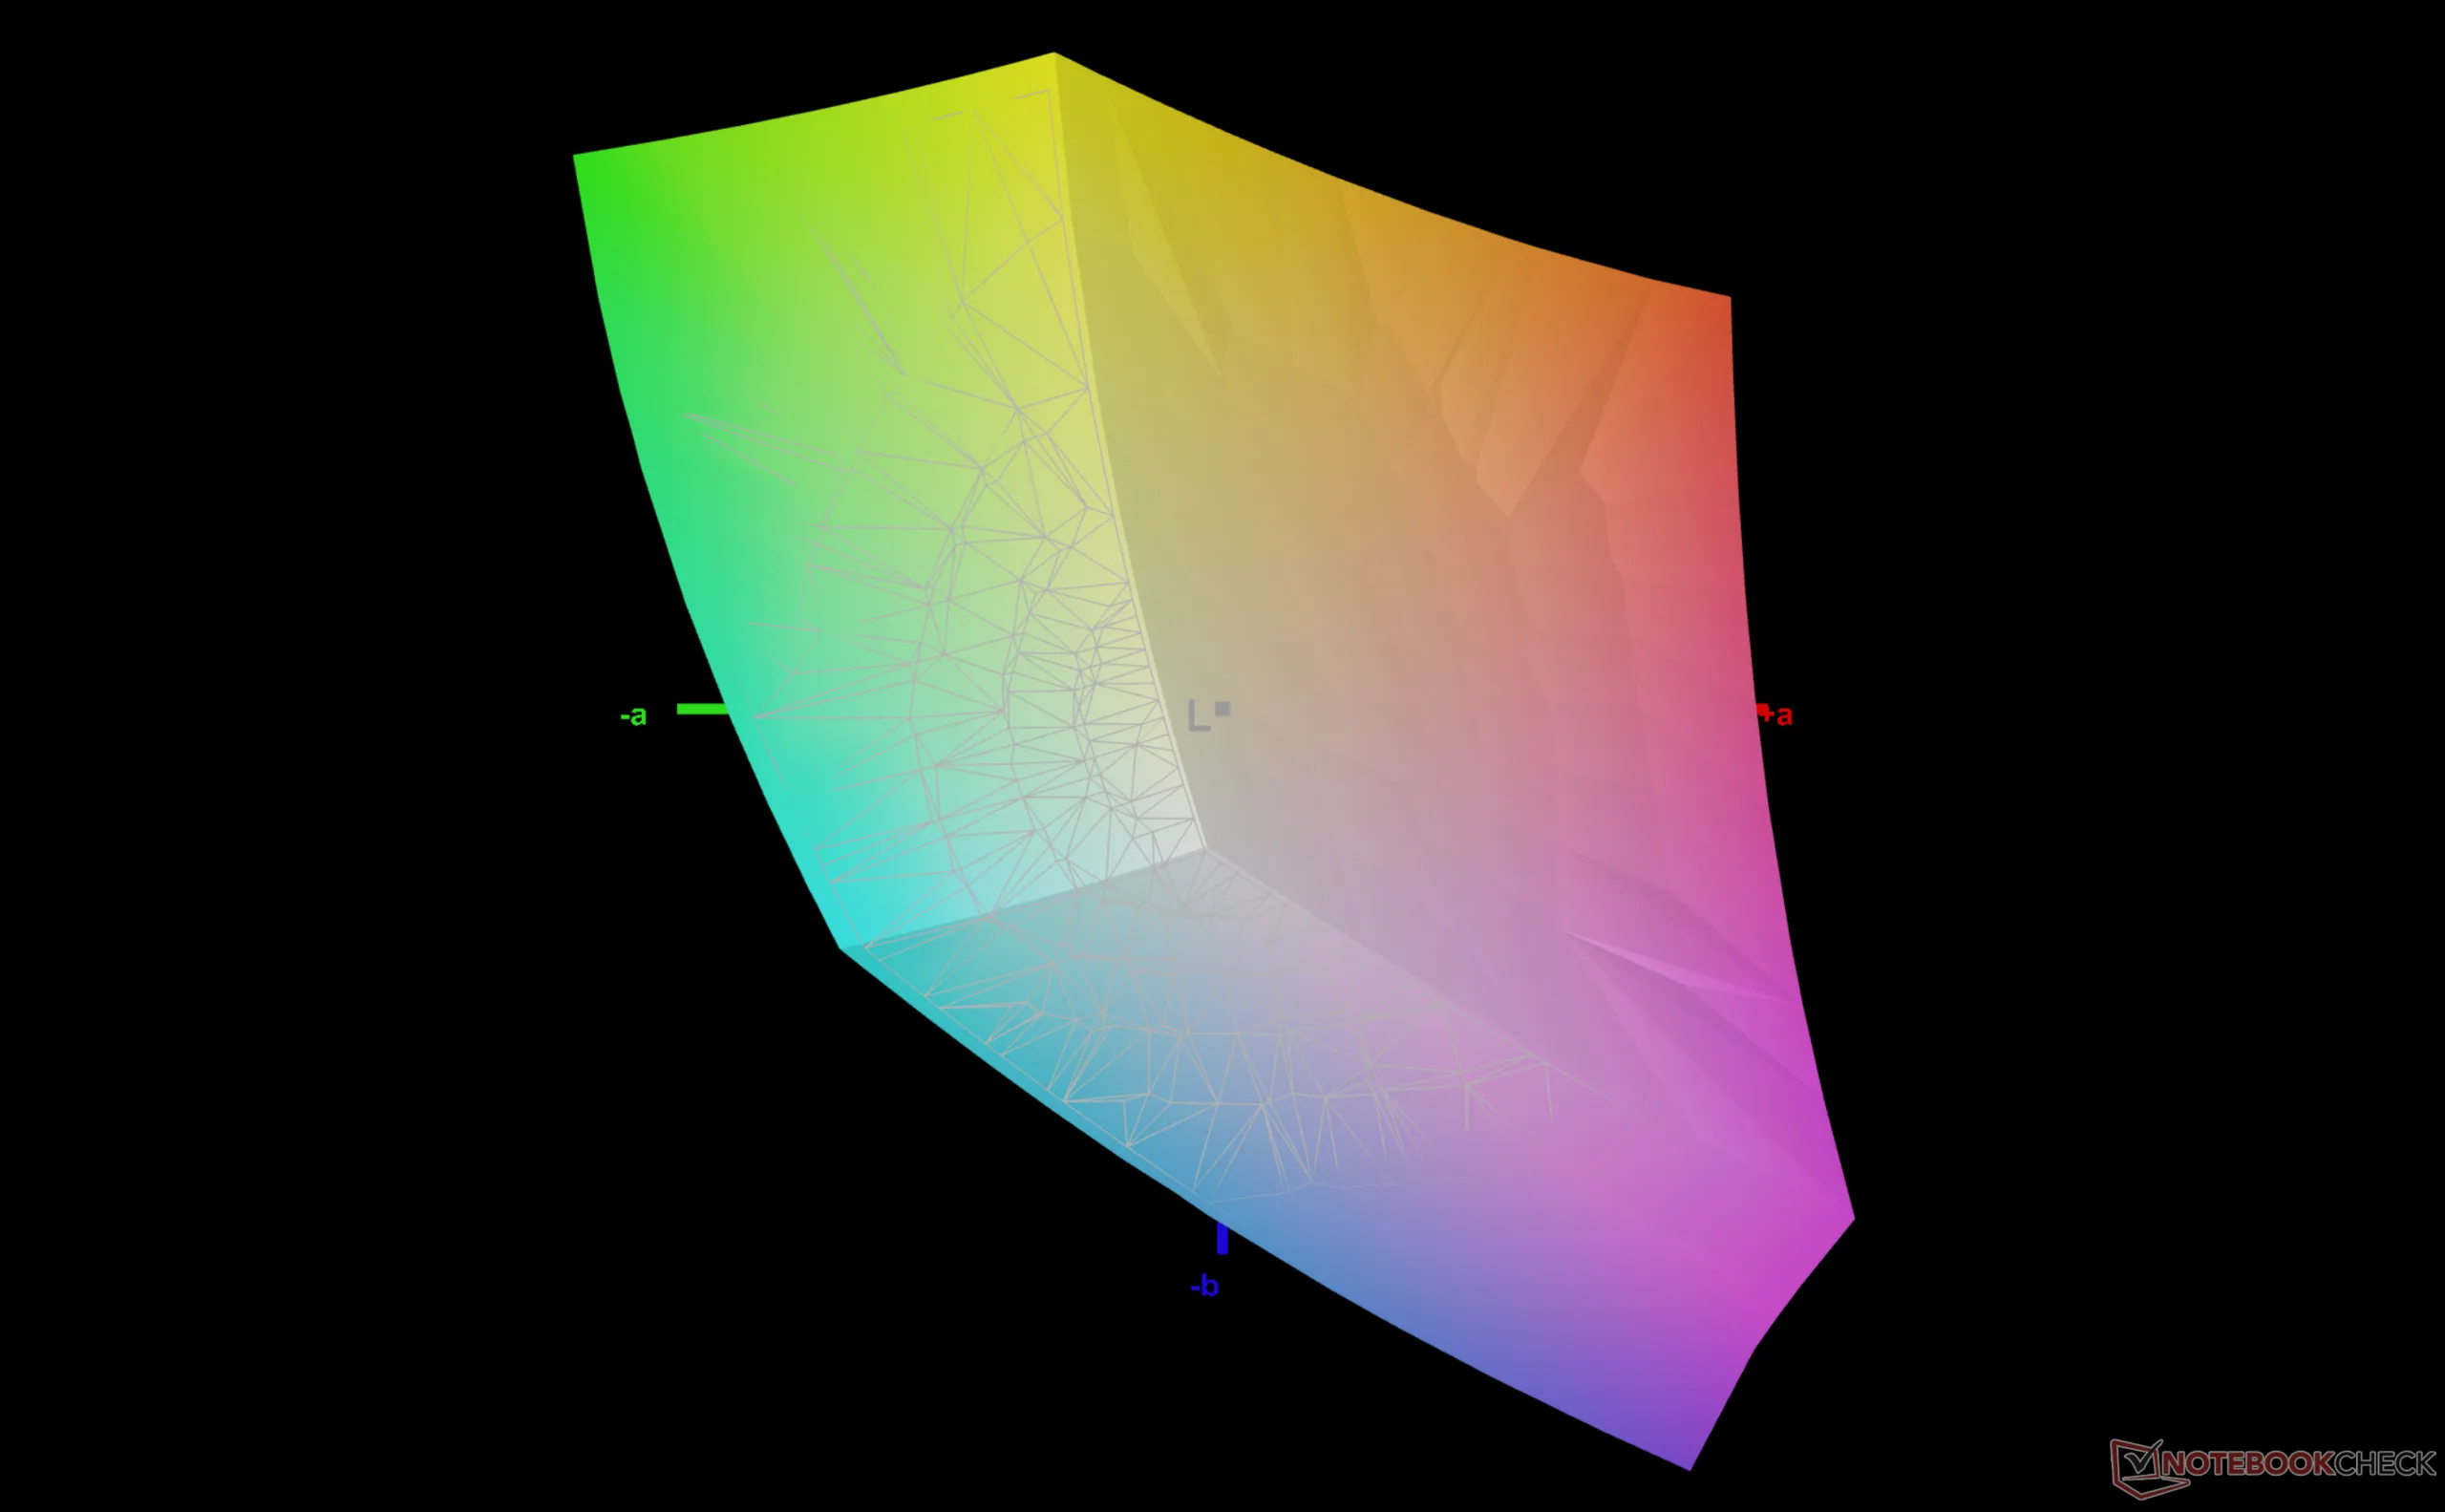
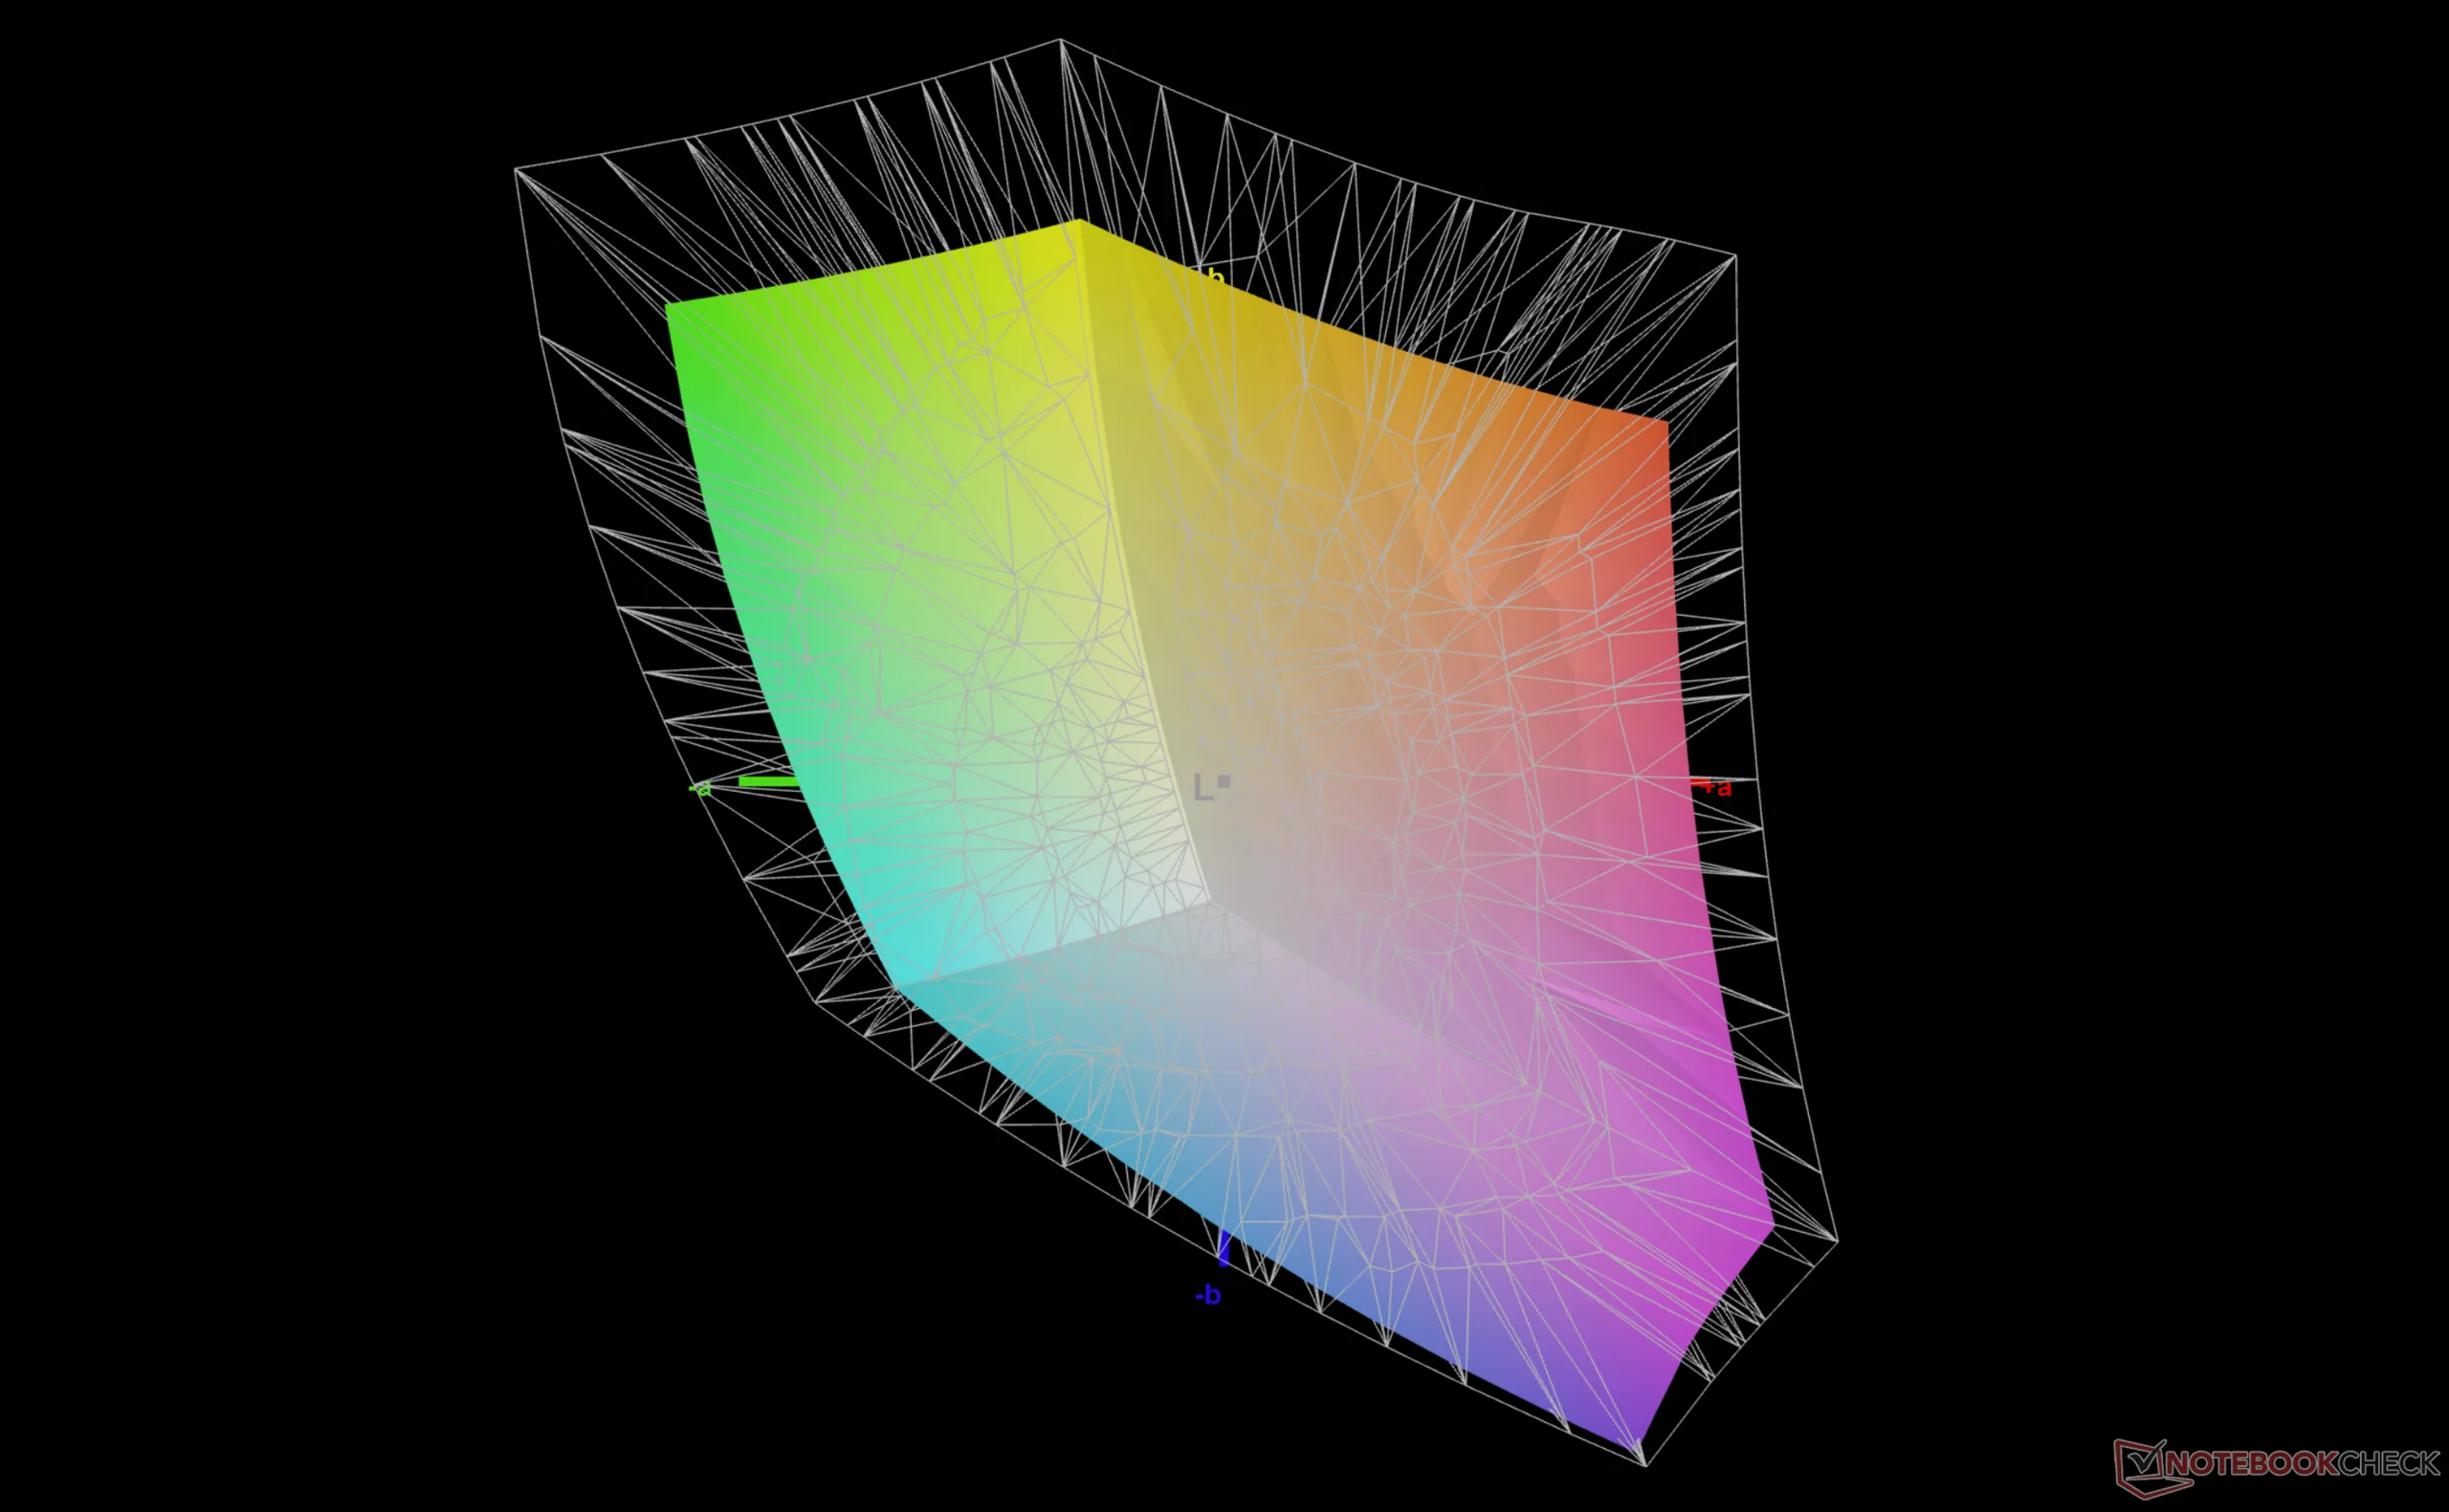
73.6% AdobeRGB 1998 (Argyll 3D)
99.9% sRGB (Argyll 3D)
71.5% Display P3 (Argyll 3D)
Gamma: 2.17
CCT: 6574 K
Lenovo ThinkPad X13 Detachable Gen 1
NS130A10-M60, IPS, 2880x1920, 13", 120 Hz
Lenovo ThinkPad X13 Gen 7 AMD
TL133VDMP01, IPS, 1920x1200, 13.3", 60 Hz
Dell Pro 7 13 2-in-1
BOE NV13M65, IPS, 1920x1200, 13.3", 60 Hz
Dell Pro 13 Premium PA13250
B133UAN (AUOBEB0), IPS, 1920x1200, 13.3", 60 Hz
MSI Prestige 13 AI+ A3MG
ATNA33AA07-0, OLED, 2880x1800, 13.3", 60 Hz
HP EliteBook 8 Flip G1i 13
Chi Mei CMN13E4, IPS, 1920x1200, 13.3", 60 Hz
Display
-3%
-6%
2%
23%
-4%
Display P3 Coverage (%)
71.5
68.9
-4%
66.9
-6%
74.3
4%
99.9
40%
68.9
-4%
sRGB Coverage (%)
99.9
99.5
0%
96.4
-4%
99.1
-1%
100
0%
96.4
-4%
AdobeRGB 1998 Coverage (%)
73.6
70.8
-4%
67.5
-8%
75.9
3%
95.7
30%
70.7
-4%
Response Times
-23%
-103%
-82%
92%
-82%
Response Time Grey 50% / Grey 80% * (ms)
26.6 ?(12.5, 14.1)
35.4 ?(16.5, 18.9)
-33%
54.9 ?(26.4, 28.5)
-106%
52.8 ?(23.4, 29.4)
-98%
1.8 ?(0.9, 0.9)
93%
49.3 ?(23.1, 26.2)
-85%
Response Time Black / White * (ms)
16 ?(7.3, 8.7)
17.9 ?(7.8, 10.1)
-12%
32 ?(15.9, 16.1)
-100%
26.4 ?(12.2, 14.2)
-65%
1.5 ?(0.8, 0.7)
91%
28.7 ?(14.4, 14.3)
-79%
PWM Frequency (Hz)
60 ?(90)
PWM Amplitude * (%)
33
Screen
-73%
-84%
-75%
759%
-20%
Brightness middle (cd/m²)
573
464
-19%
607.1
6%
456
-20%
394
-31%
390.1
-32%
Brightness (cd/m²)
519
438
-16%
568
9%
460
-11%
395
-24%
365
-30%
Brightness Distribution (%)
86
90
5%
90
5%
89
3%
98
14%
90
5%
Black Level * (cd/m²)
0.45
0.27
40%
0.34
24%
0.23
49%
0.005
99%
0.27
40%
Contrast (:1)
1273
1719
35%
1786
40%
1983
56%
78800
6090%
1445
14%
Colorchecker dE 2000 *
1.19
3
-152%
3.74
-214%
3.3
-177%
1.67
-40%
1.73
-45%
Colorchecker dE 2000 max. *
3.29
7
-113%
6.62
-101%
6.47
-97%
3.9
-19%
6.3
-91%
Colorchecker dE 2000 calibrated *
0.71
1
-41%
1.73
-144%
1.7
-139%
1
-41%
Greyscale dE 2000 *
1
5
-400%
4.8
-380%
4.35
-335%
1.2
-20%
1
-0%
Gamma
2.17 101%
2.17 101%
2.17 101%
2.51 88%
2.212 99%
2.2 100%
CCT
6574 99%
7185 90%
7689 85%
6215 105%
6470 100%
6627 98%
Total Average (Program / Settings)
-33% / -51%
-64% / -70%
-52% / -59%
291% / 486%
-35% / -25%

* ... smaller is better

vs. sRGB
vs. sRGB
vs. P3
vs. P3
Grayscale before calibration (vs. sRGB)
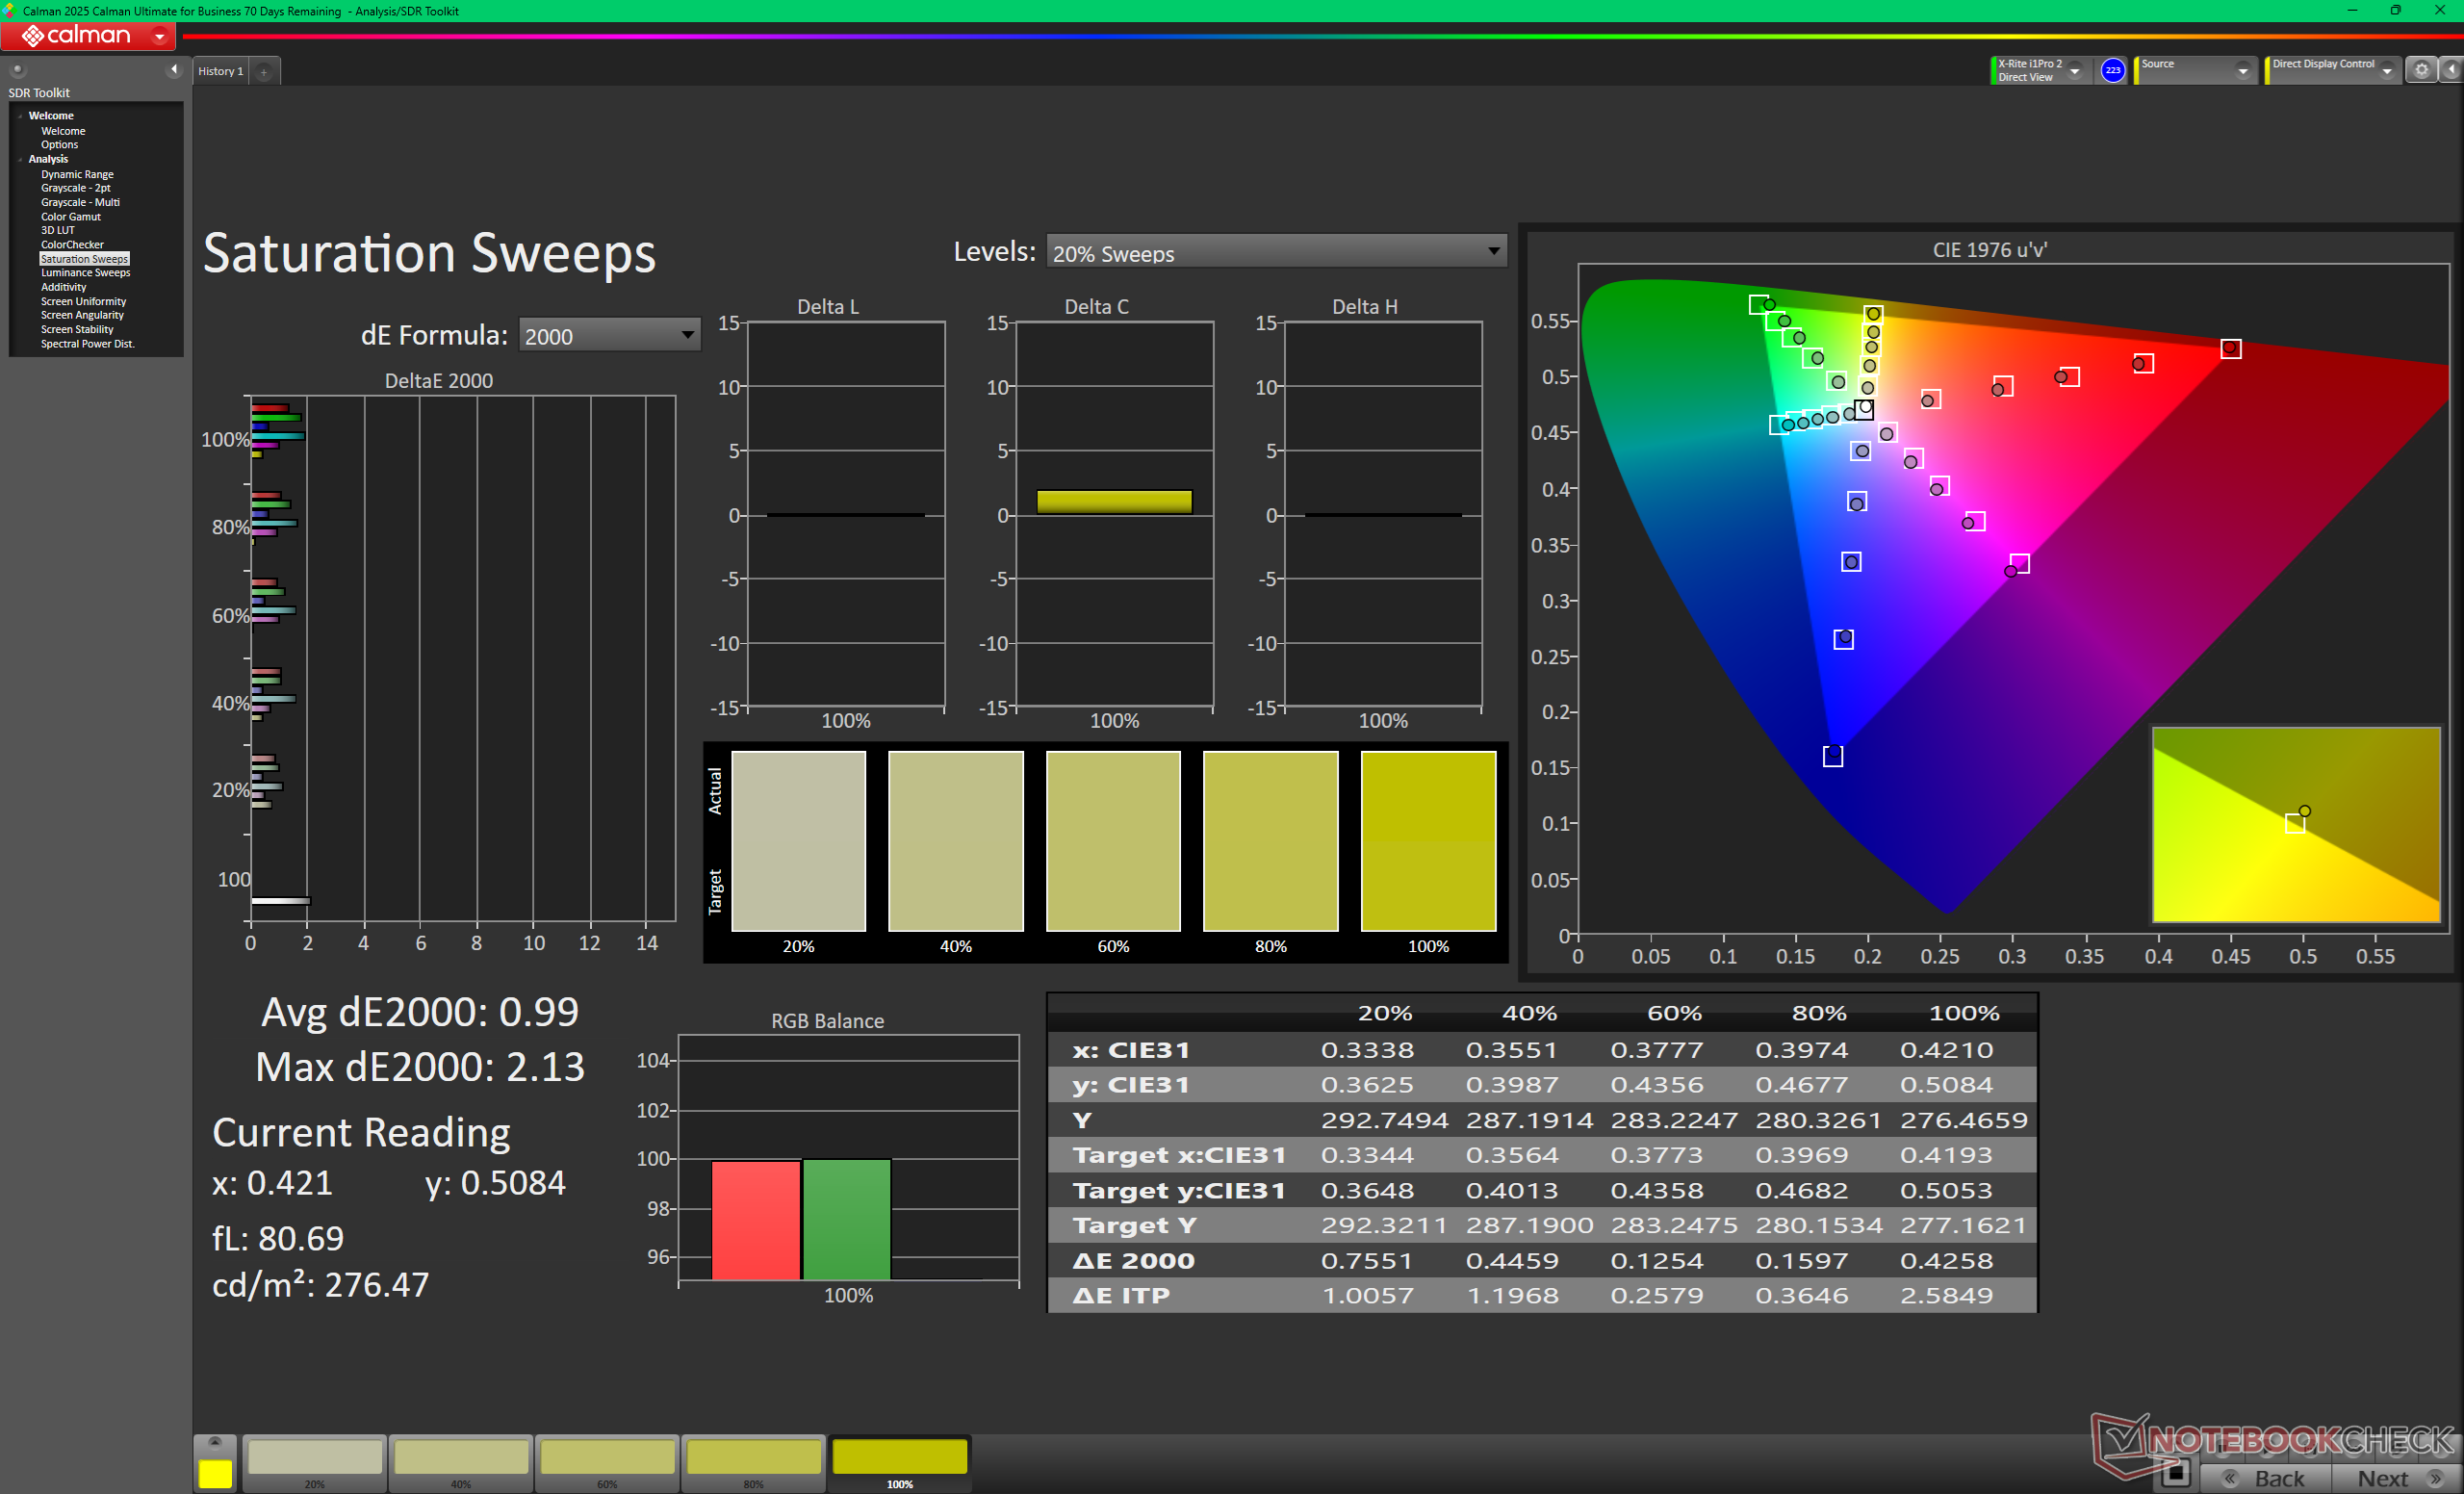
Saturation Sweeeps before calibration (vs. sRGB)
ColorChecker before calibration (vs. sRGB)
Grayscale after calibration
Saturation Sweeeps after calibration
ColorChecker after calibration

Display Response Times

ℹ
Display response times show how fast the screen is able to change from one color to the next. Slow response times can lead to afterimages and can cause moving objects to appear blurry (ghosting). Gamers of fast-paced 3D titles should pay special attention to fast response times.
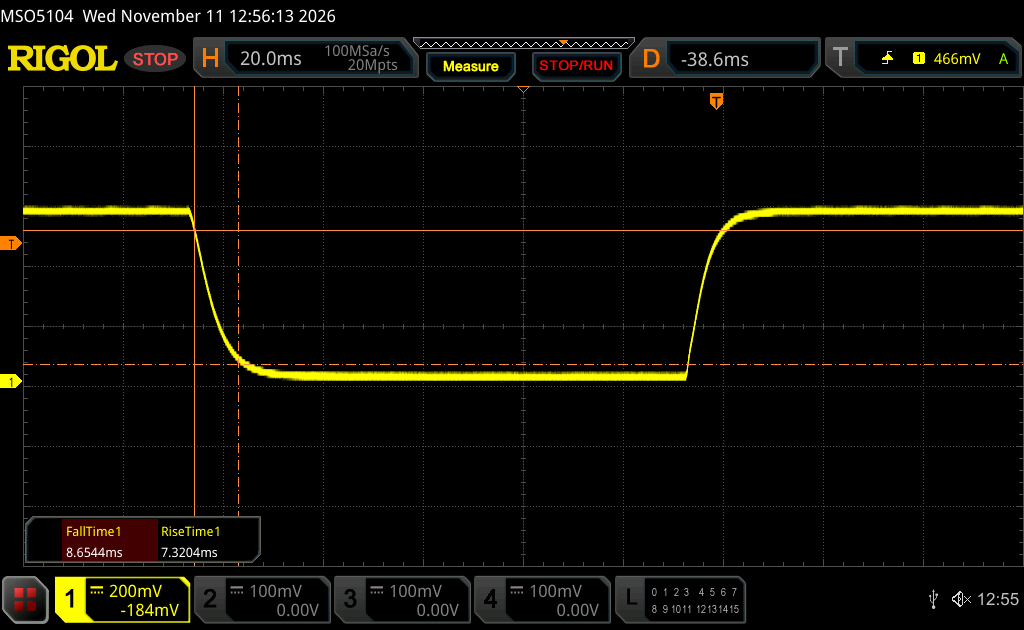
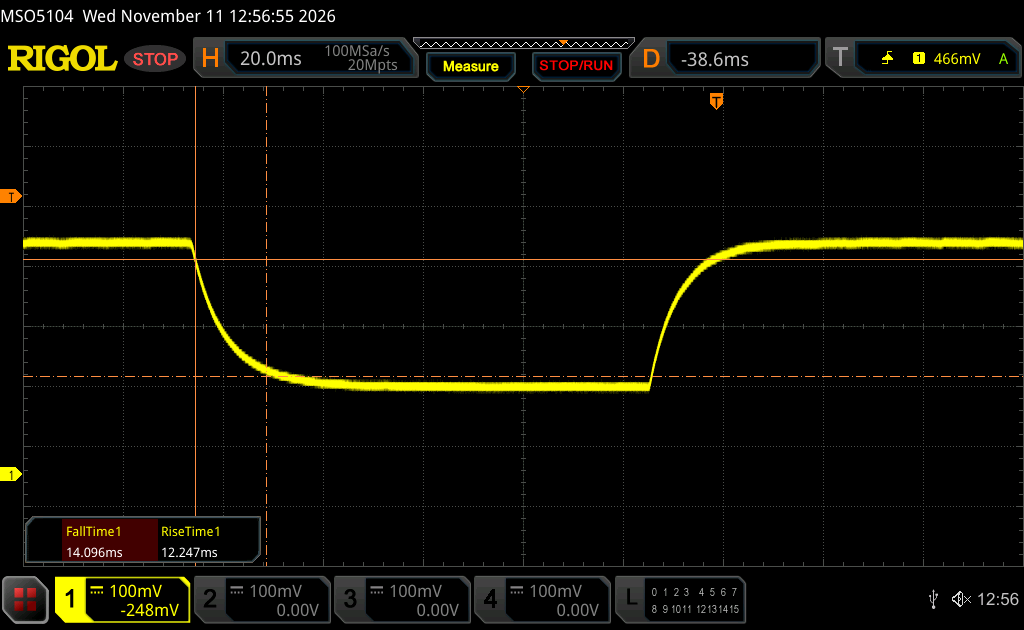
   ↔    Response Time Black to White
16 ms ... rise ↗ and fall ↘ combined↗ 7.3 ms rise
↘ 8.7 ms fall
The screen shows good response rates in our tests, but may be too slow for competitive gamers.
In comparison, all tested devices range from 0.1 (minimum) to 240 (maximum) ms. » 38 % of all devices are better.
This means that the measured response time is better than the average of all tested devices (19.6 ms).
   ↔    Response Time 50% Grey to 80% Grey
26.6 ms ... rise ↗ and fall ↘ combined↗ 12.5 ms rise
↘ 14.1 ms fall
The screen shows relatively slow response rates in our tests and may be too slow for gamers.
In comparison, all tested devices range from 0.13 (minimum) to 636 (maximum) ms. » 37 % of all devices are better.
This means that the measured response time is better than the average of all tested devices (30.6 ms).

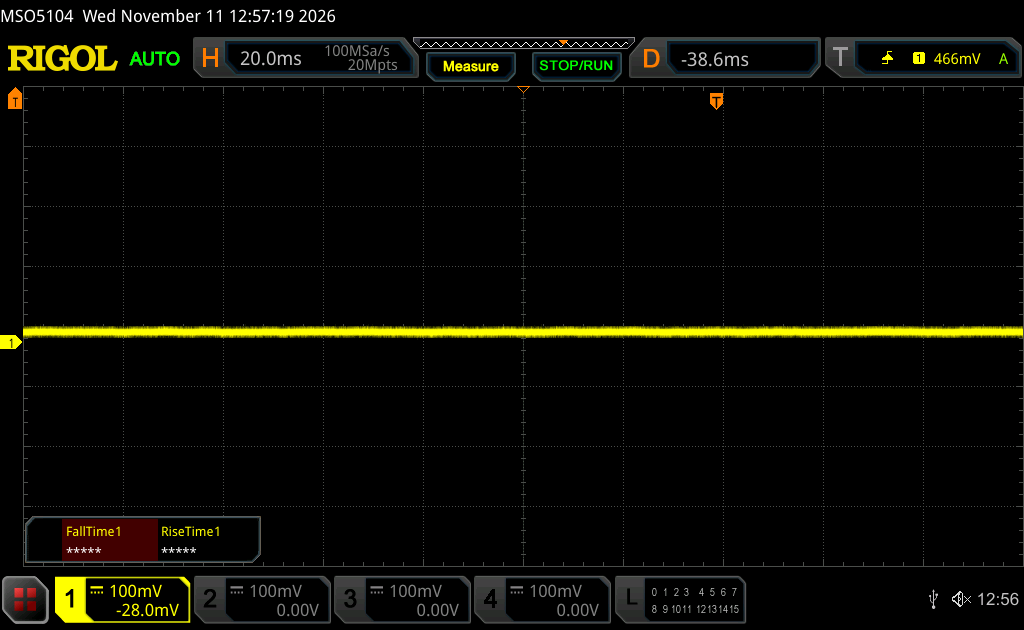
Screen Flickering / PWM (Pulse-Width Modulation)

ℹ
To dim the screen, some notebooks will simply cycle the backlight on and off in rapid succession - a method called Pulse Width Modulation (PWM) . This cycling frequency should ideally be undetectable to the human eye. If said frequency is too low, users with sensitive eyes may experience strain or headaches or even notice the flickering altogether.
Screen flickering / PWM not detected

In comparison: 52 % of all tested devices do not use PWM to dim the display. If PWM was detected, an average of 7544 (minimum: 5 - maximum: 343500) Hz was measured.

Outdoors under sunlight
Outdoors under shade
Outdoors under sunlight
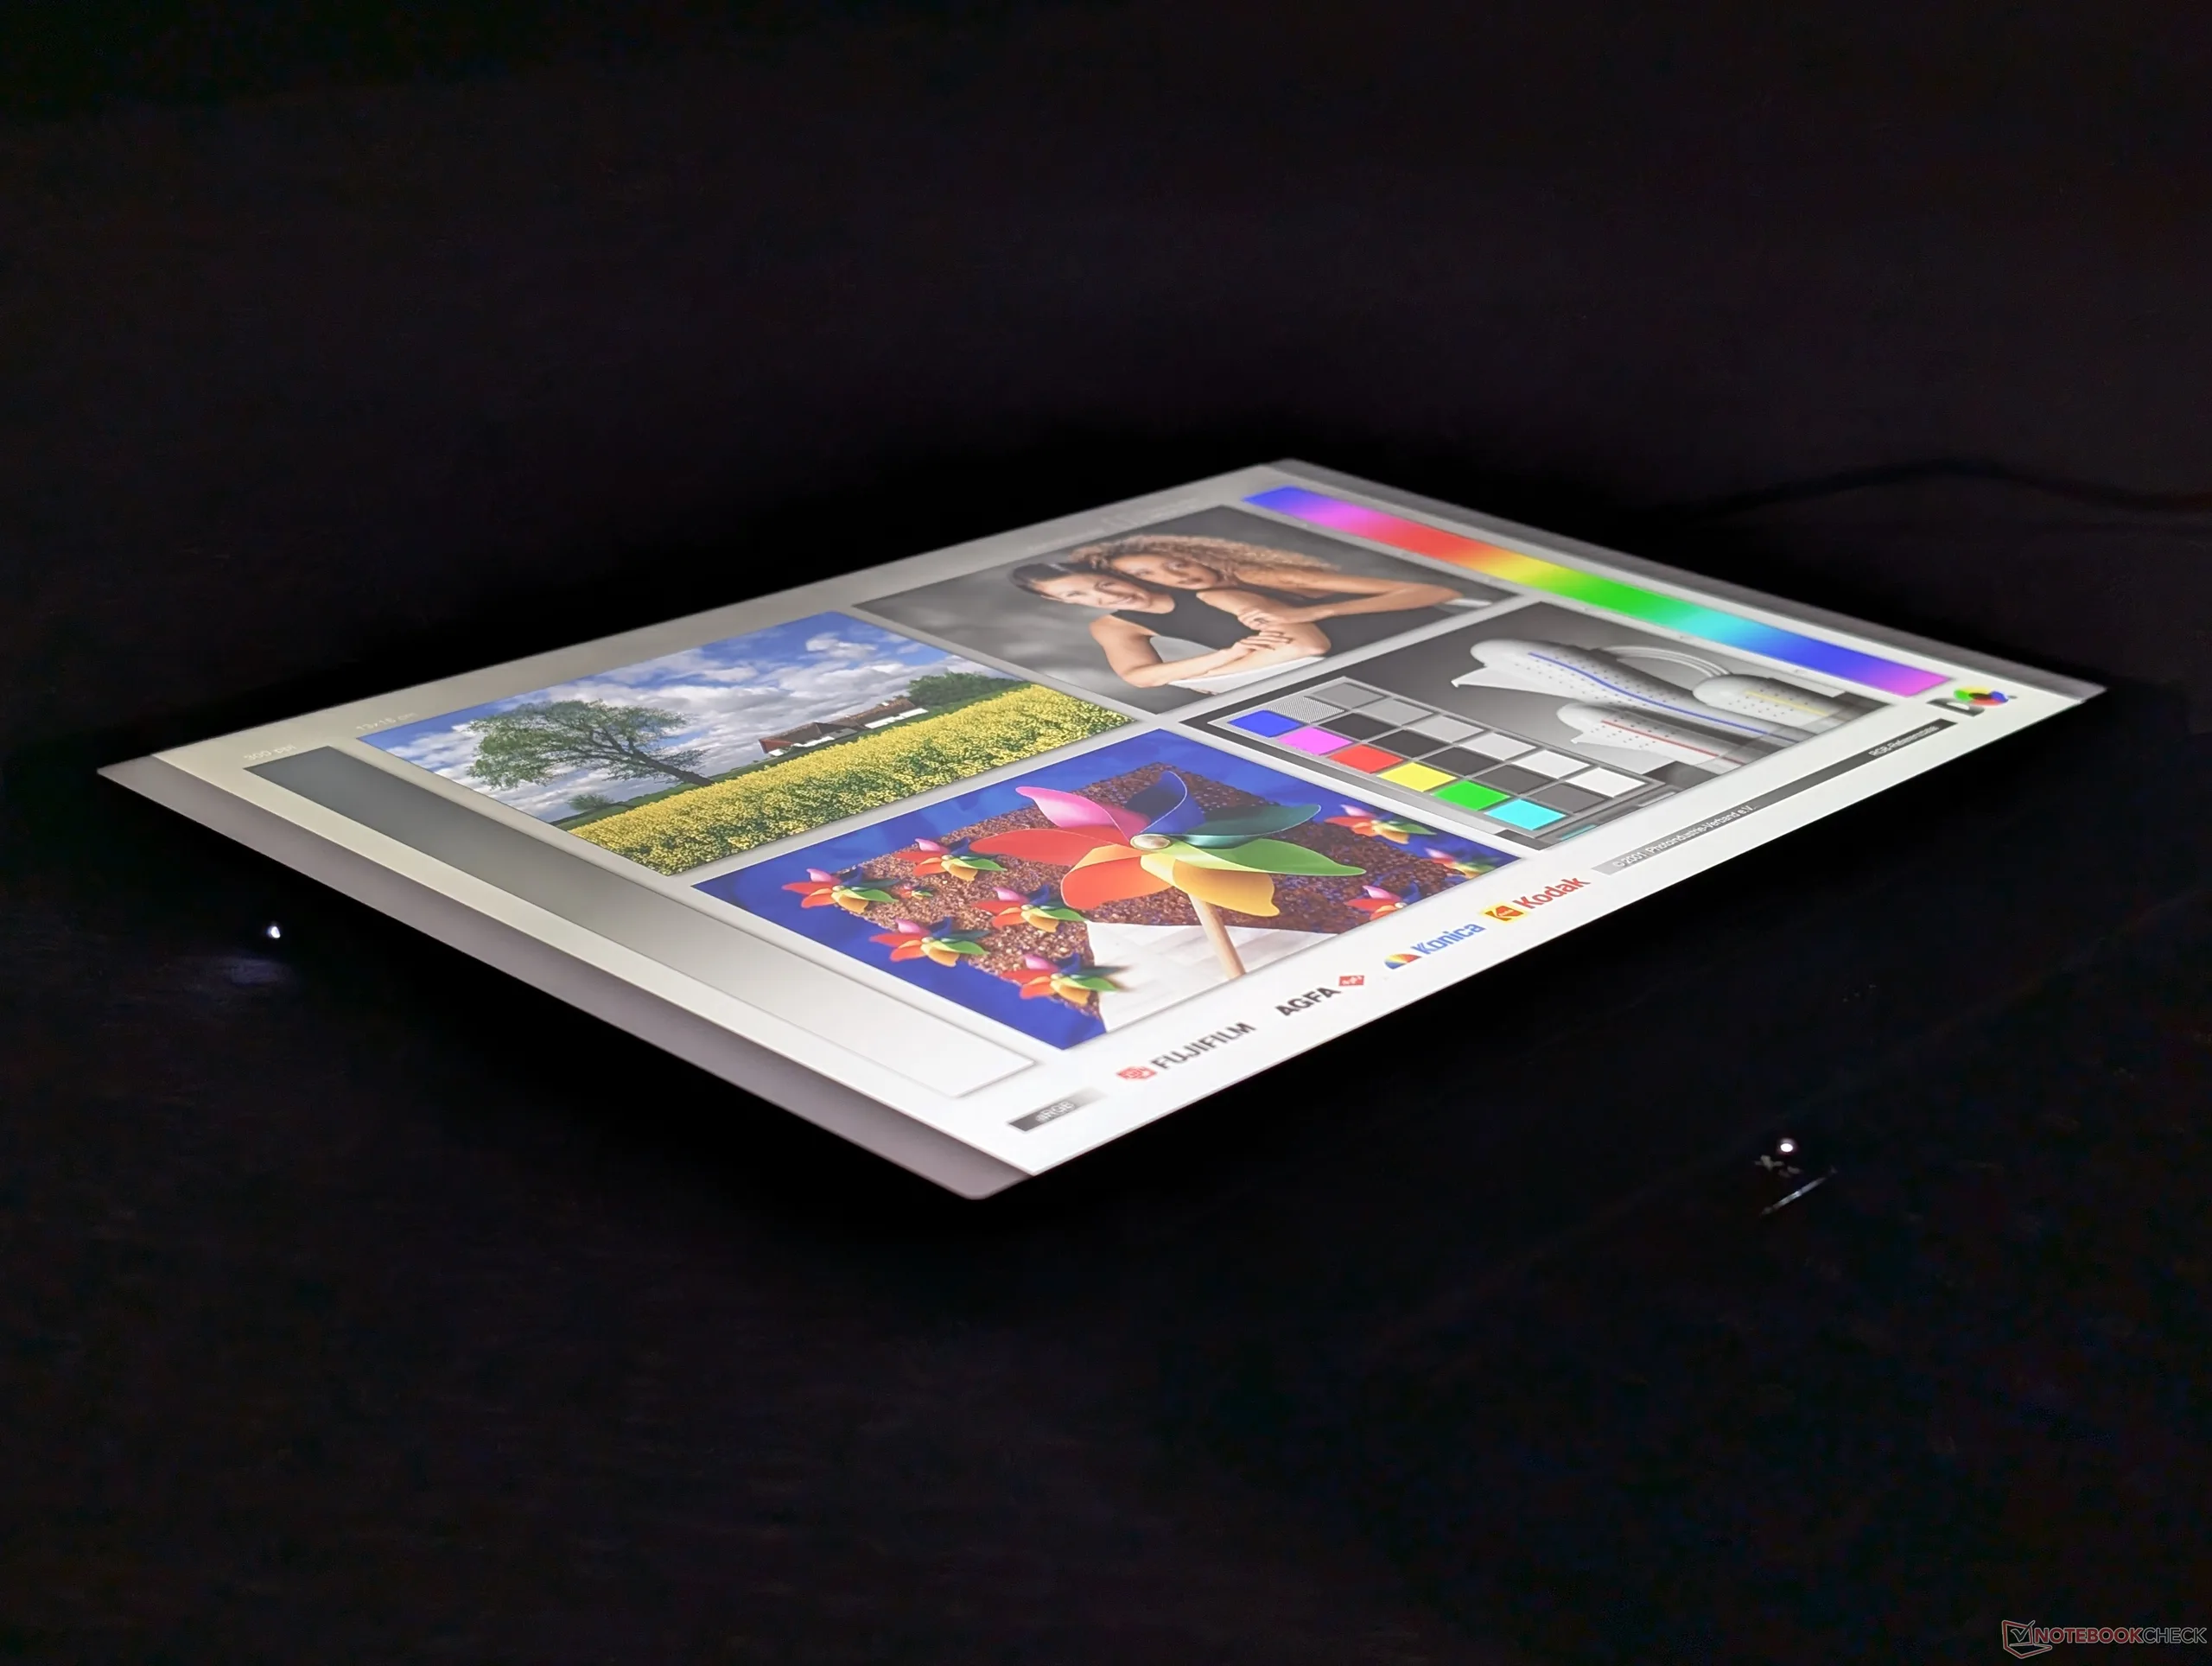
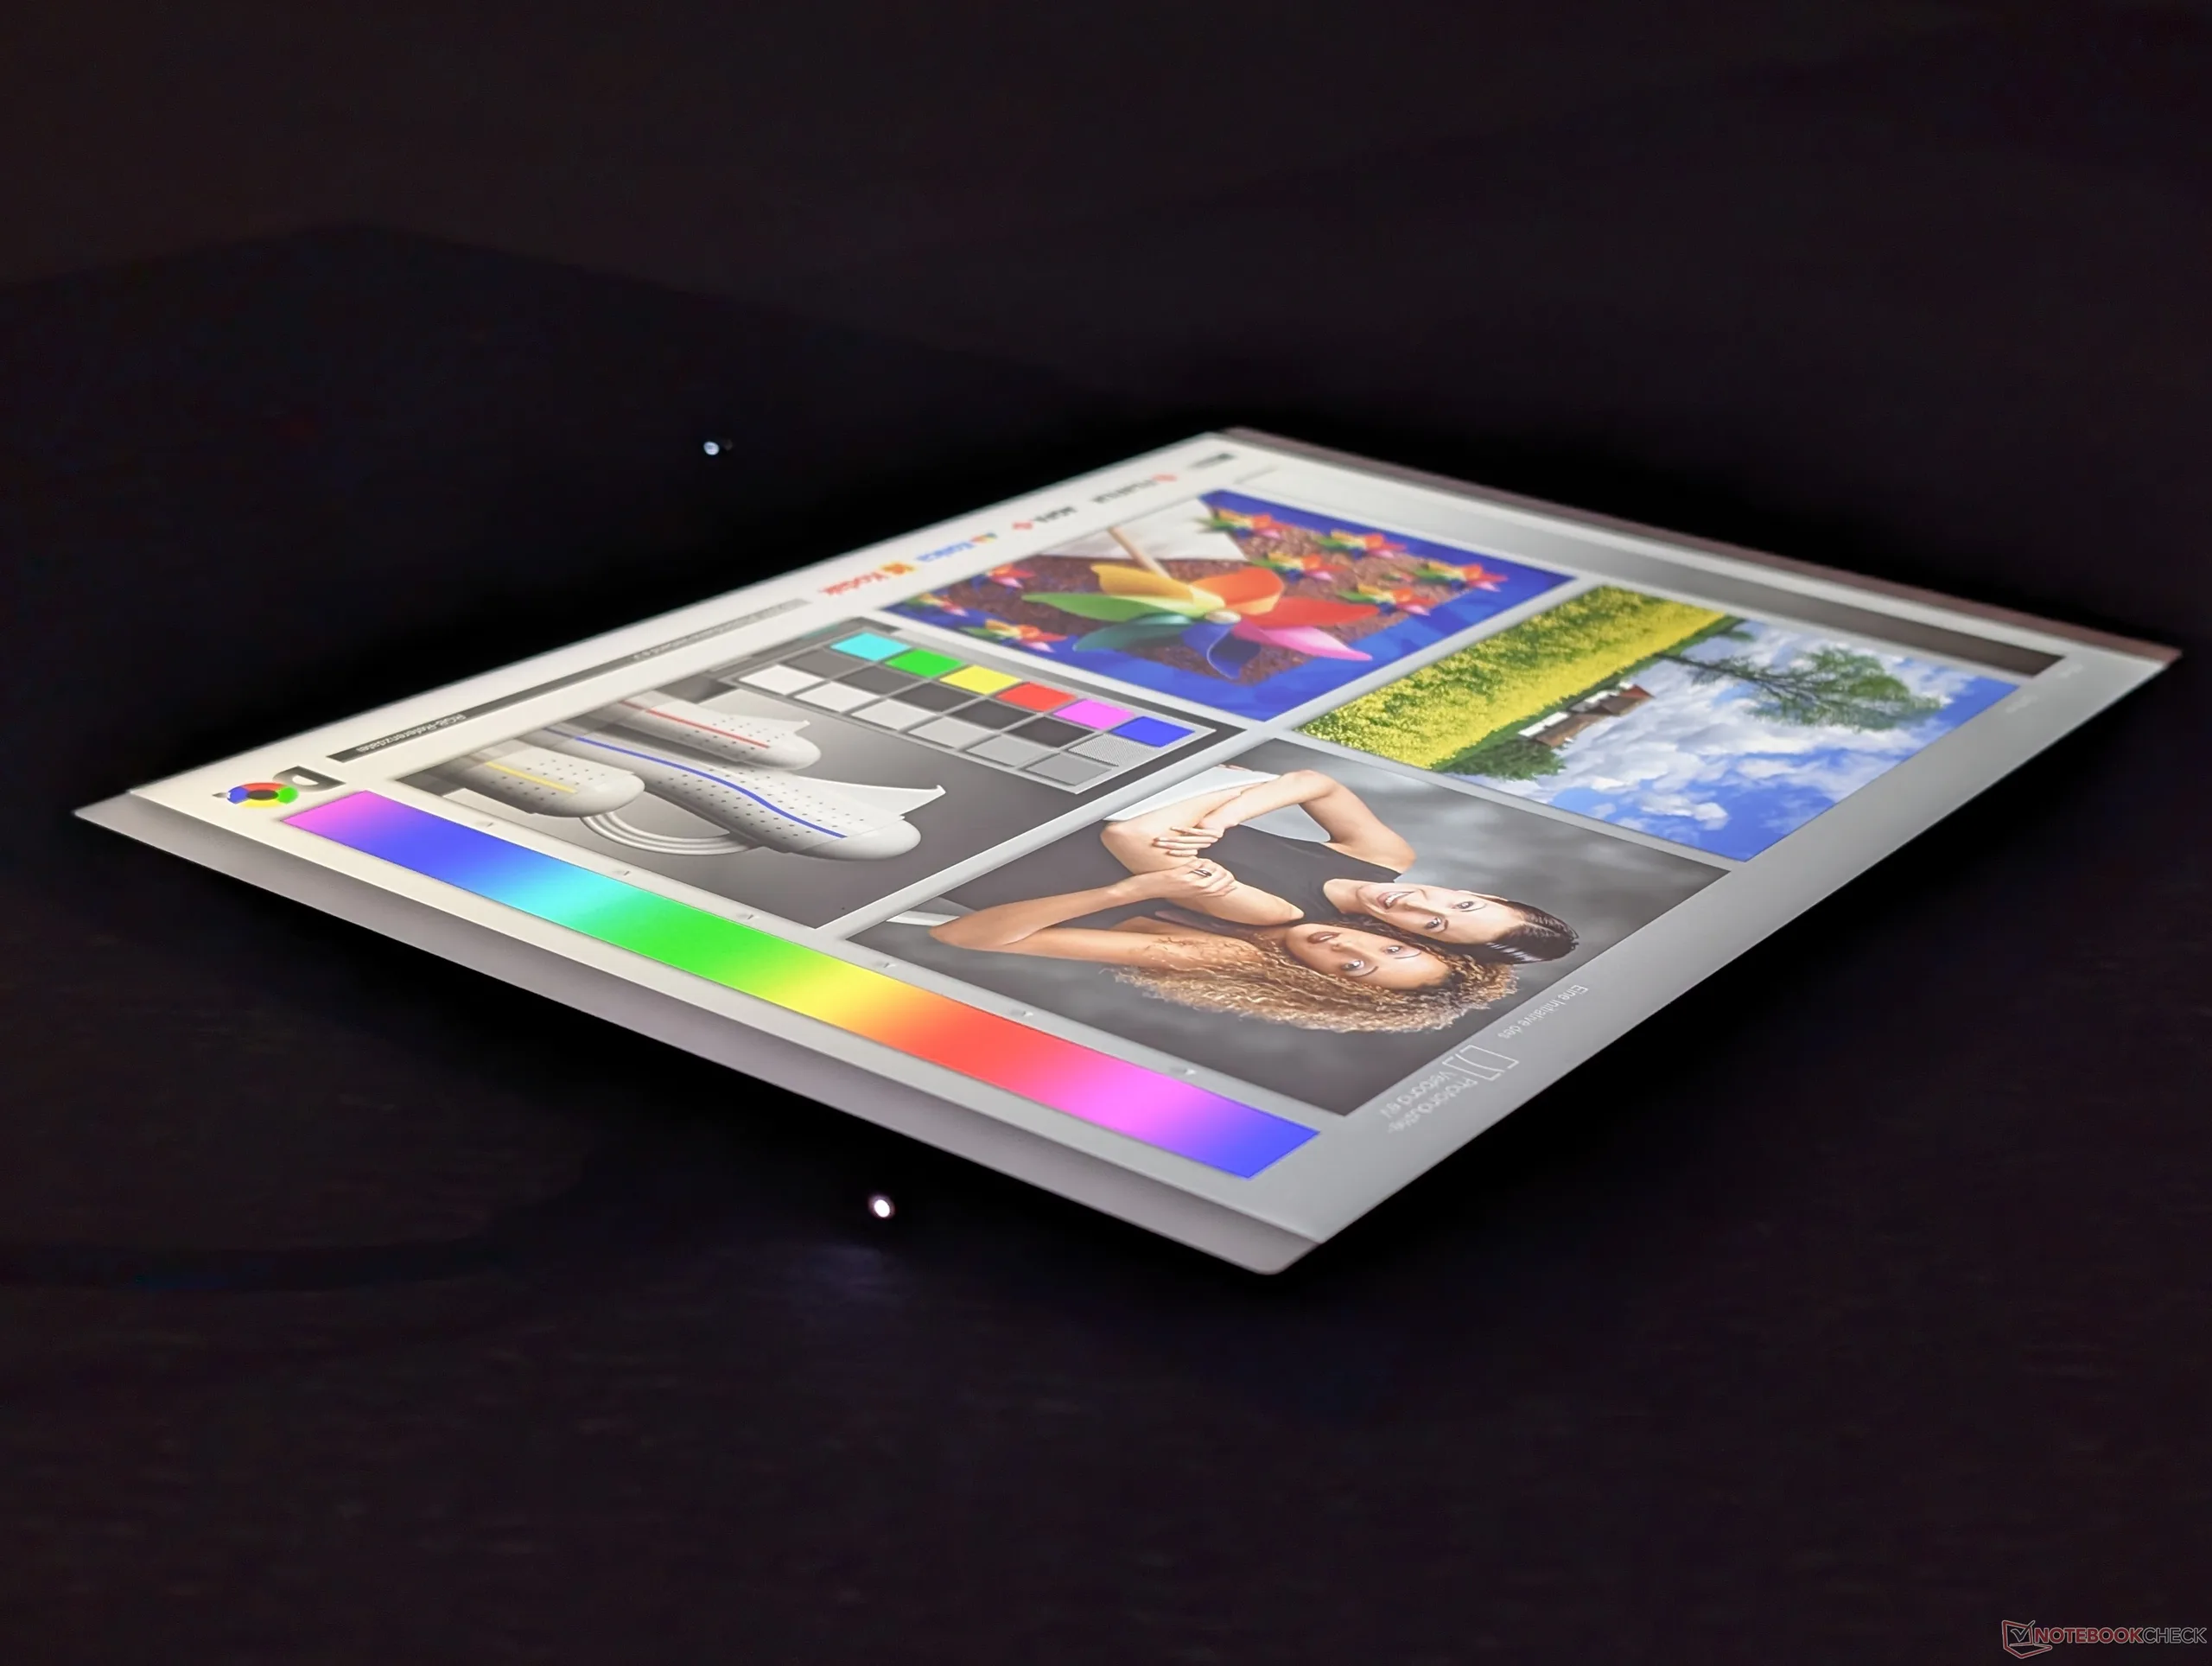
Wide IPS viewing angles

Performance

Testing Conditions

We set Windows to Performance mode prior to running the benchmarks below.

Processor Performance

Multi-thread performance would drop rather steeply from an initial high of 1620 points to a low of 1090 points when running our CineBench R15 xT loop test as shown by our graph below. The 33 percent dip makes the Core Ultra 7 365 slower than many Core Ultra 7 355 alternatives including Lenovo's own Yoga 9 2-in-1 14.

Cinebench R15 Multi Loop

060120180240300360420480540600660720780840900960102010801140120012601320138014401500156016201680174018001860192019802040210021602220228023402400246025202580264027002760Tooltip
Lenovo ThinkPad X13 Detachable Gen 1 Intel Core Ultra 7 365: Ø1117 (1085.13-1620.55) Points
Lenovo ThinkPad X13 Gen 7 AMD AMD Ryzen AI 7 PRO 450: Ø2144 (2038.94-2337.27) Points
Dell Pro 7 13 2-in-1 Intel Core Ultra 7 366H: Ø2326 (2282.32-2793.3) Points
Dell Pro 13 Premium PA13250 Intel Core Ultra 7 268V: Ø1199 (1128.6-1600.9) Points
MSI Prestige 13 AI+ A3MG Intel Core Ultra 9 386H: Ø1637 (1576.85-2196.6) Points
HP EliteBook 8 Flip G1i 13 Intel Core Ultra 7 265U: Ø1309 (1258.93-1735.81) Points
CPU Performance rating: Percent
Cinebench 2024: CPU Multi Core | CPU Single Core
Cinebench 2026: CPU Multi | CPU Single Thread
Cinebench R23: Multi Core | Single Core
Cinebench R20: CPU (Multi Core) | CPU (Single Core)
Cinebench R15: CPU Multi 64Bit | CPU Single 64Bit
Blender: v2.79 BMW27 CPU
7-Zip 18.03: 7z b 4 | 7z b 4 -mmt1
Geekbench 7: Multi-Core | Single-Core
Geekbench 6.7: Multi-Core | Single-Core
HWBOT x265 Benchmark v2.2: 4k Preset
LibreOffice : 20 Documents To PDF
R Benchmark 2.5: Overall mean
CPU Performance rating
Dell Pro 7 13 2-in-1 -2!
Intel Core Ultra 7 366H
88.5 pt
Lenovo ThinkPad X13 Gen 7 AMD -2!
AMD Ryzen AI 7 PRO 450
81.6 pt
HP OmniBook 7 Aero 13-bg1077nr -4!
AMD Ryzen AI 7 350
76.7 pt
MSI Prestige 13 AI+ A3MG -4!
Intel Core Ultra 9 386H
74.4 pt
Lenovo Yoga 9 2-in-1 14IPH11 -2!
Intel Core Ultra 7 355
69.2 pt
Average Intel Core Ultra 7 365
 
68.3 pt
Lenovo ThinkPad X13 Detachable Gen 1
Intel Core Ultra 7 365
68.1 pt
Dell XPS 13 9350 -4!
Intel Core Ultra 7 256V
65.3 pt
MSI Summit E13 AI Evo A1MTG -4!
Intel Core Ultra 7 155H
62.8 pt
Dell Pro 13 Premium PA13250 -6!
Intel Core Ultra 7 268V
61.6 pt
HP EliteBook 8 Flip G1i 13 -4!
Intel Core Ultra 7 265U
60.7 pt
Microsoft Surface Laptop 13 2026 -2!
Qualcomm Snapdragon X2 Plus X2P-42-100
59.9 pt
Lenovo Yoga Book 9 13IMU9 -6!
Intel Core Ultra 7 155U
57 pt
Cinebench 2024 / CPU Multi Core
Dell Pro 7 13 2-in-1
Intel Core Ultra 7 366H
935 Points +96%
MSI Prestige 13 AI+ A3MG
Intel Core Ultra 9 386H
873 Points +83%
HP OmniBook 7 Aero 13-bg1077nr
AMD Ryzen AI 7 350
819 Points +72%
Lenovo ThinkPad X13 Gen 7 AMD
AMD Ryzen AI 7 PRO 450
775 Points +63%
Microsoft Surface Laptop 13 2026
Qualcomm Snapdragon X2 Plus X2P-42-100
669 Points +41%
Lenovo Yoga 9 2-in-1 14IPH11
Intel Core Ultra 7 355
650 Points +37%
MSI Summit E13 AI Evo A1MTG
Intel Core Ultra 7 155H
609 Points +28%
Dell XPS 13 9350
Intel Core Ultra 7 256V
582 Points +22%
HP EliteBook 8 Flip G1i 13
Intel Core Ultra 7 265U
517 Points +9%
Lenovo ThinkPad X13 Detachable Gen 1
Intel Core Ultra 7 365
476 Points
Average Intel Core Ultra 7 365
  (n=1)
476 Points 0%
Cinebench 2024 / CPU Single Core
Microsoft Surface Laptop 13 2026
Qualcomm Snapdragon X2 Plus X2P-42-100
130 Points +11%
Dell Pro 7 13 2-in-1
Intel Core Ultra 7 366H
122.5 Points +5%
MSI Prestige 13 AI+ A3MG
Intel Core Ultra 9 386H
120 Points +3%
Lenovo Yoga 9 2-in-1 14IPH11
Intel Core Ultra 7 355
119.4 Points +2%
Dell XPS 13 9350
Intel Core Ultra 7 256V
117.4 Points 0%
Lenovo ThinkPad X13 Detachable Gen 1
Intel Core Ultra 7 365
117 Points
Average Intel Core Ultra 7 365
  (n=1)
117 Points 0%
HP OmniBook 7 Aero 13-bg1077nr
AMD Ryzen AI 7 350
115.5 Points -1%
Lenovo ThinkPad X13 Gen 7 AMD
AMD Ryzen AI 7 PRO 450
115.1 Points -2%
HP EliteBook 8 Flip G1i 13
Intel Core Ultra 7 265U
102.3 Points -13%
MSI Summit E13 AI Evo A1MTG
Intel Core Ultra 7 155H
97.1 Points -17%
Cinebench 2026 / CPU Multi
Dell Pro 7 13 2-in-1
Intel Core Ultra 7 366H
3799 Points +92%
Lenovo Yoga 9 2-in-1 14IPH11
Intel Core Ultra 7 355
2632 Points +33%
Lenovo ThinkPad X13 Detachable Gen 1
Intel Core Ultra 7 365
1978 Points
Average Intel Core Ultra 7 365
  (n=1)
1978 Points 0%
Cinebench 2026 / CPU Single Thread
Dell Pro 7 13 2-in-1
Intel Core Ultra 7 366H
506 Points +6%
Lenovo Yoga 9 2-in-1 14IPH11
Intel Core Ultra 7 355
487 Points +2%
Lenovo ThinkPad X13 Detachable Gen 1
Intel Core Ultra 7 365
477 Points
Average Intel Core Ultra 7 365
  (n=1)
477 Points 0%
Cinebench R23 / Multi Core
Dell Pro 7 13 2-in-1
Intel Core Ultra 7 366H
16974 (12709min - 16973.9max) Points +61%
Lenovo ThinkPad X13 Gen 7 AMD
AMD Ryzen AI 7 PRO 450
15348 Points +45%
HP OmniBook 7 Aero 13-bg1077nr
AMD Ryzen AI 7 350
14244 (12235.7min - 14243.7max) Points +35%
MSI Prestige 13 AI+ A3MG
Intel Core Ultra 9 386H
12144 Points +15%
MSI Summit E13 AI Evo A1MTG
Intel Core Ultra 7 155H
11840 (10698.4min - 11840.3max) Points +12%
Lenovo Yoga 9 2-in-1 14IPH11
Intel Core Ultra 7 355
11456 (10514.2min - 11456max) Points +8%
HP EliteBook 8 Flip G1i 13
Intel Core Ultra 7 265U
10623 (8296.55min - 10623.2max) Points 0%
Lenovo ThinkPad X13 Detachable Gen 1
Intel Core Ultra 7 365
10573 (7430.6min - 10573.1max) Points
Average Intel Core Ultra 7 365
  (n=1)
10573 Points 0%
Dell XPS 13 9350
Intel Core Ultra 7 256V
10391 (9371.44min - 10390.8max) Points -2%
Dell Pro 13 Premium PA13250
Intel Core Ultra 7 268V
9835 Points -7%
Lenovo Yoga Book 9 13IMU9
Intel Core Ultra 7 155U
9385 (8670.97min - 9384.63max) Points -11%
Microsoft Surface Laptop 13 2026
Qualcomm Snapdragon X2 Plus X2P-42-100
6827 Points -35%
Cinebench R23 / Single Core
Dell Pro 7 13 2-in-1
Intel Core Ultra 7 366H
2087 Points +6%
MSI Prestige 13 AI+ A3MG
Intel Core Ultra 9 386H
2077 Points +5%
Lenovo ThinkPad X13 Gen 7 AMD
AMD Ryzen AI 7 PRO 450
2005 Points +2%
Dell Pro 13 Premium PA13250
Intel Core Ultra 7 268V
1985 Points +1%
HP OmniBook 7 Aero 13-bg1077nr
AMD Ryzen AI 7 350
1979 Points 0%
Lenovo Yoga 9 2-in-1 14IPH11
Intel Core Ultra 7 355
1977 Points 0%
Lenovo ThinkPad X13 Detachable Gen 1
Intel Core Ultra 7 365
1971 Points
Average Intel Core Ultra 7 365
  (n=1)
1971 Points 0%
Dell XPS 13 9350
Intel Core Ultra 7 256V
1875 Points -5%
HP EliteBook 8 Flip G1i 13
Intel Core Ultra 7 265U
1749 Points -11%
MSI Summit E13 AI Evo A1MTG
Intel Core Ultra 7 155H
1679 Points -15%
Lenovo Yoga Book 9 13IMU9
Intel Core Ultra 7 155U
1675 Points -15%
Microsoft Surface Laptop 13 2026
Qualcomm Snapdragon X2 Plus X2P-42-100
1396 Points -29%
Cinebench R20 / CPU (Multi Core)
Dell Pro 7 13 2-in-1
Intel Core Ultra 7 366H
6517 Points +60%
Lenovo ThinkPad X13 Gen 7 AMD
AMD Ryzen AI 7 PRO 450
6004 Points +47%
HP OmniBook 7 Aero 13-bg1077nr
AMD Ryzen AI 7 350
5404 Points +32%
MSI Prestige 13 AI+ A3MG
Intel Core Ultra 9 386H
4757 Points +17%
MSI Summit E13 AI Evo A1MTG
Intel Core Ultra 7 155H
4534 Points +11%
Lenovo Yoga 9 2-in-1 14IPH11
Intel Core Ultra 7 355
4408 Points +8%
Lenovo ThinkPad X13 Detachable Gen 1
Intel Core Ultra 7 365
4082 Points
Average Intel Core Ultra 7 365
  (n=1)
4082 Points 0%
HP EliteBook 8 Flip G1i 13
Intel Core Ultra 7 265U
4061 Points -1%
Dell XPS 13 9350
Intel Core Ultra 7 256V
4038 Points -1%
Dell Pro 13 Premium PA13250
Intel Core Ultra 7 268V
3811 Points -7%
Lenovo Yoga Book 9 13IMU9
Intel Core Ultra 7 155U
3613 Points -11%
Microsoft Surface Laptop 13 2026
Qualcomm Snapdragon X2 Plus X2P-42-100
2679 Points -34%
Cinebench R20 / CPU (Single Core)
Dell Pro 7 13 2-in-1
Intel Core Ultra 7 366H
789 Points +7%
MSI Prestige 13 AI+ A3MG
Intel Core Ultra 9 386H
787 Points +7%
Lenovo ThinkPad X13 Gen 7 AMD
AMD Ryzen AI 7 PRO 450
787 Points +7%
HP OmniBook 7 Aero 13-bg1077nr
AMD Ryzen AI 7 350
774 Points +5%
Dell Pro 13 Premium PA13250
Intel Core Ultra 7 268V
764 Points +4%
Lenovo Yoga 9 2-in-1 14IPH11
Intel Core Ultra 7 355
741 Points +1%
Lenovo ThinkPad X13 Detachable Gen 1
Intel Core Ultra 7 365
735 Points
Average Intel Core Ultra 7 365
  (n=1)
735 Points 0%
Dell XPS 13 9350
Intel Core Ultra 7 256V
720 Points -2%
HP EliteBook 8 Flip G1i 13
Intel Core Ultra 7 265U
678 Points -8%
Lenovo Yoga Book 9 13IMU9
Intel Core Ultra 7 155U
646 Points -12%
MSI Summit E13 AI Evo A1MTG
Intel Core Ultra 7 155H
642 Points -13%
Microsoft Surface Laptop 13 2026
Qualcomm Snapdragon X2 Plus X2P-42-100
532 Points -28%
Cinebench R15 / CPU Multi 64Bit
Dell Pro 7 13 2-in-1
Intel Core Ultra 7 366H
2793 (2282.32min - 2793.3max) Points +72%
Lenovo ThinkPad X13 Gen 7 AMD
AMD Ryzen AI 7 PRO 450
2337 (2038.94min - 2337.27max) Points +44%
MSI Prestige 13 AI+ A3MG
Intel Core Ultra 9 386H
2197 (1576.85min - 2196.6max) Points +36%
MSI Summit E13 AI Evo A1MTG
Intel Core Ultra 7 155H
2145 (1553.04min - 2145.23max) Points +32%
HP OmniBook 7 Aero 13-bg1077nr
AMD Ryzen AI 7 350
2038 (1917.36min - 2037.7max) Points +26%
HP EliteBook 8 Flip G1i 13
Intel Core Ultra 7 265U
1736 (1258.93min - 1735.81max) Points +7%
Lenovo Yoga 9 2-in-1 14IPH11
Intel Core Ultra 7 355
1701 (1405.88min - 1700.68max) Points +5%
Lenovo ThinkPad X13 Detachable Gen 1
Intel Core Ultra 7 365
1621 (1085.13min - 1620.55max) Points
Average Intel Core Ultra 7 365
  (n=1)
1621 Points 0%
Dell Pro 13 Premium PA13250
Intel Core Ultra 7 268V
1601 (1128.6min - 1600.9max) Points -1%
Dell XPS 13 9350
Intel Core Ultra 7 256V
1570 (1369.16min - 1569.86max) Points -3%
Lenovo Yoga Book 9 13IMU9
Intel Core Ultra 7 155U
1505 (1278.32min - 1504.72max) Points -7%
Microsoft Surface Laptop 13 2026
Qualcomm Snapdragon X2 Plus X2P-42-100
1395 (1213.92min - 1394.6max) Points -14%
Cinebench R15 / CPU Single 64Bit
Dell Pro 13 Premium PA13250
Intel Core Ultra 7 268V
302 Points +9%
HP OmniBook 7 Aero 13-bg1077nr
AMD Ryzen AI 7 350
297 Points +8%
MSI Prestige 13 AI+ A3MG
Intel Core Ultra 9 386H
293 Points +6%
Lenovo Yoga 9 2-in-1 14IPH11
Intel Core Ultra 7 355
293 Points +6%
Dell Pro 7 13 2-in-1
Intel Core Ultra 7 366H
291 Points +5%
Dell XPS 13 9350
Intel Core Ultra 7 256V
285 Points +3%
Lenovo ThinkPad X13 Detachable Gen 1
Intel Core Ultra 7 365
276 Points
Average Intel Core Ultra 7 365
  (n=1)
276 Points 0%
Microsoft Surface Laptop 13 2026
Qualcomm Snapdragon X2 Plus X2P-42-100
259 Points -6%
HP EliteBook 8 Flip G1i 13
Intel Core Ultra 7 265U
244 Points -12%
MSI Summit E13 AI Evo A1MTG
Intel Core Ultra 7 155H
240 Points -13%
Lenovo Yoga Book 9 13IMU9
Intel Core Ultra 7 155U
230 Points -17%
Lenovo ThinkPad X13 Gen 7 AMD
AMD Ryzen AI 7 PRO 450
223 Points -19%
Blender / v2.79 BMW27 CPU
Microsoft Surface Laptop 13 2026
Qualcomm Snapdragon X2 Plus X2P-42-100
492 Seconds * -25%
Dell Pro 13 Premium PA13250
Intel Core Ultra 7 268V
410 Seconds * -4%
Lenovo ThinkPad X13 Detachable Gen 1
Intel Core Ultra 7 365
395 Seconds *
Average Intel Core Ultra 7 365
  (n=1)
395 Seconds * -0%
Lenovo Yoga Book 9 13IMU9
Intel Core Ultra 7 155U
353 Seconds * +11%
Dell XPS 13 9350
Intel Core Ultra 7 256V
339 Seconds * +14%
HP EliteBook 8 Flip G1i 13
Intel Core Ultra 7 265U
335 Seconds * +15%
Lenovo Yoga 9 2-in-1 14IPH11
Intel Core Ultra 7 355
306 Seconds * +23%
MSI Prestige 13 AI+ A3MG
Intel Core Ultra 9 386H
299 Seconds * +24%
MSI Summit E13 AI Evo A1MTG
Intel Core Ultra 7 155H
293 Seconds * +26%
HP OmniBook 7 Aero 13-bg1077nr
AMD Ryzen AI 7 350
230 Seconds * +42%
Lenovo ThinkPad X13 Gen 7 AMD
AMD Ryzen AI 7 PRO 450
216 Seconds * +45%
Dell Pro 7 13 2-in-1
Intel Core Ultra 7 366H
209 Seconds * +47%
7-Zip 18.03 / 7z b 4
Dell Pro 7 13 2-in-1
Intel Core Ultra 7 366H
61043 MIPS +63%
Lenovo ThinkPad X13 Gen 7 AMD
AMD Ryzen AI 7 PRO 450
57311 MIPS +53%
HP OmniBook 7 Aero 13-bg1077nr
AMD Ryzen AI 7 350
55010 MIPS +47%
MSI Summit E13 AI Evo A1MTG
Intel Core Ultra 7 155H
45131 MIPS +21%
MSI Prestige 13 AI+ A3MG
Intel Core Ultra 9 386H
44980 MIPS +20%
HP EliteBook 8 Flip G1i 13
Intel Core Ultra 7 265U
38771 MIPS +4%
Lenovo Yoga Book 9 13IMU9
Intel Core Ultra 7 155U
38645 MIPS +3%
Lenovo Yoga 9 2-in-1 14IPH11
Intel Core Ultra 7 355
37739 MIPS +1%
Lenovo ThinkPad X13 Detachable Gen 1
Intel Core Ultra 7 365
37367 MIPS
Average Intel Core Ultra 7 365
  (n=1)
37367 MIPS 0%
Dell XPS 13 9350
Intel Core Ultra 7 256V
35950 MIPS -4%
Dell Pro 13 Premium PA13250
Intel Core Ultra 7 268V
32797 MIPS -12%
Microsoft Surface Laptop 13 2026
Qualcomm Snapdragon X2 Plus X2P-42-100
31674 MIPS -15%
7-Zip 18.03 / 7z b 4 -mmt1
Dell Pro 7 13 2-in-1
Intel Core Ultra 7 366H
6404 MIPS +9%
Lenovo ThinkPad X13 Gen 7 AMD
AMD Ryzen AI 7 PRO 450
6097 MIPS +4%
HP OmniBook 7 Aero 13-bg1077nr
AMD Ryzen AI 7 350
6025 MIPS +2%
MSI Prestige 13 AI+ A3MG
Intel Core Ultra 9 386H
6001 MIPS +2%
Lenovo ThinkPad X13 Detachable Gen 1
Intel Core Ultra 7 365
5890 MIPS
Average Intel Core Ultra 7 365
  (n=1)
5890 MIPS 0%
Dell Pro 13 Premium PA13250
Intel Core Ultra 7 268V
5884 MIPS 0%
Lenovo Yoga 9 2-in-1 14IPH11
Intel Core Ultra 7 355
5769 MIPS -2%
Dell XPS 13 9350
Intel Core Ultra 7 256V
5727 MIPS -3%
Microsoft Surface Laptop 13 2026
Qualcomm Snapdragon X2 Plus X2P-42-100
5514 MIPS -6%
HP EliteBook 8 Flip G1i 13
Intel Core Ultra 7 265U
5088 MIPS -14%
Lenovo Yoga Book 9 13IMU9
Intel Core Ultra 7 155U
4855 MIPS -18%
MSI Summit E13 AI Evo A1MTG
Intel Core Ultra 7 155H
4594 MIPS -22%
Geekbench 7 / Multi-Core
Lenovo ThinkPad X13 Gen 7 AMD
AMD Ryzen AI 7 PRO 450
14007 Points +42%
Microsoft Surface Laptop 13 2026
Qualcomm Snapdragon X2 Plus X2P-42-100
12503 Points +27%
Average Intel Core Ultra 7 365
  (9878 - 11480, n=2)
10679 Points +8%
Lenovo ThinkPad X13 Detachable Gen 1
Intel Core Ultra 7 365
9878 Points
Geekbench 7 / Single-Core
Microsoft Surface Laptop 13 2026
Qualcomm Snapdragon X2 Plus X2P-42-100
2804 Points +15%
Lenovo ThinkPad X13 Gen 7 AMD
AMD Ryzen AI 7 PRO 450
2494 Points +2%
Average Intel Core Ultra 7 365
  (2447 - 2493, n=2)
2470 Points +1%
Lenovo ThinkPad X13 Detachable Gen 1
Intel Core Ultra 7 365
2447 Points
Geekbench 6.7 / Multi-Core
Dell Pro 7 13 2-in-1
Intel Core Ultra 7 366H
16251 Points +42%
MSI Prestige 13 AI+ A3MG
Intel Core Ultra 9 386H
13776 Points +20%
Lenovo ThinkPad X13 Gen 7 AMD
AMD Ryzen AI 7 PRO 450
13683 Points +20%
HP OmniBook 7 Aero 13-bg1077nr
AMD Ryzen AI 7 350
13083 Points +14%
Microsoft Surface Laptop 13 2026
Qualcomm Snapdragon X2 Plus X2P-42-100
12070 Points +5%
Lenovo ThinkPad X13 Detachable Gen 1
Intel Core Ultra 7 365
11447 Points
Average Intel Core Ultra 7 365
  (10960 - 11447, n=2)
11204 Points -2%
Dell XPS 13 9350
Intel Core Ultra 7 256V
10972 Points -4%
Lenovo Yoga 9 2-in-1 14IPH11
Intel Core Ultra 7 355
10971 Points -4%
MSI Summit E13 AI Evo A1MTG
Intel Core Ultra 7 155H
10836 Points -5%
HP EliteBook 8 Flip G1i 13
Intel Core Ultra 7 265U
10707 Points -6%
Dell Pro 13 Premium PA13250
Intel Core Ultra 7 268V
10589 Points -7%
Lenovo Yoga Book 9 13IMU9
Intel Core Ultra 7 155U
9448 Points -17%
Geekbench 6.7 / Single-Core
Microsoft Surface Laptop 13 2026
Qualcomm Snapdragon X2 Plus X2P-42-100
3269 Points +18%
Lenovo ThinkPad X13 Gen 7 AMD
AMD Ryzen AI 7 PRO 450
2916 Points +5%
HP OmniBook 7 Aero 13-bg1077nr
AMD Ryzen AI 7 350
2886 Points +4%
MSI Prestige 13 AI+ A3MG
Intel Core Ultra 9 386H
2873 Points +4%
Dell Pro 7 13 2-in-1
Intel Core Ultra 7 366H
2844 Points +3%
Dell Pro 13 Premium PA13250
Intel Core Ultra 7 268V
2809 Points +1%
Dell XPS 13 9350
Intel Core Ultra 7 256V
2778 Points 0%
Lenovo ThinkPad X13 Detachable Gen 1
Intel Core Ultra 7 365
2769 Points
Lenovo Yoga 9 2-in-1 14IPH11
Intel Core Ultra 7 355
2755 Points -1%
Average Intel Core Ultra 7 365
  (2737 - 2769, n=2)
2753 Points -1%
HP EliteBook 8 Flip G1i 13
Intel Core Ultra 7 265U
2477 Points -11%
Lenovo Yoga Book 9 13IMU9
Intel Core Ultra 7 155U
2324 Points -16%
MSI Summit E13 AI Evo A1MTG
Intel Core Ultra 7 155H
2322 Points -16%
HWBOT x265 Benchmark v2.2 / 4k Preset
Lenovo ThinkPad X13 Gen 7 AMD
AMD Ryzen AI 7 PRO 450
19.4 fps +50%
Dell Pro 7 13 2-in-1
Intel Core Ultra 7 366H
19.2 fps +49%
HP OmniBook 7 Aero 13-bg1077nr
AMD Ryzen AI 7 350
14 fps +9%
MSI Prestige 13 AI+ A3MG
Intel Core Ultra 9 386H
13.2 fps +2%
Dell XPS 13 9350
Intel Core Ultra 7 256V
13.1 fps +2%
MSI Summit E13 AI Evo A1MTG
Intel Core Ultra 7 155H
13 fps +1%
Lenovo ThinkPad X13 Detachable Gen 1
Intel Core Ultra 7 365
12.9 fps
Average Intel Core Ultra 7 365
  (n=1)
12.9 fps 0%
HP EliteBook 8 Flip G1i 13
Intel Core Ultra 7 265U
11.4 fps -12%
Lenovo Yoga Book 9 13IMU9
Intel Core Ultra 7 155U
10.7 fps -17%
Dell Pro 13 Premium PA13250
Intel Core Ultra 7 268V
10.4 fps -19%
Lenovo Yoga 9 2-in-1 14IPH11
Intel Core Ultra 7 355
7.31 fps -43%
Microsoft Surface Laptop 13 2026
Qualcomm Snapdragon X2 Plus X2P-42-100
5.34 fps -59%
LibreOffice / 20 Documents To PDF
MSI Summit E13 AI Evo A1MTG
Intel Core Ultra 7 155H
62.7 s * -57%
Dell Pro 13 Premium PA13250
Intel Core Ultra 7 268V
60.8 s * -52%
HP EliteBook 8 Flip G1i 13
Intel Core Ultra 7 265U
58.1 s * -46%
MSI Prestige 13 AI+ A3MG
Intel Core Ultra 9 386H
56.1 s * -41%
Dell XPS 13 9350
Intel Core Ultra 7 256V
53.2 s * -33%
HP OmniBook 7 Aero 13-bg1077nr
AMD Ryzen AI 7 350
51.2 s * -28%
Lenovo ThinkPad X13 Gen 7 AMD
AMD Ryzen AI 7 PRO 450
47.9 s * -20%
Microsoft Surface Laptop 13 2026
Qualcomm Snapdragon X2 Plus X2P-42-100
46.3 s * -16%
Lenovo Yoga Book 9 13IMU9
Intel Core Ultra 7 155U
44.3 s * -11%
Dell Pro 7 13 2-in-1
Intel Core Ultra 7 366H
43.6 s * -9%
Lenovo ThinkPad X13 Detachable Gen 1
Intel Core Ultra 7 365
39.9 s *
Average Intel Core Ultra 7 365
  (n=1)
39.9 s * -0%
Lenovo Yoga 9 2-in-1 14IPH11
Intel Core Ultra 7 355
39.6 s * +1%
R Benchmark 2.5 / Overall mean
Microsoft Surface Laptop 13 2026
Qualcomm Snapdragon X2 Plus X2P-42-100
0.59 sec * -32%
Lenovo Yoga Book 9 13IMU9
Intel Core Ultra 7 155U
0.508 sec * -14%
HP EliteBook 8 Flip G1i 13
Intel Core Ultra 7 265U
0.492 sec * -10%
MSI Summit E13 AI Evo A1MTG
Intel Core Ultra 7 155H
0.4882 sec * -9%
Lenovo Yoga 9 2-in-1 14IPH11
Intel Core Ultra 7 355
0.4648 sec * -4%
Dell XPS 13 9350
Intel Core Ultra 7 256V
0.4578 sec * -3%
HP OmniBook 7 Aero 13-bg1077nr
AMD Ryzen AI 7 350
0.4555 sec * -2%
Lenovo ThinkPad X13 Detachable Gen 1
Intel Core Ultra 7 365
0.446 sec *
Average Intel Core Ultra 7 365
  (n=1)
0.446 sec * -0%
Dell Pro 13 Premium PA13250
Intel Core Ultra 7 268V
0.4344 sec * +3%
MSI Prestige 13 AI+ A3MG
Intel Core Ultra 9 386H
0.4312 sec * +3%
Dell Pro 7 13 2-in-1
Intel Core Ultra 7 366H
0.4266 sec * +4%
Lenovo ThinkPad X13 Gen 7 AMD
AMD Ryzen AI 7 PRO 450
0.4121 sec * +8%
CPU Performance rating: Percent
Cinebench 2024: CPU Multi Core | CPU Single Core
Cinebench 2026: CPU Multi | CPU Single Thread
Cinebench R23: Multi Core | Single Core
Cinebench R20: CPU (Multi Core) | CPU (Single Core)
Cinebench R15: CPU Multi 64Bit | CPU Single 64Bit
Blender: v2.79 BMW27 CPU
7-Zip 18.03: 7z b 4 | 7z b 4 -mmt1
Geekbench 7: Multi-Core | Single-Core
Geekbench 6.7: Multi-Core | Single-Core
HWBOT x265 Benchmark v2.2: 4k Preset
LibreOffice : 20 Documents To PDF
R Benchmark 2.5: Overall mean

* ... smaller is better

Cinebench R15 CPU Multi 64Bit
1621 Points
Cinebench R15 OpenGL 64Bit
146.8 fps
Cinebench R15 Ref. Match 64Bit
97.8 %
Cinebench R15 CPU Single 64Bit
276 Points
Cinebench R20 CPU (Multi Core)
4082 Points
Cinebench R20 CPU (Single Core)
735 Points
Cinebench R23 Multi Core
10573 Points
Cinebench R23 Single Core
1971 Points
Cinebench 2024 CPU Multi Core
476 Points
Cinebench 2024 CPU Single Core
117 Points
Cinebench 2026 CPU Multi
1978 Points
Cinebench 2026 CPU Single Thread
477 Points
Help
Performance rating
Lenovo ThinkPad X13 Gen 7 AMD -1!
AMD Ryzen AI 7 PRO 450, Radeon 860M
94.6 pt
Dell Pro 7 13 2-in-1 -1!
Intel Core Ultra 7 366H, Intel Graphics 4 Xe3 PTL
78.7 pt
MSI Prestige 13 AI+ A3MG -1!
Intel Core Ultra 9 386H, Intel Graphics 4 Xe3 PTL
57.8 pt
Lenovo ThinkPad X13 Detachable Gen 1 -1!
Intel Core Ultra 7 365, Intel Graphics 4 Xe3 PTL
53.7 pt
Average Intel Core Ultra 7 365 -1!
 
53.7 pt
Dell Pro 13 Premium PA13250
Intel Core Ultra 7 268V, Arc 140V
52.9 pt
AIDA64 / FP32 Ray-Trace
Lenovo ThinkPad X13 Gen 7 AMD
AMD Ryzen AI 7 PRO 450, Radeon 860M (v8.20.8100)
22860 KRay/s +135%
Dell Pro 7 13 2-in-1
Intel Core Ultra 7 366H, Intel Graphics 4 Xe3 PTL (v8.20.8100)
14393 KRay/s +48%
Dell Pro 13 Premium PA13250
Intel Core Ultra 7 268V, Arc 140V (v6.92.6600)
10556 KRay/s +9%
MSI Prestige 13 AI+ A3MG
Intel Core Ultra 9 386H, Intel Graphics 4 Xe3 PTL (v8.20.8100)
10001 KRay/s +3%
Lenovo ThinkPad X13 Detachable Gen 1
Intel Core Ultra 7 365, Intel Graphics 4 Xe3 PTL (v8.20.8100)
9723 KRay/s
Average Intel Core Ultra 7 365
  (n=1)
9723 KRay/s 0%
AIDA64 / FPU Julia
Lenovo ThinkPad X13 Gen 7 AMD
AMD Ryzen AI 7 PRO 450, Radeon 860M (v8.20.8100)
95082 Points +69%
Dell Pro 7 13 2-in-1
Intel Core Ultra 7 366H, Intel Graphics 4 Xe3 PTL (v8.20.8100)
76776 Points +36%
Lenovo ThinkPad X13 Detachable Gen 1
Intel Core Ultra 7 365, Intel Graphics 4 Xe3 PTL (v8.20.8100)
56276 Points
Average Intel Core Ultra 7 365
  (n=1)
56276 Points 0%
MSI Prestige 13 AI+ A3MG
Intel Core Ultra 9 386H, Intel Graphics 4 Xe3 PTL (v8.20.8100)
53370 Points -5%
Dell Pro 13 Premium PA13250
Intel Core Ultra 7 268V, Arc 140V (v6.92.6600)
47659 Points -15%
AIDA64 / CPU SHA3
Dell Pro 7 13 2-in-1
Intel Core Ultra 7 366H, Intel Graphics 4 Xe3 PTL (v8.20.8100)
3890 MB/s +56%
Lenovo ThinkPad X13 Gen 7 AMD
AMD Ryzen AI 7 PRO 450, Radeon 860M (v8.20.8100)
3799 MB/s +53%
MSI Prestige 13 AI+ A3MG
Intel Core Ultra 9 386H, Intel Graphics 4 Xe3 PTL (v8.20.8100)
2776 MB/s +12%
Lenovo ThinkPad X13 Detachable Gen 1
Intel Core Ultra 7 365, Intel Graphics 4 Xe3 PTL (v8.20.8100)
2487 MB/s
Average Intel Core Ultra 7 365
  (n=1)
2487 MB/s 0%
Dell Pro 13 Premium PA13250
Intel Core Ultra 7 268V, Arc 140V (v6.92.6600)
2117 MB/s -15%
AIDA64 / CPU Queen
Dell Pro 13 Premium PA13250
Intel Core Ultra 7 268V, Arc 140V (v6.92.6600)
49759 Points
AIDA64 / FPU SinJulia
Lenovo ThinkPad X13 Gen 7 AMD
AMD Ryzen AI 7 PRO 450, Radeon 860M (v8.20.8100)
13384 Points +199%
Dell Pro 7 13 2-in-1
Intel Core Ultra 7 366H, Intel Graphics 4 Xe3 PTL (v8.20.8100)
6482 Points +45%
MSI Prestige 13 AI+ A3MG
Intel Core Ultra 9 386H, Intel Graphics 4 Xe3 PTL (v8.20.8100)
5314 Points +19%
Lenovo ThinkPad X13 Detachable Gen 1
Intel Core Ultra 7 365, Intel Graphics 4 Xe3 PTL (v8.20.8100)
4480 Points
Average Intel Core Ultra 7 365
  (n=1)
4480 Points 0%
Dell Pro 13 Premium PA13250
Intel Core Ultra 7 268V, Arc 140V (v6.92.6600)
4353 Points -3%
AIDA64 / FPU Mandel
Lenovo ThinkPad X13 Gen 7 AMD
AMD Ryzen AI 7 PRO 450, Radeon 860M (v8.20.8100)
49094 Points +66%
Dell Pro 7 13 2-in-1
Intel Core Ultra 7 366H, Intel Graphics 4 Xe3 PTL (v8.20.8100)
42426 Points +43%
Lenovo ThinkPad X13 Detachable Gen 1
Intel Core Ultra 7 365, Intel Graphics 4 Xe3 PTL (v8.20.8100)
29610 Points
Average Intel Core Ultra 7 365
  (n=1)
29610 Points 0%
MSI Prestige 13 AI+ A3MG
Intel Core Ultra 9 386H, Intel Graphics 4 Xe3 PTL (v8.20.8100)
28414 Points -4%
Dell Pro 13 Premium PA13250
Intel Core Ultra 7 268V, Arc 140V (v6.92.6600)
25929 Points -12%
AIDA64 / CPU AES
Lenovo ThinkPad X13 Gen 7 AMD
AMD Ryzen AI 7 PRO 450, Radeon 860M (v8.20.8100)
79014 MB/s +107%
Dell Pro 7 13 2-in-1
Intel Core Ultra 7 366H, Intel Graphics 4 Xe3 PTL (v8.20.8100)
57542 MB/s +51%
MSI Prestige 13 AI+ A3MG
Intel Core Ultra 9 386H, Intel Graphics 4 Xe3 PTL (v8.20.8100)
46362 MB/s +21%
Lenovo ThinkPad X13 Detachable Gen 1
Intel Core Ultra 7 365, Intel Graphics 4 Xe3 PTL (v8.20.8100)
38183 MB/s
Average Intel Core Ultra 7 365
  (n=1)
38183 MB/s 0%
Dell Pro 13 Premium PA13250
Intel Core Ultra 7 268V, Arc 140V (v6.92.6600)
33196 MB/s -13%
AIDA64 / CPU ZLib
Lenovo ThinkPad X13 Gen 7 AMD
AMD Ryzen AI 7 PRO 450, Radeon 860M (v8.20.8100)
970 MB/s +64%
Dell Pro 7 13 2-in-1
Intel Core Ultra 7 366H, Intel Graphics 4 Xe3 PTL (v8.20.8100)
923 MB/s +56%
MSI Prestige 13 AI+ A3MG
Intel Core Ultra 9 386H, Intel Graphics 4 Xe3 PTL (v8.20.8100)
669 MB/s +13%
Lenovo ThinkPad X13 Detachable Gen 1
Intel Core Ultra 7 365, Intel Graphics 4 Xe3 PTL (v8.20.8100)
591 MB/s
Average Intel Core Ultra 7 365
  (n=1)
591 MB/s 0%
Dell Pro 13 Premium PA13250
Intel Core Ultra 7 268V, Arc 140V (v6.92.6600)
441 MB/s -25%
AIDA64 / FP64 Ray-Trace
Lenovo ThinkPad X13 Gen 7 AMD
AMD Ryzen AI 7 PRO 450, Radeon 860M (v8.20.8100)
12380 KRay/s +148%
Dell Pro 7 13 2-in-1
Intel Core Ultra 7 366H, Intel Graphics 4 Xe3 PTL (v8.20.8100)
7614 KRay/s +52%
Dell Pro 13 Premium PA13250
Intel Core Ultra 7 268V, Arc 140V (v6.92.6600)
5938 KRay/s +19%
MSI Prestige 13 AI+ A3MG
Intel Core Ultra 9 386H, Intel Graphics 4 Xe3 PTL (v8.20.8100)
5138 KRay/s +3%
Lenovo ThinkPad X13 Detachable Gen 1
Intel Core Ultra 7 365, Intel Graphics 4 Xe3 PTL (v8.20.8100)
4998 KRay/s
Average Intel Core Ultra 7 365
  (n=1)
4998 KRay/s 0%
AIDA64 / CPU PhotoWorxx
Dell Pro 7 13 2-in-1
Intel Core Ultra 7 366H, Intel Graphics 4 Xe3 PTL (v8.20.8100)
81156 MPixel/s +35%
MSI Prestige 13 AI+ A3MG
Intel Core Ultra 9 386H, Intel Graphics 4 Xe3 PTL (v8.20.8100)
66781 MPixel/s +11%
Lenovo ThinkPad X13 Detachable Gen 1
Intel Core Ultra 7 365, Intel Graphics 4 Xe3 PTL (v8.20.8100)
60035 MPixel/s
Average Intel Core Ultra 7 365
  (n=1)
60035 MPixel/s 0%
Dell Pro 13 Premium PA13250
Intel Core Ultra 7 268V, Arc 140V (v6.92.6600)
46733 MPixel/s -22%
Lenovo ThinkPad X13 Gen 7 AMD
AMD Ryzen AI 7 PRO 450, Radeon 860M (v8.20.8100)
43303 MPixel/s -28%

System Performance

PCMark 10 Standard
PCMark 10 Standard
Performance rating
Dell Pro 7 13 2-in-1
Intel Graphics 4 Xe3 PTL, Ultra 7 366H, SK hynix PCB01 HFS001TFM9X186N
90.9 pt
Lenovo ThinkPad X13 Gen 7 AMD
Radeon 860M, Ryzen AI 7 PRO 450, Micron 2650 MTFDKBA512TGW
87.5 pt
Lenovo ThinkPad X13 Detachable Gen 1
Intel Graphics 4 Xe3 PTL, Ultra 7 365
83 pt
Average Intel Core Ultra 7 365, Intel Graphics 4 Xe3 Panther Lake iGPU
 
83 pt
MSI Prestige 13 AI+ A3MG -4!
Intel Graphics 4 Xe3 PTL, Ultra 9 386H, Micron 2500 1TB MTFDKBA1T0QGN
79.8 pt
Dell Pro 13 Premium PA13250 -4!
Arc 140V, Core Ultra 7 268V, Micron 2550 1TB
68.2 pt
HP EliteBook 8 Flip G1i 13 -1!
Graphics 4-Core iGPU (Arrow Lake), Ultra 7 265U, Samsung PM9A1 MZVL2512HCJQ
60.8 pt
PCMark 10 / Score
Dell Pro 7 13 2-in-1
Intel Graphics 4 Xe3 PTL, Ultra 7 366H, SK hynix PCB01 HFS001TFM9X186N
9080 Points +15%
Lenovo ThinkPad X13 Gen 7 AMD
Radeon 860M, Ryzen AI 7 PRO 450, Micron 2650 MTFDKBA512TGW
8298 Points +5%
Lenovo ThinkPad X13 Detachable Gen 1
Intel Graphics 4 Xe3 PTL, Ultra 7 365
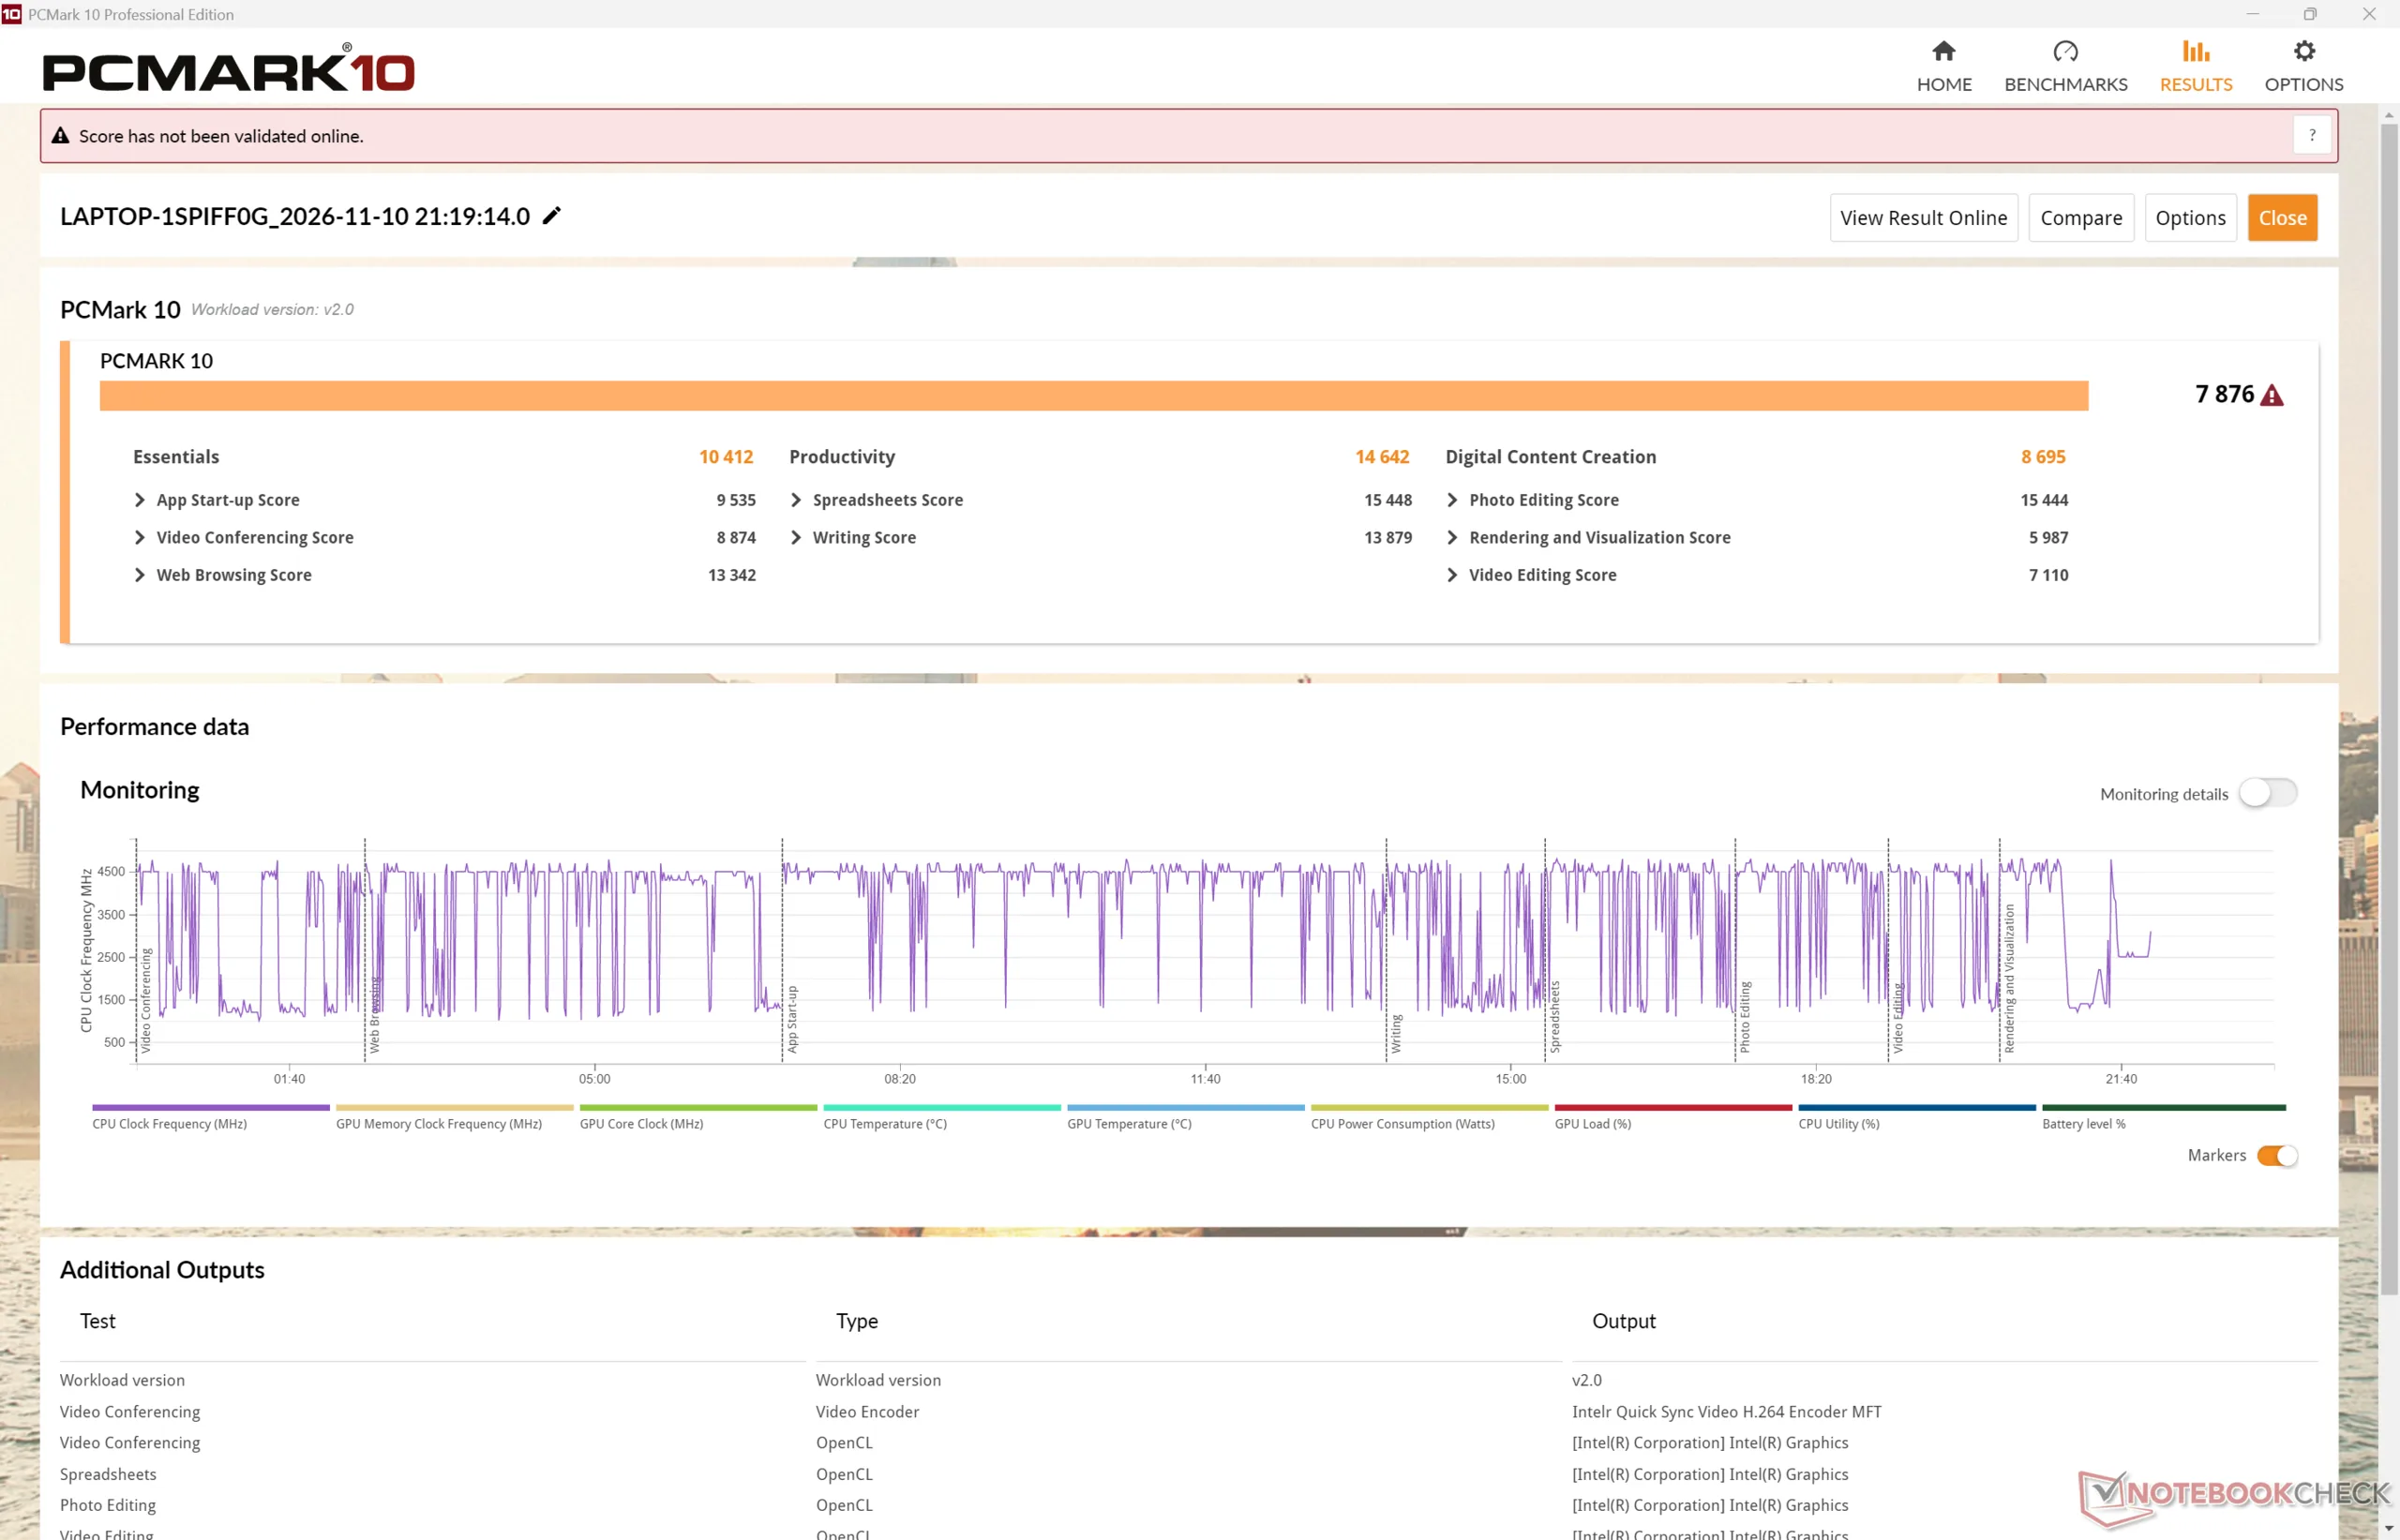
7876 Points
Average Intel Core Ultra 7 365, Intel Graphics 4 Xe3 Panther Lake iGPU
  (n=1)
7876 Points 0%
MSI Prestige 13 AI+ A3MG
Intel Graphics 4 Xe3 PTL, Ultra 9 386H, Micron 2500 1TB MTFDKBA1T0QGN
7679 Points -3%
Dell Pro 13 Premium PA13250
Arc 140V, Core Ultra 7 268V, Micron 2550 1TB
6729 Points -15%
HP EliteBook 8 Flip G1i 13
Graphics 4-Core iGPU (Arrow Lake), Ultra 7 265U, Samsung PM9A1 MZVL2512HCJQ
6237 Points -21%
PCMark 10 / Essentials
Dell Pro 7 13 2-in-1
Intel Graphics 4 Xe3 PTL, Ultra 7 366H, SK hynix PCB01 HFS001TFM9X186N
11657 Points +12%
Lenovo ThinkPad X13 Gen 7 AMD
Radeon 860M, Ryzen AI 7 PRO 450, Micron 2650 MTFDKBA512TGW
11498 Points +10%
MSI Prestige 13 AI+ A3MG
Intel Graphics 4 Xe3 PTL, Ultra 9 386H, Micron 2500 1TB MTFDKBA1T0QGN
10894 Points +5%
HP EliteBook 8 Flip G1i 13
Graphics 4-Core iGPU (Arrow Lake), Ultra 7 265U, Samsung PM9A1 MZVL2512HCJQ
10710 Points +3%
Lenovo ThinkPad X13 Detachable Gen 1
Intel Graphics 4 Xe3 PTL, Ultra 7 365
10412 Points
Average Intel Core Ultra 7 365, Intel Graphics 4 Xe3 Panther Lake iGPU
  (n=1)
10412 Points 0%
Dell Pro 13 Premium PA13250
Arc 140V, Core Ultra 7 268V, Micron 2550 1TB
10007 Points -4%
PCMark 10 / Productivity
Dell Pro 7 13 2-in-1
Intel Graphics 4 Xe3 PTL, Ultra 7 366H, SK hynix PCB01 HFS001TFM9X186N
16597 Points +13%
Lenovo ThinkPad X13 Detachable Gen 1
Intel Graphics 4 Xe3 PTL, Ultra 7 365
14642 Points
Average Intel Core Ultra 7 365, Intel Graphics 4 Xe3 Panther Lake iGPU
  (n=1)
14642 Points 0%
Lenovo ThinkPad X13 Gen 7 AMD
Radeon 860M, Ryzen AI 7 PRO 450, Micron 2650 MTFDKBA512TGW
13954 Points -5%
MSI Prestige 13 AI+ A3MG
Intel Graphics 4 Xe3 PTL, Ultra 9 386H, Micron 2500 1TB MTFDKBA1T0QGN
12295 Points -16%
Dell Pro 13 Premium PA13250
Arc 140V, Core Ultra 7 268V, Micron 2550 1TB
8766 Points -40%
HP EliteBook 8 Flip G1i 13
Graphics 4-Core iGPU (Arrow Lake), Ultra 7 265U, Samsung PM9A1 MZVL2512HCJQ
8288 Points -43%
PCMark 10 / Digital Content Creation
Dell Pro 7 13 2-in-1
Intel Graphics 4 Xe3 PTL, Ultra 7 366H, SK hynix PCB01 HFS001TFM9X186N
10499 Points +21%
Lenovo ThinkPad X13 Gen 7 AMD
Radeon 860M, Ryzen AI 7 PRO 450, Micron 2650 MTFDKBA512TGW
9665 Points +11%
Dell Pro 13 Premium PA13250
Arc 140V, Core Ultra 7 268V, Micron 2550 1TB
9425 Points +8%
MSI Prestige 13 AI+ A3MG
Intel Graphics 4 Xe3 PTL, Ultra 9 386H, Micron 2500 1TB MTFDKBA1T0QGN
9175 Points +6%
Lenovo ThinkPad X13 Detachable Gen 1
Intel Graphics 4 Xe3 PTL, Ultra 7 365
8695 Points
Average Intel Core Ultra 7 365, Intel Graphics 4 Xe3 Panther Lake iGPU
  (n=1)
8695 Points 0%
HP EliteBook 8 Flip G1i 13
Graphics 4-Core iGPU (Arrow Lake), Ultra 7 265U, Samsung PM9A1 MZVL2512HCJQ
7419 Points -15%
CrossMark / Overall
Dell Pro 7 13 2-in-1
Intel Graphics 4 Xe3 PTL, Ultra 7 366H, SK hynix PCB01 HFS001TFM9X186N
2214 Points +16%
Lenovo ThinkPad X13 Gen 7 AMD
Radeon 860M, Ryzen AI 7 PRO 450, Micron 2650 MTFDKBA512TGW
1998 Points +5%
MSI Prestige 13 AI+ A3MG
Intel Graphics 4 Xe3 PTL, Ultra 9 386H, Micron 2500 1TB MTFDKBA1T0QGN
1975 Points +4%
Lenovo ThinkPad X13 Detachable Gen 1
Intel Graphics 4 Xe3 PTL, Ultra 7 365
1907 Points
Average Intel Core Ultra 7 365, Intel Graphics 4 Xe3 Panther Lake iGPU
  (n=1)
1907 Points 0%
Dell Pro 13 Premium PA13250
Arc 140V, Core Ultra 7 268V, Micron 2550 1TB
1643 Points -14%
HP EliteBook 8 Flip G1i 13
Graphics 4-Core iGPU (Arrow Lake), Ultra 7 265U, Samsung PM9A1 MZVL2512HCJQ
1561 Points -18%
CrossMark / Productivity
Dell Pro 7 13 2-in-1
Intel Graphics 4 Xe3 PTL, Ultra 7 366H, SK hynix PCB01 HFS001TFM9X186N
1988 Points +9%
Lenovo ThinkPad X13 Gen 7 AMD
Radeon 860M, Ryzen AI 7 PRO 450, Micron 2650 MTFDKBA512TGW
1888 Points +3%
MSI Prestige 13 AI+ A3MG
Intel Graphics 4 Xe3 PTL, Ultra 9 386H, Micron 2500 1TB MTFDKBA1T0QGN
1842 Points +1%
Lenovo ThinkPad X13 Detachable Gen 1
Intel Graphics 4 Xe3 PTL, Ultra 7 365
1832 Points
Average Intel Core Ultra 7 365, Intel Graphics 4 Xe3 Panther Lake iGPU
  (n=1)
1832 Points 0%
Dell Pro 13 Premium PA13250
Arc 140V, Core Ultra 7 268V, Micron 2550 1TB
1577 Points -14%
HP EliteBook 8 Flip G1i 13
Graphics 4-Core iGPU (Arrow Lake), Ultra 7 265U, Samsung PM9A1 MZVL2512HCJQ
1498 Points -18%
CrossMark / Creativity
Dell Pro 7 13 2-in-1
Intel Graphics 4 Xe3 PTL, Ultra 7 366H, SK hynix PCB01 HFS001TFM9X186N
2556 Points +25%
MSI Prestige 13 AI+ A3MG
Intel Graphics 4 Xe3 PTL, Ultra 9 386H, Micron 2500 1TB MTFDKBA1T0QGN
2240 Points +10%
Lenovo ThinkPad X13 Gen 7 AMD
Radeon 860M, Ryzen AI 7 PRO 450, Micron 2650 MTFDKBA512TGW
2160 Points +6%
Lenovo ThinkPad X13 Detachable Gen 1
Intel Graphics 4 Xe3 PTL, Ultra 7 365
2044 Points
Average Intel Core Ultra 7 365, Intel Graphics 4 Xe3 Panther Lake iGPU
  (n=1)
2044 Points 0%
Dell Pro 13 Premium PA13250
Arc 140V, Core Ultra 7 268V, Micron 2550 1TB
1866 Points -9%
HP EliteBook 8 Flip G1i 13
Graphics 4-Core iGPU (Arrow Lake), Ultra 7 265U, Samsung PM9A1 MZVL2512HCJQ
1721 Points -16%
CrossMark / Responsiveness
Dell Pro 7 13 2-in-1
Intel Graphics 4 Xe3 PTL, Ultra 7 366H, SK hynix PCB01 HFS001TFM9X186N
1985 Points +14%
Lenovo ThinkPad X13 Gen 7 AMD
Radeon 860M, Ryzen AI 7 PRO 450, Micron 2650 MTFDKBA512TGW
1873 Points +7%
Lenovo ThinkPad X13 Detachable Gen 1
Intel Graphics 4 Xe3 PTL, Ultra 7 365
1746 Points
Average Intel Core Ultra 7 365, Intel Graphics 4 Xe3 Panther Lake iGPU
  (n=1)
1746 Points 0%
MSI Prestige 13 AI+ A3MG
Intel Graphics 4 Xe3 PTL, Ultra 9 386H, Micron 2500 1TB MTFDKBA1T0QGN
1667 Points -5%
HP EliteBook 8 Flip G1i 13
Graphics 4-Core iGPU (Arrow Lake), Ultra 7 265U, Samsung PM9A1 MZVL2512HCJQ
1319 Points -24%
Dell Pro 13 Premium PA13250
Arc 140V, Core Ultra 7 268V, Micron 2550 1TB
1267 Points -27%
WebXPRT 5 / Overall
Dell Pro 7 13 2-in-1
Intel Graphics 4 Xe3 PTL, Ultra 7 366H, SK hynix PCB01 HFS001TFM9X186N
122 Points +9%
Lenovo ThinkPad X13 Gen 7 AMD
Radeon 860M, Ryzen AI 7 PRO 450, Micron 2650 MTFDKBA512TGW
118 Points +5%
Lenovo ThinkPad X13 Detachable Gen 1
Intel Graphics 4 Xe3 PTL, Ultra 7 365
112 Points
Average Intel Core Ultra 7 365, Intel Graphics 4 Xe3 Panther Lake iGPU
  (n=1)
112 Points 0%
Mozilla Kraken 1.1 / Total
HP EliteBook 8 Flip G1i 13
Graphics 4-Core iGPU (Arrow Lake), Ultra 7 265U, Samsung PM9A1 MZVL2512HCJQ
599 ms * -28%
Dell Pro 13 Premium PA13250
Arc 140V, Core Ultra 7 268V, Micron 2550 1TB
476 ms * -2%
Lenovo ThinkPad X13 Detachable Gen 1
Intel Graphics 4 Xe3 PTL, Ultra 7 365
467 ms *
Average Intel Core Ultra 7 365, Intel Graphics 4 Xe3 Panther Lake iGPU
  (n=1)
467 ms * -0%
Dell Pro 7 13 2-in-1
Intel Graphics 4 Xe3 PTL, Ultra 7 366H, SK hynix PCB01 HFS001TFM9X186N
450 ms * +4%
MSI Prestige 13 AI+ A3MG
Intel Graphics 4 Xe3 PTL, Ultra 9 386H, Micron 2500 1TB MTFDKBA1T0QGN
447 ms * +4%
Lenovo ThinkPad X13 Gen 7 AMD
Radeon 860M, Ryzen AI 7 PRO 450, Micron 2650 MTFDKBA512TGW
429 ms * +8%
Geekbench AI / Single Precision GPU 1.7
Lenovo ThinkPad X13 Gen 7 AMD
Radeon 860M, Ryzen AI 7 PRO 450, Micron 2650 MTFDKBA512TGW
6983 Points +8%
Lenovo ThinkPad X13 Detachable Gen 1
Intel Graphics 4 Xe3 PTL, Ultra 7 365
6439 Points
Average Intel Core Ultra 7 365, Intel Graphics 4 Xe3 Panther Lake iGPU
  (n=1)
6439 Points 0%
Dell Pro 7 13 2-in-1
Intel Graphics 4 Xe3 PTL, Ultra 7 366H, SK hynix PCB01 HFS001TFM9X186N
6149 Points -5%
HP EliteBook 8 Flip G1i 13
Graphics 4-Core iGPU (Arrow Lake), Ultra 7 265U, Samsung PM9A1 MZVL2512HCJQ
4498 Points -30%
Geekbench AI / Half Precision GPU 1.7
Lenovo ThinkPad X13 Detachable Gen 1
Intel Graphics 4 Xe3 PTL, Ultra 7 365
12865 Points
Average Intel Core Ultra 7 365, Intel Graphics 4 Xe3 Panther Lake iGPU
  (n=1)
12865 Points 0%
Dell Pro 7 13 2-in-1
Intel Graphics 4 Xe3 PTL, Ultra 7 366H, SK hynix PCB01 HFS001TFM9X186N
11904 Points -7%
Lenovo ThinkPad X13 Gen 7 AMD
Radeon 860M, Ryzen AI 7 PRO 450, Micron 2650 MTFDKBA512TGW
10611 Points -18%
HP EliteBook 8 Flip G1i 13
Graphics 4-Core iGPU (Arrow Lake), Ultra 7 265U, Samsung PM9A1 MZVL2512HCJQ
6442 Points -50%
Geekbench AI / Quantized GPU 1.7
Lenovo ThinkPad X13 Gen 7 AMD
Radeon 860M, Ryzen AI 7 PRO 450, Micron 2650 MTFDKBA512TGW
5522 Points +26%
Lenovo ThinkPad X13 Detachable Gen 1
Intel Graphics 4 Xe3 PTL, Ultra 7 365
4390 Points
Average Intel Core Ultra 7 365, Intel Graphics 4 Xe3 Panther Lake iGPU
  (n=1)
4390 Points 0%
Dell Pro 7 13 2-in-1
Intel Graphics 4 Xe3 PTL, Ultra 7 366H, SK hynix PCB01 HFS001TFM9X186N
4230 Points -4%
HP EliteBook 8 Flip G1i 13
Graphics 4-Core iGPU (Arrow Lake), Ultra 7 265U, Samsung PM9A1 MZVL2512HCJQ
3030 Points -31%

* ... smaller is better

PCMark 10 Score
7876 points
Help
AIDA64 / Memory Copy
Dell Pro 7 13 2-in-1
Intel Core Ultra 7 366H, Intel Graphics 4 Xe3 PTL
117220 MB/s +11%
Lenovo ThinkPad X13 Detachable Gen 1
Intel Core Ultra 7 365, Intel Graphics 4 Xe3 PTL
105190 MB/s
Average Intel Core Ultra 7 365
  (n=1)
105190 MB/s 0%
MSI Prestige 13 AI+ A3MG
Intel Core Ultra 9 386H, Intel Graphics 4 Xe3 PTL
104775 MB/s 0%
Dell Pro 13 Premium PA13250
Intel Core Ultra 7 268V, Arc 140V
100445 MB/s -5%
Lenovo ThinkPad X13 Gen 7 AMD
AMD Ryzen AI 7 PRO 450, Radeon 860M
89576 MB/s -15%
AIDA64 / Memory Read
Dell Pro 7 13 2-in-1
Intel Core Ultra 7 366H, Intel Graphics 4 Xe3 PTL
109548 MB/s +29%
MSI Prestige 13 AI+ A3MG
Intel Core Ultra 9 386H, Intel Graphics 4 Xe3 PTL
97068 MB/s +14%
Lenovo ThinkPad X13 Detachable Gen 1
Intel Core Ultra 7 365, Intel Graphics 4 Xe3 PTL
84810 MB/s
Average Intel Core Ultra 7 365
  (n=1)
84810 MB/s 0%
Dell Pro 13 Premium PA13250
Intel Core Ultra 7 268V, Arc 140V
82511 MB/s -3%
Lenovo ThinkPad X13 Gen 7 AMD
AMD Ryzen AI 7 PRO 450, Radeon 860M
66738 MB/s -21%
AIDA64 / Memory Write
Dell Pro 7 13 2-in-1
Intel Core Ultra 7 366H, Intel Graphics 4 Xe3 PTL
120683 MB/s +11%
Lenovo ThinkPad X13 Gen 7 AMD
AMD Ryzen AI 7 PRO 450, Radeon 860M
116102 MB/s +7%
Dell Pro 13 Premium PA13250
Intel Core Ultra 7 268V, Arc 140V
115959 MB/s +7%
Lenovo ThinkPad X13 Detachable Gen 1
Intel Core Ultra 7 365, Intel Graphics 4 Xe3 PTL
108486 MB/s
Average Intel Core Ultra 7 365
  (n=1)
108486 MB/s 0%
MSI Prestige 13 AI+ A3MG
Intel Core Ultra 9 386H, Intel Graphics 4 Xe3 PTL
106460 MB/s -2%
AIDA64 / Memory Latency
Lenovo ThinkPad X13 Gen 7 AMD
AMD Ryzen AI 7 PRO 450, Radeon 860M
116 ns * -17%
MSI Prestige 13 AI+ A3MG
Intel Core Ultra 9 386H, Intel Graphics 4 Xe3 PTL
104.1 ns * -5%
Dell Pro 13 Premium PA13250
Intel Core Ultra 7 268V, Arc 140V
101.2 ns * -2%
Lenovo ThinkPad X13 Detachable Gen 1
Intel Core Ultra 7 365, Intel Graphics 4 Xe3 PTL
99.1 ns *
Average Intel Core Ultra 7 365
  (n=1)
99.1 ns * -0%
Dell Pro 7 13 2-in-1
Intel Core Ultra 7 366H, Intel Graphics 4 Xe3 PTL
90.3 ns * +9%

* ... smaller is better

DPC Latency

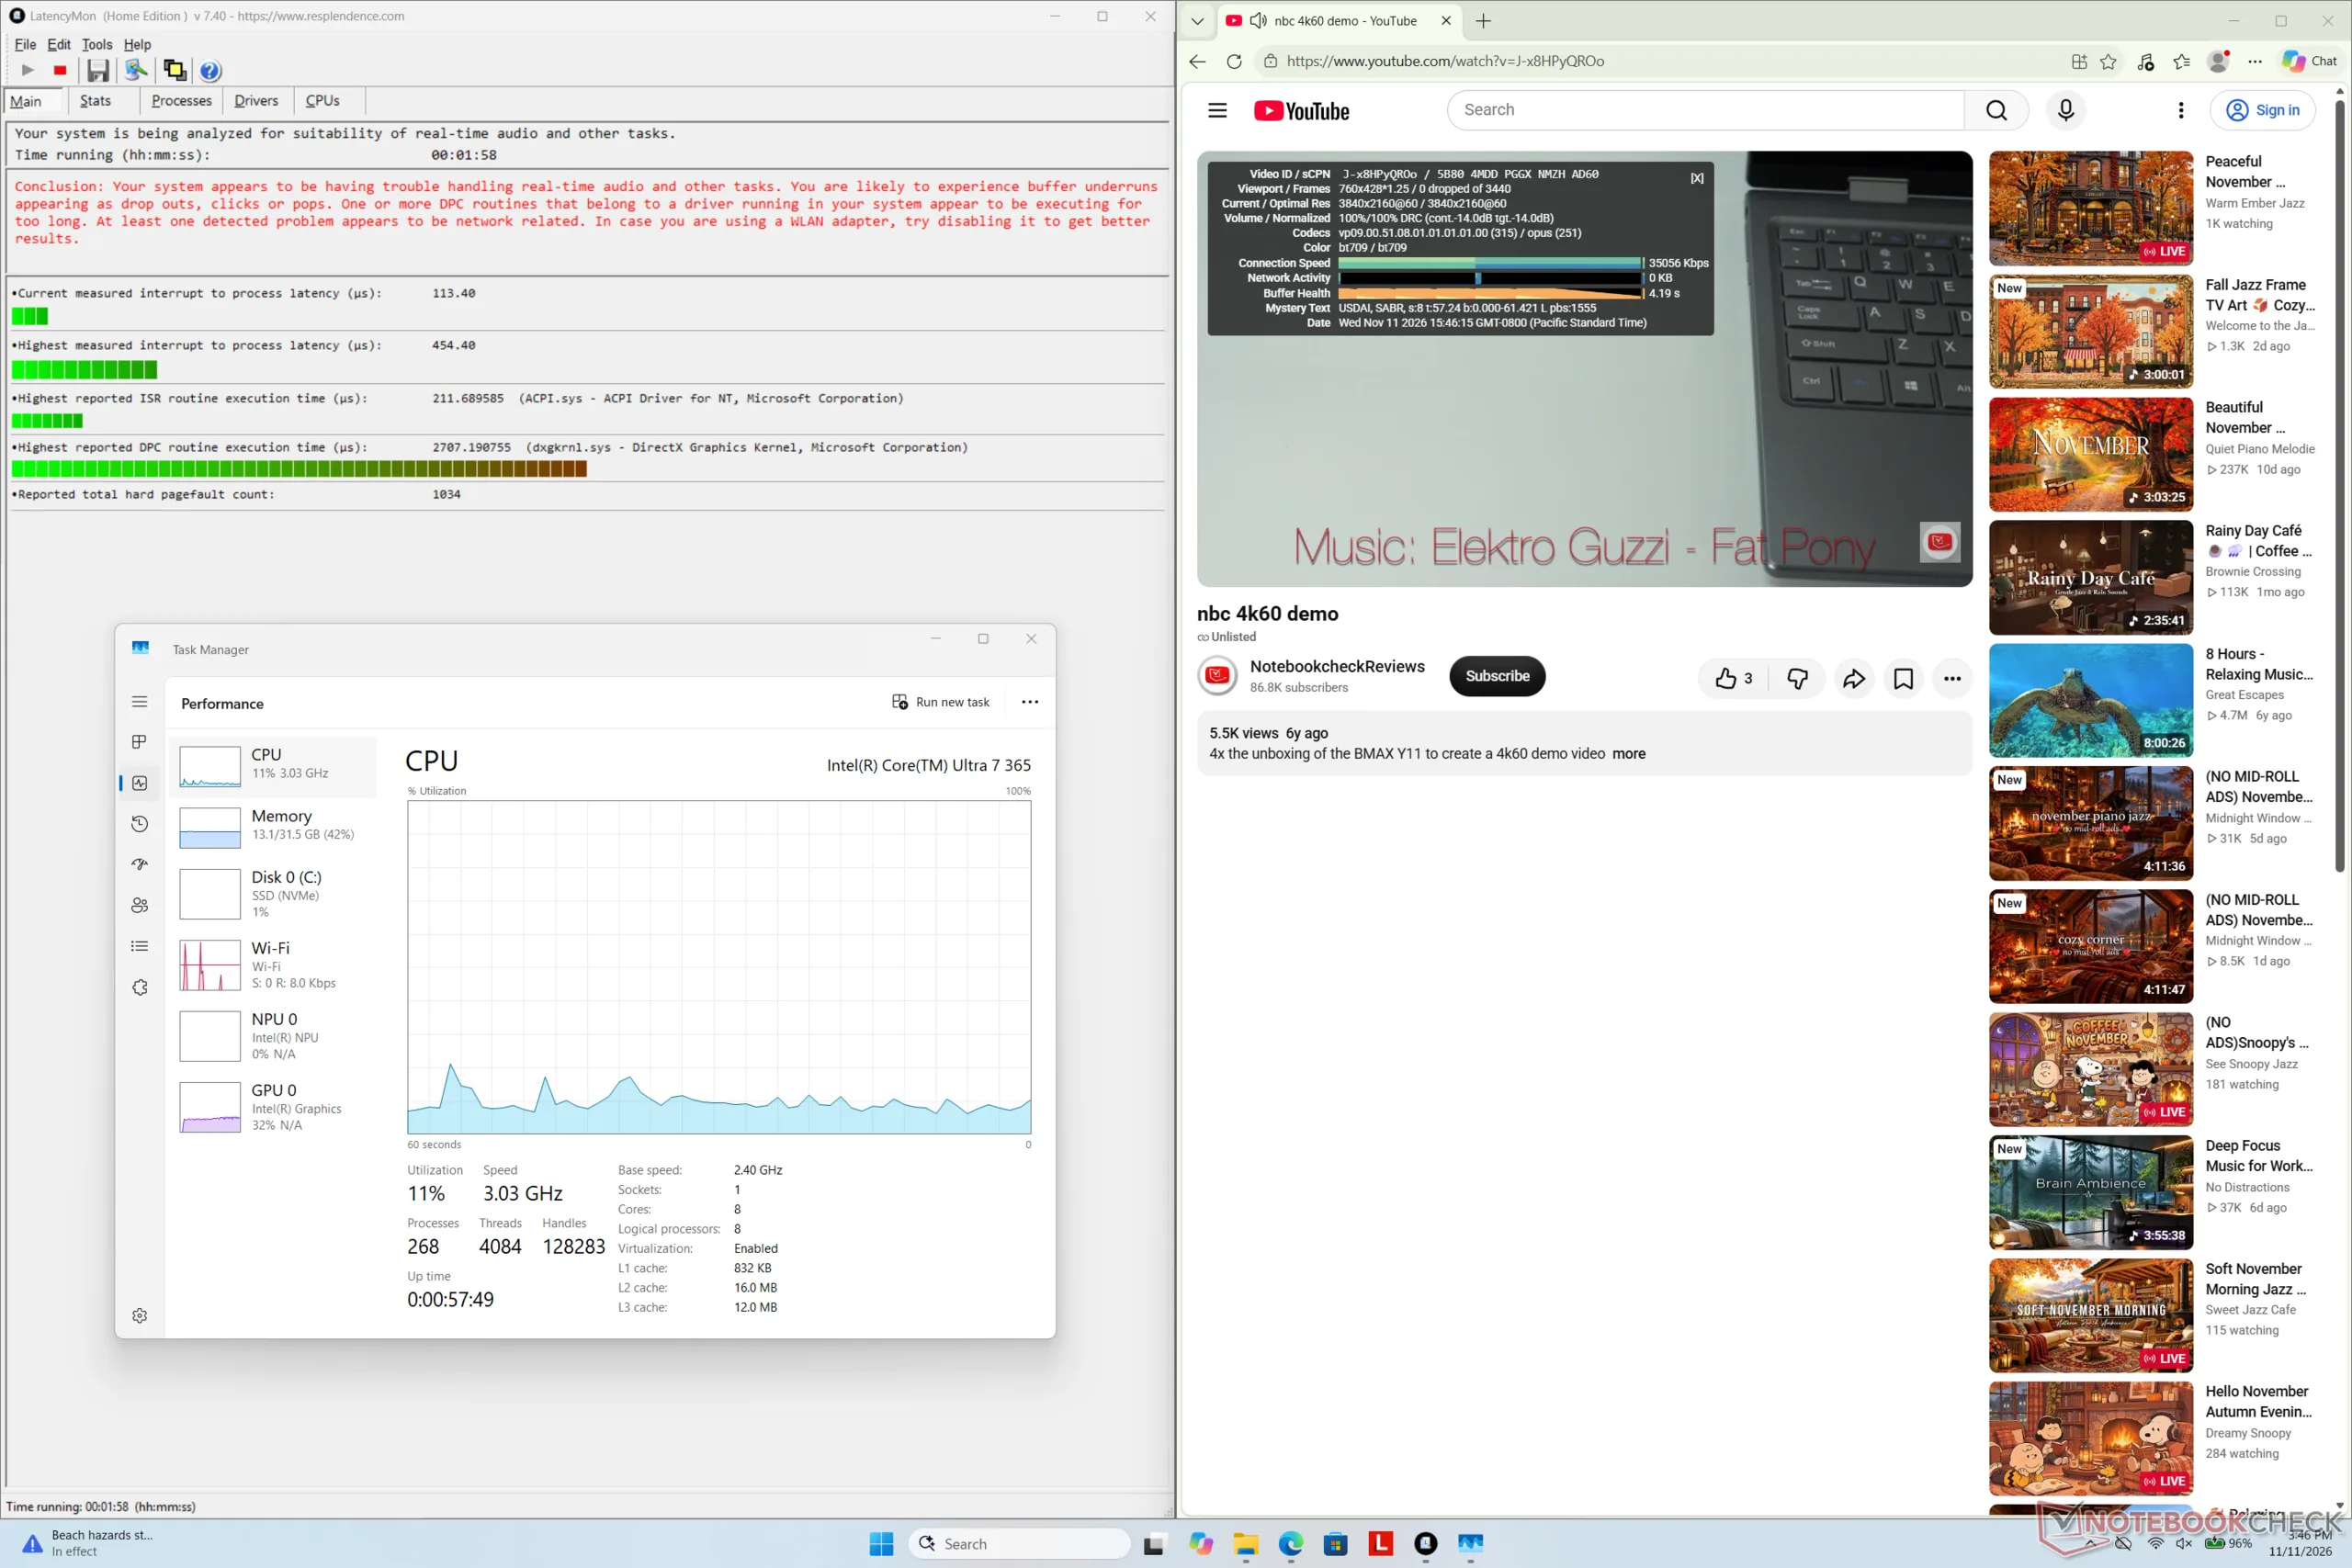
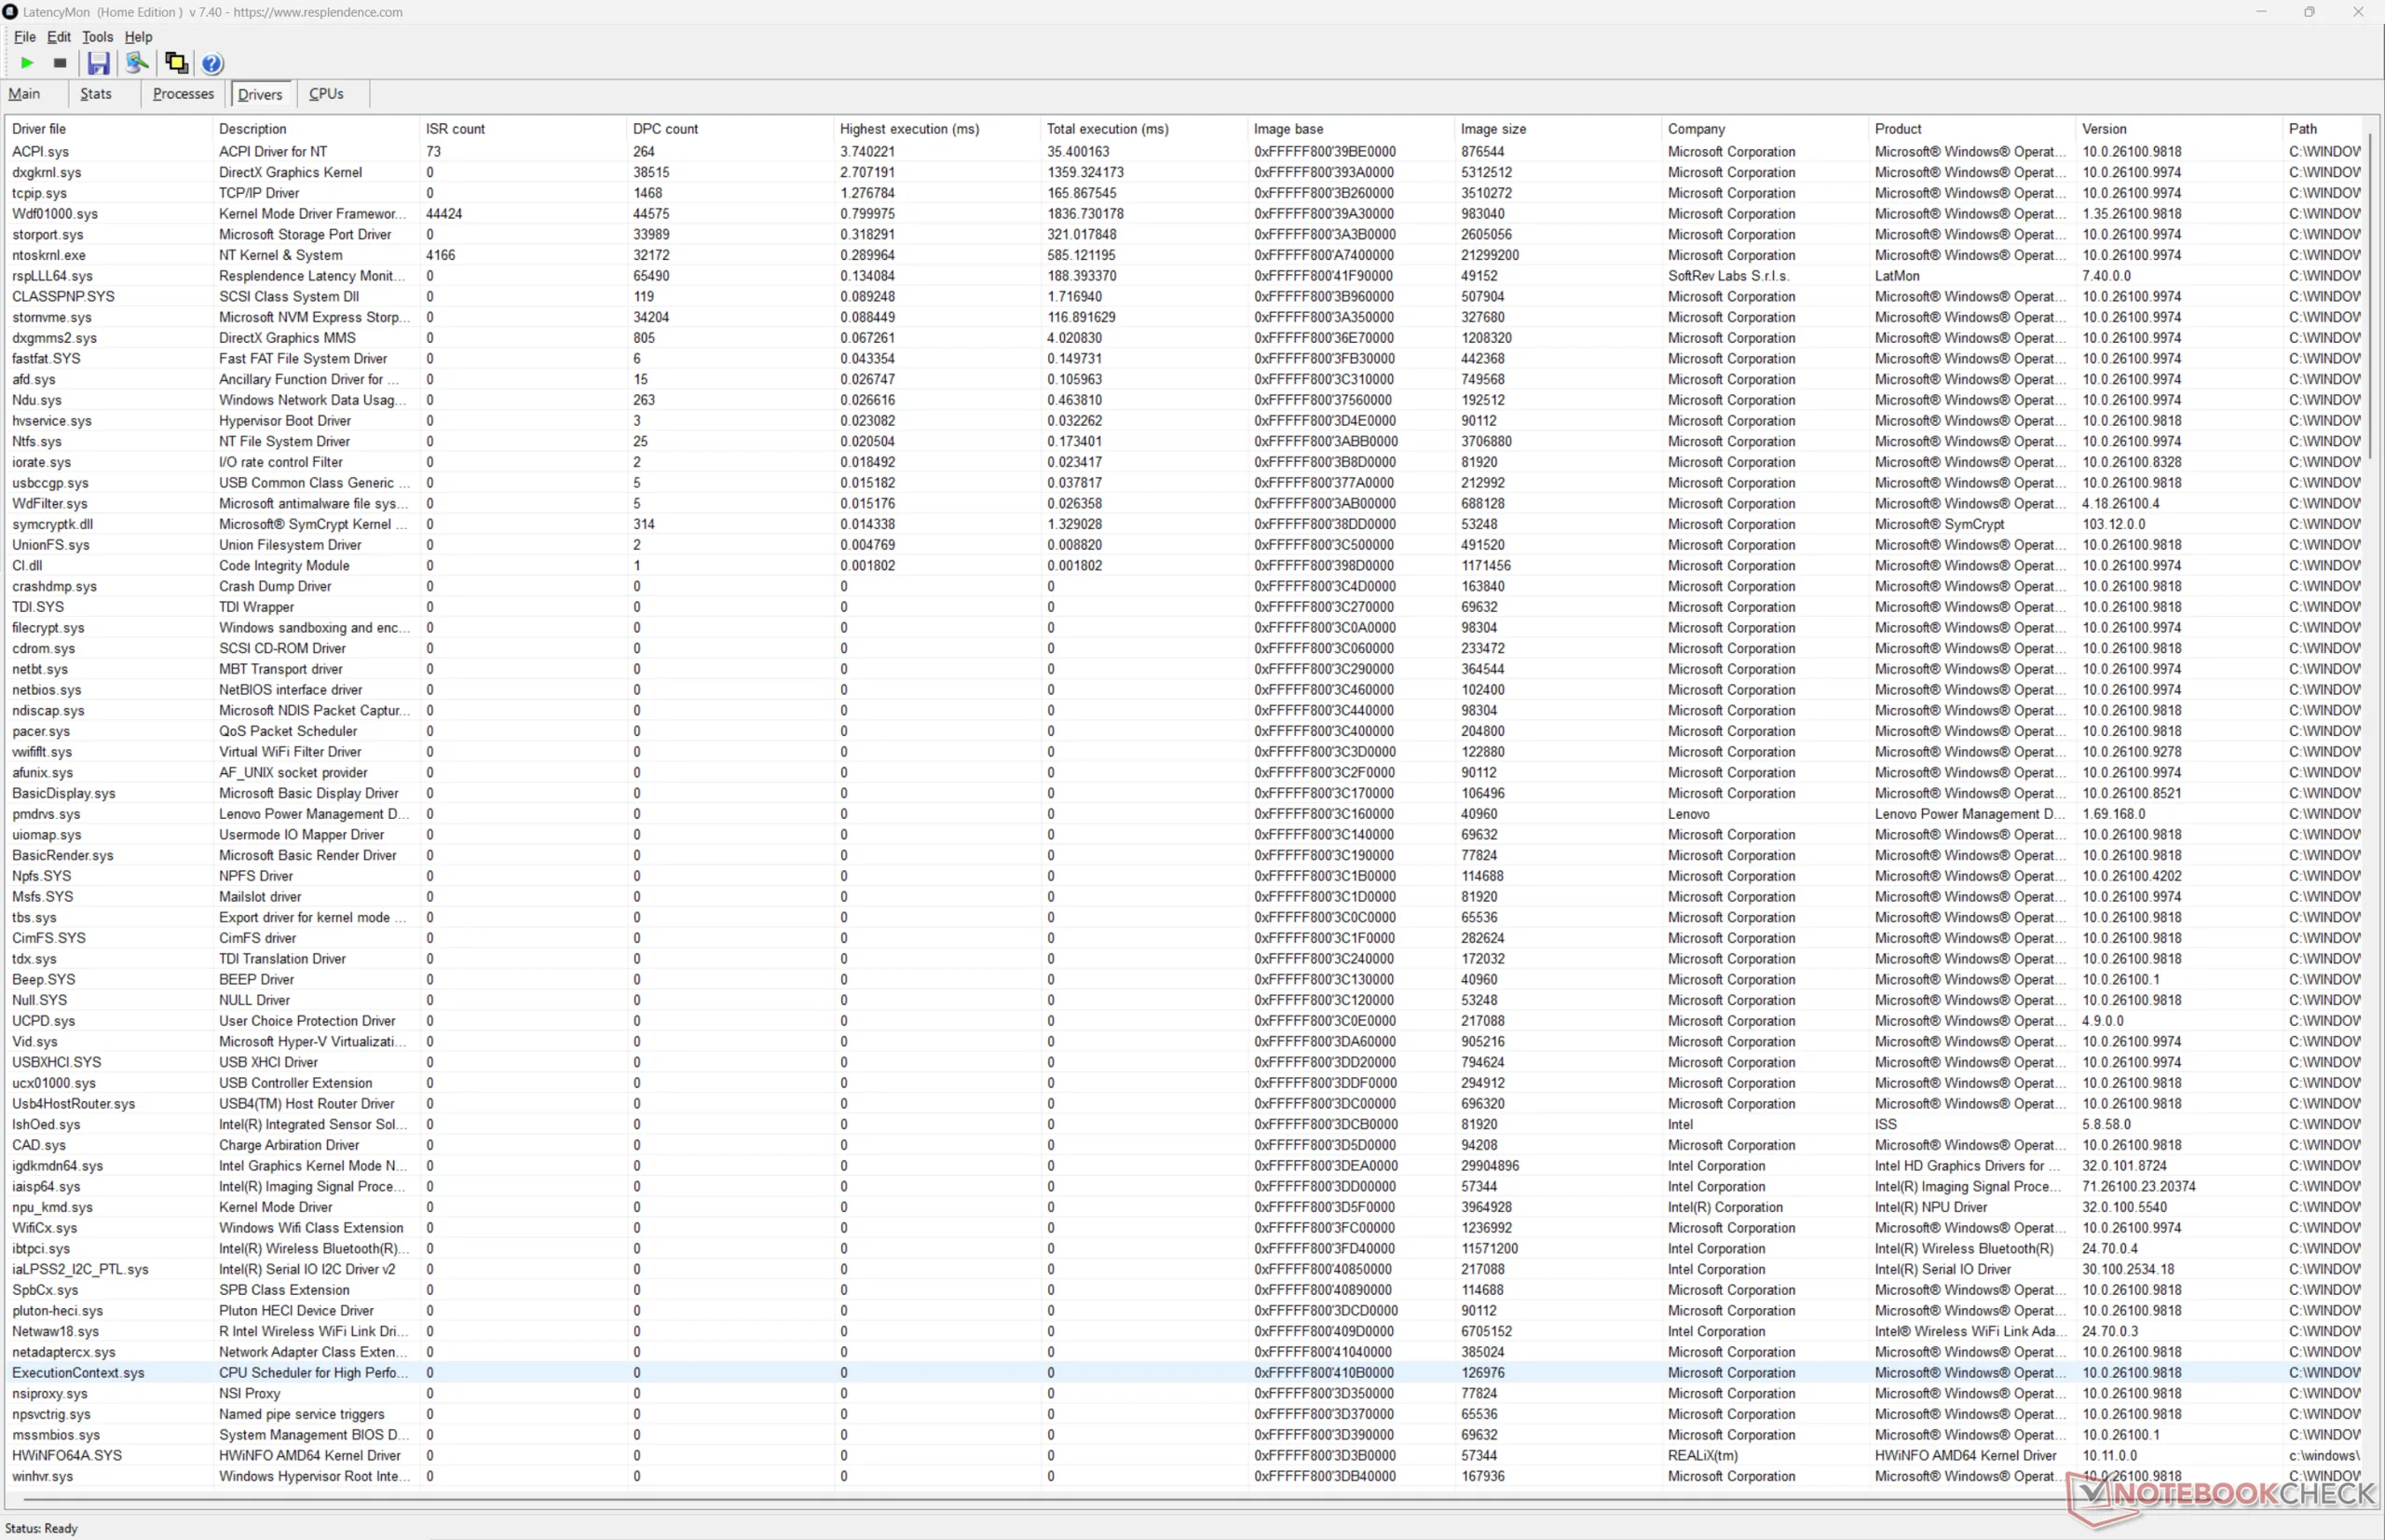
LatencyMon shows minor DPC issues but with otherwise no dropped frames recorded during our 4K60 video test
Drivers list
Drivers list
DPC Latencies / LatencyMon - interrupt to process latency (max), Web, Youtube, Prime95
HP EliteBook 8 Flip G1i 13
Graphics 4-Core iGPU (Arrow Lake), Ultra 7 265U, Samsung PM9A1 MZVL2512HCJQ
1884 μs * -315%
Dell Pro 13 Premium PA13250
Arc 140V, Core Ultra 7 268V, Micron 2550 1TB
1442.4 μs * -217%
Dell Pro 7 13 2-in-1
Intel Graphics 4 Xe3 PTL, Ultra 7 366H, SK hynix PCB01 HFS001TFM9X186N
495.7 μs * -9%
Lenovo ThinkPad X13 Detachable Gen 1
Intel Graphics 4 Xe3 PTL, Ultra 7 365
454.4 μs *
Lenovo ThinkPad X13 Gen 7 AMD
Radeon 860M, Ryzen AI 7 PRO 450, Micron 2650 MTFDKBA512TGW
409.9 μs * +10%

* ... smaller is better

Storage Devices
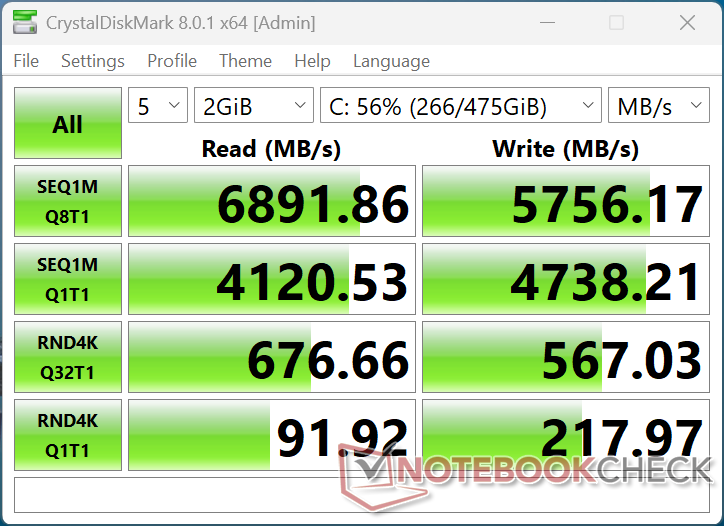
CDM 8
CDM 8

AS SSD runs with errors and so its results are not included below.

CDM 5/6 Read Seq Q32T1: 6795 MB/s
CDM 5/6 Write Seq Q32T1: 5733 MB/s
CDM 5/6 Read 4K Q32T1: 672.6 MB/s
CDM 5/6 Write 4K Q32T1: 565.8 MB/s
CDM 5 Read Seq: 4076 MB/s
CDM 5 Write Seq: 4753 MB/s
CDM 5/6 Read 4K: 91.14 MB/s
CDM 5/6 Write 4K: 214 MB/s
Drive Performance rating - Percent
Dell Pro 7 13 2-in-1
SK hynix PCB01 HFS001TFM9X186N
89.7 pt
Lenovo ThinkPad X13 Gen 7 AMD
Micron 2650 MTFDKBA512TGW
74.8 pt
Lenovo ThinkPad X13 Detachable Gen 1
 
54.7 pt
MSI Prestige 13 AI+ A3MG
Micron 2500 1TB MTFDKBA1T0QGN
42.7 pt
HP EliteBook 8 Flip G1i 13
Samsung PM9A1 MZVL2512HCJQ
35.4 pt
Dell Pro 13 Premium PA13250
Micron 2550 1TB
33 pt
DiskSpd
seq read
Dell Pro 7 13 2-in-1
SK hynix PCB01 HFS001TFM9X186N
9190 (9011.88min - 9189.72max) MB/s +133%
Lenovo ThinkPad X13 Gen 7 AMD
Micron 2650 MTFDKBA512TGW
4740 (4618.97min - 4739.73max) MB/s +20%
Lenovo ThinkPad X13 Detachable Gen 1
 
3942 (3920.42min - 3942.1max) MB/s
HP EliteBook 8 Flip G1i 13
Samsung PM9A1 MZVL2512HCJQ
3773 (3723.81min - 3773.2max) MB/s -4%
MSI Prestige 13 AI+ A3MG
Micron 2500 1TB MTFDKBA1T0QGN
3220 (3165.44min - 3219.55max) MB/s -18%
Dell Pro 13 Premium PA13250
Micron 2550 1TB
2672 (2651.28min - 2672.4max) MB/s -32%
seq write
Dell Pro 7 13 2-in-1
SK hynix PCB01 HFS001TFM9X186N
7949 (7709.02min - 7948.84max) MB/s +72%
Lenovo ThinkPad X13 Gen 7 AMD
Micron 2650 MTFDKBA512TGW
5251 (5202.28min - 5250.64max) MB/s +14%
Lenovo ThinkPad X13 Detachable Gen 1
 
4609 (4540.75min - 4608.91max) MB/s
MSI Prestige 13 AI+ A3MG
Micron 2500 1TB MTFDKBA1T0QGN
3455 (3334.51min - 3454.86max) MB/s -25%
HP EliteBook 8 Flip G1i 13
Samsung PM9A1 MZVL2512HCJQ
2810 (2730.48min - 2809.97max) MB/s -39%
Dell Pro 13 Premium PA13250
Micron 2550 1TB
2658 (2406.9min - 2658.14max) MB/s -42%
seq q8 t1 read
Dell Pro 7 13 2-in-1
SK hynix PCB01 HFS001TFM9X186N
13922 (12905.2min - 13922max) MB/s +103%
Lenovo ThinkPad X13 Gen 7 AMD
Micron 2650 MTFDKBA512TGW
6991 (6185.97min - 6991.07max) MB/s +2%
MSI Prestige 13 AI+ A3MG
Micron 2500 1TB MTFDKBA1T0QGN
6982 (5981.29min - 6982.05max) MB/s +2%
Lenovo ThinkPad X13 Detachable Gen 1
 
6861 (6259.43min - 6861.04max) MB/s
HP EliteBook 8 Flip G1i 13
Samsung PM9A1 MZVL2512HCJQ
6748 (5594.71min - 6748.22max) MB/s -2%
Dell Pro 13 Premium PA13250
Micron 2550 1TB
5167 (4591.13min - 5167.38max) MB/s -25%
seq q8 t1 write
Dell Pro 7 13 2-in-1
SK hynix PCB01 HFS001TFM9X186N
12332 (12280.1min - 12331.7max) MB/s +114%
MSI Prestige 13 AI+ A3MG
Micron 2500 1TB MTFDKBA1T0QGN
5775 (5721.12min - 5775.12max) MB/s 0%
Lenovo ThinkPad X13 Detachable Gen 1
 
5750 (5655.19min - 5750.01max) MB/s
Lenovo ThinkPad X13 Gen 7 AMD
Micron 2650 MTFDKBA512TGW
5258 (5075.65min - 5257.77max) MB/s -9%
HP EliteBook 8 Flip G1i 13
Samsung PM9A1 MZVL2512HCJQ
4836 (4793.52min - 4836.01max) MB/s -16%
Dell Pro 13 Premium PA13250
Micron 2550 1TB
4213 (4176.44min - 4213.22max) MB/s -27%
4k q1 t1 read
Dell Pro 7 13 2-in-1
SK hynix PCB01 HFS001TFM9X186N
100 (99min - 100.03max) MB/s +55%
Lenovo ThinkPad X13 Gen 7 AMD
Micron 2650 MTFDKBA512TGW
88.2 (85.62min - 88.2max) MB/s +36%
MSI Prestige 13 AI+ A3MG
Micron 2500 1TB MTFDKBA1T0QGN
67.3 (66.31min - 67.31max) MB/s +4%
Lenovo ThinkPad X13 Detachable Gen 1
 
64.7 (64.55min - 64.73max) MB/s
Dell Pro 13 Premium PA13250
Micron 2550 1TB
55.1 (51.41min - 55.07max) MB/s -15%
HP EliteBook 8 Flip G1i 13
Samsung PM9A1 MZVL2512HCJQ
47.5 (47.09min - 47.46max) MB/s -27%
4k q1 t1 write
Lenovo ThinkPad X13 Gen 7 AMD
Micron 2650 MTFDKBA512TGW
282 (276.61min - 281.82max) MB/s +35%
Lenovo ThinkPad X13 Detachable Gen 1
 
209 (165.55min - 208.6max) MB/s
MSI Prestige 13 AI+ A3MG
Micron 2500 1TB MTFDKBA1T0QGN
183.2 (143.32min - 183.17max) MB/s -12%
Dell Pro 7 13 2-in-1
SK hynix PCB01 HFS001TFM9X186N
166.5 (164.77min - 166.53max) MB/s -20%
Dell Pro 13 Premium PA13250
Micron 2550 1TB
128.5 (122.19min - 128.53max) MB/s -39%
HP EliteBook 8 Flip G1i 13
Samsung PM9A1 MZVL2512HCJQ
116.7 (113.61min - 116.67max) MB/s -44%
4k q32 t16 read
Lenovo ThinkPad X13 Gen 7 AMD
Micron 2650 MTFDKBA512TGW
3772 (3762.62min - 3772.27max) MB/s +71%
Dell Pro 7 13 2-in-1
SK hynix PCB01 HFS001TFM9X186N
3109 (2906.66min - 3108.59max) MB/s +41%
Lenovo ThinkPad X13 Detachable Gen 1
 
2212 (2173.36min - 2212.09max) MB/s
HP EliteBook 8 Flip G1i 13
Samsung PM9A1 MZVL2512HCJQ
790 (658.26min - 789.98max) MB/s -64%
MSI Prestige 13 AI+ A3MG
Micron 2500 1TB MTFDKBA1T0QGN
790 (622.32min - 789.52max) MB/s -64%
Dell Pro 13 Premium PA13250
Micron 2550 1TB
631 (625.03min - 631.32max) MB/s -71%
4k q32 t16 write
Lenovo ThinkPad X13 Gen 7 AMD
Micron 2650 MTFDKBA512TGW
3642 (3565.73min - 3642.11max) MB/s +133%
Dell Pro 7 13 2-in-1
SK hynix PCB01 HFS001TFM9X186N
2784 (2402.5min - 2783.73max) MB/s +78%
Lenovo ThinkPad X13 Detachable Gen 1
 
1566 (1538.05min - 1565.68max) MB/s
MSI Prestige 13 AI+ A3MG
Micron 2500 1TB MTFDKBA1T0QGN
470 (362.61min - 470.31max) MB/s -70%
Dell Pro 13 Premium PA13250
Micron 2550 1TB
456 (400.41min - 455.9max) MB/s -71%
HP EliteBook 8 Flip G1i 13
Samsung PM9A1 MZVL2512HCJQ
330 (310.62min - 329.88max) MB/s -79%

Disk Throttling: DiskSpd Read Loop, Queue Depth 8

0145290435580725870101511601305145015951740188520302175232024652610275529003045319033353480362537703915406042054350449546404785493050755220536555105655580059456090623563806525667068156960Tooltip
Lenovo ThinkPad X13 Detachable Gen 1  ; diskspd 2.0.17 f: Ø6080 (3342.23-6939.44) MB/s
Lenovo ThinkPad X13 Gen 7 AMD Micron 2650 MTFDKBA512TGW; diskspd 2.0.17 f: Ø6980 (6131.02-7004.32) MB/s

GPU Performance

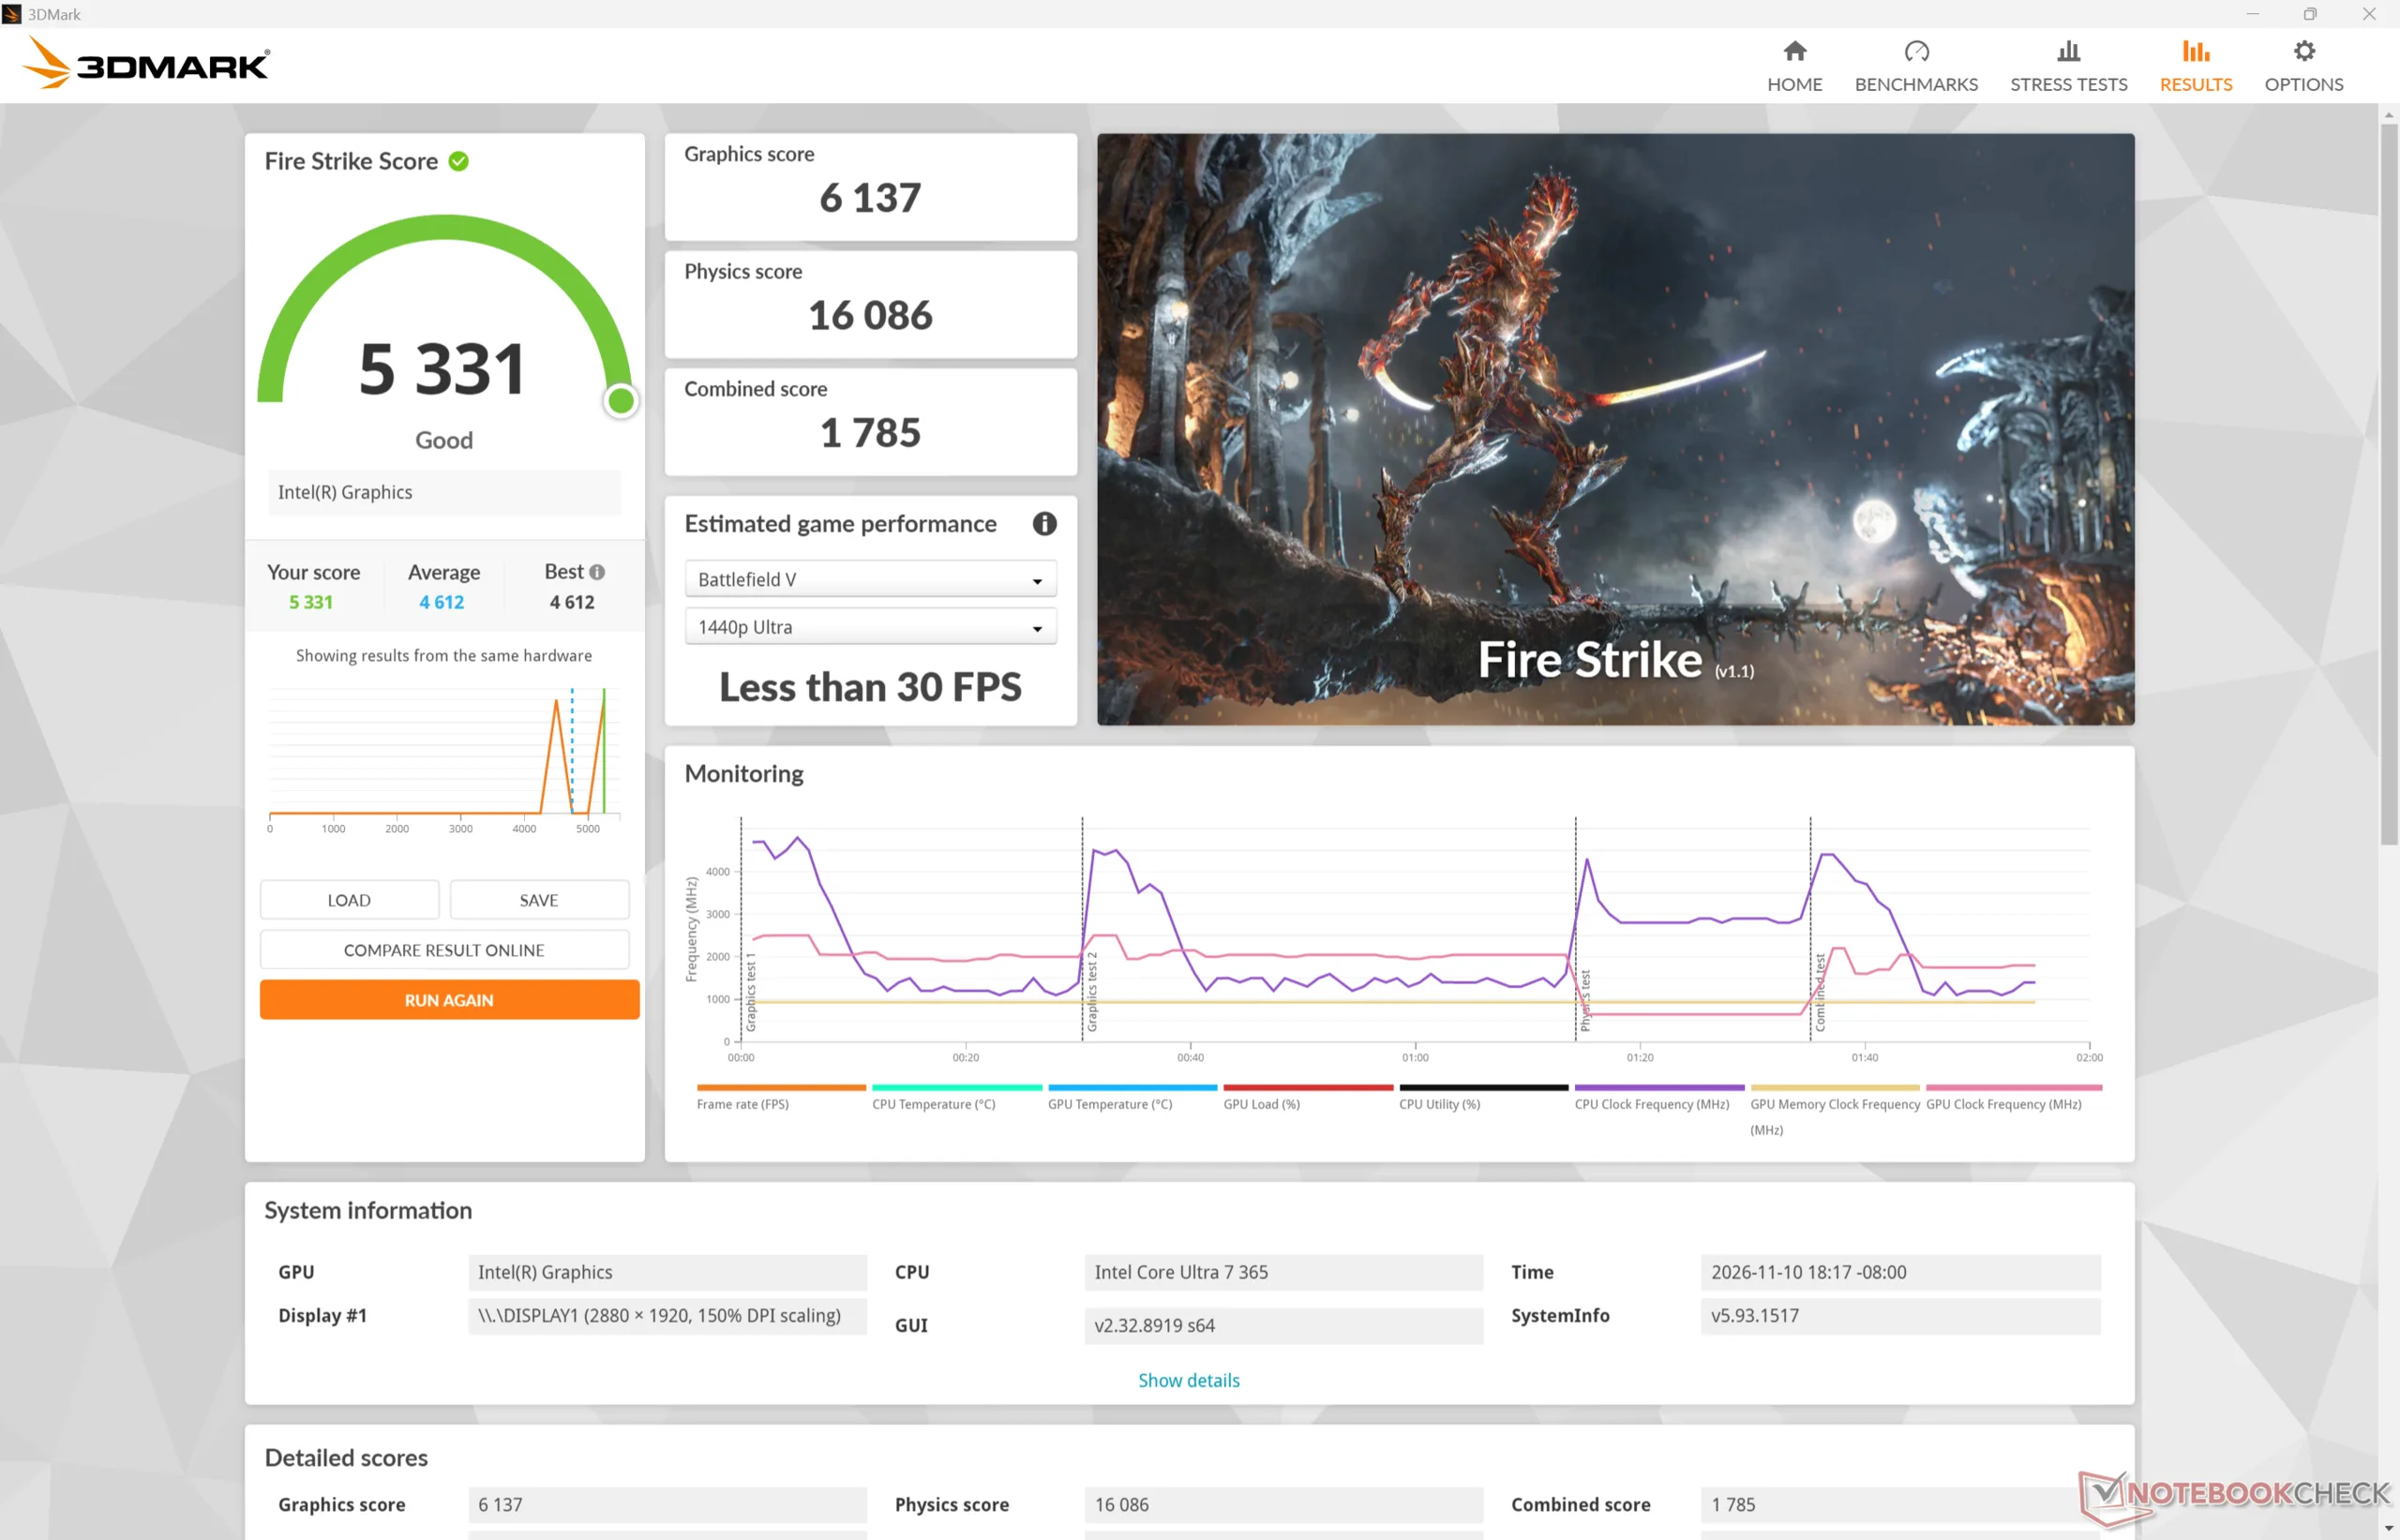
Fire Strike scores can be higher on battery power than on AC power which typically means that the model is more sensitive to throttling than most other devices.

Power ProfileGraphics ScorePhysics ScoreCombined Score
Performance Mode6137160861785
Balanced Mode5614 (-9%)14406 (-10%)1564 (-12%)
Battery Power6562 (+7%)16612 (+3%)1979 (+11%)
3DMark 11
3DMark 11
Fire Strike
Fire Strike
Steel Nomad
Steel Nomad
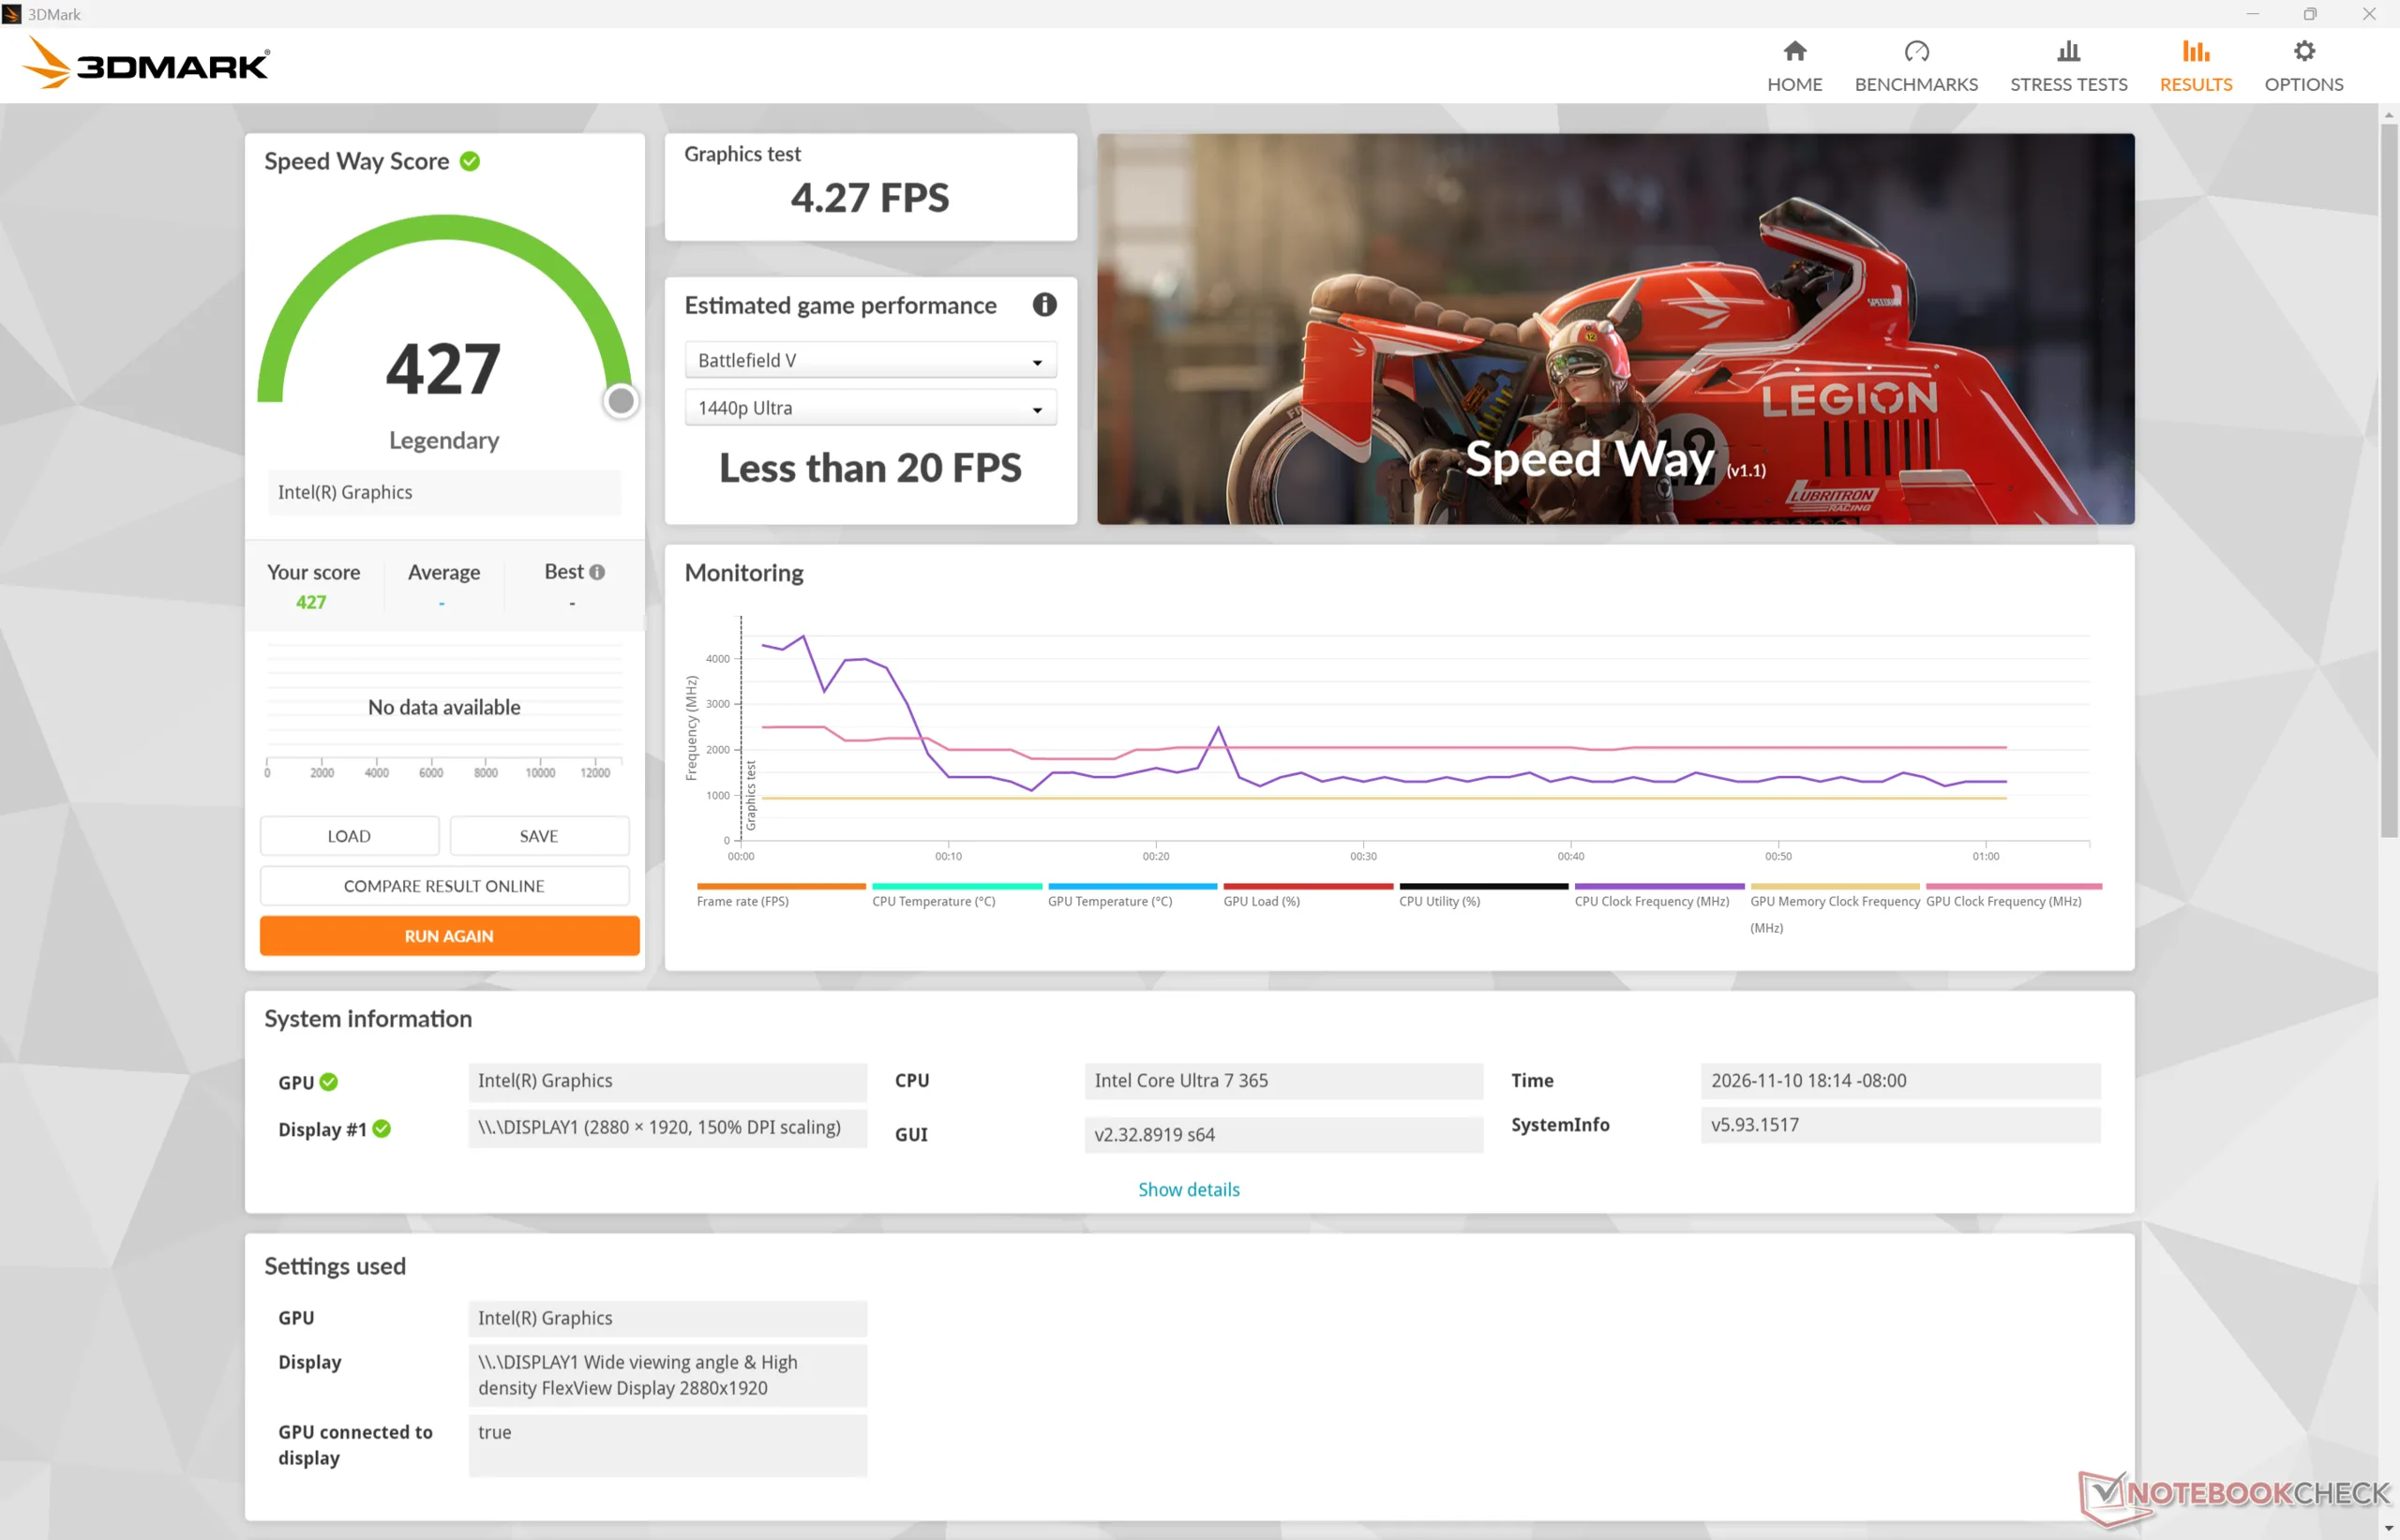
Speed Way
Speed Way
3DMark Performance rating - Percent
Dell XPS 13 9350
Intel Arc Graphics 140V, Intel Core Ultra 7 256V
98.1 pt
Dell Pro 13 Premium PA13250
Intel Arc Graphics 140V, Intel Core Ultra 7 268V
95 pt
Lenovo ThinkPad X13 Gen 7 AMD
AMD Radeon 860M, AMD Ryzen AI 7 PRO 450
78.1 pt
Dell Pro 7 13 2-in-1
Intel Graphics 4 Xe3 Panther Lake iGPU, Intel Core Ultra 7 366H
75.2 pt
HP OmniBook 7 Aero 13-bg1077nr
AMD Radeon 860M, AMD Ryzen AI 7 350
69.4 pt
MSI Summit E13 AI Evo A1MTG
Intel Arc 8-Core iGPU, Intel Core Ultra 7 155H
69 pt
Average Intel Graphics 4 Xe3 Panther Lake iGPU
 
68.2 pt
Lenovo ThinkPad X13 Detachable Gen 1
Intel Graphics 4 Xe3 Panther Lake iGPU, Intel Core Ultra 7 365
62 pt
MSI Prestige 13 AI+ A3MG
Intel Graphics 4 Xe3 Panther Lake iGPU, Intel Core Ultra 9 386H
59 pt
Lenovo Yoga Book 9 13IMU9
Intel Graphics 4-Core iGPU (Meteor / Arrow Lake), Intel Core Ultra 7 155U
50.3 pt
HP EliteBook 8 Flip G1i 13
Intel Graphics 4-Core iGPU (Meteor / Arrow Lake), Intel Core Ultra 7 265U
49.3 pt
Microsoft Surface Laptop 13 2026
Qualcomm SD X2 Adreno X2-45, Qualcomm Snapdragon X2 Plus X2P-42-100
40 pt
3DMark 11 - 1280x720 Performance GPU
Lenovo ThinkPad X13 Gen 7 AMD
AMD Radeon 860M, AMD Ryzen AI 7 PRO 450
11442 Points +62%
Dell Pro 13 Premium PA13250
Intel Arc Graphics 140V, Intel Core Ultra 7 268V
11147 Points +58%
HP OmniBook 7 Aero 13-bg1077nr
AMD Radeon 860M, AMD Ryzen AI 7 350
11064 Points +57%
Dell XPS 13 9350
Intel Arc Graphics 140V, Intel Core Ultra 7 256V
10651 Points +51%
MSI Summit E13 AI Evo A1MTG
Intel Arc 8-Core iGPU, Intel Core Ultra 7 155H
8634 Points +23%
Dell Pro 7 13 2-in-1
Intel Graphics 4 Xe3 Panther Lake iGPU, Intel Core Ultra 7 366H
7560 Points +7%
Average Intel Graphics 4 Xe3 Panther Lake iGPU
  (5433 - 7678, n=24)
7109 Points +1%
Lenovo ThinkPad X13 Detachable Gen 1
Intel Graphics 4 Xe3 Panther Lake iGPU, Intel Core Ultra 7 365
7046 Points
Lenovo Yoga Book 9 13IMU9
Intel Graphics 4-Core iGPU (Meteor / Arrow Lake), Intel Core Ultra 7 155U
6741 Points -4%
MSI Prestige 13 AI+ A3MG
Intel Graphics 4 Xe3 Panther Lake iGPU, Intel Core Ultra 9 386H
6500 Points -8%
HP EliteBook 8 Flip G1i 13
Intel Graphics 4-Core iGPU (Meteor / Arrow Lake), Intel Core Ultra 7 265U
6090 Points -14%
Microsoft Surface Laptop 13 2026
Qualcomm SD X2 Adreno X2-45, Qualcomm Snapdragon X2 Plus X2P-42-100
5097 Points -28%
3DMark
1920x1080 Fire Strike Graphics
Dell Pro 13 Premium PA13250
Intel Arc Graphics 140V, Intel Core Ultra 7 268V
9554 Points +56%
Dell XPS 13 9350
Intel Arc Graphics 140V, Intel Core Ultra 7 256V
9492 Points +55%
Lenovo ThinkPad X13 Gen 7 AMD
AMD Radeon 860M, AMD Ryzen AI 7 PRO 450
7476 Points +22%
Dell Pro 7 13 2-in-1
Intel Graphics 4 Xe3 Panther Lake iGPU, Intel Core Ultra 7 366H
7412 Points +21%
Average Intel Graphics 4 Xe3 Panther Lake iGPU
  (4835 - 7415, n=24)
6734 Points +10%
HP OmniBook 7 Aero 13-bg1077nr
AMD Radeon 860M, AMD Ryzen AI 7 350
6462 Points +5%
MSI Summit E13 AI Evo A1MTG
Intel Arc 8-Core iGPU, Intel Core Ultra 7 155H
6280 Points +2%
Lenovo ThinkPad X13 Detachable Gen 1
Intel Graphics 4 Xe3 Panther Lake iGPU, Intel Core Ultra 7 365
6137 Points
MSI Prestige 13 AI+ A3MG
Intel Graphics 4 Xe3 Panther Lake iGPU, Intel Core Ultra 9 386H
5688 Points -7%
Lenovo Yoga Book 9 13IMU9
Intel Graphics 4-Core iGPU (Meteor / Arrow Lake), Intel Core Ultra 7 155U
5390 Points -12%
HP EliteBook 8 Flip G1i 13
Intel Graphics 4-Core iGPU (Meteor / Arrow Lake), Intel Core Ultra 7 265U
5143 Points -16%
Microsoft Surface Laptop 13 2026
Qualcomm SD X2 Adreno X2-45, Qualcomm Snapdragon X2 Plus X2P-42-100
4430 Points -28%
2560x1440 Time Spy Graphics
Dell XPS 13 9350
Intel Arc Graphics 140V, Intel Core Ultra 7 256V
4115 Points +67%
Dell Pro 13 Premium PA13250
Intel Arc Graphics 140V, Intel Core Ultra 7 268V
3755 Points +52%
Dell Pro 7 13 2-in-1
Intel Graphics 4 Xe3 Panther Lake iGPU, Intel Core Ultra 7 366H
3136 Points +27%
Average Intel Graphics 4 Xe3 Panther Lake iGPU
  (2059 - 3136, n=24)
2808 Points +14%
MSI Summit E13 AI Evo A1MTG
Intel Arc 8-Core iGPU, Intel Core Ultra 7 155H
2726 Points +10%
Lenovo ThinkPad X13 Gen 7 AMD
AMD Radeon 860M, AMD Ryzen AI 7 PRO 450
2682 Points +9%
Lenovo ThinkPad X13 Detachable Gen 1
Intel Graphics 4 Xe3 Panther Lake iGPU, Intel Core Ultra 7 365
2467 Points
MSI Prestige 13 AI+ A3MG
Intel Graphics 4 Xe3 Panther Lake iGPU, Intel Core Ultra 9 386H
2391 Points -3%
HP OmniBook 7 Aero 13-bg1077nr
AMD Radeon 860M, AMD Ryzen AI 7 350
2271 Points -8%
HP EliteBook 8 Flip G1i 13
Intel Graphics 4-Core iGPU (Meteor / Arrow Lake), Intel Core Ultra 7 265U
1808 Points -27%
Lenovo Yoga Book 9 13IMU9
Intel Graphics 4-Core iGPU (Meteor / Arrow Lake), Intel Core Ultra 7 155U
1712 Points -31%
Microsoft Surface Laptop 13 2026
Qualcomm SD X2 Adreno X2-45, Qualcomm Snapdragon X2 Plus X2P-42-100
1374 Points -44%
2560x1440 Time Spy Score
Dell XPS 13 9350
Intel Arc Graphics 140V, Intel Core Ultra 7 256V
4354 Points +61%
Dell Pro 13 Premium PA13250
Intel Arc Graphics 140V, Intel Core Ultra 7 268V
3969 Points +47%
Dell Pro 7 13 2-in-1
Intel Graphics 4 Xe3 Panther Lake iGPU, Intel Core Ultra 7 366H
3518 Points +30%
Average Intel Graphics 4 Xe3 Panther Lake iGPU
  (2285 - 3518, n=24)
3136 Points +16%
Lenovo ThinkPad X13 Gen 7 AMD
AMD Radeon 860M, AMD Ryzen AI 7 PRO 450
2999 Points +11%
MSI Summit E13 AI Evo A1MTG
Intel Arc 8-Core iGPU, Intel Core Ultra 7 155H
2989 Points +11%
Lenovo ThinkPad X13 Detachable Gen 1
Intel Graphics 4 Xe3 Panther Lake iGPU, Intel Core Ultra 7 365
2702 Points
MSI Prestige 13 AI+ A3MG
Intel Graphics 4 Xe3 Panther Lake iGPU, Intel Core Ultra 9 386H
2672 Points -1%
HP OmniBook 7 Aero 13-bg1077nr
AMD Radeon 860M, AMD Ryzen AI 7 350
2533 Points -6%
HP EliteBook 8 Flip G1i 13
Intel Graphics 4-Core iGPU (Meteor / Arrow Lake), Intel Core Ultra 7 265U
2010 Points -26%
Lenovo Yoga Book 9 13IMU9
Intel Graphics 4-Core iGPU (Meteor / Arrow Lake), Intel Core Ultra 7 155U
1922 Points -29%
Microsoft Surface Laptop 13 2026
Qualcomm SD X2 Adreno X2-45, Qualcomm Snapdragon X2 Plus X2P-42-100
1557 Points -42%
3DMark 11 Performance
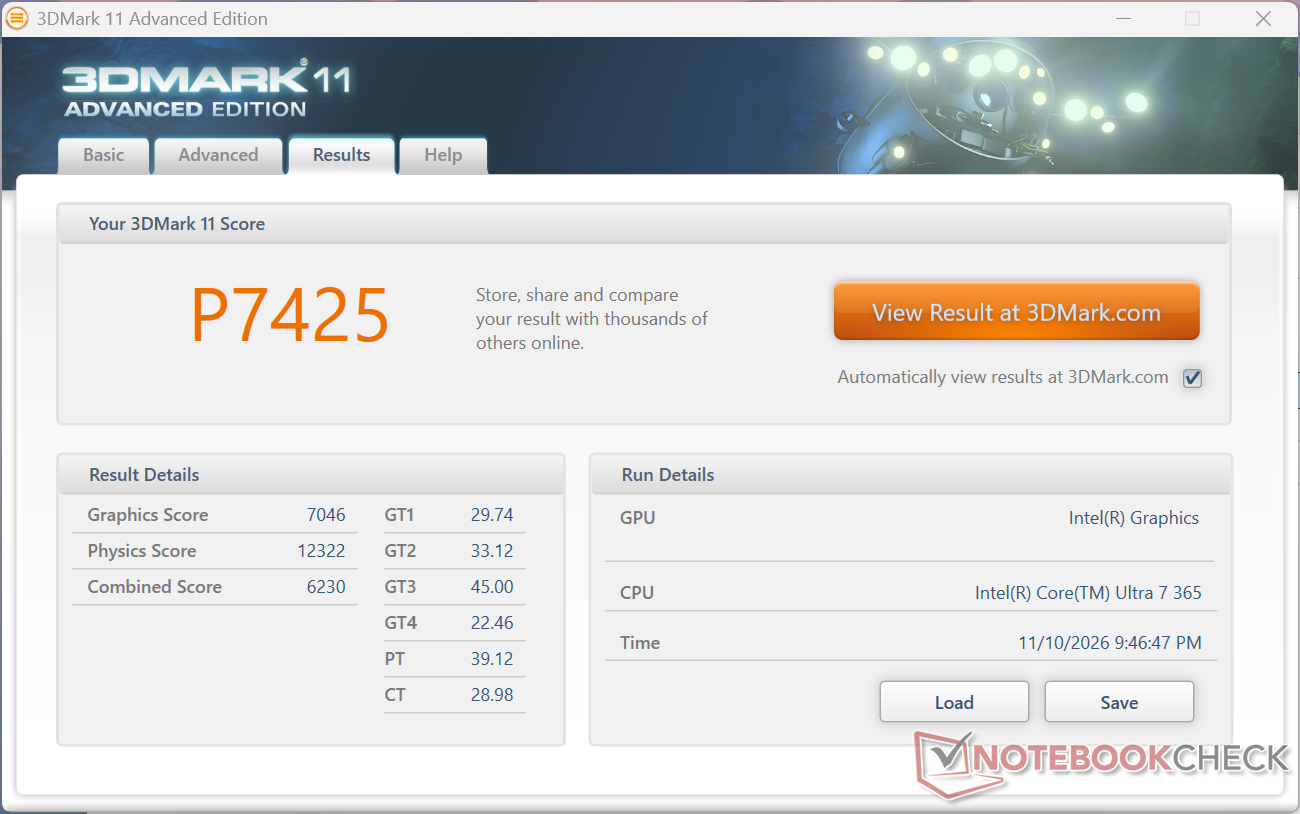
7425 points
3DMark Cloud Gate Standard Score
21696 points
3DMark Fire Strike Score
5331 points
3DMark Time Spy Score
2702 points
3DMark Steel Nomad Score
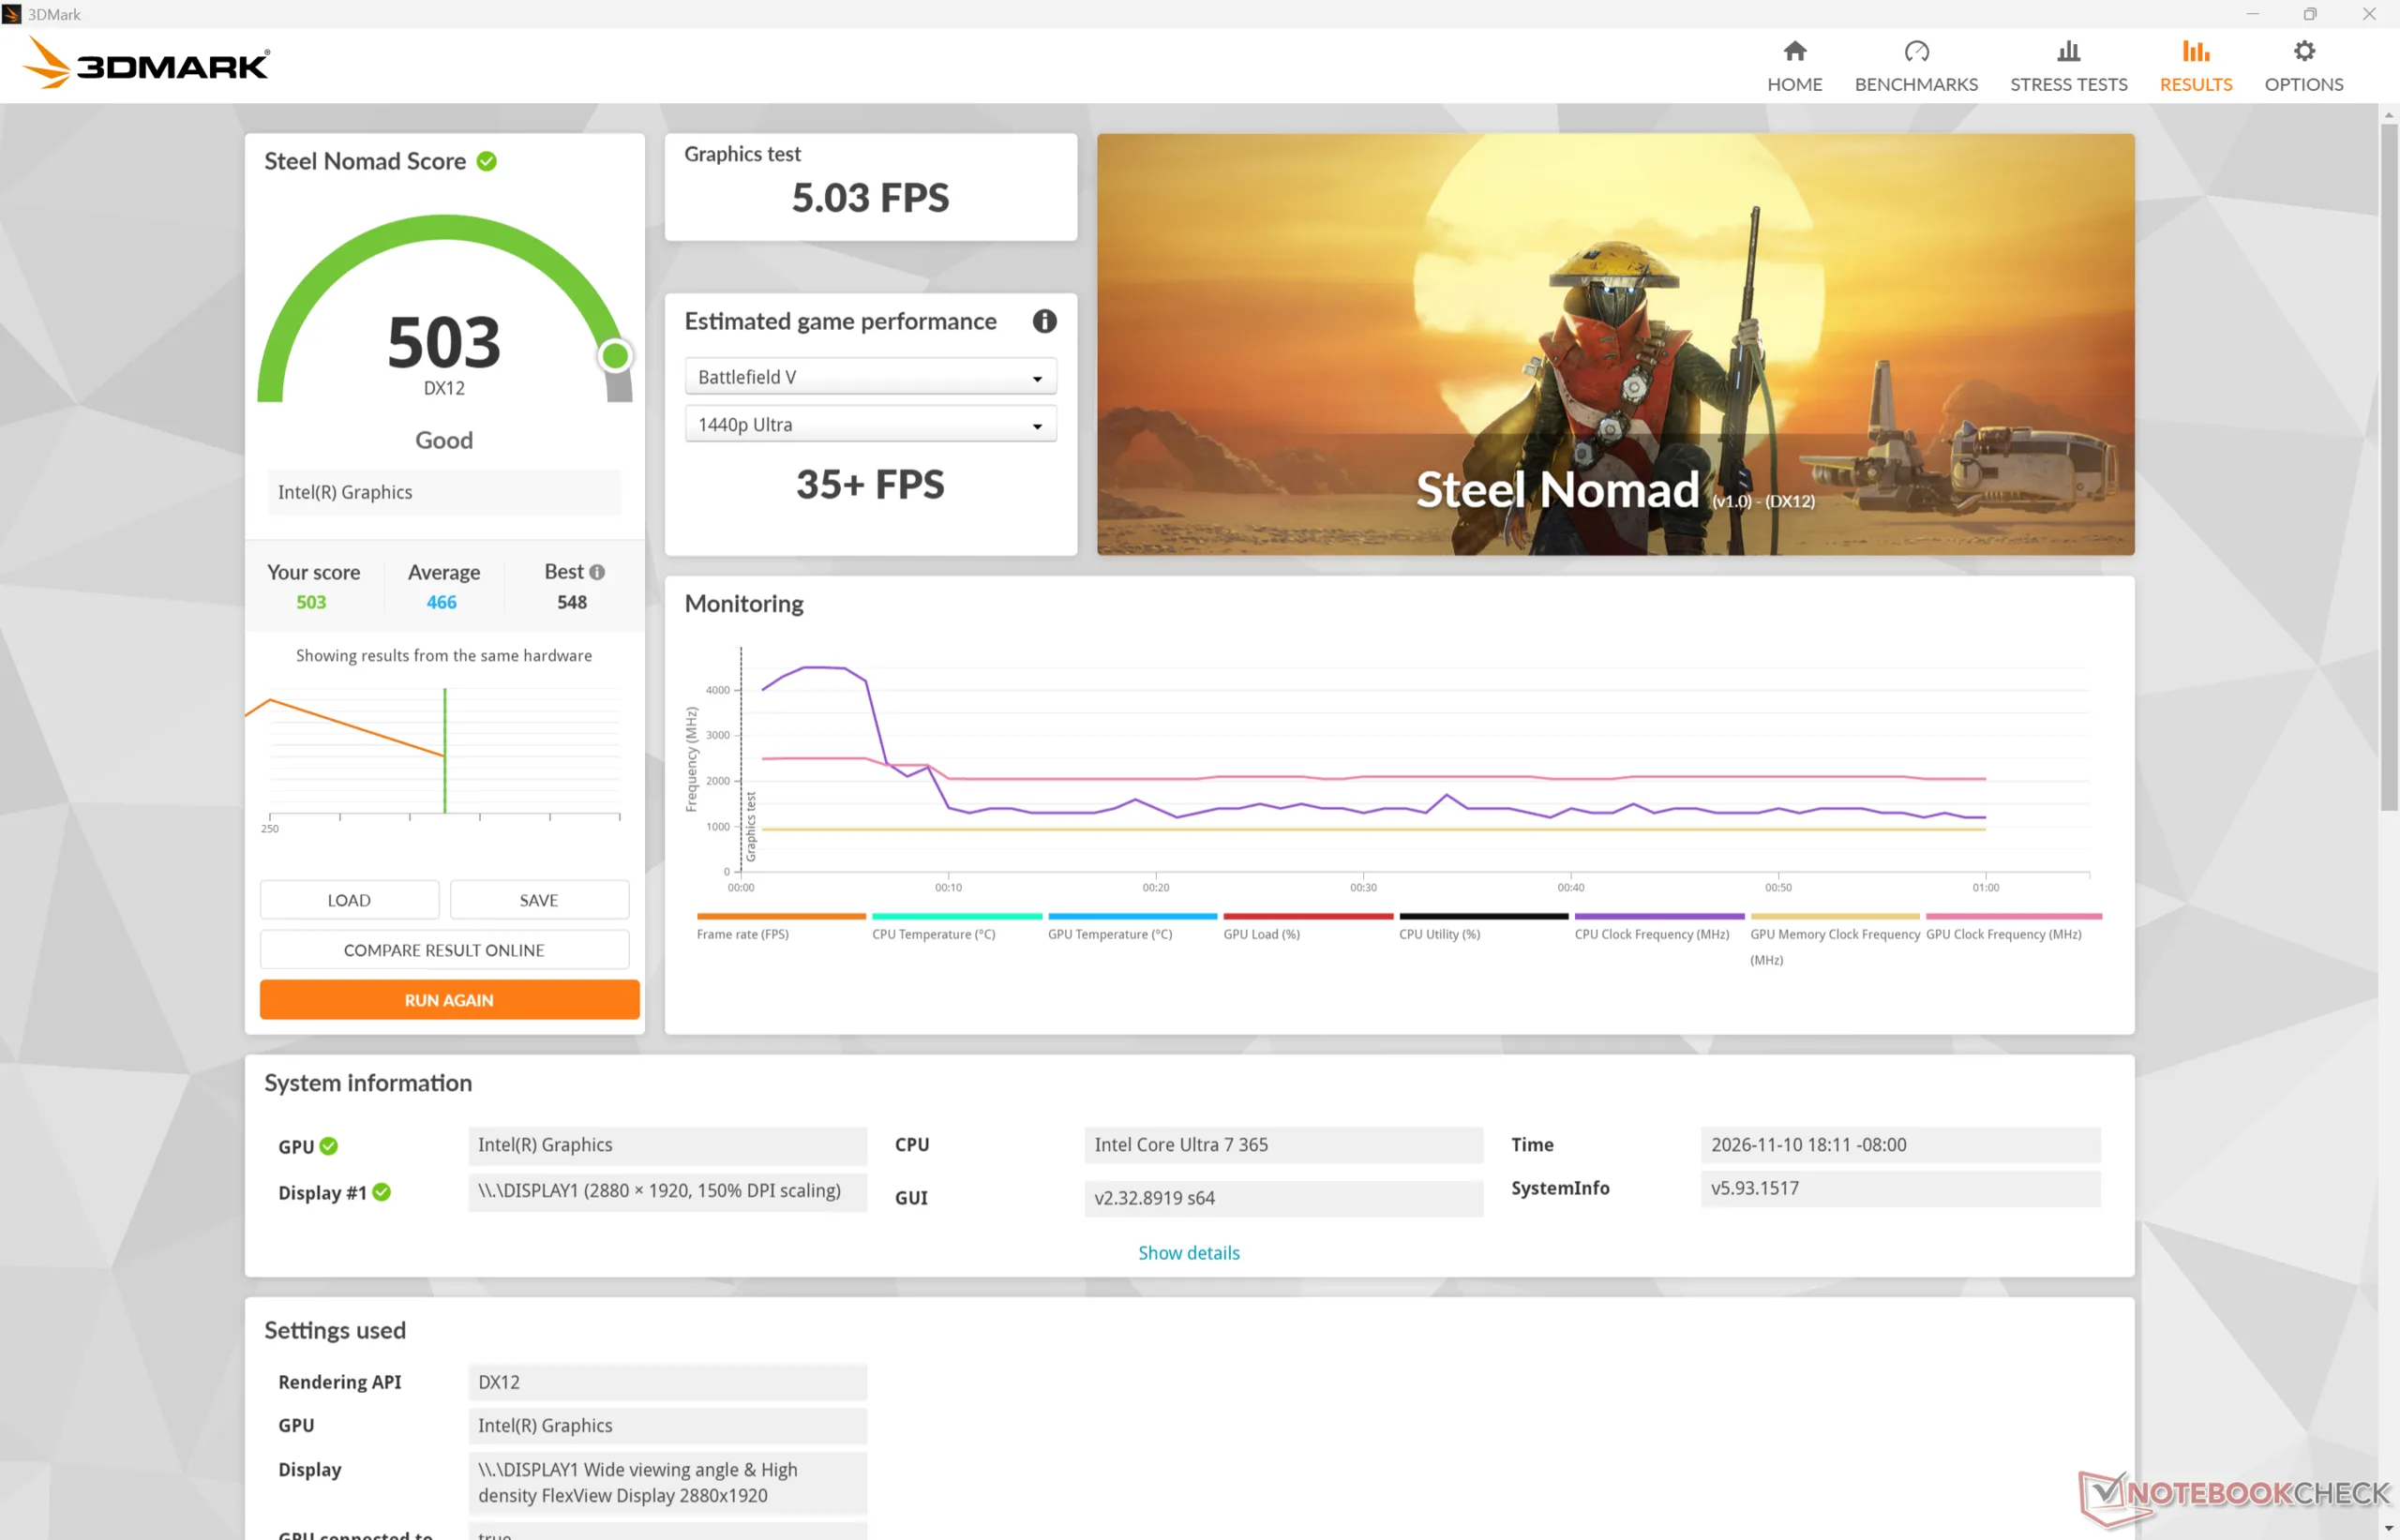
503 points
Help
Blender
v3.3 Classroom CPU
Microsoft Surface Laptop 13 2026
Qualcomm SD X2 Adreno X2-45, Qualcomm Snapdragon X2 Plus X2P-42-100
910 Seconds * -35%
Dell Pro 13 Premium PA13250
Intel Arc Graphics 140V, Intel Core Ultra 7 268V
698 Seconds * -3%
Lenovo ThinkPad X13 Detachable Gen 1
Intel Graphics 4 Xe3 Panther Lake iGPU, Intel Core Ultra 7 365
675 Seconds *
HP EliteBook 8 Flip G1i 13
Intel Graphics 4-Core iGPU (Meteor / Arrow Lake), Intel Core Ultra 7 265U
667 Seconds * +1%
Lenovo Yoga Book 9 13IMU9
Intel Graphics 4-Core iGPU (Meteor / Arrow Lake), Intel Core Ultra 7 155U
649 Seconds * +4%
Dell XPS 13 9350
Intel Arc Graphics 140V, Intel Core Ultra 7 256V
580 Seconds * +14%
MSI Summit E13 AI Evo A1MTG
Intel Arc 8-Core iGPU, Intel Core Ultra 7 155H
534 Seconds * +21%
MSI Prestige 13 AI+ A3MG
Intel Graphics 4 Xe3 Panther Lake iGPU, Intel Core Ultra 9 386H
503 Seconds * +25%
Average Intel Graphics 4 Xe3 Panther Lake iGPU
  (298 - 675, n=24)
438 Seconds * +35%
HP OmniBook 7 Aero 13-bg1077nr
AMD Radeon 860M, AMD Ryzen AI 7 350
365 Seconds * +46%
Dell Pro 7 13 2-in-1
Intel Graphics 4 Xe3 Panther Lake iGPU, Intel Core Ultra 7 366H
348 Seconds * +48%
Lenovo ThinkPad X13 Gen 7 AMD
AMD Radeon 860M, AMD Ryzen AI 7 PRO 450
347 Seconds * +49%
v3.3 Classroom oneAPI/Intel
Dell Pro 13 Premium PA13250
Intel Arc Graphics 140V, Intel Core Ultra 7 268V
368 Seconds *
HP EliteBook 8 Flip G1i 13
Intel Graphics 4-Core iGPU (Meteor / Arrow Lake), Intel Core Ultra 7 265U
313 Seconds *
MSI Summit E13 AI Evo A1MTG
Intel Arc 8-Core iGPU, Intel Core Ultra 7 155H
309 Seconds *
Average Intel Graphics 4 Xe3 Panther Lake iGPU
  (231 - 257, n=6)
242 Seconds *
Dell XPS 13 9350
Intel Arc Graphics 140V, Intel Core Ultra 7 256V
211 Seconds *
v4.3 Barbershop CPU
Lenovo ThinkPad X13 Detachable Gen 1
Intel Graphics 4 Xe3 Panther Lake iGPU, Intel Core Ultra 7 365
3506 Seconds *
HP EliteBook 8 Flip G1i 13
Intel Graphics 4-Core iGPU (Meteor / Arrow Lake), Intel Core Ultra 7 265U
3358 Seconds * +4%
MSI Summit E13 AI Evo A1MTG
Intel Arc 8-Core iGPU, Intel Core Ultra 7 155H
2787 Seconds * +21%
Average Intel Graphics 4 Xe3 Panther Lake iGPU
  (1505 - 3506, n=15)
2362 Seconds * +33%
HP OmniBook 7 Aero 13-bg1077nr
AMD Radeon 860M, AMD Ryzen AI 7 350
2075 Seconds * +41%
Dell Pro 7 13 2-in-1
Intel Graphics 4 Xe3 Panther Lake iGPU, Intel Core Ultra 7 366H
1850 Seconds * +47%
v4.3 Barbershop oneAPI
HP EliteBook 8 Flip G1i 13
Intel Graphics 4-Core iGPU (Meteor / Arrow Lake), Intel Core Ultra 7 265U
1308 Seconds * -56%
Average Intel Graphics 4 Xe3 Panther Lake iGPU
  (758 - 1015, n=11)
885 Seconds * -6%
Lenovo ThinkPad X13 Detachable Gen 1
Intel Graphics 4 Xe3 Panther Lake iGPU, Intel Core Ultra 7 365
836 Seconds *

* ... smaller is better

Performance rating - Percent
Dell Pro 13 Premium PA13250
Intel Core Ultra 7 268V, Intel Arc Graphics 140V
96.1 pt
Dell Pro 7 13 2-in-1
Intel Core Ultra 7 366H, Intel Graphics 4 Xe3 Panther Lake iGPU
86 pt
Lenovo ThinkPad X13 Gen 7 AMD
AMD Ryzen AI 7 PRO 450, AMD Radeon 860M
82.8 pt
MSI Prestige 13 AI+ A3MG -4!
Intel Core Ultra 9 386H, Intel Graphics 4 Xe3 Panther Lake iGPU
78.7 pt
Lenovo ThinkPad X13 Detachable Gen 1
Intel Core Ultra 7 365, Intel Graphics 4 Xe3 Panther Lake iGPU
67.3 pt
HP EliteBook 8 Flip G1i 13
Intel Core Ultra 7 265U, Intel Graphics 4-Core iGPU (Meteor / Arrow Lake)
51.1 pt
Cyberpunk 2077 - 1920x1080 Ultra Preset (FSR off)
Dell Pro 13 Premium PA13250
Intel Core Ultra 7 268V, Intel Arc Graphics 140V
28.1 (22.8min) fps +63%
Dell Pro 7 13 2-in-1
Intel Core Ultra 7 366H, Intel Graphics 4 Xe3 Panther Lake iGPU
21.6 (18.4min, 17.5P1) fps +26%
MSI Prestige 13 AI+ A3MG
Intel Core Ultra 9 386H, Intel Graphics 4 Xe3 Panther Lake iGPU
19.1 (16min) fps +11%
Lenovo ThinkPad X13 Gen 7 AMD
AMD Ryzen AI 7 PRO 450, AMD Radeon 860M
17.5 (13.8min) fps +2%
Lenovo ThinkPad X13 Detachable Gen 1
Intel Core Ultra 7 365, Intel Graphics 4 Xe3 Panther Lake iGPU
17.2 (14.6min, 14.1P1) fps
HP EliteBook 8 Flip G1i 13
Intel Core Ultra 7 265U, Intel Graphics 4-Core iGPU (Meteor / Arrow Lake)
12 (10.3min, 9.93P1) fps -30%
Baldur's Gate 3 - 1920x1080 Ultra Preset AA:T
Dell Pro 13 Premium PA13250
Intel Core Ultra 7 268V, Intel Arc Graphics 140V
30.8 fps +90%
Dell Pro 7 13 2-in-1
Intel Core Ultra 7 366H, Intel Graphics 4 Xe3 Panther Lake iGPU
22.1 (20.3min, 20.3P0.1, 20.7P1) fps +36%
Lenovo ThinkPad X13 Gen 7 AMD
AMD Ryzen AI 7 PRO 450, AMD Radeon 860M
17.7 (14.7min, 14.9P0.1, 16.1P1) fps +9%
Lenovo ThinkPad X13 Detachable Gen 1
Intel Core Ultra 7 365, Intel Graphics 4 Xe3 Panther Lake iGPU
16.2 (14.1min, 14.1P0.1, 14.2P1) fps
HP EliteBook 8 Flip G1i 13
Intel Core Ultra 7 265U, Intel Graphics 4-Core iGPU (Meteor / Arrow Lake)
12.7 fps -22%
GTA V - 1920x1080 Highest AA:4xMSAA + FX AF:16x
Dell Pro 13 Premium PA13250
Intel Core Ultra 7 268V, Intel Arc Graphics 140V
26.3 (6.46min, 20P1) fps +45%
Lenovo ThinkPad X13 Gen 7 AMD
AMD Ryzen AI 7 PRO 450, AMD Radeon 860M
25.5 (4.77min, 18.2P1) fps +41%
Dell Pro 7 13 2-in-1
Intel Core Ultra 7 366H, Intel Graphics 4 Xe3 Panther Lake iGPU
21.8 (7.1min, 15.4P1) fps +20%
Lenovo ThinkPad X13 Detachable Gen 1
Intel Core Ultra 7 365, Intel Graphics 4 Xe3 Panther Lake iGPU
18.1 (4.05min, 11.4P1) fps
HP EliteBook 8 Flip G1i 13
Intel Core Ultra 7 265U, Intel Graphics 4-Core iGPU (Meteor / Arrow Lake)
9.99 (2.84min, 7.46P1) fps -45%
Final Fantasy XV Benchmark - 1920x1080 High Quality
Dell Pro 13 Premium PA13250
Intel Core Ultra 7 268V, Intel Arc Graphics 140V
29.1 fps +29%
Dell Pro 7 13 2-in-1
Intel Core Ultra 7 366H, Intel Graphics 4 Xe3 Panther Lake iGPU
26.3 fps +17%
Lenovo ThinkPad X13 Gen 7 AMD
AMD Ryzen AI 7 PRO 450, AMD Radeon 860M
25.1 fps +12%
Lenovo ThinkPad X13 Detachable Gen 1
Intel Core Ultra 7 365, Intel Graphics 4 Xe3 Panther Lake iGPU
22.5 fps
HP EliteBook 8 Flip G1i 13
Intel Core Ultra 7 265U, Intel Graphics 4-Core iGPU (Meteor / Arrow Lake)
18.2 fps -19%
Strange Brigade - 1920x1080 ultra AA:ultra AF:16
Dell Pro 13 Premium PA13250
Intel Core Ultra 7 268V, Intel Arc Graphics 140V
57.8 (16min, 33.5P1) fps +46%
Dell Pro 7 13 2-in-1
Intel Core Ultra 7 366H, Intel Graphics 4 Xe3 Panther Lake iGPU
56.5 (34.3min, 40.3P1) fps +42%
Lenovo ThinkPad X13 Gen 7 AMD
AMD Ryzen AI 7 PRO 450, AMD Radeon 860M
44.1 (30.6min, 34.1P1) fps +11%
Lenovo ThinkPad X13 Detachable Gen 1
Intel Core Ultra 7 365, Intel Graphics 4 Xe3 Panther Lake iGPU
39.7 (9.5min, 13.8P1) fps
HP EliteBook 8 Flip G1i 13
Intel Core Ultra 7 265U, Intel Graphics 4-Core iGPU (Meteor / Arrow Lake)
27.1 (16.1min, 18.4P1) fps -32%
Dota 2 Reborn - 1920x1080 ultra (3/3) best looking
Lenovo ThinkPad X13 Gen 7 AMD
AMD Ryzen AI 7 PRO 450, AMD Radeon 860M
78.8 (69.7min) fps +31%
Dell Pro 7 13 2-in-1
Intel Core Ultra 7 366H, Intel Graphics 4 Xe3 Panther Lake iGPU
77.8 (47.6min) fps +29%
MSI Prestige 13 AI+ A3MG
Intel Core Ultra 9 386H, Intel Graphics 4 Xe3 Panther Lake iGPU
73 (46.6min) fps +21%
Dell Pro 13 Premium PA13250
Intel Core Ultra 7 268V, Intel Arc Graphics 140V
71.2 (43.6min) fps +18%
Lenovo ThinkPad X13 Detachable Gen 1
Intel Core Ultra 7 365, Intel Graphics 4 Xe3 Panther Lake iGPU
60.3 (30.2min) fps
HP EliteBook 8 Flip G1i 13
Intel Core Ultra 7 265U, Intel Graphics 4-Core iGPU (Meteor / Arrow Lake)
52.4 (32.2min) fps -13%
X-Plane 11.11 - 1920x1080 high (fps_test=3)
Lenovo ThinkPad X13 Gen 7 AMD
AMD Ryzen AI 7 PRO 450, AMD Radeon 860M
39.8 fps +52%
Dell Pro 7 13 2-in-1
Intel Core Ultra 7 366H, Intel Graphics 4 Xe3 Panther Lake iGPU
33.2 fps +27%
Dell Pro 13 Premium PA13250
Intel Core Ultra 7 268V, Intel Arc Graphics 140V
32.7 fps +25%
MSI Prestige 13 AI+ A3MG
Intel Core Ultra 9 386H, Intel Graphics 4 Xe3 Panther Lake iGPU
30.1 fps +15%
Lenovo ThinkPad X13 Detachable Gen 1
Intel Core Ultra 7 365, Intel Graphics 4 Xe3 Panther Lake iGPU
26.2 fps
HP EliteBook 8 Flip G1i 13
Intel Core Ultra 7 265U, Intel Graphics 4-Core iGPU (Meteor / Arrow Lake)
23.7 fps -10%
Baldur's Gate 3
1920x1080 Low Preset AA:SM
Dell Pro 13 Premium PA13250
Intel Core Ultra 7 268V, Intel Arc Graphics 140V
45.5 fps +104%
Dell XPS 13 9350
Intel Core Ultra 7 256V, Intel Arc Graphics 140V
36.6 fps +64%
Dell Pro 7 13 2-in-1
Intel Core Ultra 7 366H, Intel Graphics 4 Xe3 Panther Lake iGPU
31.9 (28.5min, 28.7P0.1, 29.4P1) fps +43%
HP OmniBook 7 Aero 13-bg1077nr
AMD Ryzen AI 7 350, AMD Radeon 860M
31.8 (23.7min, 23.7P0.1, 27.7P1) fps +43%
Average Intel Graphics 4 Xe3 Panther Lake iGPU
  (22.3 - 35.1, n=22)
30.7 fps +38%
Lenovo ThinkPad X13 Gen 7 AMD
AMD Ryzen AI 7 PRO 450, AMD Radeon 860M
30.6 (23.6min, 24.1P0.1, 27.5P1) fps +37%
MSI Summit E13 AI Evo A1MTG
Intel Core Ultra 7 155H, Intel Arc 8-Core iGPU
22.8 fps +2%
Lenovo ThinkPad X13 Detachable Gen 1
Intel Core Ultra 7 365, Intel Graphics 4 Xe3 Panther Lake iGPU
22.3 (20.3min, 20.4P0.1, 20.7P1) fps
Microsoft Surface Laptop 13 2026
Qualcomm Snapdragon X2 Plus X2P-42-100, Qualcomm SD X2 Adreno X2-45
21.2 (14.1min, 14.6P0.1, 15P1) fps -5%
HP EliteBook 8 Flip G1i 13
Intel Core Ultra 7 265U, Intel Graphics 4-Core iGPU (Meteor / Arrow Lake)
18.1 fps -19%
Lenovo Yoga Book 9 13IMU9
Intel Core Ultra 7 155U, Intel Graphics 4-Core iGPU (Meteor / Arrow Lake)
16.2 fps -27%
1920x1080 Medium Preset AA:T
Dell Pro 13 Premium PA13250
Intel Core Ultra 7 268V, Intel Arc Graphics 140V
35.7 fps +94%
Dell XPS 13 9350
Intel Core Ultra 7 256V, Intel Arc Graphics 140V
30.5 fps +66%
HP OmniBook 7 Aero 13-bg1077nr
AMD Ryzen AI 7 350, AMD Radeon 860M
26.4 (15.9min, 16.5P0.1, 20.8P1) fps +43%
Dell Pro 7 13 2-in-1
Intel Core Ultra 7 366H, Intel Graphics 4 Xe3 Panther Lake iGPU
25.6 (22.8min, 22.9P0.1, 23.5P1) fps +39%
Average Intel Graphics 4 Xe3 Panther Lake iGPU
  (18.4 - 27.7, n=22)
24.4 fps +33%
Lenovo ThinkPad X13 Gen 7 AMD
AMD Ryzen AI 7 PRO 450, AMD Radeon 860M
23.8 (19.1min, 19.6P0.1, 21.7P1) fps +29%
MSI Summit E13 AI Evo A1MTG
Intel Core Ultra 7 155H, Intel Arc 8-Core iGPU
19.5 fps +6%
Lenovo ThinkPad X13 Detachable Gen 1
Intel Core Ultra 7 365, Intel Graphics 4 Xe3 Panther Lake iGPU
18.4 (16.9min, 16.9P0.1, 17.1P1) fps
Microsoft Surface Laptop 13 2026
Qualcomm Snapdragon X2 Plus X2P-42-100, Qualcomm SD X2 Adreno X2-45
17 (12min, 12P0.1, 15P1) fps -8%
HP EliteBook 8 Flip G1i 13
Intel Core Ultra 7 265U, Intel Graphics 4-Core iGPU (Meteor / Arrow Lake)
14.9 fps -19%
Lenovo Yoga Book 9 13IMU9
Intel Core Ultra 7 155U, Intel Graphics 4-Core iGPU (Meteor / Arrow Lake)
12.6 fps -32%
1920x1080 High Preset AA:T
Dell Pro 13 Premium PA13250
Intel Core Ultra 7 268V, Intel Arc Graphics 140V
31.3 fps +92%
Dell XPS 13 9350
Intel Core Ultra 7 256V, Intel Arc Graphics 140V
25.8 fps +58%
Dell Pro 7 13 2-in-1
Intel Core Ultra 7 366H, Intel Graphics 4 Xe3 Panther Lake iGPU
21.7 (19.7min, 19.8P0.1, 20.1P1) fps +33%
HP OmniBook 7 Aero 13-bg1077nr
AMD Ryzen AI 7 350, AMD Radeon 860M
21.1 (16.7min, 17.1P0.1, 18.9P1) fps +29%
Average Intel Graphics 4 Xe3 Panther Lake iGPU
  (16.3 - 24.3, n=22)
21.1 fps +29%
Lenovo ThinkPad X13 Gen 7 AMD
AMD Ryzen AI 7 PRO 450, AMD Radeon 860M
18.2 (15.5min, 15.6P0.1, 16.7P1) fps +12%
MSI Summit E13 AI Evo A1MTG
Intel Core Ultra 7 155H, Intel Arc 8-Core iGPU
16.8 fps +3%
Lenovo ThinkPad X13 Detachable Gen 1
Intel Core Ultra 7 365, Intel Graphics 4 Xe3 Panther Lake iGPU
16.3 (14.8min, 14.8P0.1, 15.1P1) fps
Microsoft Surface Laptop 13 2026
Qualcomm Snapdragon X2 Plus X2P-42-100, Qualcomm SD X2 Adreno X2-45
15 (12min, 12P0.1, 12P1) fps -8%
HP EliteBook 8 Flip G1i 13
Intel Core Ultra 7 265U, Intel Graphics 4-Core iGPU (Meteor / Arrow Lake)
12.8 fps -21%
1920x1080 Ultra Preset AA:T
Dell Pro 13 Premium PA13250
Intel Core Ultra 7 268V, Intel Arc Graphics 140V
30.8 fps +90%
Dell XPS 13 9350
Intel Core Ultra 7 256V, Intel Arc Graphics 140V
25.7 fps +59%
Dell Pro 7 13 2-in-1
Intel Core Ultra 7 366H, Intel Graphics 4 Xe3 Panther Lake iGPU
22.1 (20.3min, 20.3P0.1, 20.7P1) fps +36%
Average Intel Graphics 4 Xe3 Panther Lake iGPU
  (16.2 - 23.7, n=22)
20.8 fps +28%
HP OmniBook 7 Aero 13-bg1077nr
AMD Ryzen AI 7 350, AMD Radeon 860M
20.6 (17.1min, 17.1P0.1, 18.4P1) fps +27%
Lenovo ThinkPad X13 Gen 7 AMD
AMD Ryzen AI 7 PRO 450, AMD Radeon 860M
17.7 (14.7min, 14.9P0.1, 16.1P1) fps +9%
MSI Summit E13 AI Evo A1MTG
Intel Core Ultra 7 155H, Intel Arc 8-Core iGPU
16.3 fps +1%
Lenovo ThinkPad X13 Detachable Gen 1
Intel Core Ultra 7 365, Intel Graphics 4 Xe3 Panther Lake iGPU
16.2 (14.1min, 14.1P0.1, 14.2P1) fps
Microsoft Surface Laptop 13 2026
Qualcomm Snapdragon X2 Plus X2P-42-100, Qualcomm SD X2 Adreno X2-45
14.6 (12min, 12P0.1, 12P1) fps -10%
HP EliteBook 8 Flip G1i 13
Intel Core Ultra 7 265U, Intel Graphics 4-Core iGPU (Meteor / Arrow Lake)
12.7 fps -22%
Dota 2 Reborn
1920x1080 high (2/3)
Lenovo ThinkPad X13 Gen 7 AMD
AMD Ryzen AI 7 PRO 450, AMD Radeon 860M
89.8 (76.1min) fps +38%
Dell Pro 13 Premium PA13250
Intel Core Ultra 7 268V, Intel Arc Graphics 140V
87.8 (55.6min) fps +35%
Dell Pro 7 13 2-in-1
Intel Core Ultra 7 366H, Intel Graphics 4 Xe3 Panther Lake iGPU
87.6 (53.3min) fps +35%
Dell XPS 13 9350
Intel Core Ultra 7 256V, Intel Arc Graphics 140V
83 (35.8min) fps +27%
HP OmniBook 7 Aero 13-bg1077nr
AMD Ryzen AI 7 350, AMD Radeon 860M
82.7 (74.6min) fps +27%
Average Intel Graphics 4 Xe3 Panther Lake iGPU
  (65.1 - 97.8, n=24)
81.4 fps +25%
MSI Prestige 13 AI+ A3MG
Intel Core Ultra 9 386H, Intel Graphics 4 Xe3 Panther Lake iGPU
77.7 (49min) fps +19%
Microsoft Surface Laptop 13 2026
Qualcomm Snapdragon X2 Plus X2P-42-100, Qualcomm SD X2 Adreno X2-45
74.5 (65.3min) fps +14%
MSI Summit E13 AI Evo A1MTG
Intel Core Ultra 7 155H, Intel Arc 8-Core iGPU
65.2 (39.3min) fps 0%
Lenovo ThinkPad X13 Detachable Gen 1
Intel Core Ultra 7 365, Intel Graphics 4 Xe3 Panther Lake iGPU
65.1 (26.8min) fps
Lenovo Yoga Book 9 13IMU9
Intel Core Ultra 7 155U, Intel Graphics 4-Core iGPU (Meteor / Arrow Lake)
57.2 (42.7min) fps -12%
HP EliteBook 8 Flip G1i 13
Intel Core Ultra 7 265U, Intel Graphics 4-Core iGPU (Meteor / Arrow Lake)
44.6 (23.8min) fps -31%
1920x1080 ultra (3/3) best looking
Dell XPS 13 9350
Intel Core Ultra 7 256V, Intel Arc Graphics 140V
80.7 (52.1min) fps +34%
Lenovo ThinkPad X13 Gen 7 AMD
AMD Ryzen AI 7 PRO 450, AMD Radeon 860M
78.8 (69.7min) fps +31%
Dell Pro 7 13 2-in-1
Intel Core Ultra 7 366H, Intel Graphics 4 Xe3 Panther Lake iGPU
77.8 (47.6min) fps +29%
Average Intel Graphics 4 Xe3 Panther Lake iGPU
  (60.3 - 91.7, n=24)
77.3 fps +28%
HP OmniBook 7 Aero 13-bg1077nr
AMD Ryzen AI 7 350, AMD Radeon 860M
73.3 (66min) fps +22%
MSI Prestige 13 AI+ A3MG
Intel Core Ultra 9 386H, Intel Graphics 4 Xe3 Panther Lake iGPU
73 (46.6min) fps +21%
Dell Pro 13 Premium PA13250
Intel Core Ultra 7 268V, Intel Arc Graphics 140V
71.2 (43.6min) fps +18%
Microsoft Surface Laptop 13 2026
Qualcomm Snapdragon X2 Plus X2P-42-100, Qualcomm SD X2 Adreno X2-45
65.9 (58.2min) fps +9%
MSI Summit E13 AI Evo A1MTG
Intel Core Ultra 7 155H, Intel Arc 8-Core iGPU
63 (37.1min) fps +4%
Lenovo ThinkPad X13 Detachable Gen 1
Intel Core Ultra 7 365, Intel Graphics 4 Xe3 Panther Lake iGPU
60.3 (30.2min) fps
Lenovo Yoga Book 9 13IMU9
Intel Core Ultra 7 155U, Intel Graphics 4-Core iGPU (Meteor / Arrow Lake)
54.2 (41.9min) fps -10%
HP EliteBook 8 Flip G1i 13
Intel Core Ultra 7 265U, Intel Graphics 4-Core iGPU (Meteor / Arrow Lake)
52.4 (32.2min) fps -13%
Final Fantasy XV Benchmark
1280x720 Lite Quality
Dell XPS 13 9350
Intel Core Ultra 7 256V, Intel Arc Graphics 140V
79.4 fps +36%
Dell Pro 13 Premium PA13250
Intel Core Ultra 7 268V, Intel Arc Graphics 140V
74.9 fps +28%
Dell Pro 7 13 2-in-1
Intel Core Ultra 7 366H, Intel Graphics 4 Xe3 Panther Lake iGPU
73.4 fps +26%
Lenovo ThinkPad X13 Gen 7 AMD
AMD Ryzen AI 7 PRO 450, AMD Radeon 860M
72.9 fps +25%
Average Intel Graphics 4 Xe3 Panther Lake iGPU
  (50.7 - 76.4, n=22)
66.8 fps +14%
HP OmniBook 7 Aero 13-bg1077nr
AMD Ryzen AI 7 350, AMD Radeon 860M
63.4 fps +9%
Lenovo ThinkPad X13 Detachable Gen 1
Intel Core Ultra 7 365, Intel Graphics 4 Xe3 Panther Lake iGPU
58.4 fps
MSI Summit E13 AI Evo A1MTG
Intel Core Ultra 7 155H, Intel Arc 8-Core iGPU
49.2 fps -16%
Microsoft Surface Laptop 13 2026
Qualcomm Snapdragon X2 Plus X2P-42-100, Qualcomm SD X2 Adreno X2-45
47.3 fps -19%
HP EliteBook 8 Flip G1i 13
Intel Core Ultra 7 265U, Intel Graphics 4-Core iGPU (Meteor / Arrow Lake)
42.6 fps -27%
Lenovo Yoga Book 9 13IMU9
Intel Core Ultra 7 155U, Intel Graphics 4-Core iGPU (Meteor / Arrow Lake)
37.4 fps -36%
1920x1080 Standard Quality
Dell XPS 13 9350
Intel Core Ultra 7 256V, Intel Arc Graphics 140V
46.1 fps +49%
Dell Pro 13 Premium PA13250
Intel Core Ultra 7 268V, Intel Arc Graphics 140V
42.3 fps +36%
Dell Pro 7 13 2-in-1
Intel Core Ultra 7 366H, Intel Graphics 4 Xe3 Panther Lake iGPU
37.7 fps +22%
Lenovo ThinkPad X13 Gen 7 AMD
AMD Ryzen AI 7 PRO 450, AMD Radeon 860M
35.4 fps +14%
Average Intel Graphics 4 Xe3 Panther Lake iGPU
  (27.4 - 39.5, n=22)
35.2 fps +14%
HP OmniBook 7 Aero 13-bg1077nr
AMD Ryzen AI 7 350, AMD Radeon 860M
32.7 fps +5%
Lenovo ThinkPad X13 Detachable Gen 1
Intel Core Ultra 7 365, Intel Graphics 4 Xe3 Panther Lake iGPU
31 fps
MSI Summit E13 AI Evo A1MTG
Intel Core Ultra 7 155H, Intel Arc 8-Core iGPU
29.4 fps -5%
HP EliteBook 8 Flip G1i 13
Intel Core Ultra 7 265U, Intel Graphics 4-Core iGPU (Meteor / Arrow Lake)
24.9 fps -20%
Microsoft Surface Laptop 13 2026
Qualcomm Snapdragon X2 Plus X2P-42-100, Qualcomm SD X2 Adreno X2-45
24.6 fps -21%
Lenovo Yoga Book 9 13IMU9
Intel Core Ultra 7 155U, Intel Graphics 4-Core iGPU (Meteor / Arrow Lake)
23.4 fps -25%
1920x1080 High Quality
Dell XPS 13 9350
Intel Core Ultra 7 256V, Intel Arc Graphics 140V
31.5 fps +40%
Dell Pro 13 Premium PA13250
Intel Core Ultra 7 268V, Intel Arc Graphics 140V
29.1 fps +29%
Dell Pro 7 13 2-in-1
Intel Core Ultra 7 366H, Intel Graphics 4 Xe3 Panther Lake iGPU
26.3 fps +17%
Average Intel Graphics 4 Xe3 Panther Lake iGPU
  (20.9 - 27.4, n=22)
25.4 fps +13%
Lenovo ThinkPad X13 Gen 7 AMD
AMD Ryzen AI 7 PRO 450, AMD Radeon 860M
25.1 fps +12%
HP OmniBook 7 Aero 13-bg1077nr
AMD Ryzen AI 7 350, AMD Radeon 860M
23.3 fps +4%
Lenovo ThinkPad X13 Detachable Gen 1
Intel Core Ultra 7 365, Intel Graphics 4 Xe3 Panther Lake iGPU
22.5 fps
MSI Summit E13 AI Evo A1MTG
Intel Core Ultra 7 155H, Intel Arc 8-Core iGPU
20.7 fps -8%
HP EliteBook 8 Flip G1i 13
Intel Core Ultra 7 265U, Intel Graphics 4-Core iGPU (Meteor / Arrow Lake)
18.2 fps -19%
Lenovo Yoga Book 9 13IMU9
Intel Core Ultra 7 155U, Intel Graphics 4-Core iGPU (Meteor / Arrow Lake)
16.3 fps -28%
Microsoft Surface Laptop 13 2026
Qualcomm Snapdragon X2 Plus X2P-42-100, Qualcomm SD X2 Adreno X2-45
13.8 fps -39%
X-Plane 11.11
1280x720 low (fps_test=1)
Lenovo ThinkPad X13 Gen 7 AMD
AMD Ryzen AI 7 PRO 450, AMD Radeon 860M
65.3 fps +54%
HP OmniBook 7 Aero 13-bg1077nr
AMD Ryzen AI 7 350, AMD Radeon 860M
60.3 fps +42%
Dell Pro 13 Premium PA13250
Intel Core Ultra 7 268V, Intel Arc Graphics 140V
48.1 fps +13%
Dell XPS 13 9350
Intel Core Ultra 7 256V, Intel Arc Graphics 140V
47.1 fps +11%
MSI Summit E13 AI Evo A1MTG
Intel Core Ultra 7 155H, Intel Arc 8-Core iGPU
46.2 fps +9%
MSI Prestige 13 AI+ A3MG
Intel Core Ultra 9 386H, Intel Graphics 4 Xe3 Panther Lake iGPU
44.6 fps +5%
Lenovo ThinkPad X13 Detachable Gen 1
Intel Core Ultra 7 365, Intel Graphics 4 Xe3 Panther Lake iGPU
42.4 fps
Microsoft Surface Laptop 13 2026
Qualcomm Snapdragon X2 Plus X2P-42-100, Qualcomm SD X2 Adreno X2-45
40.3 fps -5%
Average Intel Graphics 4 Xe3 Panther Lake iGPU
  (33 - 45.7, n=24)
40.1 fps -5%
HP EliteBook 8 Flip G1i 13
Intel Core Ultra 7 265U, Intel Graphics 4-Core iGPU (Meteor / Arrow Lake)
35.3 fps -17%
Dell Pro 7 13 2-in-1
Intel Core Ultra 7 366H, Intel Graphics 4 Xe3 Panther Lake iGPU
35 fps -17%
Lenovo Yoga Book 9 13IMU9
Intel Core Ultra 7 155U, Intel Graphics 4-Core iGPU (Meteor / Arrow Lake)
34.7 fps -18%
1920x1080 med (fps_test=2)
Lenovo ThinkPad X13 Gen 7 AMD
AMD Ryzen AI 7 PRO 450, AMD Radeon 860M
50.4 fps +56%
HP OmniBook 7 Aero 13-bg1077nr
AMD Ryzen AI 7 350, AMD Radeon 860M
48.9 fps +51%
MSI Summit E13 AI Evo A1MTG
Intel Core Ultra 7 155H, Intel Arc 8-Core iGPU
37.5 fps +16%
Dell Pro 13 Premium PA13250
Intel Core Ultra 7 268V, Intel Arc Graphics 140V
36.7 fps +14%
Dell XPS 13 9350
Intel Core Ultra 7 256V, Intel Arc Graphics 140V
36.1 fps +12%
Microsoft Surface Laptop 13 2026
Qualcomm Snapdragon X2 Plus X2P-42-100, Qualcomm SD X2 Adreno X2-45
35 fps +8%
Dell Pro 7 13 2-in-1
Intel Core Ultra 7 366H, Intel Graphics 4 Xe3 Panther Lake iGPU
34.3 fps +6%
MSI Prestige 13 AI+ A3MG
Intel Core Ultra 9 386H, Intel Graphics 4 Xe3 Panther Lake iGPU
33.5 fps +4%
Lenovo ThinkPad X13 Detachable Gen 1
Intel Core Ultra 7 365, Intel Graphics 4 Xe3 Panther Lake iGPU
32.3 fps
Average Intel Graphics 4 Xe3 Panther Lake iGPU
  (24.6 - 37.6, n=24)
31.7 fps -2%
Lenovo Yoga Book 9 13IMU9
Intel Core Ultra 7 155U, Intel Graphics 4-Core iGPU (Meteor / Arrow Lake)
28.3 fps -12%
HP EliteBook 8 Flip G1i 13
Intel Core Ultra 7 265U, Intel Graphics 4-Core iGPU (Meteor / Arrow Lake)
28.1 fps -13%
1920x1080 high (fps_test=3)
HP OmniBook 7 Aero 13-bg1077nr
AMD Ryzen AI 7 350, AMD Radeon 860M
40.4 fps +54%
Lenovo ThinkPad X13 Gen 7 AMD
AMD Ryzen AI 7 PRO 450, AMD Radeon 860M
39.8 fps +52%
Dell Pro 7 13 2-in-1
Intel Core Ultra 7 366H, Intel Graphics 4 Xe3 Panther Lake iGPU
33.2 fps +27%
Dell Pro 13 Premium PA13250
Intel Core Ultra 7 268V, Intel Arc Graphics 140V
32.7 fps +25%
MSI Summit E13 AI Evo A1MTG
Intel Core Ultra 7 155H, Intel Arc 8-Core iGPU
31.4 fps +20%
Microsoft Surface Laptop 13 2026
Qualcomm Snapdragon X2 Plus X2P-42-100, Qualcomm SD X2 Adreno X2-45
30.6 fps +17%
Dell XPS 13 9350
Intel Core Ultra 7 256V, Intel Arc Graphics 140V
30.1 fps +15%
MSI Prestige 13 AI+ A3MG
Intel Core Ultra 9 386H, Intel Graphics 4 Xe3 Panther Lake iGPU
30.1 fps +15%
Average Intel Graphics 4 Xe3 Panther Lake iGPU
  (22.2 - 33.2, n=24)
28.2 fps +8%
Lenovo ThinkPad X13 Detachable Gen 1
Intel Core Ultra 7 365, Intel Graphics 4 Xe3 Panther Lake iGPU
26.2 fps
HP EliteBook 8 Flip G1i 13
Intel Core Ultra 7 265U, Intel Graphics 4-Core iGPU (Meteor / Arrow Lake)
23.7 fps -10%
Lenovo Yoga Book 9 13IMU9
Intel Core Ultra 7 155U, Intel Graphics 4-Core iGPU (Meteor / Arrow Lake)
23.6 fps -10%
F1 24
1920x1080 Low Preset AA:T AF:16x
Dell Pro 7 13 2-in-1
Intel Core Ultra 7 366H, Intel Graphics 4 Xe3 Panther Lake iGPU
76.2 (62min, 57P1) fps +36%
Lenovo ThinkPad X13 Gen 7 AMD
AMD Ryzen AI 7 PRO 450, AMD Radeon 860M
66 (52min, 47P1) fps +18%
Average Intel Graphics 4 Xe3 Panther Lake iGPU
  (51.8 - 76.2, n=17)
64.4 fps +15%
HP OmniBook 7 Aero 13-bg1077nr
AMD Ryzen AI 7 350, AMD Radeon 860M
57.4 (40min, 31P1) fps +3%
Lenovo ThinkPad X13 Detachable Gen 1
Intel Core Ultra 7 365, Intel Graphics 4 Xe3 Panther Lake iGPU
55.9 (43min, 42P1) fps
HP EliteBook 8 Flip G1i 13
Intel Core Ultra 7 265U, Intel Graphics 4-Core iGPU (Meteor / Arrow Lake)
35.1 (7min, 26P1) fps -37%
1920x1080 Medium Preset AA:T AF:16x
Dell Pro 7 13 2-in-1
Intel Core Ultra 7 366H, Intel Graphics 4 Xe3 Panther Lake iGPU
70.5 (60min, 55P1) fps +36%
Average Intel Graphics 4 Xe3 Panther Lake iGPU
  (47.5 - 70.5, n=17)
59.8 fps +16%
Lenovo ThinkPad X13 Gen 7 AMD
AMD Ryzen AI 7 PRO 450, AMD Radeon 860M
59.1 (50min, 42P1) fps +14%
HP OmniBook 7 Aero 13-bg1077nr
AMD Ryzen AI 7 350, AMD Radeon 860M
51.9 (40min, 27P1) fps 0%
Lenovo ThinkPad X13 Detachable Gen 1
Intel Core Ultra 7 365, Intel Graphics 4 Xe3 Panther Lake iGPU
51.7 (38min, 35P1) fps
HP EliteBook 8 Flip G1i 13
Intel Core Ultra 7 265U, Intel Graphics 4-Core iGPU (Meteor / Arrow Lake)
32.7 (8min, 20P1) fps -37%
1920x1080 High Preset AA:T AF:16x
Dell Pro 7 13 2-in-1
Intel Core Ultra 7 366H, Intel Graphics 4 Xe3 Panther Lake iGPU
50.5 (43min, 41P1) fps +29%
Average Intel Graphics 4 Xe3 Panther Lake iGPU
  (34.7 - 50.5, n=17)
44 fps +13%
Lenovo ThinkPad X13 Gen 7 AMD
AMD Ryzen AI 7 PRO 450, AMD Radeon 860M
42.6 (34min, 31P1) fps +9%
Lenovo ThinkPad X13 Detachable Gen 1
Intel Core Ultra 7 365, Intel Graphics 4 Xe3 Panther Lake iGPU
39 (29min, 30P1) fps
HP OmniBook 7 Aero 13-bg1077nr
AMD Ryzen AI 7 350, AMD Radeon 860M
37.8 (27min, 22P1) fps -3%
HP EliteBook 8 Flip G1i 13
Intel Core Ultra 7 265U, Intel Graphics 4-Core iGPU (Meteor / Arrow Lake)
23.8 (16P1) fps -39%
1920x1080 Ultra High Preset AA:T AF:16x
Dell Pro 7 13 2-in-1
Intel Core Ultra 7 366H, Intel Graphics 4 Xe3 Panther Lake iGPU
15.3 (12min, 12P1) fps +29%
Average Intel Graphics 4 Xe3 Panther Lake iGPU
  (10.5 - 15.3, n=17)
13.8 fps +16%
Lenovo ThinkPad X13 Detachable Gen 1
Intel Core Ultra 7 365, Intel Graphics 4 Xe3 Panther Lake iGPU
11.9 (9min, 9P1) fps
Lenovo ThinkPad X13 Gen 7 AMD
AMD Ryzen AI 7 PRO 450, AMD Radeon 860M
9.98 (7min, 7P1) fps -16%
HP OmniBook 7 Aero 13-bg1077nr
AMD Ryzen AI 7 350, AMD Radeon 860M
8 (3min, 4P1) fps -33%
HP EliteBook 8 Flip G1i 13
Intel Core Ultra 7 265U, Intel Graphics 4-Core iGPU (Meteor / Arrow Lake)
7.21 (1min, 4P1) fps -39%
Strange Brigade
1280x720 lowest AF:1
Dell Pro 13 Premium PA13250
Intel Core Ultra 7 268V, Intel Arc Graphics 140V
223 (50.2min, 124.2P1) fps +55%
Dell XPS 13 9350
Intel Core Ultra 7 256V, Intel Arc Graphics 140V
201 (47.5min, 157.9P1) fps +40%
Dell Pro 7 13 2-in-1
Intel Core Ultra 7 366H, Intel Graphics 4 Xe3 Panther Lake iGPU
195.4 (83.9min, 162.2P1) fps +36%
Lenovo ThinkPad X13 Gen 7 AMD
AMD Ryzen AI 7 PRO 450, AMD Radeon 860M
168.9 (102.1min, 144.8P1) fps +17%
Average Intel Graphics 4 Xe3 Panther Lake iGPU
  (107.3 - 198.1, n=19)
168.8 fps +17%
Lenovo ThinkPad X13 Detachable Gen 1
Intel Core Ultra 7 365, Intel Graphics 4 Xe3 Panther Lake iGPU
143.9 (22.3min, 107.5P1) fps
HP OmniBook 7 Aero 13-bg1077nr
AMD Ryzen AI 7 350, AMD Radeon 860M
142.8 (78.7min, 119.4P1) fps -1%
MSI Summit E13 AI Evo A1MTG
Intel Core Ultra 7 155H, Intel Arc 8-Core iGPU
131.2 (8.1min, 59.9P1) fps -9%
Lenovo Yoga Book 9 13IMU9
Intel Core Ultra 7 155U, Intel Graphics 4-Core iGPU (Meteor / Arrow Lake)
118.1 (28.9min, 93.5P1) fps -18%
Microsoft Surface Laptop 13 2026
Qualcomm Snapdragon X2 Plus X2P-42-100, Qualcomm SD X2 Adreno X2-45
111.4 (25.3min, 42.9P1) fps -23%
HP EliteBook 8 Flip G1i 13
Intel Core Ultra 7 265U, Intel Graphics 4-Core iGPU (Meteor / Arrow Lake)
93.9 (36.9min, 67.5P1) fps -35%
1920x1080 medium AA:medium AF:4
Dell XPS 13 9350
Intel Core Ultra 7 256V, Intel Arc Graphics 140V
84.4 (36.1min, 70.5P1) fps +49%
Dell Pro 13 Premium PA13250
Intel Core Ultra 7 268V, Intel Arc Graphics 140V
83.3 (44.1min, 71.1P1) fps +47%
Dell Pro 7 13 2-in-1
Intel Core Ultra 7 366H, Intel Graphics 4 Xe3 Panther Lake iGPU
81.1 (65min, 68.7P1) fps +43%
Lenovo ThinkPad X13 Gen 7 AMD
AMD Ryzen AI 7 PRO 450, AMD Radeon 860M
64.9 (44.8min, 50.5P1) fps +14%
Average Intel Graphics 4 Xe3 Panther Lake iGPU
  (38.2 - 81.1, n=19)
64.1 fps +13%
MSI Summit E13 AI Evo A1MTG
Intel Core Ultra 7 155H, Intel Arc 8-Core iGPU
61.3 (5.4min, 48.2P1) fps +8%
HP OmniBook 7 Aero 13-bg1077nr
AMD Ryzen AI 7 350, AMD Radeon 860M
59.6 (45.2min, 49.7P1) fps +5%
Lenovo ThinkPad X13 Detachable Gen 1
Intel Core Ultra 7 365, Intel Graphics 4 Xe3 Panther Lake iGPU
56.8 (11.6min, 45P1) fps
Lenovo Yoga Book 9 13IMU9
Intel Core Ultra 7 155U, Intel Graphics 4-Core iGPU (Meteor / Arrow Lake)
50.8 (25.8min, 42.3P1) fps -11%
Microsoft Surface Laptop 13 2026
Qualcomm Snapdragon X2 Plus X2P-42-100, Qualcomm SD X2 Adreno X2-45
42.3 (10.9min, 16.9P1) fps -26%
HP EliteBook 8 Flip G1i 13
Intel Core Ultra 7 265U, Intel Graphics 4-Core iGPU (Meteor / Arrow Lake)
41.7 (25.9min, 30.5P1) fps -27%
1920x1080 high AA:high AF:8
Dell Pro 13 Premium PA13250
Intel Core Ultra 7 268V, Intel Arc Graphics 140V
69.5 (38.9min, 55.1P1) fps +52%
Dell XPS 13 9350
Intel Core Ultra 7 256V, Intel Arc Graphics 140V
65.2 (28.3min, 51P1) fps +43%
Dell Pro 7 13 2-in-1
Intel Core Ultra 7 366H, Intel Graphics 4 Xe3 Panther Lake iGPU
58.8 (31.2min, 43.9P1) fps +29%
Average Intel Graphics 4 Xe3 Panther Lake iGPU
  (35.9 - 64.1, n=19)
53.7 fps +18%
Lenovo ThinkPad X13 Gen 7 AMD
AMD Ryzen AI 7 PRO 450, AMD Radeon 860M
52.7 (35.6min, 40.4P1) fps +16%
HP OmniBook 7 Aero 13-bg1077nr
AMD Ryzen AI 7 350, AMD Radeon 860M
48.4 (27.2min, 37P1) fps +6%
MSI Summit E13 AI Evo A1MTG
Intel Core Ultra 7 155H, Intel Arc 8-Core iGPU
45.7 (5min, 10.3P1) fps 0%
Lenovo ThinkPad X13 Detachable Gen 1
Intel Core Ultra 7 365, Intel Graphics 4 Xe3 Panther Lake iGPU
45.6 (11.3min, 20.7P1) fps
Lenovo Yoga Book 9 13IMU9
Intel Core Ultra 7 155U, Intel Graphics 4-Core iGPU (Meteor / Arrow Lake)
37.7 (6.8min, 13.1P1) fps -17%
Microsoft Surface Laptop 13 2026
Qualcomm Snapdragon X2 Plus X2P-42-100, Qualcomm SD X2 Adreno X2-45
33 (8.7min, 12.6P1) fps -28%
HP EliteBook 8 Flip G1i 13
Intel Core Ultra 7 265U, Intel Graphics 4-Core iGPU (Meteor / Arrow Lake)
32.4 (17.9min, 22.3P1) fps -29%
1920x1080 ultra AA:ultra AF:16
Dell XPS 13 9350
Intel Core Ultra 7 256V, Intel Arc Graphics 140V
58 (24.7min, 30.7P1) fps +46%
Dell Pro 13 Premium PA13250
Intel Core Ultra 7 268V, Intel Arc Graphics 140V
57.8 (16min, 33.5P1) fps +46%
Dell Pro 7 13 2-in-1
Intel Core Ultra 7 366H, Intel Graphics 4 Xe3 Panther Lake iGPU
56.5 (34.3min, 40.3P1) fps +42%
Average Intel Graphics 4 Xe3 Panther Lake iGPU
  (28.9 - 56.5, n=19)
46.6 fps +17%
Lenovo ThinkPad X13 Gen 7 AMD
AMD Ryzen AI 7 PRO 450, AMD Radeon 860M
44.1 (30.6min, 34.1P1) fps +11%
HP OmniBook 7 Aero 13-bg1077nr
AMD Ryzen AI 7 350, AMD Radeon 860M
40.3 (28.2min, 31.5P1) fps +2%
Lenovo ThinkPad X13 Detachable Gen 1
Intel Core Ultra 7 365, Intel Graphics 4 Xe3 Panther Lake iGPU
39.7 (9.5min, 13.8P1) fps
MSI Summit E13 AI Evo A1MTG
Intel Core Ultra 7 155H, Intel Arc 8-Core iGPU
33.9 (5min, 7.08P1) fps -15%
Lenovo Yoga Book 9 13IMU9
Intel Core Ultra 7 155U, Intel Graphics 4-Core iGPU (Meteor / Arrow Lake)
30.3 (7.5min, 11.1P1) fps -24%
HP EliteBook 8 Flip G1i 13
Intel Core Ultra 7 265U, Intel Graphics 4-Core iGPU (Meteor / Arrow Lake)
27.1 (16.1min, 18.4P1) fps -32%
Microsoft Surface Laptop 13 2026
Qualcomm Snapdragon X2 Plus X2P-42-100, Qualcomm SD X2 Adreno X2-45
26.9 (5.7min, 8.73P1) fps -32%
GTA V
1024x768 Lowest Settings possible
Lenovo ThinkPad X13 Gen 7 AMD
AMD Ryzen AI 7 PRO 450, AMD Radeon 860M
174.2 (3.13min, 111.1P1) fps +29%
Dell Pro 7 13 2-in-1
Intel Core Ultra 7 366H, Intel Graphics 4 Xe3 Panther Lake iGPU
168.5 (3.37min, 111.1P1) fps +25%
Average Intel Graphics 4 Xe3 Panther Lake iGPU
  (121.5 - 182.4, n=22)
164.1 fps +22%
Dell XPS 13 9350
Intel Core Ultra 7 256V, Intel Arc Graphics 140V
154.9 (4.26min, 83.3P1) fps +15%
Dell Pro 13 Premium PA13250
Intel Core Ultra 7 268V, Intel Arc Graphics 140V
153.4 (3.05min, 76.9P1) fps +14%
HP OmniBook 7 Aero 13-bg1077nr
AMD Ryzen AI 7 350, AMD Radeon 860M
151.9 (4.26min, 90.9P1) fps +13%
Lenovo ThinkPad X13 Detachable Gen 1
Intel Core Ultra 7 365, Intel Graphics 4 Xe3 Panther Lake iGPU
135 (4min, 76.9P1) fps
HP EliteBook 8 Flip G1i 13
Intel Core Ultra 7 265U, Intel Graphics 4-Core iGPU (Meteor / Arrow Lake)
127.4 (5.05min, 62.5P1) fps -6%
Microsoft Surface Laptop 13 2026
Qualcomm Snapdragon X2 Plus X2P-42-100, Qualcomm SD X2 Adreno X2-45
111.6 (4.79min, 50P1) fps -17%
MSI Summit E13 AI Evo A1MTG
Intel Core Ultra 7 155H, Intel Arc 8-Core iGPU
50.6 (12.7min, 25P1) fps -63%
1920x1080 Lowest Settings possible
Dell Pro 7 13 2-in-1
Intel Core Ultra 7 366H, Intel Graphics 4 Xe3 Panther Lake iGPU
149 (4.07min, 83.3P1) fps +35%
Dell XPS 13 9350
Intel Core Ultra 7 256V, Intel Arc Graphics 140V
146.7 (4.88min, 90.9P1) fps +33%
Average Intel Graphics 4 Xe3 Panther Lake iGPU
  (68.6 - 169.5, n=19)
141.4 fps +28%
Dell Pro 13 Premium PA13250
Intel Core Ultra 7 268V, Intel Arc Graphics 140V
136.6 (33min, 83.3P1) fps +24%
HP OmniBook 7 Aero 13-bg1077nr
AMD Ryzen AI 7 350, AMD Radeon 860M
124.9 (15.7min, 83.3P1) fps +13%
Lenovo ThinkPad X13 Detachable Gen 1
Intel Core Ultra 7 365, Intel Graphics 4 Xe3 Panther Lake iGPU
110.3 (33.7min, 71.4P1) fps
HP EliteBook 8 Flip G1i 13
Intel Core Ultra 7 265U, Intel Graphics 4-Core iGPU (Meteor / Arrow Lake)
89.6 (22min, 52.6P1) fps -19%
HP EliteBook 8 Flip G1i 13
Intel Core Ultra 7 265U, Intel Graphics 4-Core iGPU (Meteor / Arrow Lake)
89.3 (24.7min, 50P1) fps -19%
MSI Summit E13 AI Evo A1MTG
Intel Core Ultra 7 155H, Intel Arc 8-Core iGPU
45.6 (11.8min, 21.3P1) fps -59%
1366x768 Normal/Off AF:4x
Lenovo ThinkPad X13 Gen 7 AMD
AMD Ryzen AI 7 PRO 450, AMD Radeon 860M
159.7 (3.66min, 111.1P1) fps +28%
Average Intel Graphics 4 Xe3 Panther Lake iGPU
  (109.1 - 174.7, n=22)
154.6 fps +23%
Dell XPS 13 9350
Intel Core Ultra 7 256V, Intel Arc Graphics 140V
149.4 (4.38min, 90.9P1) fps +19%
Dell Pro 7 13 2-in-1
Intel Core Ultra 7 366H, Intel Graphics 4 Xe3 Panther Lake iGPU
145.9 (2.66min, 90.9P1) fps +17%
HP OmniBook 7 Aero 13-bg1077nr
AMD Ryzen AI 7 350, AMD Radeon 860M
143.2 (4.28min, 90.9P1) fps +14%
Dell Pro 13 Premium PA13250
Intel Core Ultra 7 268V, Intel Arc Graphics 140V
140 (5.12min, 83.3P1) fps +12%
Lenovo ThinkPad X13 Detachable Gen 1
Intel Core Ultra 7 365, Intel Graphics 4 Xe3 Panther Lake iGPU
125.2 (6.81min, 71.4P1) fps
HP EliteBook 8 Flip G1i 13
Intel Core Ultra 7 265U, Intel Graphics 4-Core iGPU (Meteor / Arrow Lake)
105.5 (21.5min, 52.6P1) fps -16%
Microsoft Surface Laptop 13 2026
Qualcomm Snapdragon X2 Plus X2P-42-100, Qualcomm SD X2 Adreno X2-45
101.4 (11.3min, 45.5P1) fps -19%
MSI Summit E13 AI Evo A1MTG
Intel Core Ultra 7 155H, Intel Arc 8-Core iGPU
51.1 (4.16min, 23.3P1) fps -59%
1920x1080 Normal/Off AF:4x
Average Intel Graphics 4 Xe3 Panther Lake iGPU
  (88.1 - 159.6, n=18)
137.9 fps +33%
Dell XPS 13 9350
Intel Core Ultra 7 256V, Intel Arc Graphics 140V
134.2 (5.63min, 83.3P1) fps +29%
Dell Pro 7 13 2-in-1
Intel Core Ultra 7 366H, Intel Graphics 4 Xe3 Panther Lake iGPU
127.9 (27.7min, 76.9P1) fps +23%
HP OmniBook 7 Aero 13-bg1077nr
AMD Ryzen AI 7 350, AMD Radeon 860M
120.3 (16.7min, 83.3P1) fps +16%
Dell Pro 13 Premium PA13250
Intel Core Ultra 7 268V, Intel Arc Graphics 140V
116 (6.05min, 71.4P1) fps +12%
Lenovo ThinkPad X13 Detachable Gen 1
Intel Core Ultra 7 365, Intel Graphics 4 Xe3 Panther Lake iGPU
103.9 (28.9min, 71.4P1) fps
HP EliteBook 8 Flip G1i 13
Intel Core Ultra 7 265U, Intel Graphics 4-Core iGPU (Meteor / Arrow Lake)
74.9 (21.5min, 37P1) fps -28%
MSI Summit E13 AI Evo A1MTG
Intel Core Ultra 7 155H, Intel Arc 8-Core iGPU
45.1 (9.23min, 19.6P1) fps -57%
1920x1080 High/On (Advanced Graphics Off) AA:2xMSAA + FX AF:8x
Lenovo ThinkPad X13 Gen 7 AMD
AMD Ryzen AI 7 PRO 450, AMD Radeon 860M
68.4 (6.7min, 50P1) fps +94%
Dell XPS 13 9350
Intel Core Ultra 7 256V, Intel Arc Graphics 140V
60.8 (2.26min, 43.5P1) fps +73%
HP OmniBook 7 Aero 13-bg1077nr
AMD Ryzen AI 7 350, AMD Radeon 860M
60.8 (3.38min, 41.7P1) fps +73%
Average Intel Graphics 4 Xe3 Panther Lake iGPU
  (35.2 - 58.2, n=22)
49.9 fps +42%
Dell Pro 7 13 2-in-1
Intel Core Ultra 7 366H, Intel Graphics 4 Xe3 Panther Lake iGPU
48.4 (4.46min, 27P1) fps +37%
Microsoft Surface Laptop 13 2026
Qualcomm Snapdragon X2 Plus X2P-42-100, Qualcomm SD X2 Adreno X2-45
43.1 (1.864min, 26.3P1) fps +22%
Lenovo ThinkPad X13 Detachable Gen 1
Intel Core Ultra 7 365, Intel Graphics 4 Xe3 Panther Lake iGPU
35.2 (7.95min, 26.3P1) fps
HP EliteBook 8 Flip G1i 13
Intel Core Ultra 7 265U, Intel Graphics 4-Core iGPU (Meteor / Arrow Lake)
24.4 (7.21min, 18.5P1) fps -31%
MSI Summit E13 AI Evo A1MTG
Intel Core Ultra 7 155H, Intel Arc 8-Core iGPU
23.9 (1.049min, 5.46P1) fps -32%
1920x1080 Highest AA:4xMSAA + FX AF:16x
Dell Pro 13 Premium PA13250
Intel Core Ultra 7 268V, Intel Arc Graphics 140V
26.3 (6.46min, 20P1) fps +45%
HP OmniBook 7 Aero 13-bg1077nr
AMD Ryzen AI 7 350, AMD Radeon 860M
25.7 (2.43min, 16.9P1) fps +42%
Dell XPS 13 9350
Intel Core Ultra 7 256V, Intel Arc Graphics 140V
25.6 (2.46min, 19.6P1) fps +41%
Lenovo ThinkPad X13 Gen 7 AMD
AMD Ryzen AI 7 PRO 450, AMD Radeon 860M
25.5 (4.77min, 18.2P1) fps +41%
Dell Pro 7 13 2-in-1
Intel Core Ultra 7 366H, Intel Graphics 4 Xe3 Panther Lake iGPU
21.8 (7.1min, 15.4P1) fps +20%
Average Intel Graphics 4 Xe3 Panther Lake iGPU
  (13.8 - 23.8, n=22)
20.5 fps +13%
Lenovo ThinkPad X13 Detachable Gen 1
Intel Core Ultra 7 365, Intel Graphics 4 Xe3 Panther Lake iGPU
18.1 (4.05min, 11.4P1) fps
Microsoft Surface Laptop 13 2026
Qualcomm Snapdragon X2 Plus X2P-42-100, Qualcomm SD X2 Adreno X2-45
18 (3.93min, 12.3P1) fps -1%
MSI Summit E13 AI Evo A1MTG
Intel Core Ultra 7 155H, Intel Arc 8-Core iGPU
12 (0.731min, 1.473P1) fps -34%
HP EliteBook 8 Flip G1i 13
Intel Core Ultra 7 265U, Intel Graphics 4-Core iGPU (Meteor / Arrow Lake)
9.99 (2.84min, 7.46P1) fps -45%
Cyberpunk 2077
1280x720 Low Preset (FSR off)
Dell XPS 13 9350
Intel Core Ultra 7 256V, Intel Arc Graphics 140V
66.6 (50.2min) fps +27%
Dell Pro 7 13 2-in-1
Intel Core Ultra 7 366H, Intel Graphics 4 Xe3 Panther Lake iGPU
64.4 (52.8min, 50.4P1) fps +23%
Average Intel Graphics 4 Xe3 Panther Lake iGPU
  (48.1 - 68.3, n=15)
60.6 fps +16%
Dell Pro 13 Premium PA13250
Intel Core Ultra 7 268V, Intel Arc Graphics 140V
59.2 (44.1min) fps +13%
Lenovo ThinkPad X13 Detachable Gen 1
Intel Core Ultra 7 365, Intel Graphics 4 Xe3 Panther Lake iGPU
52.3 (42.3min, 39.4P1) fps
HP OmniBook 7 Aero 13-bg1077nr
AMD Ryzen AI 7 350, AMD Radeon 860M
49 (39min, 12.1P1) fps -6%
MSI Summit E13 AI Evo A1MTG
Intel Core Ultra 7 155H, Intel Arc 8-Core iGPU
40.9 (34.6min, 31.9P1) fps -22%
HP EliteBook 8 Flip G1i 13
Intel Core Ultra 7 265U, Intel Graphics 4-Core iGPU (Meteor / Arrow Lake)
32.7 (26.5min, 25.4P1) fps -37%
Lenovo Yoga Book 9 13IMU9
Intel Core Ultra 7 155U, Intel Graphics 4-Core iGPU (Meteor / Arrow Lake)
32.5 (23.8min) fps -38%
1920x1080 Low Preset (FSR off)
Dell XPS 13 9350
Intel Core Ultra 7 256V, Intel Arc Graphics 140V
45.7 (36.4min) fps +47%
Dell Pro 13 Premium PA13250
Intel Core Ultra 7 268V, Intel Arc Graphics 140V
43.5 (35.2min) fps +40%
Dell Pro 7 13 2-in-1
Intel Core Ultra 7 366H, Intel Graphics 4 Xe3 Panther Lake iGPU
38.8 (33.1min, 31.6P1) fps +25%
MSI Prestige 13 AI+ A3MG
Intel Core Ultra 9 386H, Intel Graphics 4 Xe3 Panther Lake iGPU
37.3 (32min) fps +20%
Average Intel Graphics 4 Xe3 Panther Lake iGPU
  (29.6 - 40.2, n=24)
36.6 fps +18%
Lenovo ThinkPad X13 Gen 7 AMD
AMD Ryzen AI 7 PRO 450, AMD Radeon 860M
34.3 (27.5min) fps +11%
HP OmniBook 7 Aero 13-bg1077nr
AMD Ryzen AI 7 350, AMD Radeon 860M
32.5 (27min, 25.2P1) fps +5%
Lenovo ThinkPad X13 Detachable Gen 1
Intel Core Ultra 7 365, Intel Graphics 4 Xe3 Panther Lake iGPU
31 (26.3min, 25.5P1) fps
MSI Summit E13 AI Evo A1MTG
Intel Core Ultra 7 155H, Intel Arc 8-Core iGPU
28.3 (23.5min, 20P1) fps -9%
Microsoft Surface Laptop 13 2026
Qualcomm Snapdragon X2 Plus X2P-42-100, Qualcomm SD X2 Adreno X2-45
21.8 (17.7min) fps -30%
Lenovo Yoga Book 9 13IMU9
Intel Core Ultra 7 155U, Intel Graphics 4-Core iGPU (Meteor / Arrow Lake)
21.6 (16.7min) fps -30%
HP EliteBook 8 Flip G1i 13
Intel Core Ultra 7 265U, Intel Graphics 4-Core iGPU (Meteor / Arrow Lake)
21.1 (17.8min, 16.2P1) fps -32%
1920x1080 Medium Preset (FSR off)
Dell XPS 13 9350
Intel Core Ultra 7 256V, Intel Arc Graphics 140V
37 (30.1min) fps +55%
Dell Pro 13 Premium PA13250
Intel Core Ultra 7 268V, Intel Arc Graphics 140V
35.4 (29.4min) fps +49%
Dell Pro 7 13 2-in-1
Intel Core Ultra 7 366H, Intel Graphics 4 Xe3 Panther Lake iGPU
29.3 (25.6min, 24.4P1) fps +23%
MSI Prestige 13 AI+ A3MG
Intel Core Ultra 9 386H, Intel Graphics 4 Xe3 Panther Lake iGPU
28.8 (25min) fps +21%
Average Intel Graphics 4 Xe3 Panther Lake iGPU
  (23.2 - 30.9, n=24)
27.8 fps +17%
Lenovo ThinkPad X13 Gen 7 AMD
AMD Ryzen AI 7 PRO 450, AMD Radeon 860M
26.6 (22.3min) fps +12%
HP OmniBook 7 Aero 13-bg1077nr
AMD Ryzen AI 7 350, AMD Radeon 860M
24.9 (21.2min, 18.5P1) fps +5%
Lenovo ThinkPad X13 Detachable Gen 1
Intel Core Ultra 7 365, Intel Graphics 4 Xe3 Panther Lake iGPU
23.8 (20.4min, 19.9P1) fps
MSI Summit E13 AI Evo A1MTG
Intel Core Ultra 7 155H, Intel Arc 8-Core iGPU
23.4 (17.4min, 15.7P1) fps -2%
Lenovo Yoga Book 9 13IMU9
Intel Core Ultra 7 155U, Intel Graphics 4-Core iGPU (Meteor / Arrow Lake)
17.6 (14.4min) fps -26%
HP EliteBook 8 Flip G1i 13
Intel Core Ultra 7 265U, Intel Graphics 4-Core iGPU (Meteor / Arrow Lake)
17.1 (14.8min, 14.3P1) fps -28%
Microsoft Surface Laptop 13 2026
Qualcomm Snapdragon X2 Plus X2P-42-100, Qualcomm SD X2 Adreno X2-45
16.8 (14.1min) fps -29%
1920x1080 High Preset (FSR off)
Dell XPS 13 9350
Intel Core Ultra 7 256V, Intel Arc Graphics 140V
32 (26.2min) fps +55%
Dell Pro 13 Premium PA13250
Intel Core Ultra 7 268V, Intel Arc Graphics 140V
28.6 (22.4min) fps +39%
Dell Pro 7 13 2-in-1
Intel Core Ultra 7 366H, Intel Graphics 4 Xe3 Panther Lake iGPU
25.3 (21.8min, 21.1P1) fps +23%
MSI Prestige 13 AI+ A3MG
Intel Core Ultra 9 386H, Intel Graphics 4 Xe3 Panther Lake iGPU
24.4 (21min) fps +18%
Average Intel Graphics 4 Xe3 Panther Lake iGPU
  (19.6 - 26.8, n=24)
23.6 fps +15%
Lenovo ThinkPad X13 Gen 7 AMD
AMD Ryzen AI 7 PRO 450, AMD Radeon 860M
21.2 (17.6min) fps +3%
Lenovo ThinkPad X13 Detachable Gen 1
Intel Core Ultra 7 365, Intel Graphics 4 Xe3 Panther Lake iGPU
20.6 (17.7min, 17.1P1) fps
HP OmniBook 7 Aero 13-bg1077nr
AMD Ryzen AI 7 350, AMD Radeon 860M
19.8 (16.2min, 14.7P1) fps -4%
Lenovo Yoga Book 9 13IMU9
Intel Core Ultra 7 155U, Intel Graphics 4-Core iGPU (Meteor / Arrow Lake)
14.9 (12.1min) fps -28%
HP EliteBook 8 Flip G1i 13
Intel Core Ultra 7 265U, Intel Graphics 4-Core iGPU (Meteor / Arrow Lake)
14.6 (12.5min, 12.2P1) fps -29%
Microsoft Surface Laptop 13 2026
Qualcomm Snapdragon X2 Plus X2P-42-100, Qualcomm SD X2 Adreno X2-45
14.3 (12min) fps -31%
1920x1080 Ultra Preset (FSR off)
Dell Pro 13 Premium PA13250
Intel Core Ultra 7 268V, Intel Arc Graphics 140V
28.1 (22.8min) fps +63%
Dell Pro 7 13 2-in-1
Intel Core Ultra 7 366H, Intel Graphics 4 Xe3 Panther Lake iGPU
21.6 (18.4min, 17.5P1) fps +26%
Average Intel Graphics 4 Xe3 Panther Lake iGPU
  (16.8 - 22.6, n=24)
20.1 fps +17%
Dell XPS 13 9350
Intel Core Ultra 7 256V, Intel Arc Graphics 140V
19.1 (15.5min) fps +11%
MSI Prestige 13 AI+ A3MG
Intel Core Ultra 9 386H, Intel Graphics 4 Xe3 Panther Lake iGPU
19.1 (16min) fps +11%
Lenovo ThinkPad X13 Gen 7 AMD
AMD Ryzen AI 7 PRO 450, AMD Radeon 860M
17.5 (13.8min) fps +2%
Lenovo ThinkPad X13 Detachable Gen 1
Intel Core Ultra 7 365, Intel Graphics 4 Xe3 Panther Lake iGPU
17.2 (14.6min, 14.1P1) fps
HP OmniBook 7 Aero 13-bg1077nr
AMD Ryzen AI 7 350, AMD Radeon 860M
16.5 (13.6min, 12.7P1) fps -4%
Lenovo Yoga Book 9 13IMU9
Intel Core Ultra 7 155U, Intel Graphics 4-Core iGPU (Meteor / Arrow Lake)
13 (10.4min) fps -24%
Microsoft Surface Laptop 13 2026
Qualcomm Snapdragon X2 Plus X2P-42-100, Qualcomm SD X2 Adreno X2-45
12.2 (10.2min) fps -29%
HP EliteBook 8 Flip G1i 13
Intel Core Ultra 7 265U, Intel Graphics 4-Core iGPU (Meteor / Arrow Lake)
12 (10.3min, 9.93P1) fps -30%

Cyberpunk 2077 ultra FPS Chart

05101520Tooltip
Lenovo ThinkPad X13 Detachable Gen 1 Ultra 7 365, Intel Graphics 4 Xe3 PTL: Ø12.8 (10.7-14.9) fps
Dell Pro 7 13 2-in-1 Ultra 7 366H, Intel Graphics 4 Xe3 PTL: Ø20.5 (17-21.7) fps
lowmed.highultra
GTA V (2015) 135 125.2 35.2 18.1
Dota 2 Reborn (2015) 108.5 62.6 65.1 60.3
Final Fantasy XV Benchmark (2018) 58.4 31 22.5
X-Plane 11.11 (2018) 42.4 32.3 26.2
Strange Brigade (2018) 143.9 56.8 45.6 39.7
Baldur's Gate 3 (2023) 22.3 18.4 16.3 16.2
Cyberpunk 2077 (2023) 31 23.8 20.6 17.2
F1 24 (2024) 55.9 51.7 39 11.9

Emissions

System Noise

The system would remain silent during low loads or when streaming 4K60 video. At worst, fan noise would still be quieter than most other convertibles when running more demanding loads.
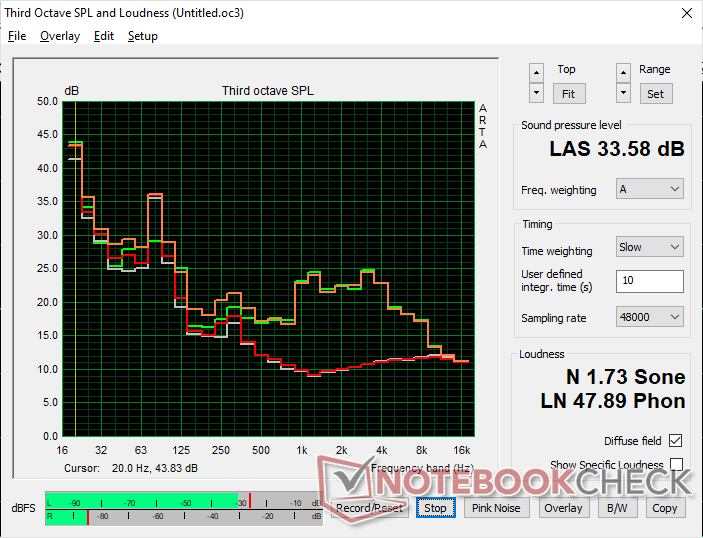
Fan noise profile (White: Background, Red: System idle, Orange: Cyberpunk 2077, Green: Prime95 stress)

Noise level

Idle
23.9 / 23.9 / 24 dB(A)
Load
/ 33.6 dB(A)
  red to green bar
 
 
30 dB
silent
40 dB(A)
audible
50 dB(A)
loud
 
min: dark, med: mid, max: light   Earthworks M23R, Arta (15 cm distance)   environment noise: 23.7 dB(A)
dB(A) 0102030405060708090Deep BassMiddle BassHigh BassLower RangeMidsHigher MidsLower HighsMid HighsUpper HighsSuper Highs2043.543.241.443.62535.633.432.533.93130.930.229.129.84028.626.524.925.65029.32724.627.76328.225.825.128.18036.23635.52910028.926.925.825.812524.420.519.225.116018.915.715.316.520018.115.114.916.425020.416.914.817.331521.417.916.819.340019.21413.817.750017.212.112.116.963017.611.51117.280016.710.71017.2100022.89.89.723.11250249.1924.5160021.59.79.621.9200022.3109.922.5250022.510.310.322315024.510.810.724.7400022.811.111.222.850001911.311.519.2630018.111.511.418.2800017.111.711.717.21000013.311.812.113.41250012.211.511.812.11600011.111.111.211.2SPL33.523.923.733.6N1.80.50.51.7median 19.2median 11.5median 11.5median 18.2Delta2.82.32.33hearing rangehide median Fan NoiseLenovo ThinkPad X13 Detachable Gen 1
Lenovo ThinkPad X13 Detachable Gen 1
Ultra 7 365, Intel Graphics 4 Xe3 PTL
Lenovo ThinkPad X13 Gen 7 AMD
Ryzen AI 7 PRO 450, Radeon 860M
Dell Pro 7 13 2-in-1
Ultra 7 366H, Intel Graphics 4 Xe3 PTL
Dell Pro 13 Premium PA13250
Core Ultra 7 268V, Arc 140V
MSI Prestige 13 AI+ A3MG
Ultra 9 386H, Intel Graphics 4 Xe3 PTL
HP EliteBook 8 Flip G1i 13
Ultra 7 265U, Graphics 4-Core iGPU (Arrow Lake)
Noise
-9%
-12%
-7%
-15%
-7%
off / environment * (dB)
23.7
24.6
-4%
23.3
2%
23
3%
25
-5%
23.7
-0%
Idle Minimum * (dB)
23.9
24.6
-3%
23.3
3%
23
4%
26
-9%
24.8
-4%
Idle Average * (dB)
23.9
24.6
-3%
23.3
3%
23
4%
27
-13%
24.8
-4%
Idle Maximum * (dB)
24
24.6
-3%
26.7
-11%
23
4%
28
-17%
24.9
-4%
Cyberpunk 2077 ultra * (dB)
33.5
39.9
-19%
44.5
-33%
42.74
-28%
41
-22%
39.5
-18%
Load Maximum * (dB)
33.6
39.9
-19%
46
-37%
42.74
-27%
42
-25%
37.4
-11%
Load Average * (dB)
32.9
29.1
37
31
37.1

* ... smaller is better

Temperature

Dual exhaust via the top edge of the tablet portion
AC adapteer reaches just over 30 C when running demanding loads
Max. Load
33.2 °C
92 F
34.8 °C
95 F
33.2 °C
92 F
33.2 °C
92 F
35.4 °C
96 F
31.6 °C
89 F
31.6 °C
89 F
32.6 °C
91 F
32.2 °C
90 F
Maximum: 35.4 °C = 96 F
Average: 33.1 °C = 92 F
37.4 °C
99 F
40 °C
104 F
37.8 °C
100 F
34.8 °C
95 F
39.6 °C
103 F
36.8 °C
98 F
31.8 °C
89 F
33.4 °C
92 F
33 °C
91 F
Maximum: 40 °C = 104 F
Average: 36.1 °C = 97 F
Power Supply (max.)  34 °C = 93 F | Room Temperature 20 °C = 68 F | Fluke 62 Mini IR Thermometer
(±) The average temperature for the upper side under maximal load is 33.1 °C / 92 F, compared to the average of 30.3 °C / 87 F for the devices in the class Convertible.
(+) The maximum temperature on the upper side is 35.4 °C / 96 F, compared to the average of 35.4 °C / 96 F, ranging from 19.6 to 60 °C for the class Convertible.
(±) The bottom heats up to a maximum of 40 °C / 104 F, compared to the average of 36.9 °C / 98 F
(+) In idle usage, the average temperature for the upper side is 26.9 °C / 80 F, compared to the device average of 30.3 °C / 87 F.
(+) The palmrests and touchpad are reaching skin temperature as a maximum (32.6 °C / 90.7 F) and are therefore not hot.
(-) The average temperature of the palmrest area of similar devices was 28 °C / 82.4 F (-4.6 °C / -8.3 F).
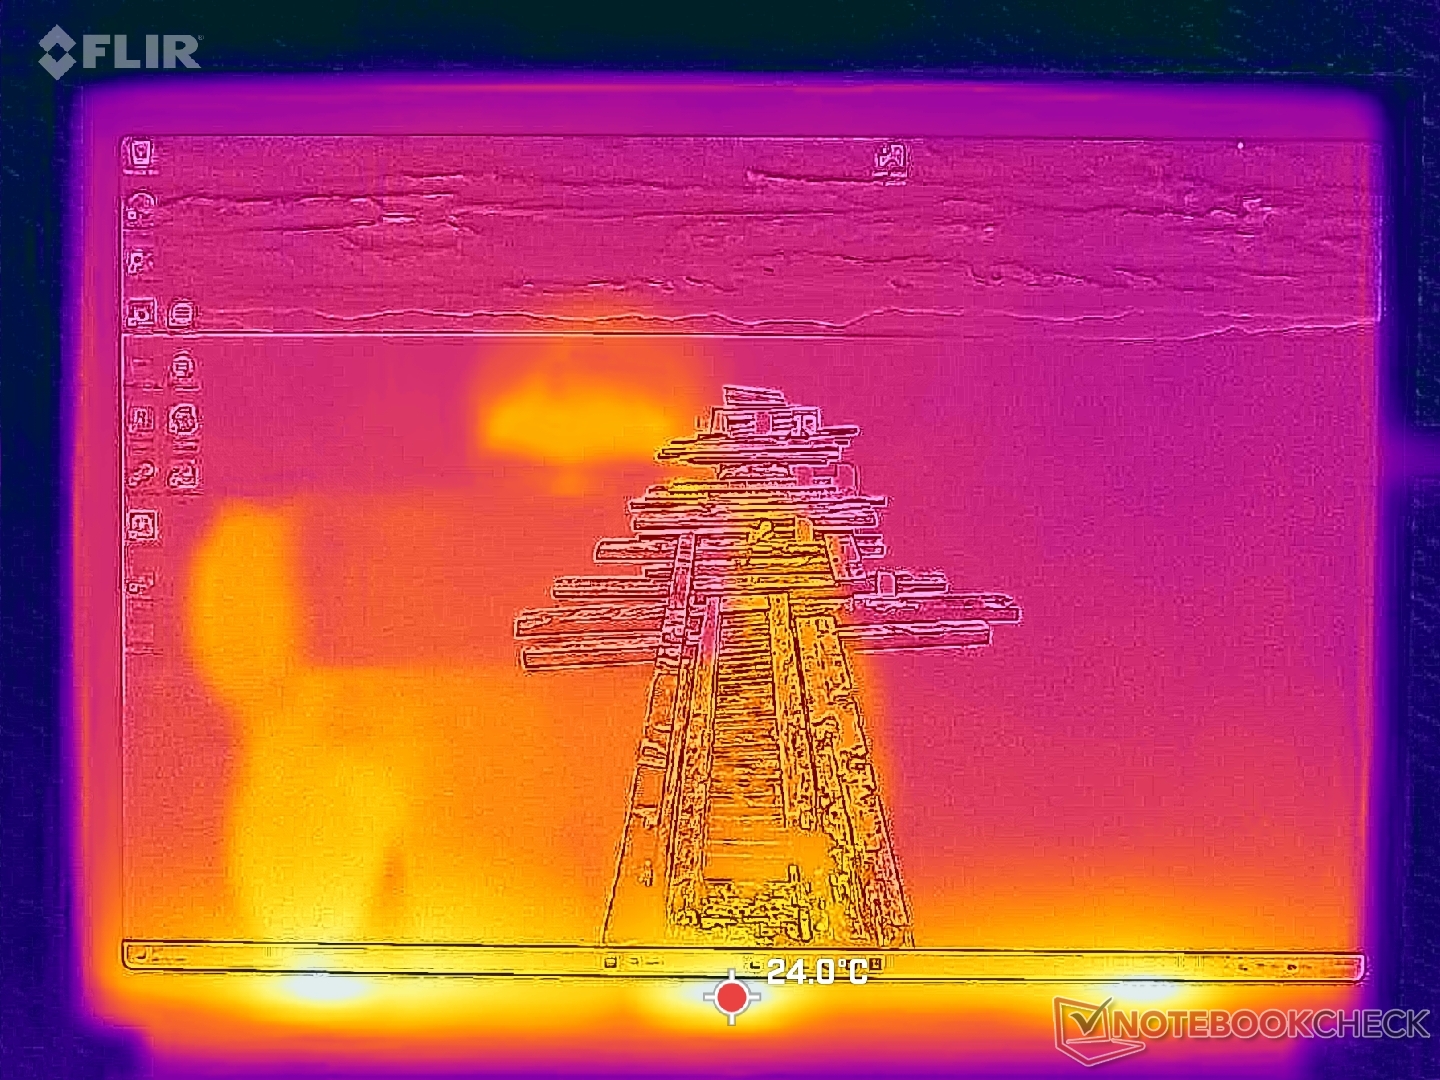
System idle (front)
System idle (front)
System idle (back)
System idle (back)
System stress (front)
System stress (back)
Lenovo ThinkPad X13 Detachable Gen 1
Ultra 7 365, Intel Graphics 4 Xe3 PTL
Lenovo ThinkPad X13 Gen 7 AMD
Ryzen AI 7 PRO 450, Radeon 860M
Dell Pro 7 13 2-in-1
Ultra 7 366H, Intel Graphics 4 Xe3 PTL
Dell Pro 13 Premium PA13250
Core Ultra 7 268V, Arc 140V
MSI Prestige 13 AI+ A3MG
Ultra 9 386H, Intel Graphics 4 Xe3 PTL
HP EliteBook 8 Flip G1i 13
Ultra 7 265U, Graphics 4-Core iGPU (Arrow Lake)
Heat
-8%
2%
15%
-11%
-13%
Maximum Upper Side * (°C)
35.4
44.3
-25%
42.2
-19%
31
12%
42
-19%
46.2
-31%
Maximum Bottom * (°C)
40
45.1
-13%
44.2
-11%
31
22%
41
-2%
51
-27%
Idle Upper Side * (°C)
28.2
26.6
6%
22.8
19%
24
15%
26.8
5%
Idle Bottom * (°C)
27.2
26.8
1%
22.6
17%
24
12%
26.4
3%

* ... smaller is better

Stress Test

CPU Turbo Boost potential is limited. When initiating Prime95 stress, the CPU would boost to 3.2 GHz, 37 W, and a toasty 96 C before stabilizing at 2.0 GHz, 15 W, and 73 C about a minute later.
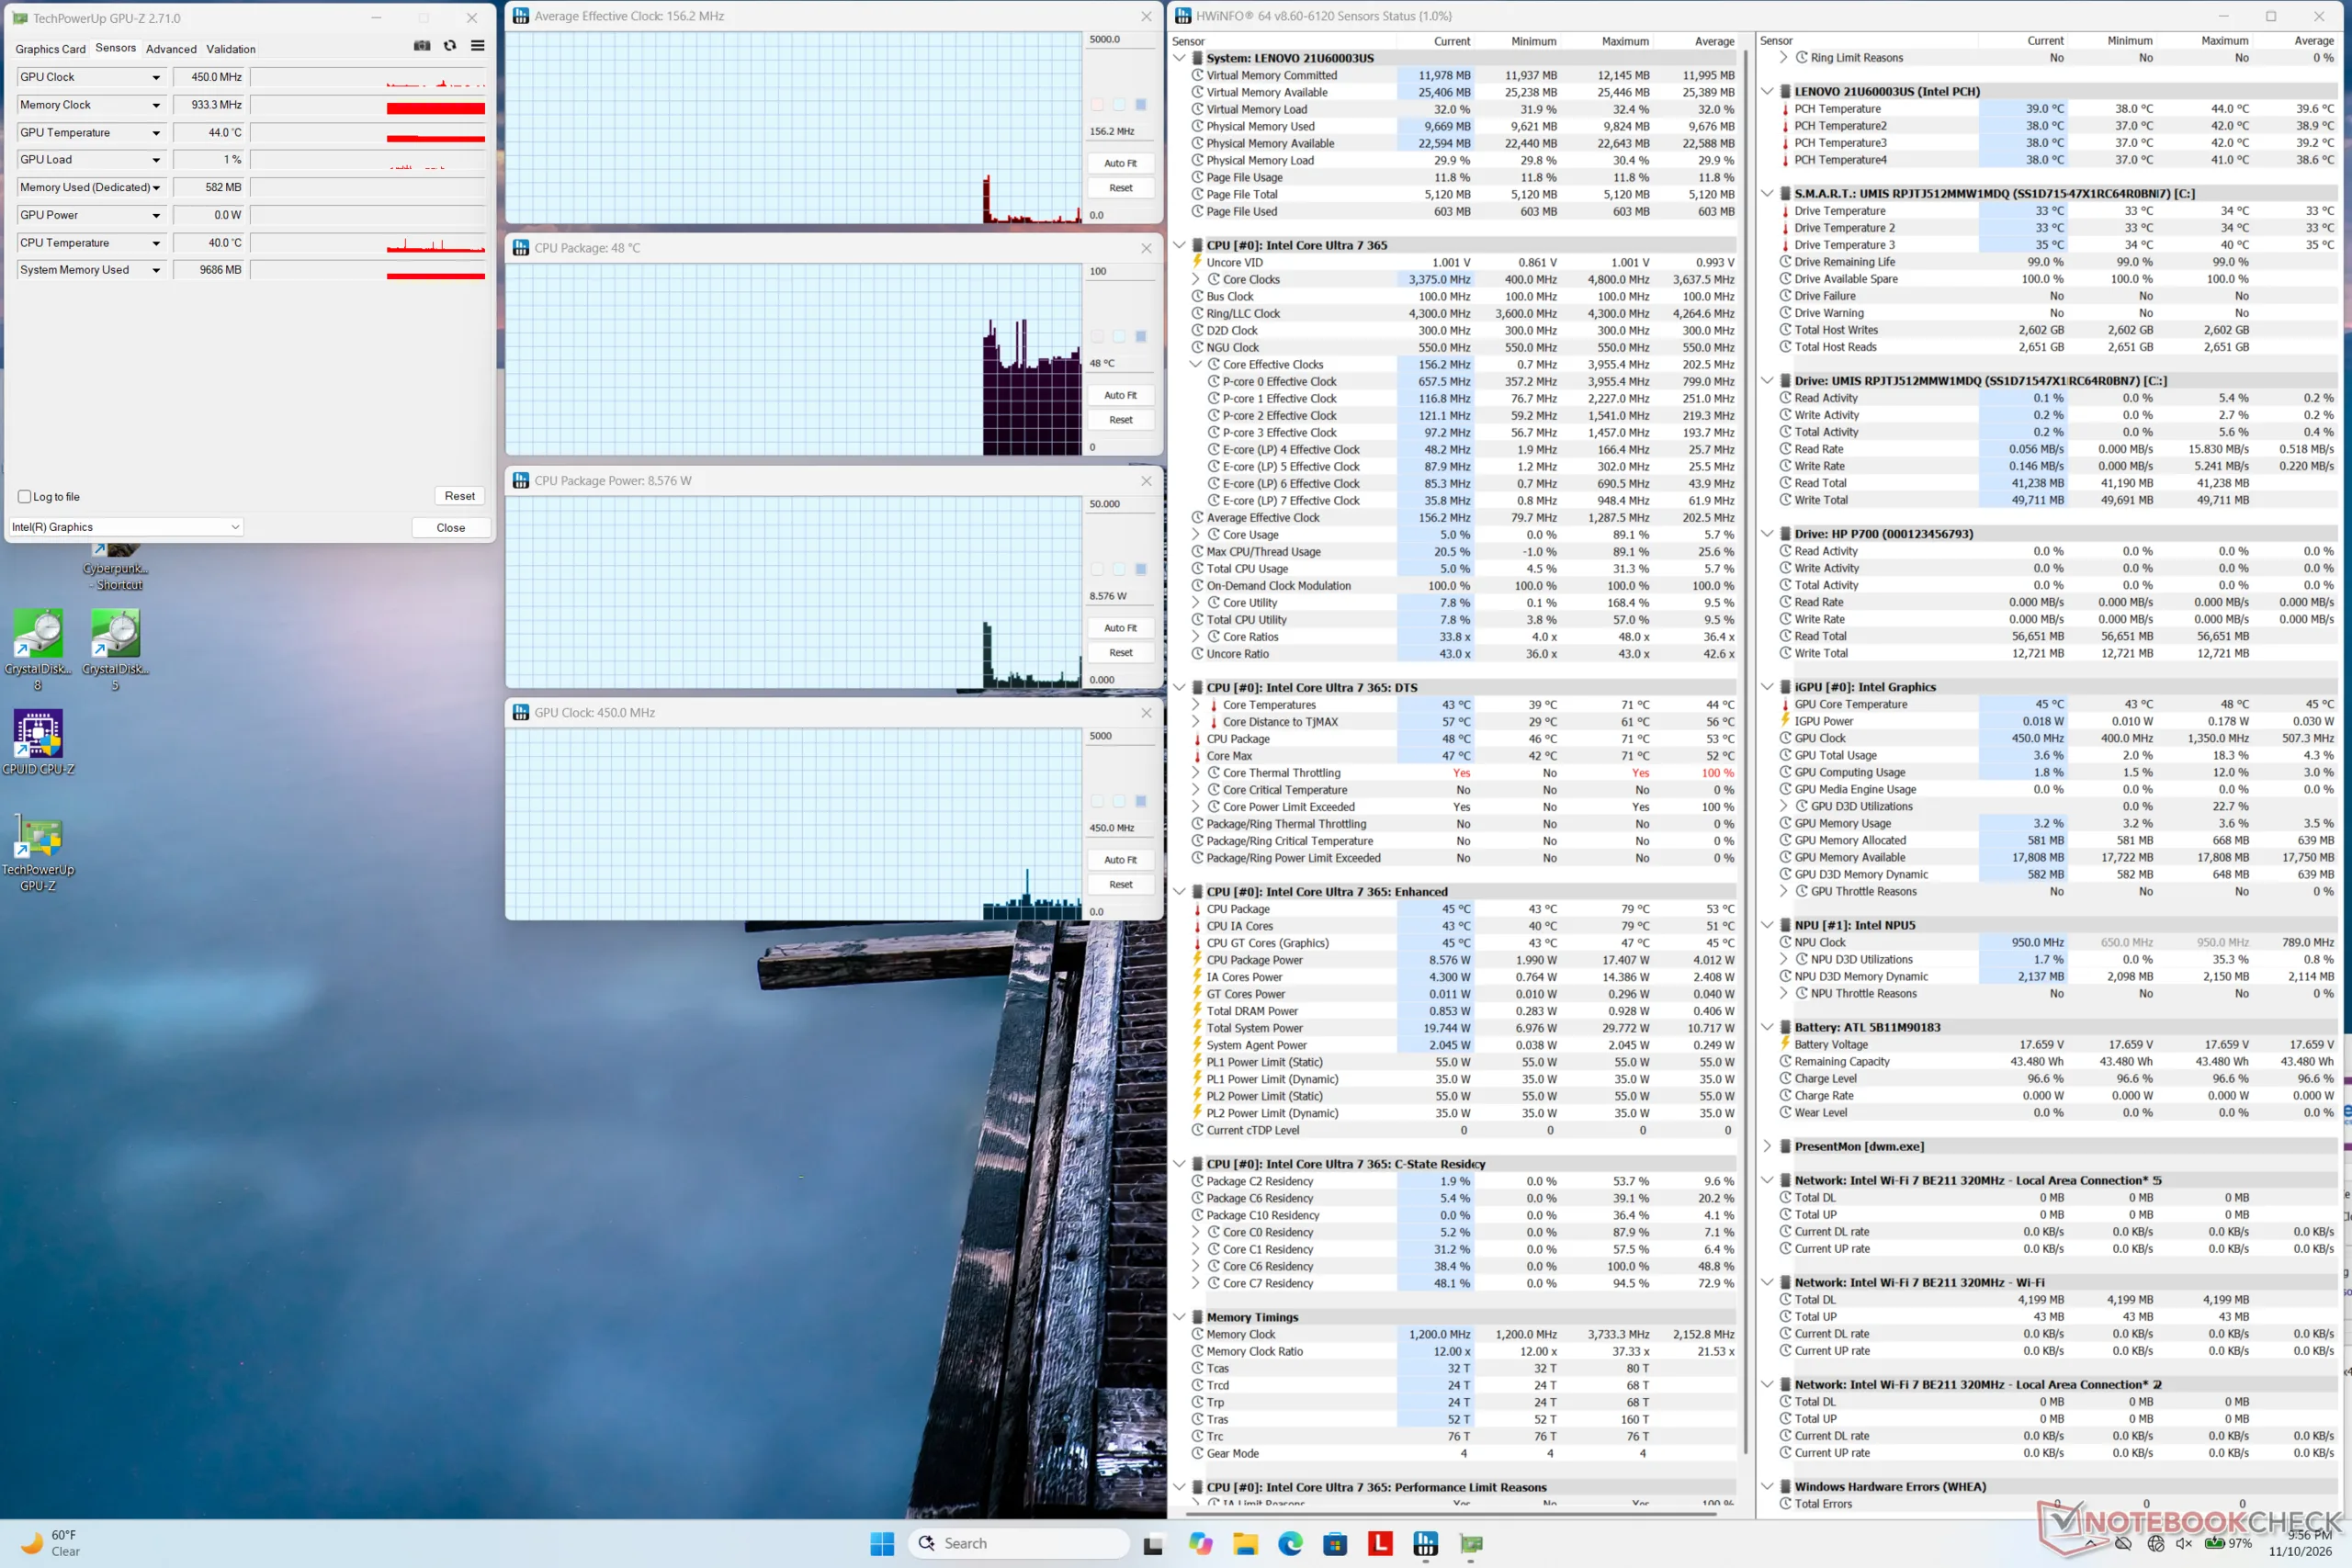
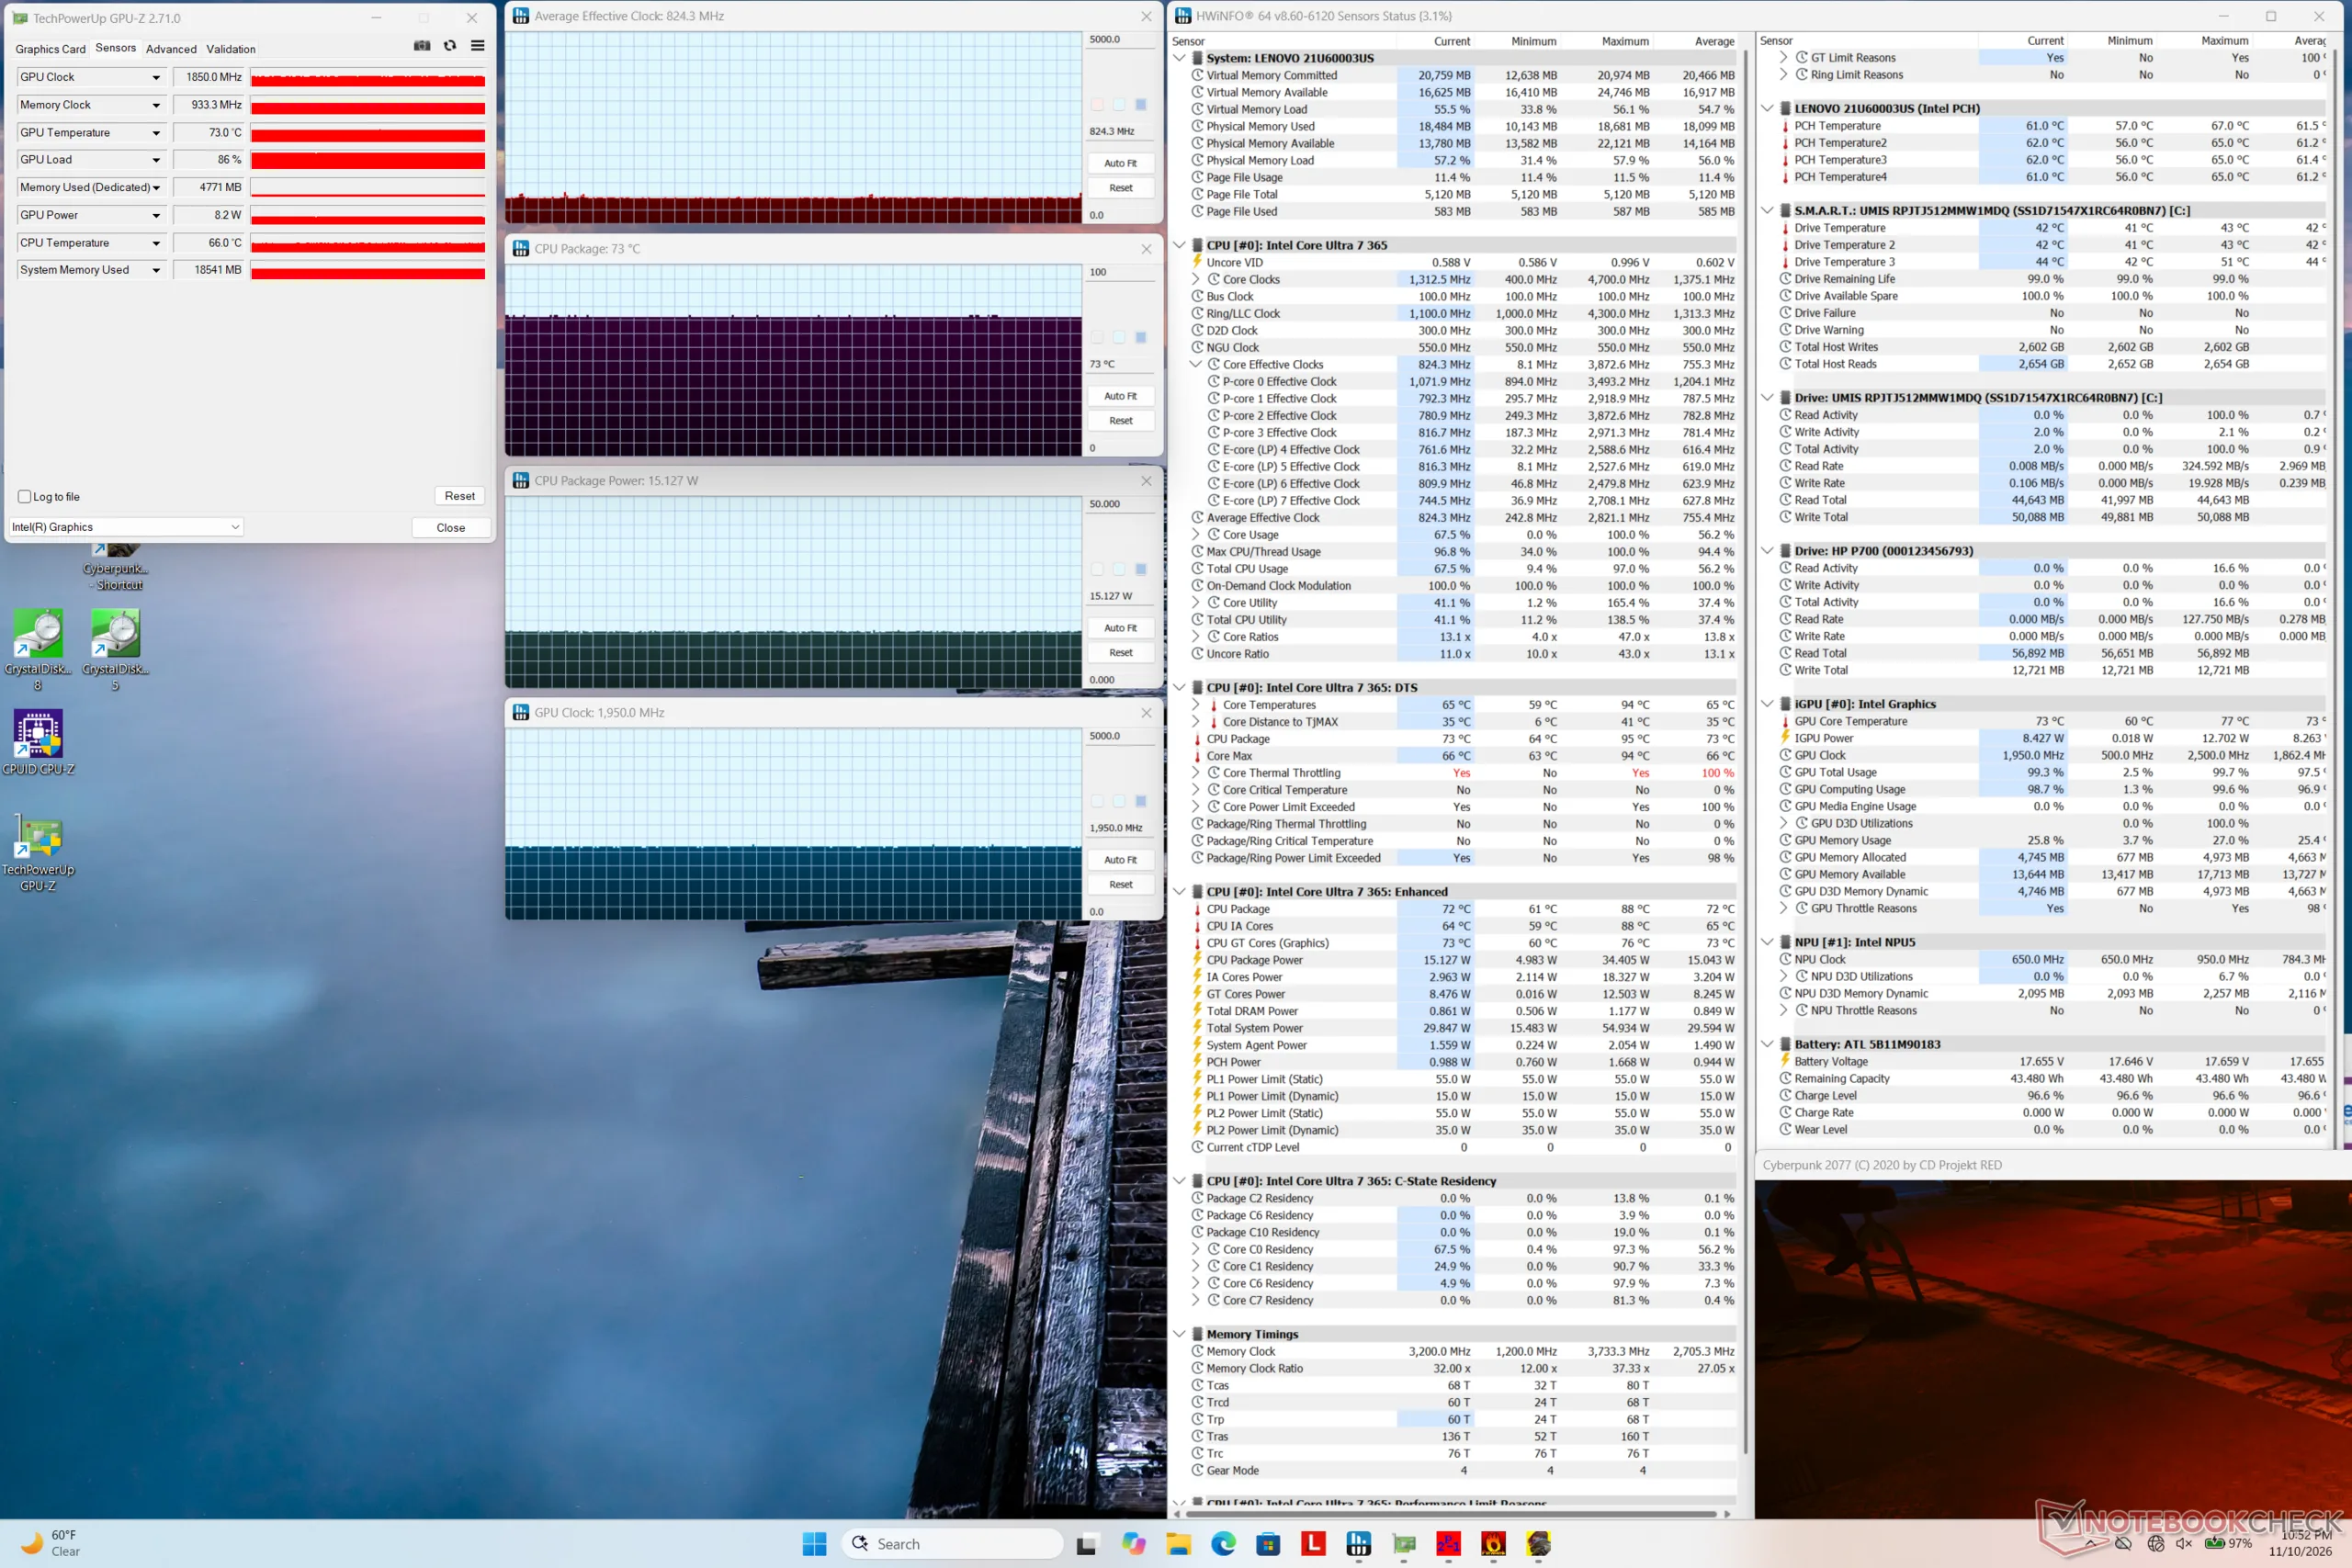
System idle
System idle
Cyberpunk 2077 stress
Prime95 stress
Prime95 stress
Prime95+FurMark stress
Average CPU Clock (GHz) GPU Clock (MHz) Average CPU Temperature (°C)
System Idle -- 450 48
Prime95 Stress 2.0 -- 73
Prime95 + FurMark Stress 1.3 1200 72
Cyberpunk 2077 Stress 0.8 1950 73

Speakers

Pink noise shows loud maximum volume but rather limited range in the high and low ends for
Pink noise shows loud maximum volume but rather limited range in the high and low ends for "tinny" audio quality
dB(A) 0102030405060708090Deep BassMiddle BassHigh BassLower RangeMidsHigher MidsLower HighsMid HighsUpper HighsSuper Highs2043.239.62533.433.53130.232.44026.525.2502729.56325.827.9803627.110026.929.612520.53516015.746.120015.151.725016.958.531517.963.74001464.150012.159.963011.565.880010.773.910009.876.312509.174.716009.773.120001068.6250010.369.5315010.875.5400011.174.1500011.371.4630011.566.8800011.762.21000011.859.61250011.553.81600011.143.8SPL23.984.1N0.557.5median 11.5median 64.1Delta2.39.426.325.821.422.12624.925.127.622.532.523.448.72655.818.860.922.167.2267019.372.317.674.217.774.319.575.31571.711.871.311.27410.574.21072.710.17210.67210.97511.374.811.671.71269.71269.612.371.112.669.61270.111.269.824.784.70.666.6median 12median 71.73.42.2hearing rangehide median Pink NoiseLenovo ThinkPad X13 Detachable Gen 1Apple MacBook Pro 16 2021 M1 Pro
Frequency diagram (checkboxes can be checked and unchecked to compare devices)
Lenovo ThinkPad X13 Detachable Gen 1 audio analysis

(+) | speakers can play relatively loud (84.1 dB)
Bass 100 - 315 Hz
(-) | nearly no bass - on average 16.7% lower than median
(±) | linearity of bass is average (11.6% delta to prev. frequency)
Mids 400 - 2000 Hz
(±) | higher mids - on average 6.5% higher than median
(+) | mids are linear (6.8% delta to prev. frequency)
Highs 2 - 16 kHz
(±) | higher highs - on average 6.2% higher than median
(+) | highs are linear (6.2% delta to prev. frequency)
Overall 100 - 16.000 Hz
(±) | linearity of overall sound is average (19.2% difference to median)
Compared to same class
» 47% of all tested devices in this class were better, 7% similar, 46% worse
» The best had a delta of 6%, average was 20%, worst was 57%
Compared to all devices tested
» 47% of all tested devices were better, 7% similar, 46% worse
» The best had a delta of 4%, average was 23%, worst was 136%

Apple MacBook Pro 16 2021 M1 Pro audio analysis

(+) | speakers can play relatively loud (84.7 dB)
Bass 100 - 315 Hz
(+) | good bass - only 3.8% away from median
(+) | bass is linear (5.2% delta to prev. frequency)
Mids 400 - 2000 Hz
(+) | balanced mids - only 1.3% away from median
(+) | mids are linear (2.1% delta to prev. frequency)
Highs 2 - 16 kHz
(+) | balanced highs - only 1.9% away from median
(+) | highs are linear (2.7% delta to prev. frequency)
Overall 100 - 16.000 Hz
(+) | overall sound is linear (4.6% difference to median)
Compared to same class
» 0% of all tested devices in this class were better, 0% similar, 100% worse
» The best had a delta of 5%, average was 17%, worst was 45%
Compared to all devices tested
» 0% of all tested devices were better, 0% similar, 100% worse
» The best had a delta of 4%, average was 23%, worst was 136%

Energy Management

Power Consumption
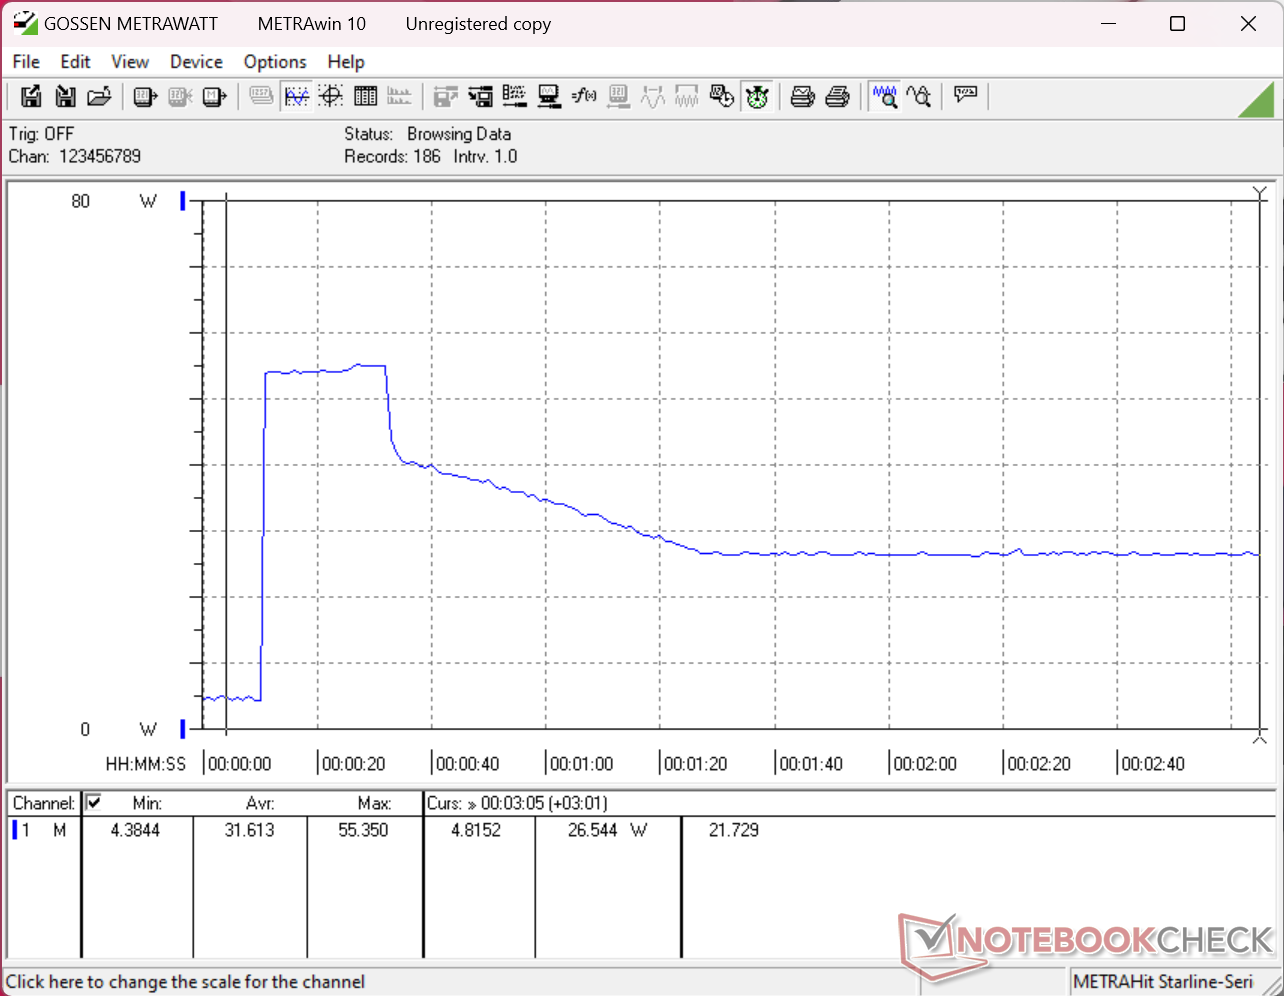
Consumption would spike to 55 W when initiating Prime95 stress before steadily falling and stabilizing at 27 W about a minute later to represent limited Turbo Boost sustainability
Consumption maxes out at 60 W from the small (~12.1 x 6.2 x 2.7 cm) USB-C AC adapter
Power Consumption
Off / Standbydarklight 0.24 / 0.65 Watt
Idledarkmidlight 3.1 / 6.5 / 6.7 Watt
Load midlight 44.1 / 60.4 Watt
 color bar
Key: min: dark, med: mid, max: light        Metrahit Energy
Lenovo ThinkPad X13 Detachable Gen 1
Ultra 7 365, Intel Graphics 4 Xe3 PTL, , IPS, 2880x1920, 13"
Lenovo ThinkPad X13 Gen 7 AMD
Ryzen AI 7 PRO 450, Radeon 860M, Micron 2650 MTFDKBA512TGW, IPS, 1920x1200, 13.3"
Dell Pro 7 13 2-in-1
Ultra 7 366H, Intel Graphics 4 Xe3 PTL, SK hynix PCB01 HFS001TFM9X186N, IPS, 1920x1200, 13.3"
Dell Pro 13 Premium PA13250
Core Ultra 7 268V, Arc 140V, Micron 2550 1TB, IPS, 1920x1200, 13.3"
MSI Prestige 13 AI+ A3MG
Ultra 9 386H, Intel Graphics 4 Xe3 PTL, Micron 2500 1TB MTFDKBA1T0QGN, OLED, 2880x1800, 13.3"
HP EliteBook 8 Flip G1i 13
Ultra 7 265U, Graphics 4-Core iGPU (Arrow Lake), Samsung PM9A1 MZVL2512HCJQ, IPS, 1920x1200, 13.3"
Power Consumption
-13%
-27%
9%
2%
-1%
Idle Minimum * (Watt)
3.1
4.1
-32%
2.4
23%
2
35%
3.5
-13%
2.8
10%
Idle Average * (Watt)
6.5
7.3
-12%
7.4
-14%
4.3
34%
4
38%
5.3
18%
Idle Maximum * (Watt)
6.7
7.5
-12%
8.8
-31%
4.75
29%
6.4
4%
5.6
16%
Load Average * (Watt)
44.1
44.9
-2%
50
-13%
40
9%
44
-0%
39.8
10%
Cyberpunk 2077 ultra * (Watt)
31.4
52
-66%
36.4
-16%
41
-31%
40.2
-28%
Cyberpunk 2077 ultra external monitor * (Watt)
28.3
49.8
-76%
38
-34%
34.7
-23%
Load Maximum * (Watt)
60.4
65.4
-8%
67.9
-12%
57
6%
54
11%
68.4
-13%

* ... smaller is better

Power Consumption Cyberpunk / Stress Test

05101520253035404550556065Tooltip
Lenovo ThinkPad X13 Detachable Gen 1 Ultra 7 365, Intel Graphics 4 Xe3 PTL; 1280x720 Prime95 28.10 and Furmark 1.25: Ø33.7 (29.7-60.4) Watt
Dell Pro 7 13 2-in-1 Ultra 7 366H, Intel Graphics 4 Xe3 PTL; 1280x720 Prime95 28.10 and Furmark 1.25: Ø50.9 (39.6-67.9) Watt
Lenovo ThinkPad X13 Detachable Gen 1 Ultra 7 365, Intel Graphics 4 Xe3 PTL; Idle 150cd/m2: Ø3.96 (3.71-4.59) Watt
Dell Pro 7 13 2-in-1 Ultra 7 366H, Intel Graphics 4 Xe3 PTL; Idle 150cd/m2: Ø3.28 (2.89-5.46) Watt
Lenovo ThinkPad X13 Detachable Gen 1 Ultra 7 365, Intel Graphics 4 Xe3 PTL; Cyberpunk 2077 FHD ultra no FSR 150cd: Ø31.4 (30.6-32.2) Watt
Dell Pro 7 13 2-in-1 Ultra 7 366H, Intel Graphics 4 Xe3 PTL; Cyberpunk 2077 FHD ultra no FSR 150cd: Ø52 (49.5-57.9) Watt

Power Consumption external Monitor

05101520253035404550556065Tooltip
Lenovo ThinkPad X13 Detachable Gen 1 Ultra 7 365, Intel Graphics 4 Xe3 PTL; Prime95 V2810 Stress (external Monitor): Ø32.6 (26.2-55.4) Watt
Dell Pro 7 13 2-in-1 Ultra 7 366H, Intel Graphics 4 Xe3 PTL; Prime95 V2810 Stress (external Monitor): Ø48.5 (44-67.8) Watt
Lenovo ThinkPad X13 Detachable Gen 1 Ultra 7 365, Intel Graphics 4 Xe3 PTL; Cinebench R23 Multi (external Monitor): Ø28.4 (24.3-52.3) Watt
Dell Pro 7 13 2-in-1 Ultra 7 366H, Intel Graphics 4 Xe3 PTL; Cinebench R23 Multi (external Monitor): Ø52.2 (41.6-67.9) Watt
Lenovo ThinkPad X13 Detachable Gen 1 Ultra 7 365, Intel Graphics 4 Xe3 PTL; 1280x720 FurMark 1.19 GPU Stress Test (external Monitor): Ø30.3 (18.8-51.1) Watt
Dell Pro 7 13 2-in-1 Ultra 7 366H, Intel Graphics 4 Xe3 PTL; 1280x720 FurMark 1.19 GPU Stress Test (external Monitor): Ø48.4 (47.1-53.2) Watt
Lenovo ThinkPad X13 Detachable Gen 1 Ultra 7 365, Intel Graphics 4 Xe3 PTL; Idle 1min (external Monitor): Ø3.13 (2.89-4.07) Watt
Dell Pro 7 13 2-in-1 Ultra 7 366H, Intel Graphics 4 Xe3 PTL; Idle 1min (external Monitor): Ø2.32 (2.02-3.87) Watt
Lenovo ThinkPad X13 Detachable Gen 1 Ultra 7 365, Intel Graphics 4 Xe3 PTL; Cyberpunk 2077 FHD ultra no FSR (external Monitor): Ø28.3 (27.7-30.2) Watt
Dell Pro 7 13 2-in-1 Ultra 7 366H, Intel Graphics 4 Xe3 PTL; Cyberpunk 2077 FHD ultra no FSR (external Monitor): Ø49.8 (45.3-58) Watt

Battery Life

Battery Runtime
WiFi Websurfing
10h 06min
Lenovo ThinkPad X13 Detachable Gen 1
Ultra 7 365, Intel Graphics 4 Xe3 PTL, 45 Wh
Lenovo ThinkPad X13 Gen 7 AMD
Ryzen AI 7 PRO 450, Radeon 860M, 54.7 Wh
Dell Pro 7 13 2-in-1
Ultra 7 366H, Intel Graphics 4 Xe3 PTL, 56 Wh
Dell Pro 13 Premium PA13250
Core Ultra 7 268V, Arc 140V, 60 Wh
MSI Prestige 13 AI+ A3MG
Ultra 9 386H, Intel Graphics 4 Xe3 PTL, 53.8 Wh
HP EliteBook 8 Flip G1i 13
Ultra 7 265U, Graphics 4-Core iGPU (Arrow Lake), 62 Wh
Battery runtime
62%
31%
138%
19%
36%
WiFi v1.3 (h)
10.1
16.4
62%
13.2
31%
24
138%
12
19%
13.7
36%
H.264 (h)
23.8
Load (h)
2.8

Notebookcheck Rating

A no-frills business detachable that prioritizes display quality, keyboard comfort, and ease-of-use over fancy features or gimmicks.

Lenovo ThinkPad X13 Detachable Gen 1 - 11/17/2026 v8
Allen Ngo

Chassis
88 / 98 → 90%
Keyboard
88%
Pointing Device
92%
Connectivity
74 / 74 → 100%
Weight
78 / 20-75 → 100%
Battery
88%
Display
85%
Games Performance
39 / 65 → 60%
Application Performance
79 / 92 → 86%
AI Performance
90%
Temperature
92%
Noise
94%
Audio
69 / 91 → 75%
Camera
50 / 75 → 66%
Average
70%
89%
Convertible - Weighted Average
CO2 Emissions
No Data
Materials
50%
Packaging
100%
Power Use
87%
Repairability
50%
Software Updates
22.3%
Recycle Logo Total Sustainability Score: 51.6%

Potential Competitors in Comparison

Image
Model / Review
Price
Weight
Height
Display
1.
89.4%
Lenovo ThinkPad X13 Detachable Gen 1
Intel Core Ultra 7 365 ⎘
Intel Graphics 4 Xe3 Panther Lake iGPU ⎘
32 GB Memory
List Price: 3150 USD827 g9.3 mm13.00"
2880x1920
266 PPI
IPS
2.
87.4%
Lenovo ThinkPad X13 Gen 7 AMD
AMD Ryzen AI 7 PRO 450 ⎘
AMD Radeon 860M ⎘
32 GB Memory, 512 GB SSD
Amazon:
1. $1,269.99
Lenovo ThinkPad X13 Gen 7 21...
2. $1,395.95
Lenovo ThinkPad E14 Gen 7 AM...
3. $1,019.99
Lenovo ThinkPad E14 Gen 7 14...
List Price: 2900€
1.1 kg13 mm13.30"
1920x1200
170 PPI
IPS
3.
86.7%
Dell Pro 7 13 2-in-1
Intel Core Ultra 7 366H ⎘
Intel Graphics 4 Xe3 Panther Lake iGPU ⎘
64 GB Memory,  SSD
List Price: 4900 USD1.4 kg17.95 mm13.30"
1920x1200
170 PPI
IPS
4.
90%
Dell Pro 13 Premium PA13250
Intel Core Ultra 7 268V ⎘
Intel Arc Graphics 140V ⎘
32 GB Memory, 1024 GB SSD
List Price: 2700 Euro1.1 kg17.2 mm13.30"
1920x1200
170 PPI
IPS
5.
84%
MSI Prestige 13 AI+ A3MG
Intel Core Ultra 9 386H ⎘
Intel Graphics 4 Xe3 Panther Lake iGPU ⎘
32 GB Memory, 1024 GB SSD
List Price: 1600 EUR888 g15.9 mm13.30"
2880x1800
255 PPI
OLED
6.
87.7%
HP EliteBook 8 Flip G1i 13
Intel Core Ultra 7 265U ⎘
Intel Graphics 4-Core iGPU (Meteor / Arrow Lake) ⎘
16 GB Memory, 512 GB SSD
List Price: 3600 USD1.4 kg15.5 mm13.30"
1920x1200
170 PPI
IPS

Transparency

The selection of devices to be reviewed is made by our editorial team. The test sample was provided to the author as a loan by the manufacturer or retailer for the purpose of this review. The lender had no influence on this review, nor did the manufacturer receive a copy of this review before publication. There was no obligation to publish this review. As an independent media company, Notebookcheck is not subjected to the authority of manufacturers, retailers or publishers.

This is how Notebookcheck is testing

Every year, Notebookcheck independently reviews hundreds of laptops and smartphones using standardized procedures to ensure that all results are comparable. We have continuously developed our test methods for around 20 years and set industry standards in the process. In our test labs, high-quality measuring equipment is utilized by experienced technicians and editors. These tests involve a multi-stage validation process. Our complex rating system is based on hundreds of well-founded measurements and benchmarks, which maintains objectivity. Further information on our test methods can be found here.

Google LogoAdd as a preferred source on Google
Mail Logo
Could not open connection to Notebookchat
static version load dynamic
Loading Comments
> Expert reviews and news on laptops, smartphones and tech innovations > Reviews > Lenovo ThinkPad X13 Detachable Gen 1 review: Extraordinary in its ordinary
Allen Ngo, 2026-11-17 (Update: 2026-11-17)