


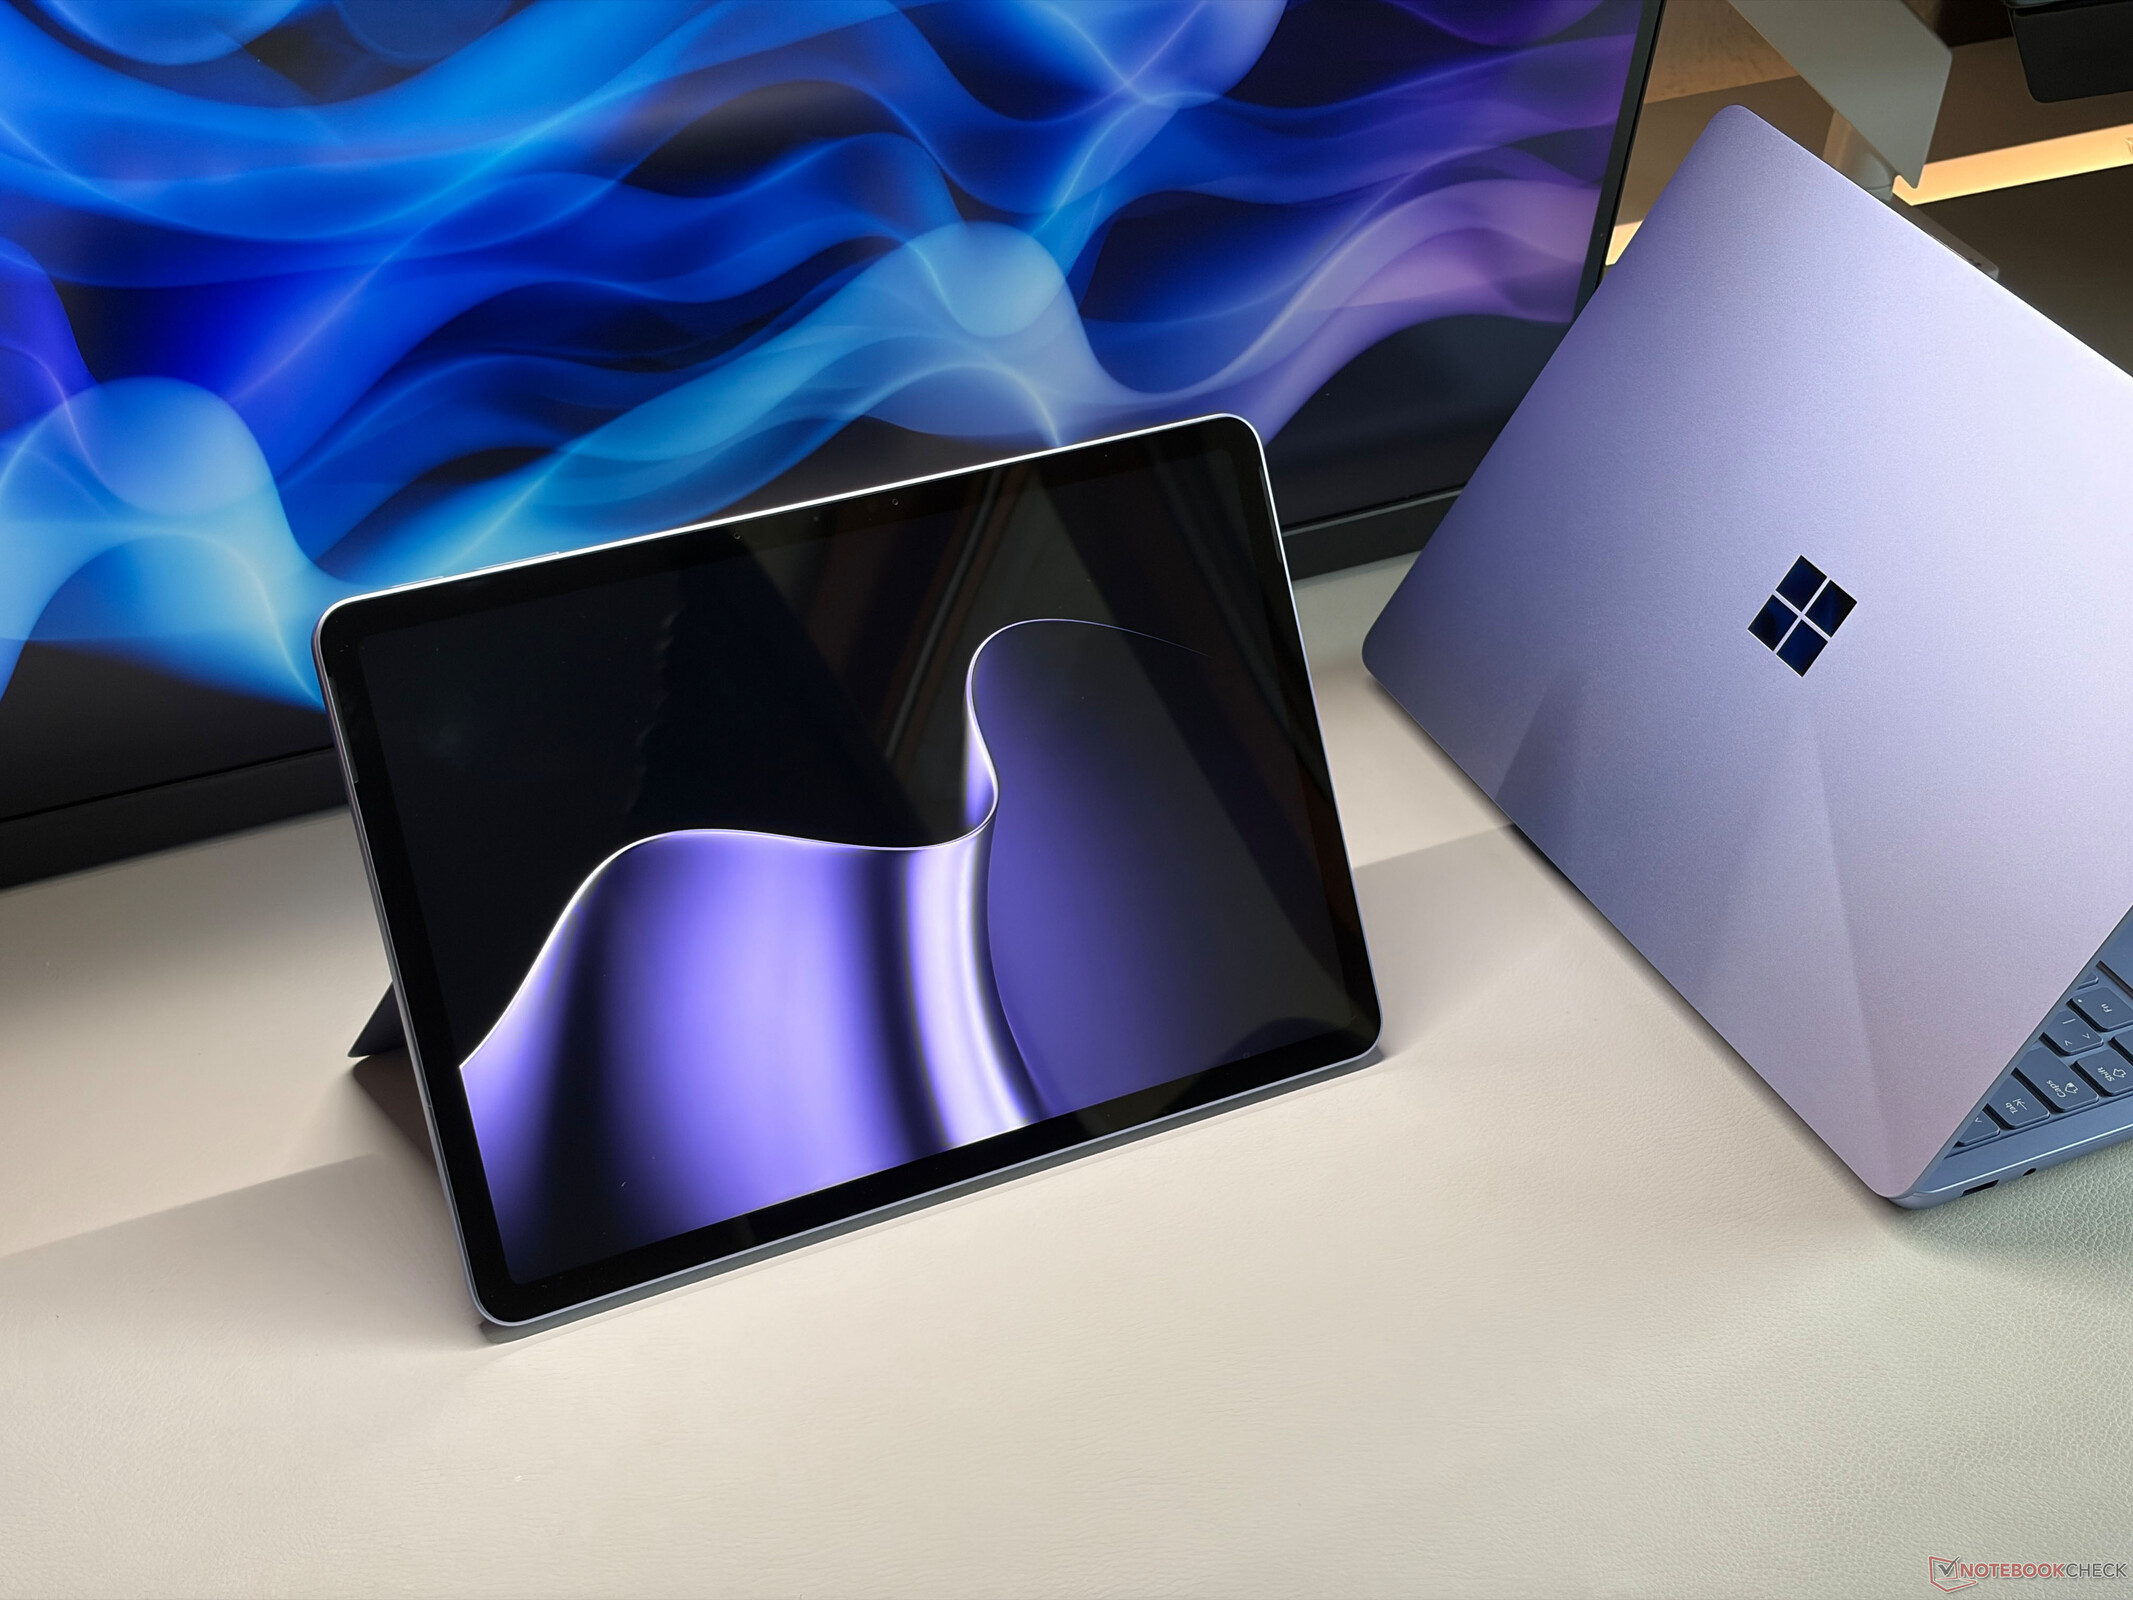
Verdict - More single-core performance, screen downgrade
The new Microsoft Surface Pro 12 2026 is a bit of a mixed bag. Microsoft keeps the familiar design, which means there are once again no maintenance options, but the small convertible is pretty light (under 700 grams) and offers sufficient performance for everyday tasks, despite the passive cooling solution. The new Snapdragon X2 Plus SoC with 6 cores offers better single-core and graphics performance, but slower multi-core performance compared to the previous Snapdragon X1 Plus with 8 CPU cores. It is still a good showcase for a fanless device and the big advantage over Android tablets is the versatility of Windows. It is a great companion on the road (even though there is no 5G connectivity) and you can simply use it as a regular Windows PC at home connected to a large screen with USB-C power delivery, for example.
The biggest drawback is the new screen. While the specs of the 90 Hz IPS touchscreen with 2196 x 1464 pixels did not change, it is actually supplied by Sharp instead of BOE and our analysis reveals some differences. The new Sharp panel manages a slightly higher brightness, but suffers from a higher black value, which reduces the maximum contrast ratio significantly. The response times are also a bit slower and ghosting is visible, even in 90 Hz mode. The new screen also seems to affect the battery runtime slightly, even though up to 14 hours in our Wi-Fi test at 150 nits and 8 hours at maximum brightness is still a good result.
All in all, the new Surface Pro 12 is still unrivaled if you want a fanless Windows device right now, but the new screen is a small downgrade and the old model might be the better choice as long as it is still available.
Pros
Cons

Specifications
Case, Connectivity and Input Devices
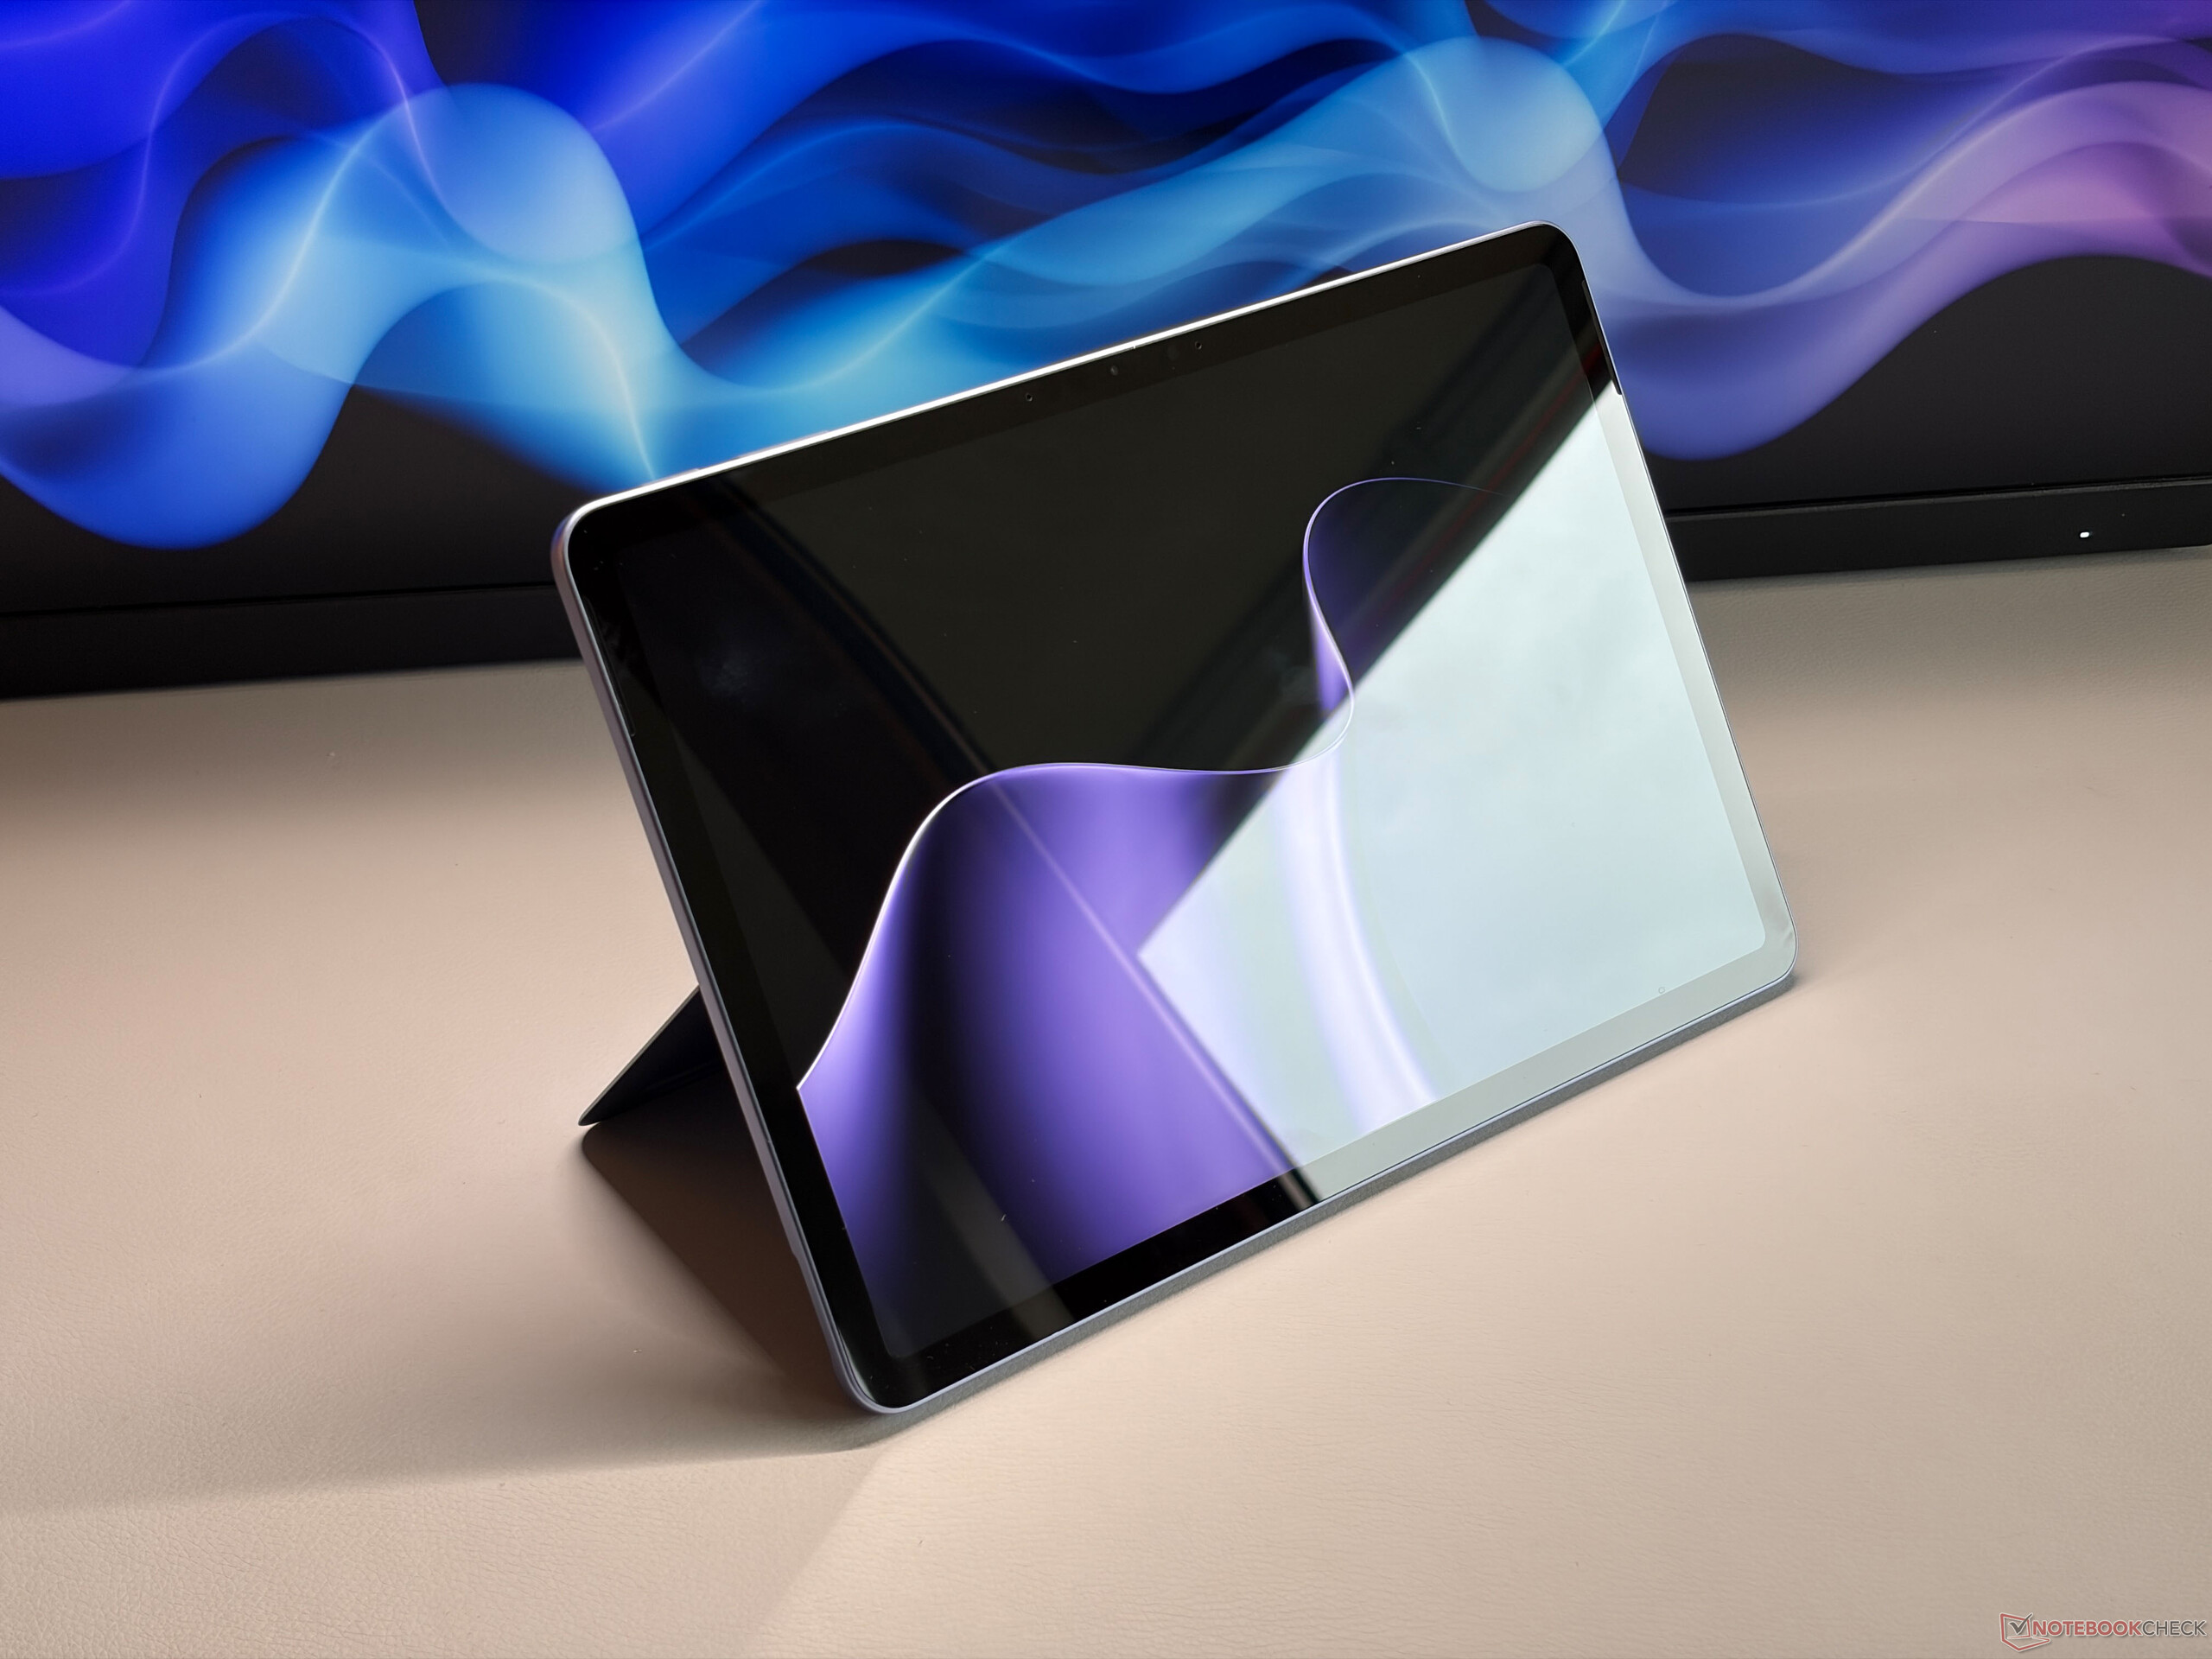
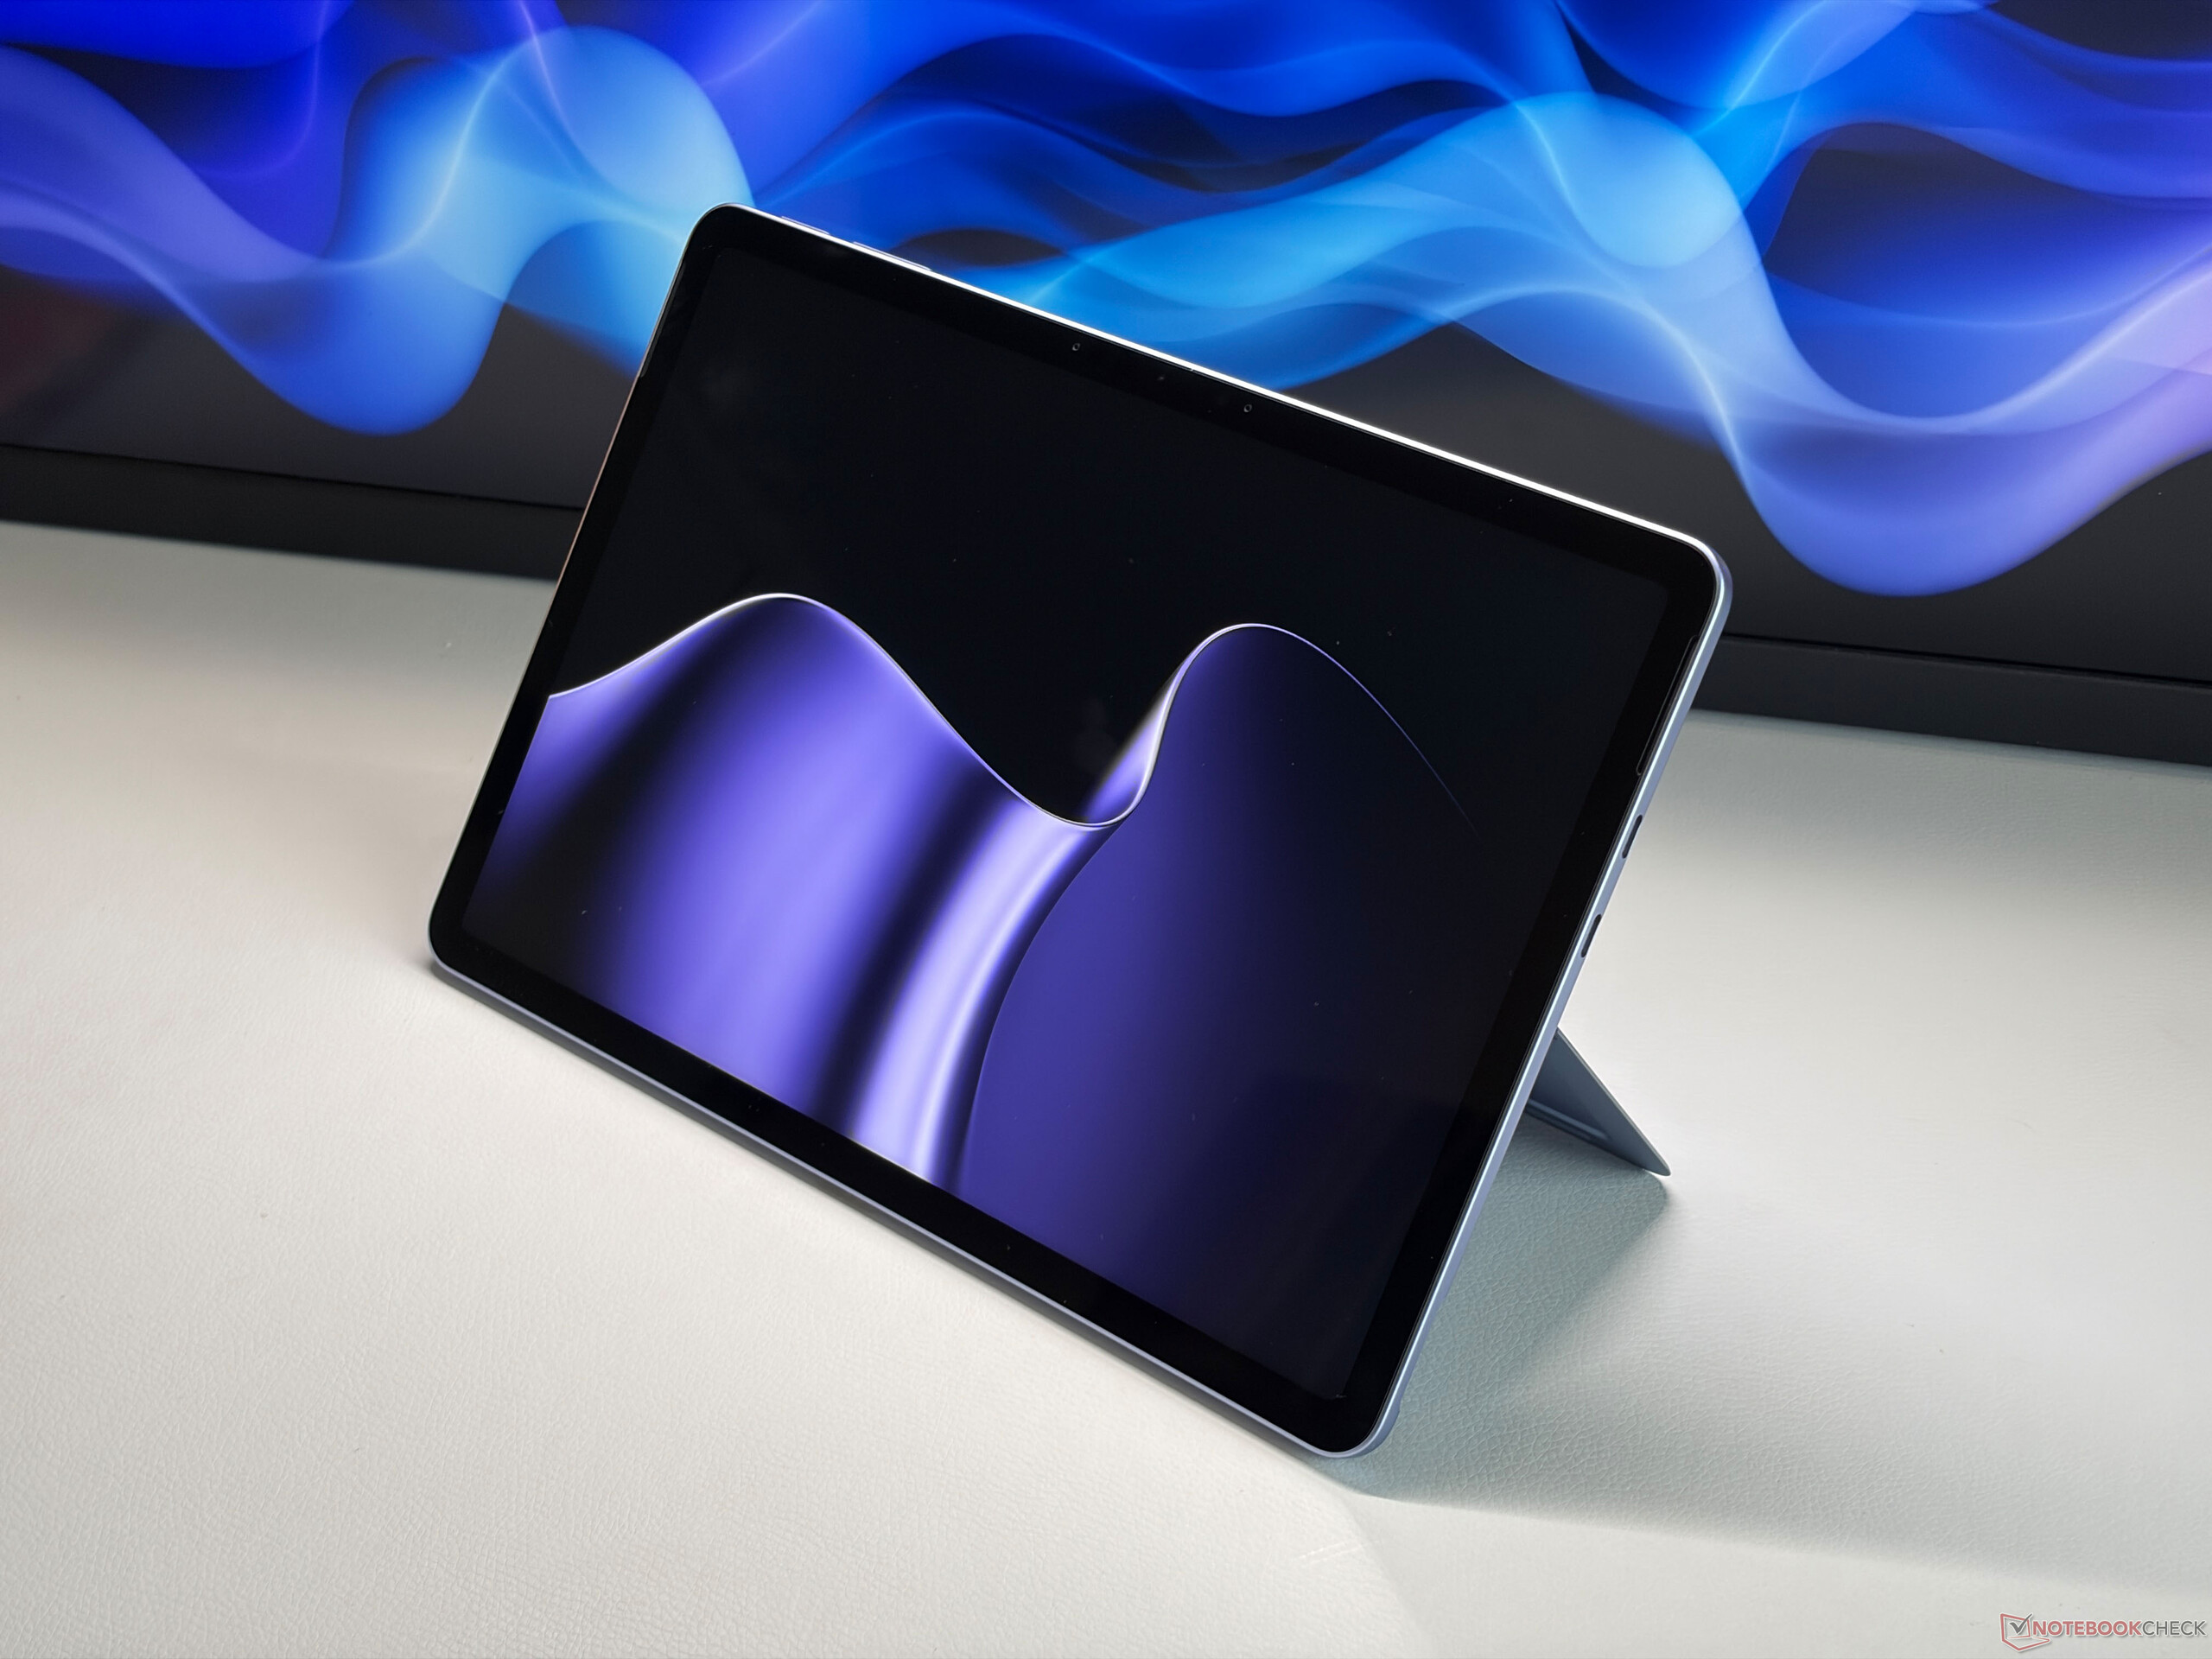
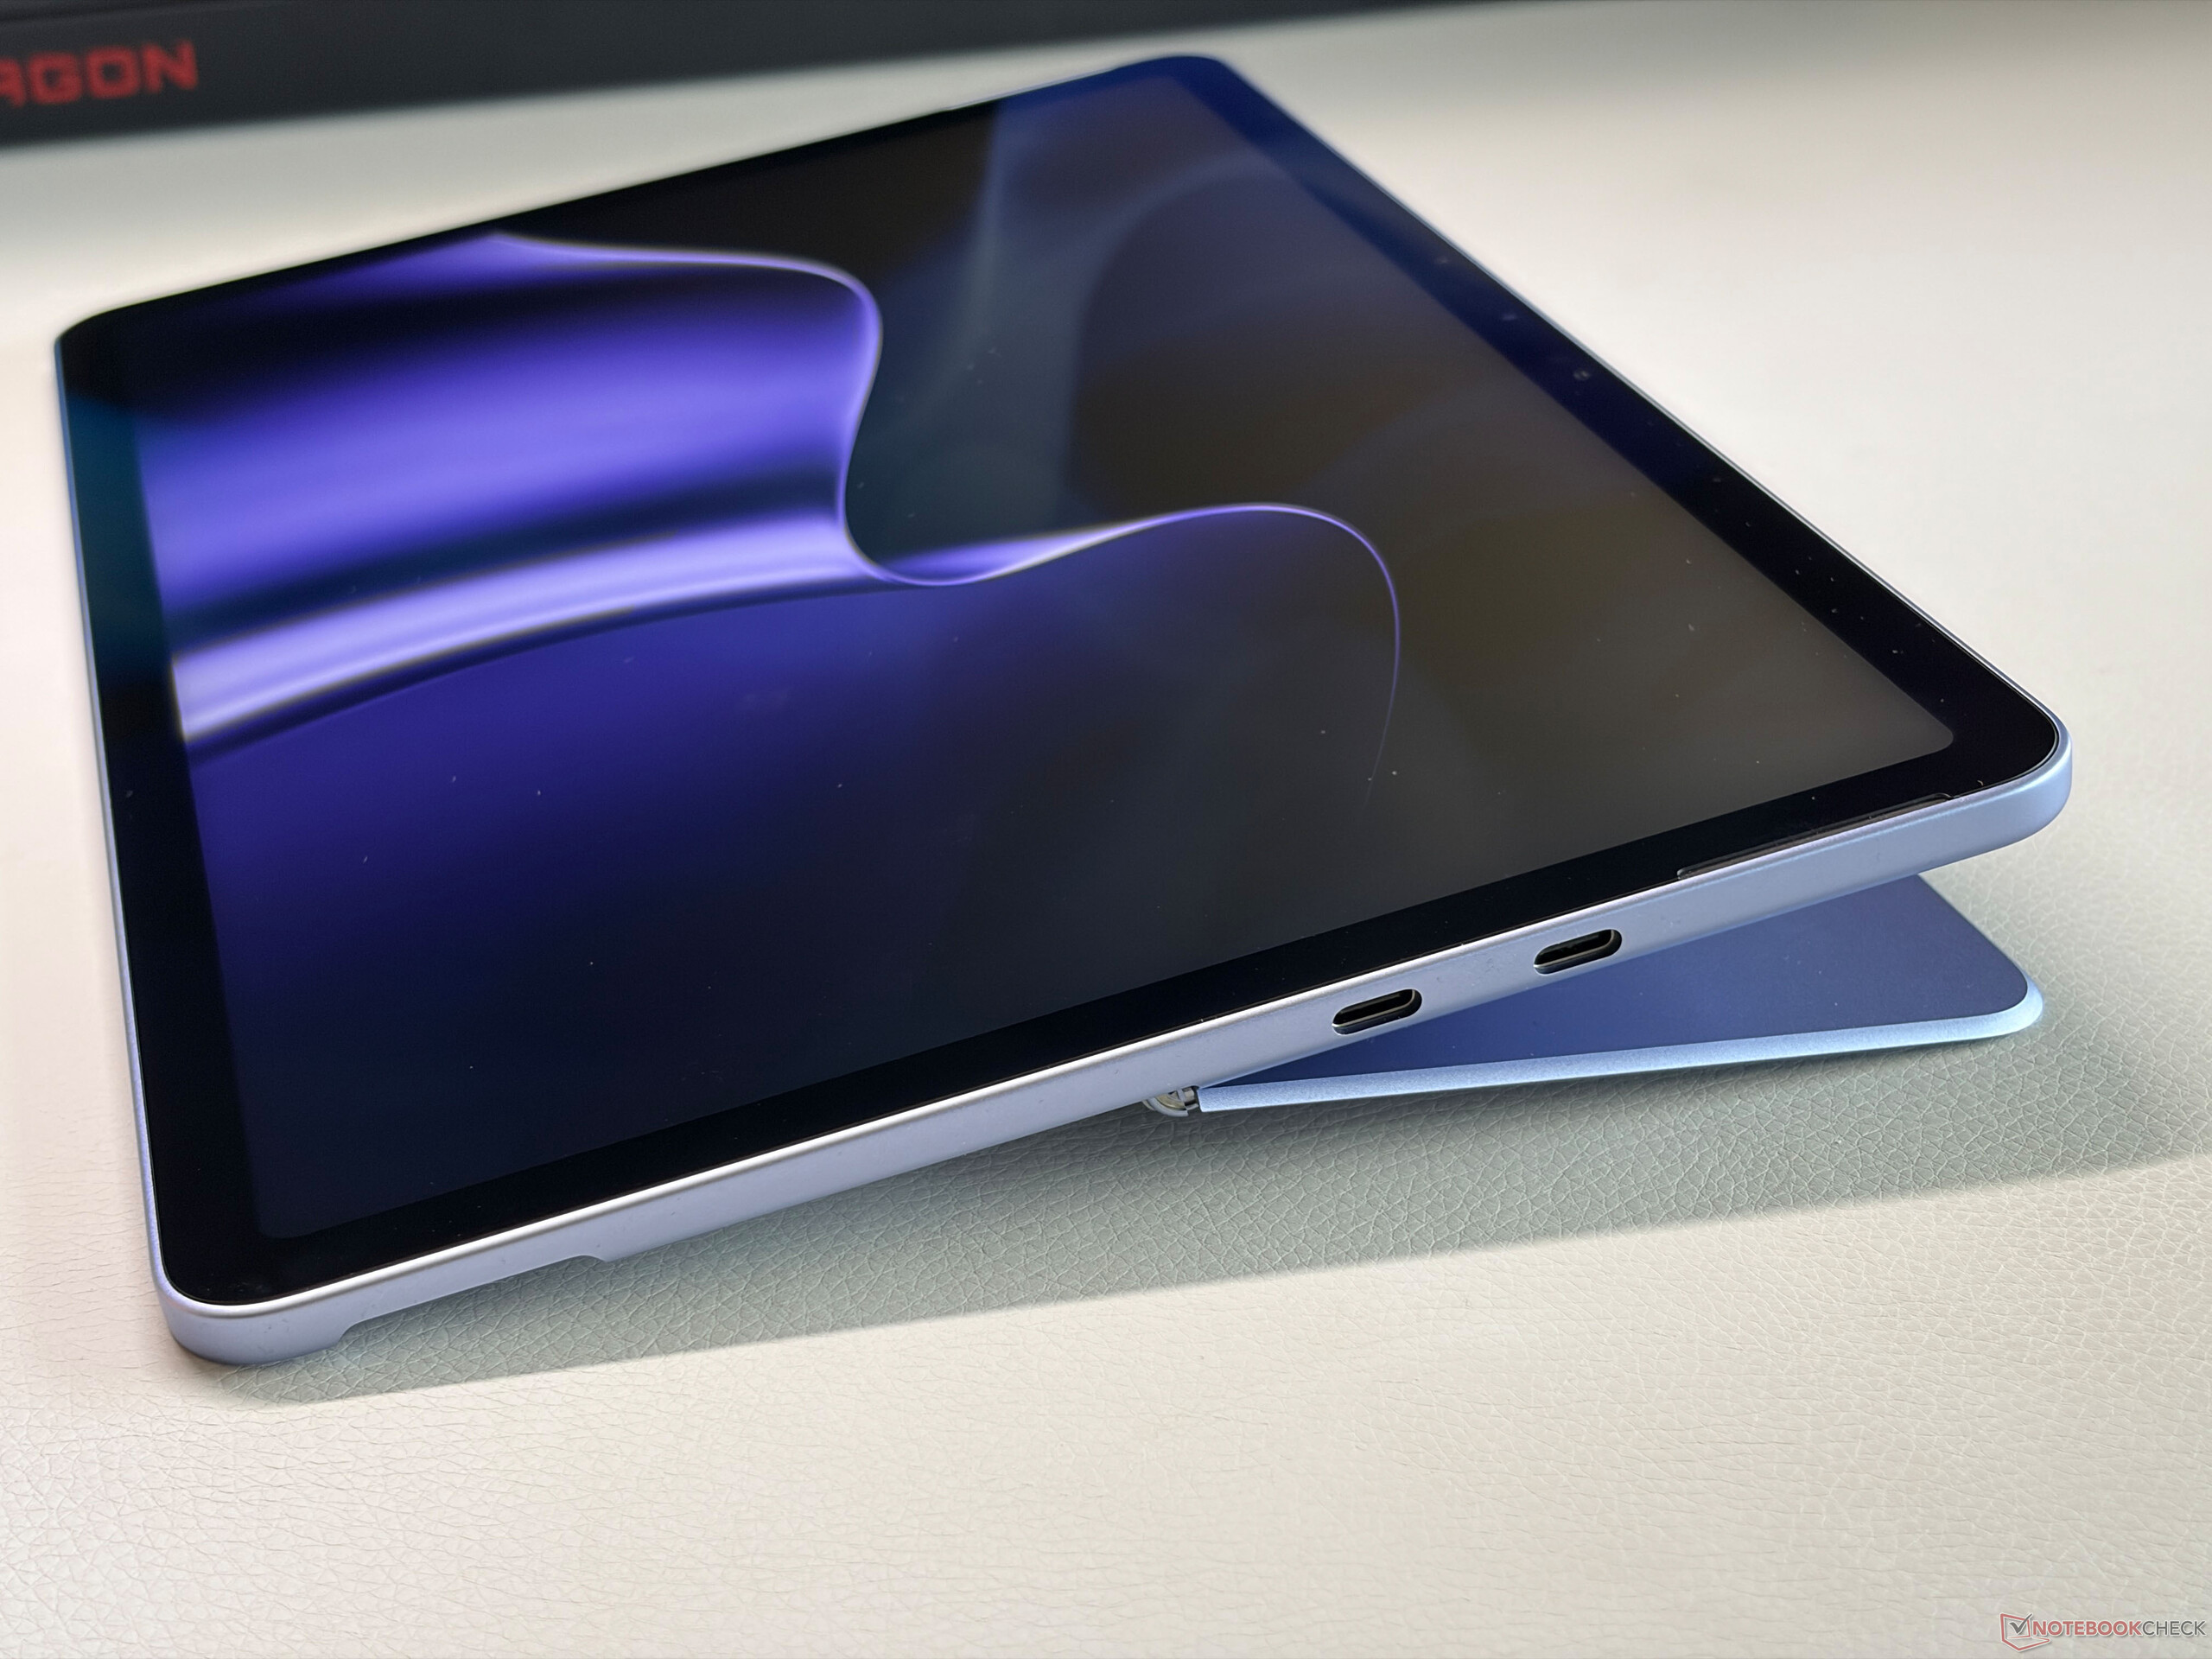
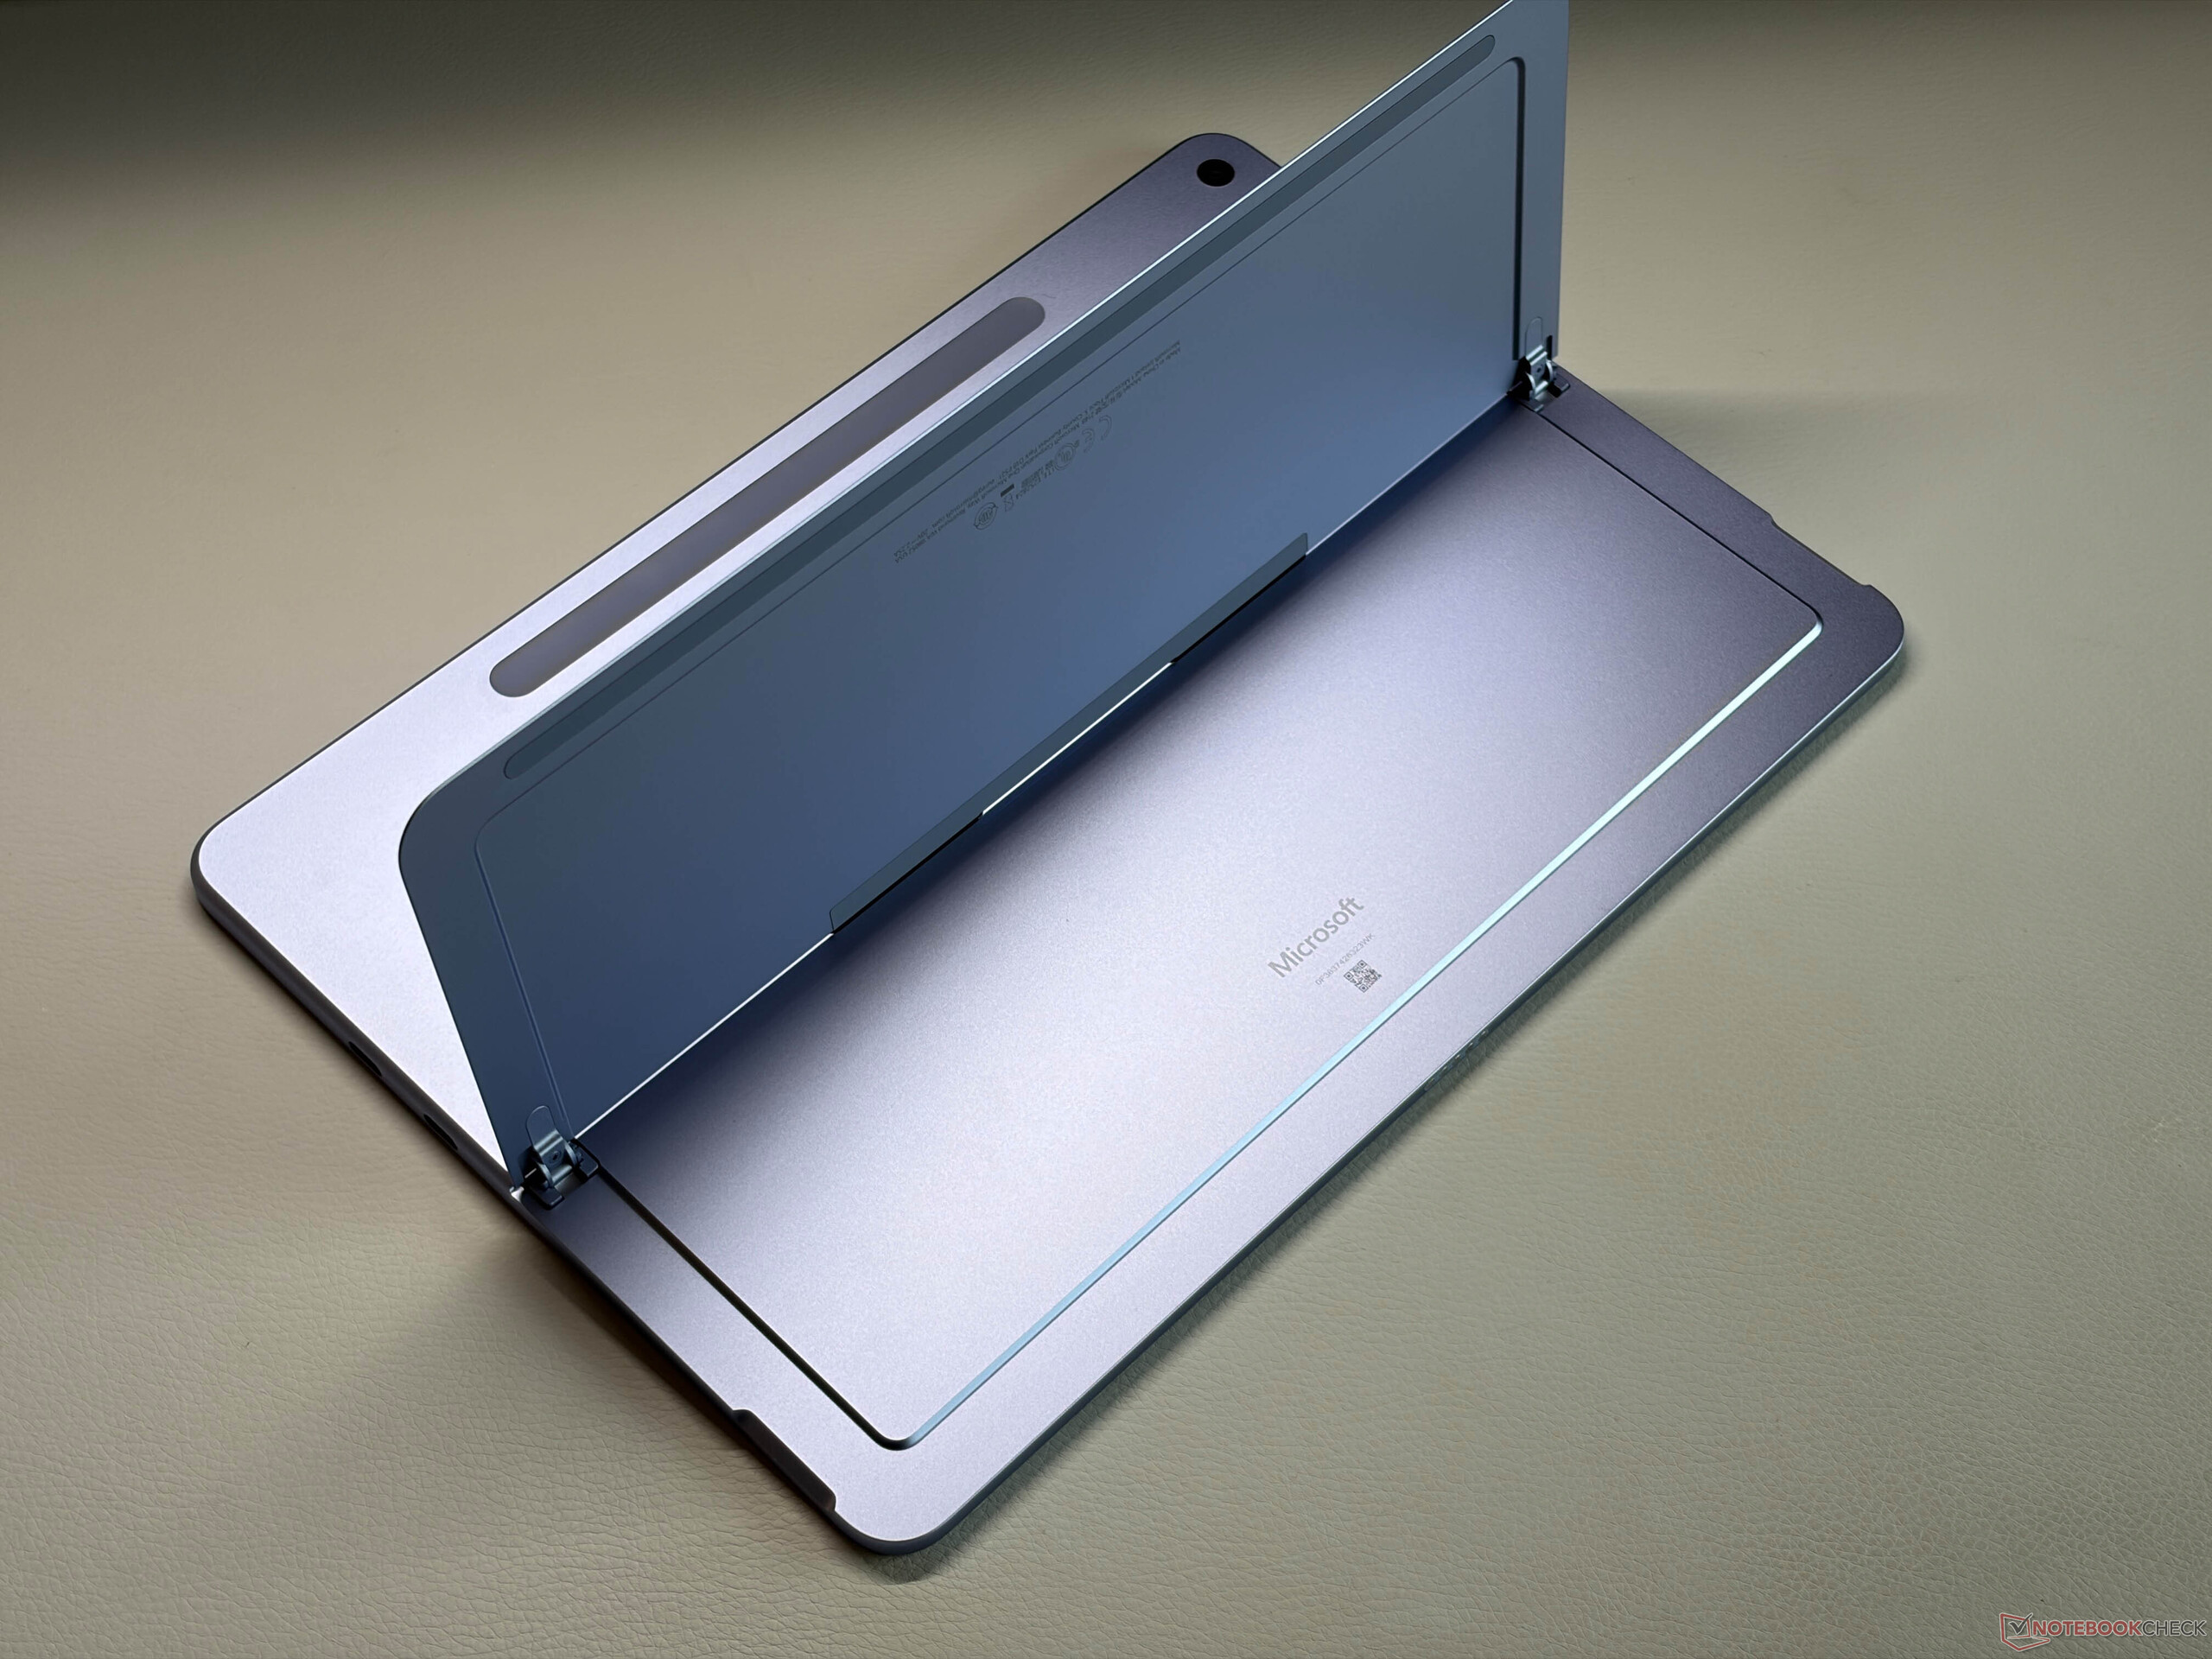
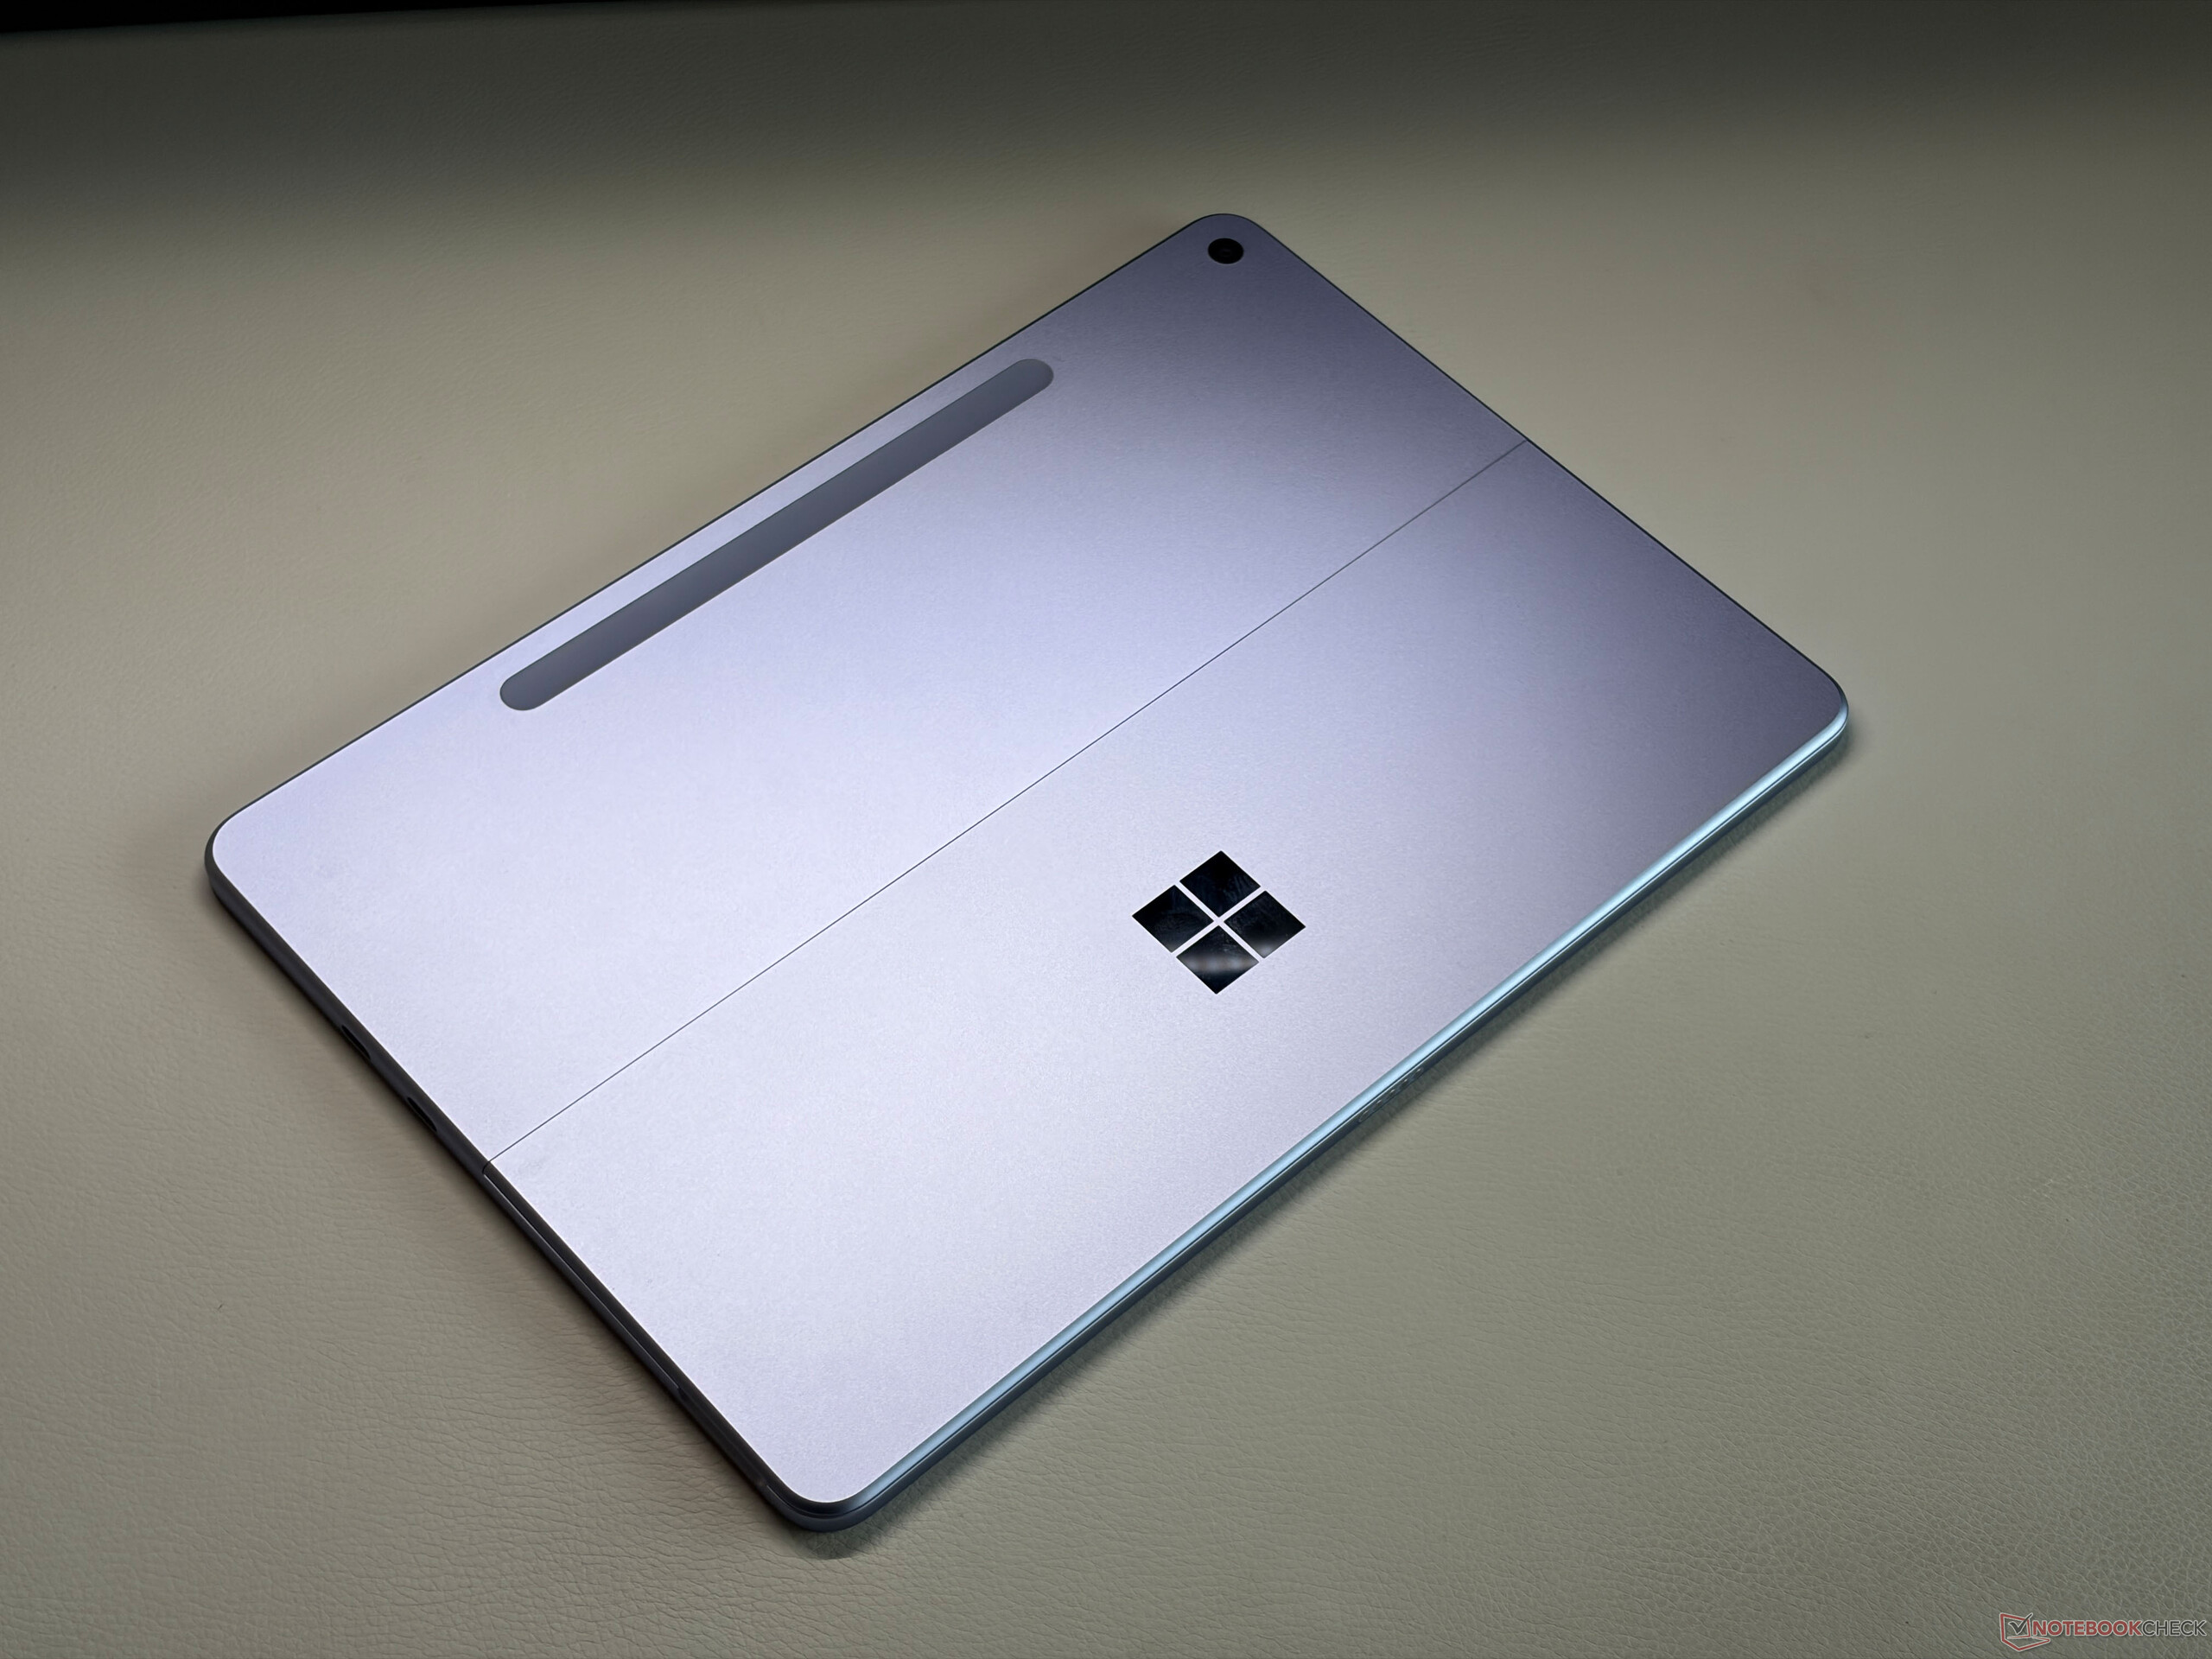
The Surface Pro 12 is still a very lightweight and compact convertible with a built-in kickstand and the construction is identical to last year's model. Build quality is excellent and the stability is very good as well, only the kickstand is pretty thin and bends quite easily. It offers plenty of adjustment for the opening angle (up to 165 degrees) though and works well in practice. Unlike the larger Surface Pro 13, the Surface Pro 12 does not offer any maintenance hatches for the SSD. There is a magnetic holder for the optional Surface Pen and you once again get the connector for optional keyboard covers at the bottom edge.
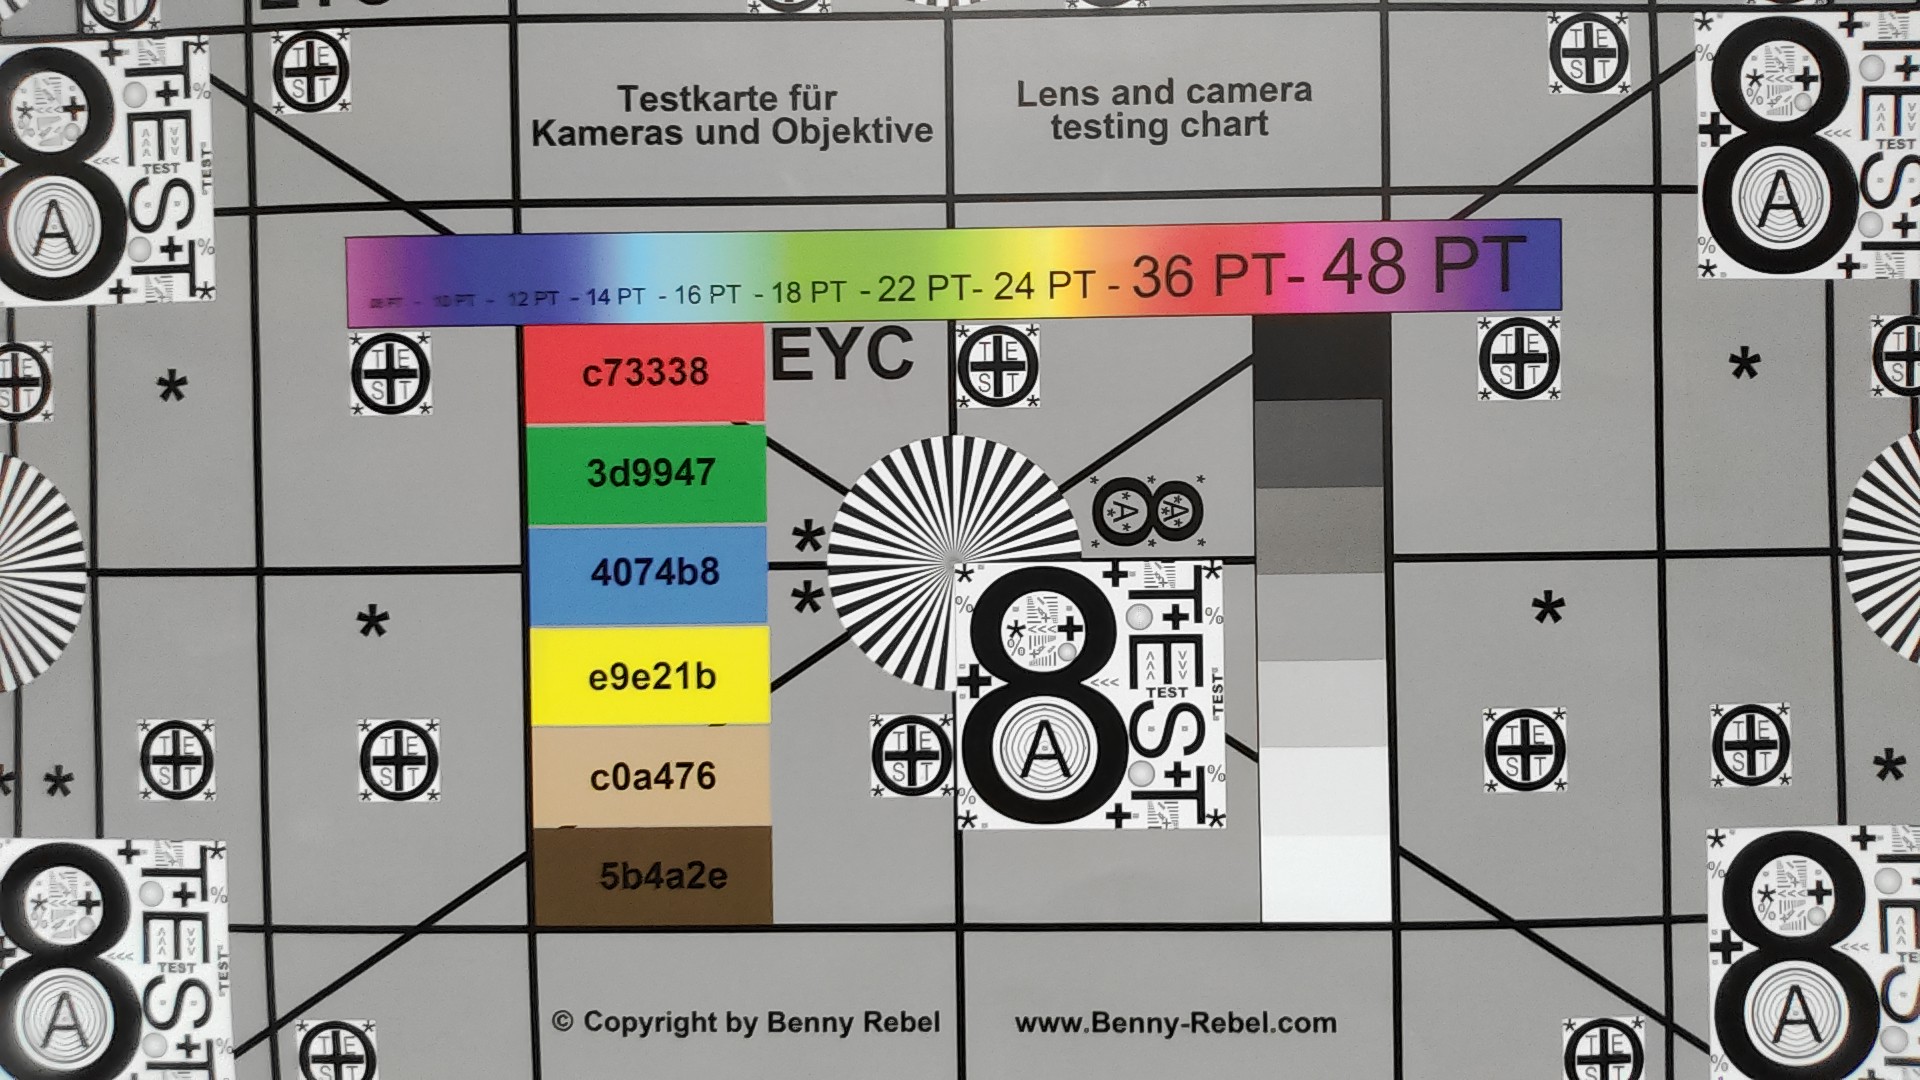
Connectivity is okay with two USB-C ports, but they do not support USB 4.0. The ports still support power delivery as well as DisplayPort, and we had no issues running a 4K screen at 144 Hz. You also get a Wi-Fi 7 module with high and stable transfer rates, but no 5G connectivity options. The 1080p front camera with Windows Hello support takes decent images and you also get a 10 MP camera at the rear.



| Networking | |
| Microsoft Surface Pro 12 2026 | |
| iperf3 transmit Wi-Fi6/7 RT-BE96U | |
| iperf3 receive Wi-Fi6/7 RT-BE96U | |
| Microsoft Surface Pro 12 | |
| iperf3 transmit AXE11000 | |
| iperf3 receive AXE11000 | |
| Microsoft Surface Pro 13 OLED | |
| iperf3 transmit Wi-Fi6/7 RT-BE96U | |
| iperf3 receive Wi-Fi6/7 RT-BE96U | |
| Ninkear S13, 16+1TB | |
| iperf3 transmit AXE11000 | |
| iperf3 receive AXE11000 | |
| Alldocube iWork GT Ultra | |
| iperf3 transmit AXE11000 | |
| iperf3 receive AXE11000 | |




Display - 90 Hz IPS touchscreen
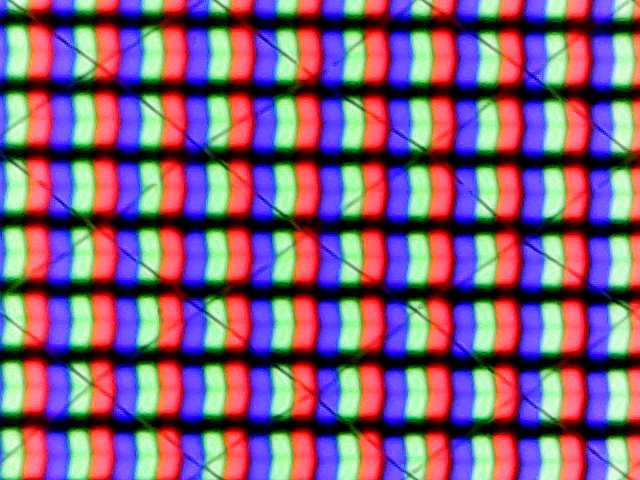

The specs of the 12-inch IPS touchscreen did not change compared to the previous model, so you still get the resolution of 2196 x 1464 pixels and a frequency of 90 Hz. However, the panel itself has a different ID (now from Sharp instead of BOE) and the response times are a bit slower. We also noticed visible ghosting, even in 90 Hz mode. Otherwise, the subjective image quality is good, but the touchscreen is once again very reflective. We did not detect any PWM flickering.
Our analysis with the professional CalMAN software reveals very accurate results for the grayscale as well as the colors with full sRGB color gamut, so picture editing is no problem. The brightness is slightly higher than before (511 nits on average), but the black level is a bit increased at 0.44, so the contrast ratio is much lower than before at just ~1200:1.
| |||||||||||||||||||||||||
Brightness Distribution: 89 %
Center on Battery: 537 cd/m²
Contrast: 1220:1 (Black: 0.44 cd/m²)
ΔE ColorChecker Calman: 0.7 | ∀{0.5-29.43 Ø4.68}
ΔE Greyscale Calman: 1.2 | ∀{0.09-98 Ø4.93}
72.4% AdobeRGB 1998 (Argyll 3D)
97.7% sRGB (Argyll 3D)
72% Display P3 (Argyll 3D)
Gamma: 2.13
CCT: 6614 K
| Microsoft Surface Pro 12 2026 LQ120P1JX51, IPS, 2196x1464, 12", 90 Hz | Microsoft Surface Pro 12 NE120DRM-N28, IPS, 2196x1464, 12", 90 Hz | Microsoft Surface Pro 13 OLED ATNA30DW05-0, OLED, 2880x1920, 13", 120 Hz | Ninkear S13, 16+1TB LTM0001, IPS, 2560x1600, 13", 60 Hz | Alldocube iWork GT Ultra LTM0001, IPS, 2560x1600, 13", 60 Hz | |
|---|---|---|---|---|---|
| Display | 1% | 20% | -27% | -30% | |
| HDR Peak Brightness (cd/m²) | 930 | ||||
| Display P3 Coverage (%) | 72 | 72.7 1% | 98.8 37% | 51.2 -29% | 48.7 -32% |
| sRGB Coverage (%) | 97.7 | 98.1 0% | 98.8 1% | 72.4 -26% | 69.2 -29% |
| AdobeRGB 1998 Coverage (%) | 72.4 | 73 1% | 89 23% | 53.2 -27% | 50.8 -30% |
| Response Times | 20% | 98% | -75% | -3% | |
| Response Time Grey 50% / Grey 80% * (ms) | 41.8 ? | 35.1 ? 16% | 0.32 ? 99% | 41.9 ? -0% | 40 ? 4% |
| Response Time Black / White * (ms) | 20 ? | 15.1 ? 24% | 0.54 ? 97% | 49.9 ? -150% | 22 ? -10% |
| PWM Frequency (Hz) | 480 ? | 1000 | 1000 ? | ||
| PWM Amplitude * (%) | 33 | 57 | 45 | ||
| Screen | 2% | 88% | -415% | -457% | |
| Brightness middle (cd/m²) | 537 | 485 -10% | 599 12% | 256 -52% | 504 -6% |
| Brightness (cd/m²) | 512 | 484 -5% | 603 18% | 251 -51% | 479 -6% |
| Brightness Distribution (%) | 89 | 93 4% | 99 11% | 86 -3% | 89 0% |
| Black Level * (cd/m²) | 0.44 | 0.24 45% | 0.05 89% | 0.26 41% | 0.46 -5% |
| Contrast (:1) | 1220 | 2021 66% | 11980 882% | 985 -19% | 1096 -10% |
| Colorchecker dE 2000 * | 0.7 | 0.9 -29% | 1.3 -86% | 9.81 -1301% | 9.65 -1279% |
| Colorchecker dE 2000 max. * | 1.1 | 1.7 -55% | 2.8 -155% | 15.04 -1267% | 20.35 -1750% |
| Greyscale dE 2000 * | 1.2 | 1.2 -0% | 2 -67% | 9.22 -668% | 8.43 -603% |
| Gamma | 2.13 103% | 2.16 102% | 2.15 102% | 3.17 69% | 3.07 72% |
| CCT | 6614 98% | 6704 97% | 6556 99% | 8339 78% | 8432 77% |
| Colorchecker dE 2000 calibrated * | 8.24 | 9.31 | |||
| Total Average (Program / Settings) | 8% /
4% | 69% /
74% | -172% /
-273% | -163% /
-289% |
* ... smaller is better


Display Response Times
| ↔ Response Time Black to White | ||
|---|---|---|
| 20 ms ... rise ↗ and fall ↘ combined | ↗ 7.6 ms rise | 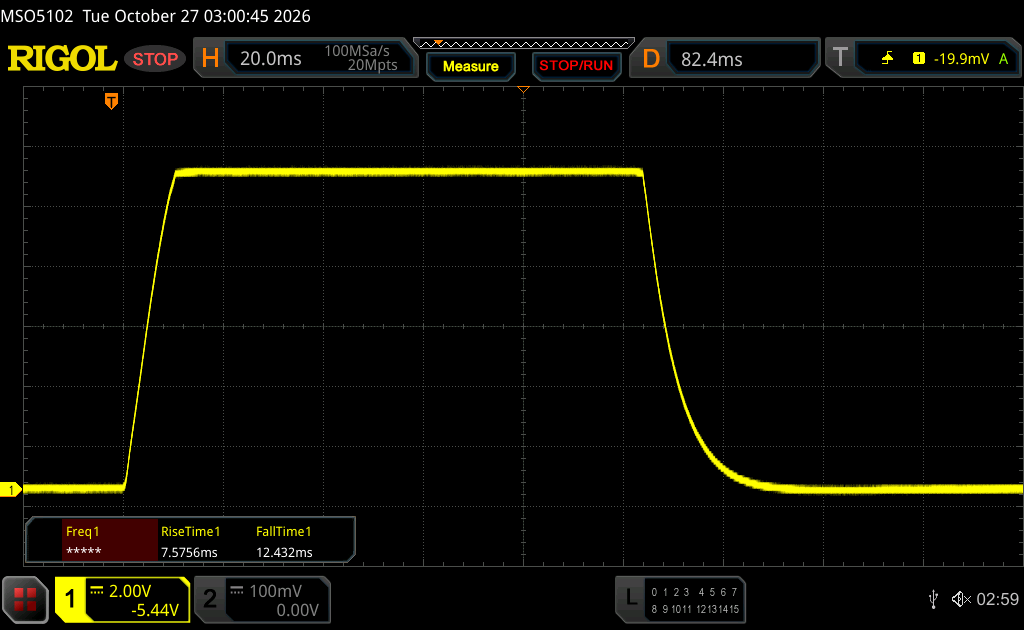 |
| ↘ 12.4 ms fall | ||
| The screen shows good response rates in our tests, but may be too slow for competitive gamers. In comparison, all tested devices range from 0.1 (minimum) to 240 (maximum) ms. » 44 % of all devices are better. This means that the measured response time is similar to the average of all tested devices (19.6 ms). | ||
| ↔ Response Time 50% Grey to 80% Grey | ||
| 41.8 ms ... rise ↗ and fall ↘ combined | ↗ 19 ms rise | 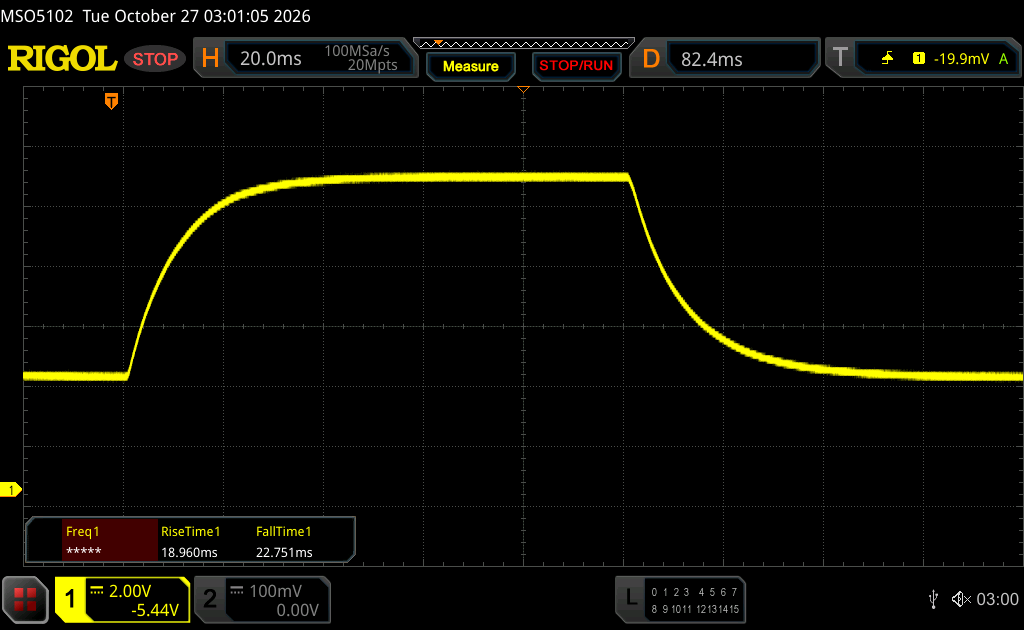 |
| ↘ 22.8 ms fall | ||
| The screen shows slow response rates in our tests and will be unsatisfactory for gamers. In comparison, all tested devices range from 0.13 (minimum) to 636 (maximum) ms. » 68 % of all devices are better. This means that the measured response time is worse than the average of all tested devices (30.6 ms). | ||
Screen Flickering / PWM (Pulse-Width Modulation)
| Screen flickering / PWM not detected |  | ||
In comparison: 52 % of all tested devices do not use PWM to dim the display. If PWM was detected, an average of 7564 (minimum: 5 - maximum: 343500) Hz was measured. | |||


Performance - Snapdragon X2 Plus
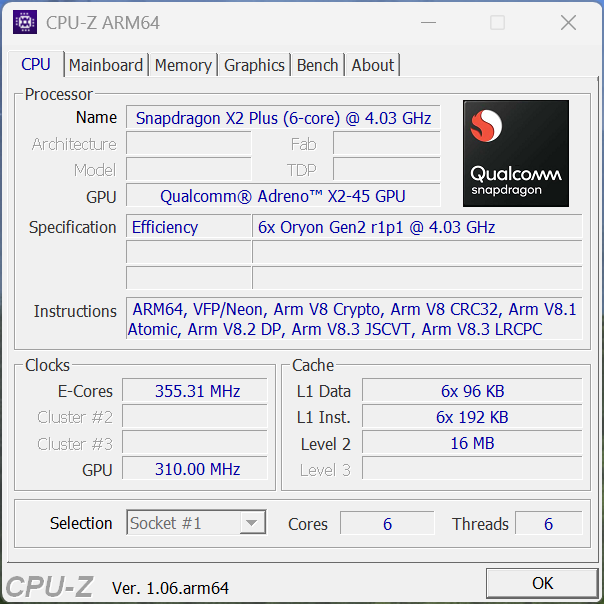
The Surface Pro 12 is equipped with the Snapdragon X2 Plus (6-core) CPU and at least 16 GB soldered RAM, but you can also get 24 GB RAM.
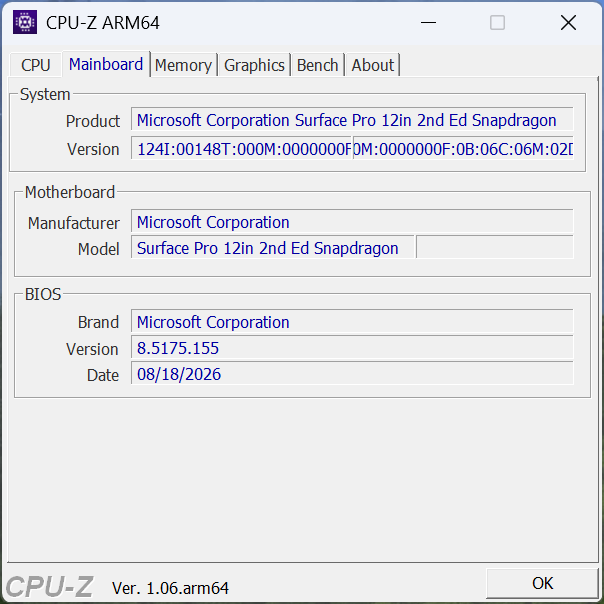
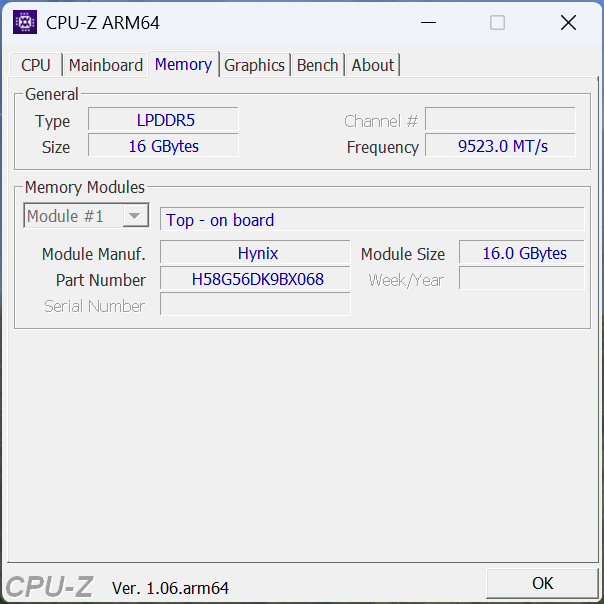
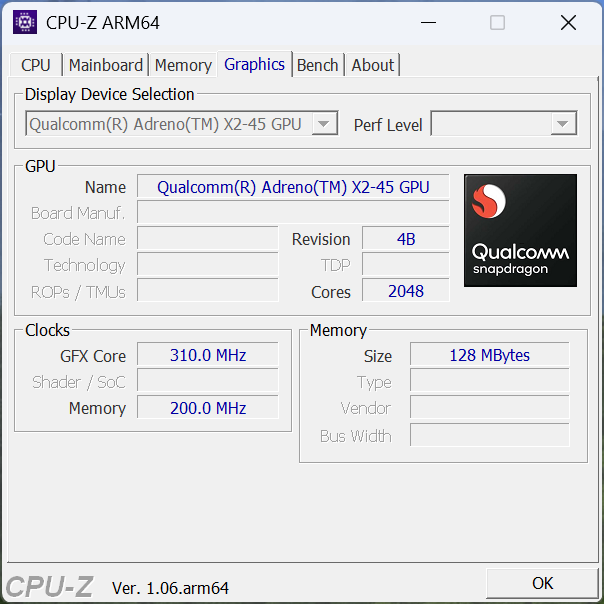
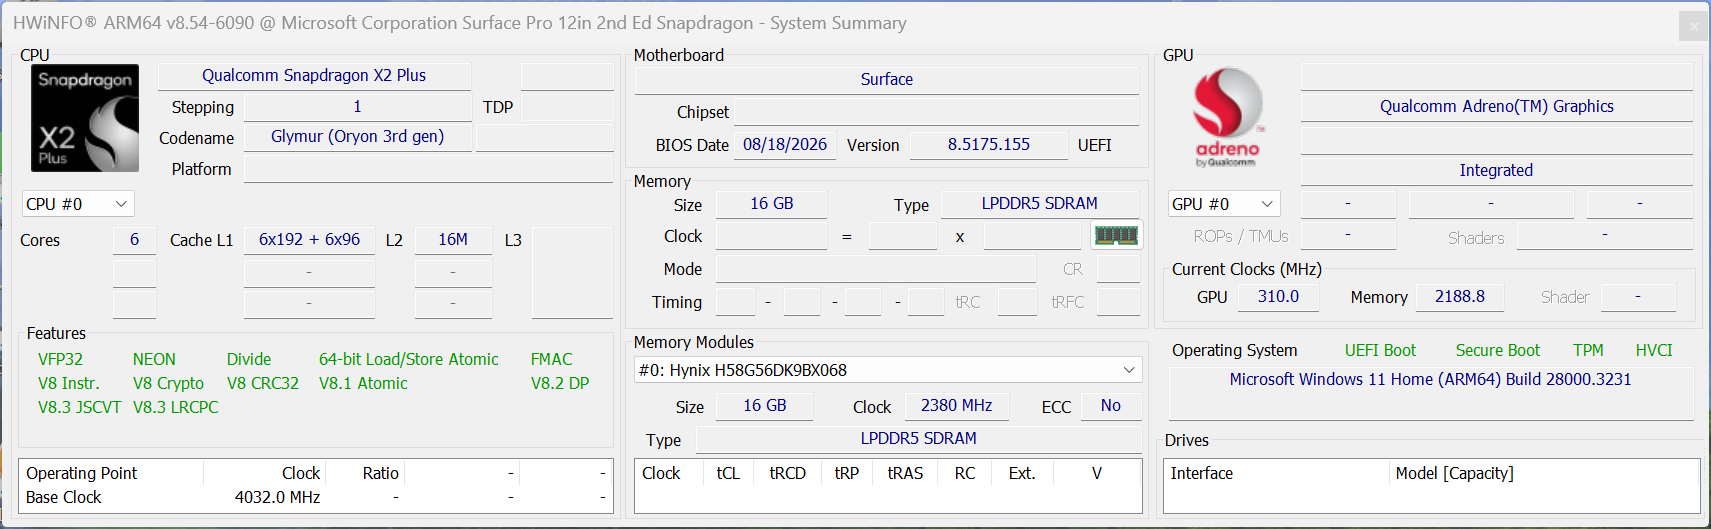
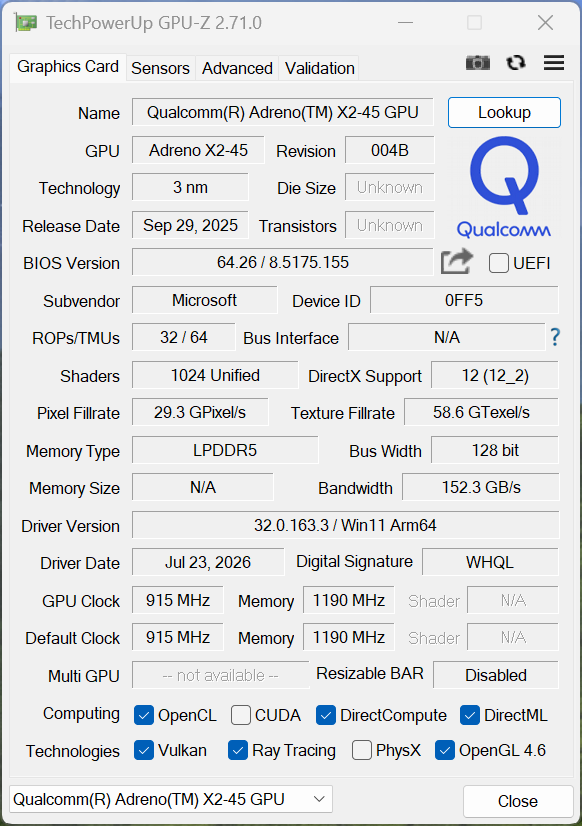
Testing Conditions
The Surface Pro only offers the default Windows power settings and we used Best Performance for our benchmarks.
Processor Performance
The new Snapdragon X2 Plus (X2P-42-100) offers six CPU cores and is the slowest X2 chip we have tested so far. The performance is still good, even though the multi-core performance is lower compared to the Surface Laptop 13 due to the passive cooling. Quite interestingly, the multi-core performance is also a bit worse compared to last year's X1P-42-100, which offered eight CPU cores. Overall, the CPU performance is still sufficient in practice and the strong single-core performance really helps here. The performance does not drop on battery power, either.
Cinebench 2024: CPU Multi Core | CPU Single Core
Geekbench 6.7: Multi-Core | Single-Core
| CPU Native Performance rating | |
| Microsoft Surface Pro 13 OLED | |
| Average Qualcomm Snapdragon X2 Plus X2P-42-100 | |
| Microsoft Surface Pro 12 2026 | |
| Average of class Convertible | |
| Microsoft Surface Pro 12 | |
| Alldocube iWork GT Ultra | |
| Ninkear S13, 16+1TB | |
| Cinebench 2024 / CPU Multi Core | |
| Microsoft Surface Pro 13 OLED | |
| Average of class Convertible (271 - 1673, n=47, last 2 years) | |
| Microsoft Surface Pro 12 | |
| Average Qualcomm Snapdragon X2 Plus X2P-42-100 (427 - 669, n=2) | |
| Microsoft Surface Pro 12 2026 | |
| Alldocube iWork GT Ultra | |
| Ninkear S13, 16+1TB | |
| Cinebench 2024 / CPU Single Core | |
| Microsoft Surface Pro 13 OLED | |
| Microsoft Surface Pro 12 2026 | |
| Average Qualcomm Snapdragon X2 Plus X2P-42-100 (130 - 130, n=2) | |
| Average of class Convertible (88 - 151, n=43, last 2 years) | |
| Microsoft Surface Pro 12 | |
| Ninkear S13, 16+1TB | |
| Alldocube iWork GT Ultra | |
| Geekbench 6.7 / Multi-Core | |
| Microsoft Surface Pro 13 OLED | |
| Average Qualcomm Snapdragon X2 Plus X2P-42-100 (11875 - 12070, n=3) | |
| Microsoft Surface Pro 12 2026 | |
| Average of class Convertible (2291 - 21269, n=48, last 2 years) | |
| Microsoft Surface Pro 12 | |
| Alldocube iWork GT Ultra | |
| Ninkear S13, 16+1TB | |
| Geekbench 6.7 / Single-Core | |
| Microsoft Surface Pro 13 OLED | |
| Average Qualcomm Snapdragon X2 Plus X2P-42-100 (3209 - 3269, n=3) | |
| Microsoft Surface Pro 12 2026 | |
| Average of class Convertible (1003 - 3801, n=49, last 2 years) | |
| Microsoft Surface Pro 12 | |
| Alldocube iWork GT Ultra | |
| Ninkear S13, 16+1TB | |
Cinebench R15 Multi Loop
Cinebench R23: Multi Core | Single Core
Cinebench R20: CPU (Multi Core) | CPU (Single Core)
Cinebench R15: CPU Multi 64Bit | CPU Single 64Bit
Blender: v2.79 BMW27 CPU
7-Zip 18.03: 7z b 4 | 7z b 4 -mmt1
HWBOT x265 Benchmark v2.2: 4k Preset
LibreOffice : 20 Documents To PDF
R Benchmark 2.5: Overall mean
| CPU Emulated Performance rating | |
| Average of class Convertible | |
| Microsoft Surface Pro 13 OLED | |
| Alldocube iWork GT Ultra -1! | |
| Average Qualcomm Snapdragon X2 Plus X2P-42-100 | |
| Microsoft Surface Pro 12 2026 | |
| Ninkear S13, 16+1TB | |
| Microsoft Surface Pro 12 | |
| Cinebench R23 / Multi Core | |
| Average of class Convertible (1317 - 30959, n=48, last 2 years) | |
| Microsoft Surface Pro 13 OLED | |
| Alldocube iWork GT Ultra | |
| Microsoft Surface Pro 12 | |
| Average Qualcomm Snapdragon X2 Plus X2P-42-100 (4922 - 6827, n=2) | |
| Microsoft Surface Pro 12 2026 | |
| Ninkear S13, 16+1TB | |
| Cinebench R23 / Single Core | |
| Average of class Convertible (740 - 2188, n=48, last 2 years) | |
| Alldocube iWork GT Ultra | |
| Ninkear S13, 16+1TB | |
| Microsoft Surface Pro 13 OLED | |
| Average Qualcomm Snapdragon X2 Plus X2P-42-100 (1395 - 1396, n=2) | |
| Microsoft Surface Pro 12 2026 | |
| Microsoft Surface Pro 12 | |
| Cinebench R20 / CPU (Multi Core) | |
| Average of class Convertible (595 - 12102, n=48, last 2 years) | |
| Microsoft Surface Pro 13 OLED | |
| Alldocube iWork GT Ultra | |
| Microsoft Surface Pro 12 | |
| Average Qualcomm Snapdragon X2 Plus X2P-42-100 (1837 - 2679, n=2) | |
| Ninkear S13, 16+1TB | |
| Microsoft Surface Pro 12 2026 | |
| Cinebench R20 / CPU (Single Core) | |
| Average of class Convertible (273 - 834, n=48, last 2 years) | |
| Alldocube iWork GT Ultra | |
| Ninkear S13, 16+1TB | |
| Average Qualcomm Snapdragon X2 Plus X2P-42-100 (530 - 532, n=2) | |
| Microsoft Surface Pro 12 2026 | |
| Microsoft Surface Pro 13 OLED | |
| Microsoft Surface Pro 12 | |
| Cinebench R15 / CPU Multi 64Bit | |
| Microsoft Surface Pro 13 OLED | |
| Average of class Convertible (727 - 4940, n=47, last 2 years) | |
| Average Qualcomm Snapdragon X2 Plus X2P-42-100 (1274 - 1395, n=2) | |
| Microsoft Surface Pro 12 2026 | |
| Alldocube iWork GT Ultra | |
| Microsoft Surface Pro 12 | |
| Ninkear S13, 16+1TB | |
| Cinebench R15 / CPU Single 64Bit | |
| Average of class Convertible (206 - 317, n=47, last 2 years) | |
| Microsoft Surface Pro 12 2026 | |
| Average Qualcomm Snapdragon X2 Plus X2P-42-100 (259 - 259, n=2) | |
| Microsoft Surface Pro 13 OLED | |
| Alldocube iWork GT Ultra | |
| Ninkear S13, 16+1TB | |
| Microsoft Surface Pro 12 | |
| Blender / v2.79 BMW27 CPU | |
| Microsoft Surface Pro 12 2026 | |
| Microsoft Surface Pro 12 | |
| Ninkear S13, 16+1TB | |
| Average Qualcomm Snapdragon X2 Plus X2P-42-100 (492 - 730, n=2) | |
| Alldocube iWork GT Ultra | |
| Average of class Convertible (105 - 730, n=46, last 2 years) | |
| Microsoft Surface Pro 13 OLED | |
| 7-Zip 18.03 / 7z b 4 | |
| Microsoft Surface Pro 13 OLED | |
| Average of class Convertible (21971 - 121368, n=46, last 2 years) | |
| Average Qualcomm Snapdragon X2 Plus X2P-42-100 (31368 - 31674, n=2) | |
| Microsoft Surface Pro 12 2026 | |
| Microsoft Surface Pro 12 | |
| Ninkear S13, 16+1TB | |
| 7-Zip 18.03 / 7z b 4 -mmt1 | |
| Microsoft Surface Pro 13 OLED | |
| Average of class Convertible (4151 - 6655, n=47, last 2 years) | |
| Average Qualcomm Snapdragon X2 Plus X2P-42-100 (5512 - 5514, n=2) | |
| Microsoft Surface Pro 12 2026 | |
| Microsoft Surface Pro 12 | |
| Alldocube iWork GT Ultra | |
| Ninkear S13, 16+1TB | |
| HWBOT x265 Benchmark v2.2 / 4k Preset | |
| Average of class Convertible (3.86 - 36.2, n=47, last 2 years) | |
| Alldocube iWork GT Ultra | |
| Microsoft Surface Pro 13 OLED | |
| Ninkear S13, 16+1TB | |
| Average Qualcomm Snapdragon X2 Plus X2P-42-100 (3.86 - 5.34, n=2) | |
| Microsoft Surface Pro 12 | |
| Microsoft Surface Pro 12 2026 | |
| LibreOffice / 20 Documents To PDF | |
| Ninkear S13, 16+1TB | |
| Alldocube iWork GT Ultra | |
| Microsoft Surface Pro 12 | |
| Average of class Convertible (39.6 - 75.5, n=47, last 2 years) | |
| Microsoft Surface Pro 13 OLED | |
| Average Qualcomm Snapdragon X2 Plus X2P-42-100 (46 - 46.3, n=2) | |
| Microsoft Surface Pro 12 2026 | |
| R Benchmark 2.5 / Overall mean | |
| Microsoft Surface Pro 12 | |
| Microsoft Surface Pro 13 OLED | |
| Microsoft Surface Pro 12 2026 | |
| Average Qualcomm Snapdragon X2 Plus X2P-42-100 (0.589 - 0.59, n=2) | |
| Ninkear S13, 16+1TB | |
| Alldocube iWork GT Ultra | |
| Average of class Convertible (0.3915 - 0.745, n=47, last 2 years) | |
* ... smaller is better
AIDA64: FP32 Ray-Trace | FPU Julia | CPU SHA3 | CPU Queen | FPU SinJulia | FPU Mandel | CPU AES | CPU ZLib | FP64 Ray-Trace | CPU PhotoWorxx | CPU CheckMate
| Performance rating | |
| Average of class Convertible | |
| Microsoft Surface Pro 13 OLED -1! | |
| Alldocube iWork GT Ultra -1! | |
| Ninkear S13, 16+1TB | |
| Microsoft Surface Pro 12 -1! | |
| Average Qualcomm Snapdragon X2 Plus X2P-42-100 -1! | |
| Microsoft Surface Pro 12 2026 -1! | |
| AIDA64 / FP32 Ray-Trace | |
| Average of class Convertible (1480 - 64158, n=47, last 2 years) | |
| Microsoft Surface Pro 13 OLED (v8.20.8100) | |
| Alldocube iWork GT Ultra (v8.20.8100) | |
| Ninkear S13, 16+1TB (v8.20.8100) | |
| Ninkear S13, 16+1TB (v6.92.6600) | |
| Average Qualcomm Snapdragon X2 Plus X2P-42-100 (3156 - 4652, n=2) | |
| Microsoft Surface Pro 12 2026 (v8.20.8100) | |
| Microsoft Surface Pro 12 (v6.92.6600) | |
| AIDA64 / FPU Julia | |
| Average of class Convertible (13318 - 188126, n=47, last 2 years) | |
| Alldocube iWork GT Ultra (v8.20.8100) | |
| Microsoft Surface Pro 13 OLED (v8.20.8100) | |
| Ninkear S13, 16+1TB (v6.92.6600) | |
| Ninkear S13, 16+1TB (v8.20.8100) | |
| Average Qualcomm Snapdragon X2 Plus X2P-42-100 (13318 - 16425, n=2) | |
| Microsoft Surface Pro 12 (v6.92.6600) | |
| Microsoft Surface Pro 12 2026 (v8.20.8100) | |
| AIDA64 / CPU SHA3 | |
| Microsoft Surface Pro 13 OLED (v8.20.8100) | |
| Average of class Convertible (892 - 8291, n=47, last 2 years) | |
| Microsoft Surface Pro 12 (v6.92.6600) | |
| Alldocube iWork GT Ultra (v8.20.8100) | |
| Average Qualcomm Snapdragon X2 Plus X2P-42-100 (1418 - 1979, n=2) | |
| Microsoft Surface Pro 12 2026 (v8.20.8100) | |
| Ninkear S13, 16+1TB (v6.92.6600) | |
| Ninkear S13, 16+1TB (v8.20.8100) | |
| AIDA64 / CPU Queen | |
| Average of class Convertible (14686 - 148874, n=31, last 2 years) | |
| Microsoft Surface Pro 12 (v6.92.6600) | |
| Ninkear S13, 16+1TB (v6.92.6600) | |
| AIDA64 / FPU SinJulia | |
| Average of class Convertible (1025 - 29155, n=47, last 2 years) | |
| Alldocube iWork GT Ultra (v8.20.8100) | |
| Ninkear S13, 16+1TB (v8.20.8100) | |
| Ninkear S13, 16+1TB (v6.92.6600) | |
| Microsoft Surface Pro 13 OLED (v8.20.8100) | |
| Microsoft Surface Pro 12 (v6.92.6600) | |
| Average Qualcomm Snapdragon X2 Plus X2P-42-100 (1025 - 1358, n=2) | |
| Microsoft Surface Pro 12 2026 (v8.20.8100) | |
| AIDA64 / FPU Mandel | |
| Average of class Convertible (4929 - 100132, n=47, last 2 years) | |
| Alldocube iWork GT Ultra (v8.20.8100) | |
| Microsoft Surface Pro 13 OLED (v8.20.8100) | |
| Ninkear S13, 16+1TB (v8.20.8100) | |
| Ninkear S13, 16+1TB (v6.92.6600) | |
| Average Qualcomm Snapdragon X2 Plus X2P-42-100 (6233 - 8559, n=2) | |
| Microsoft Surface Pro 12 2026 (v8.20.8100) | |
| Microsoft Surface Pro 12 (v6.92.6600) | |
| AIDA64 / CPU AES | |
| Microsoft Surface Pro 13 OLED (v8.20.8100) | |
| Average of class Convertible (5271 - 190280, n=47, last 2 years) | |
| Microsoft Surface Pro 12 (v6.92.6600) | |
| Alldocube iWork GT Ultra (v8.20.8100) | |
| Average Qualcomm Snapdragon X2 Plus X2P-42-100 (20148 - 41102, n=2) | |
| Ninkear S13, 16+1TB (v6.92.6600) | |
| Ninkear S13, 16+1TB (v8.20.8100) | |
| Microsoft Surface Pro 12 2026 (v8.20.8100) | |
| AIDA64 / CPU ZLib | |
| Microsoft Surface Pro 13 OLED (v8.20.8100) | |
| Average of class Convertible (227 - 2017, n=47, last 2 years) | |
| Alldocube iWork GT Ultra (v8.20.8100) | |
| Microsoft Surface Pro 12 (v6.92.6600) | |
| Ninkear S13, 16+1TB (v6.92.6600) | |
| Ninkear S13, 16+1TB (v8.20.8100) | |
| Average Qualcomm Snapdragon X2 Plus X2P-42-100 (227 - 459, n=2) | |
| Microsoft Surface Pro 12 2026 (v8.20.8100) | |
| AIDA64 / FP64 Ray-Trace | |
| Average of class Convertible (1561 - 34297, n=47, last 2 years) | |
| Microsoft Surface Pro 13 OLED (v8.20.8100) | |
| Alldocube iWork GT Ultra (v8.20.8100) | |
| Microsoft Surface Pro 12 (v6.92.6600) | |
| Ninkear S13, 16+1TB (v8.20.8100) | |
| Ninkear S13, 16+1TB (v6.92.6600) | |
| Average Qualcomm Snapdragon X2 Plus X2P-42-100 (1649 - 2539, n=2) | |
| Microsoft Surface Pro 12 2026 (v8.20.8100) | |
| AIDA64 / CPU PhotoWorxx | |
| Average of class Convertible (14193 - 85327, n=47, last 2 years) | |
| Alldocube iWork GT Ultra (v8.20.8100) | |
| Microsoft Surface Pro 13 OLED (v8.20.8100) | |
| Ninkear S13, 16+1TB (v6.92.6600) | |
| Ninkear S13, 16+1TB (v8.20.8100) | |
| Microsoft Surface Pro 12 (v6.92.6600) | |
| Average Qualcomm Snapdragon X2 Plus X2P-42-100 (26463 - 26989, n=2) | |
| Microsoft Surface Pro 12 2026 (v8.20.8100) | |
| AIDA64 / CPU CheckMate | |
| Average of class Convertible (574 - 10127, n=15, last 2 years) | |
| Alldocube iWork GT Ultra (v8.20.8100) | |
| Ninkear S13, 16+1TB (v8.20.8100) | |
| Microsoft Surface Pro 13 OLED (v8.20.8100) | |
| Average Qualcomm Snapdragon X2 Plus X2P-42-100 (574 - 618, n=2) | |
| Microsoft Surface Pro 12 2026 (v8.20.8100) | |
System and Storage Devices
System performance is good and the Surface Pro 12 is a responsive system. We did not encounter any stability issues, but keep in mind that the ARM version of Windows still has compatibility issues with some apps/games and accessories. The 256 GB UFS storage in our review unit is from Samsung and offers decent transfer rates.
CrossMark: Overall | Productivity | Creativity | Responsiveness
WebXPRT 4: Overall
WebXPRT 5: Overall
Mozilla Kraken 1.1: Total
| Performance rating | |
| Microsoft Surface Pro 13 OLED | |
| Average of class Convertible | |
| Microsoft Surface Pro 12 2026 | |
| Average Qualcomm Snapdragon X2 Plus X2P-42-100, Qualcomm SD X2 Adreno X2-45 | |
| Alldocube iWork GT Ultra | |
| Ninkear S13, 16+1TB -1! | |
| Microsoft Surface Pro 12 -1! | |
| CrossMark / Overall | |
| Average of class Convertible (524 - 2274, n=48, last 2 years) | |
| Microsoft Surface Pro 13 OLED | |
| Alldocube iWork GT Ultra | |
| Microsoft Surface Pro 12 2026 | |
| Average Qualcomm Snapdragon X2 Plus X2P-42-100, Qualcomm SD X2 Adreno X2-45 (1412 - 1521, n=2) | |
| Ninkear S13, 16+1TB | |
| Microsoft Surface Pro 12 | |
| CrossMark / Productivity | |
| Average of class Convertible (554 - 1988, n=48, last 2 years) | |
| Microsoft Surface Pro 12 2026 | |
| Alldocube iWork GT Ultra | |
| Average Qualcomm Snapdragon X2 Plus X2P-42-100, Qualcomm SD X2 Adreno X2-45 (1333 - 1473, n=2) | |
| Microsoft Surface Pro 13 OLED | |
| Ninkear S13, 16+1TB | |
| Microsoft Surface Pro 12 | |
| CrossMark / Creativity | |
| Average of class Convertible (550 - 2949, n=48, last 2 years) | |
| Alldocube iWork GT Ultra | |
| Microsoft Surface Pro 13 OLED | |
| Microsoft Surface Pro 12 2026 | |
| Average Qualcomm Snapdragon X2 Plus X2P-42-100, Qualcomm SD X2 Adreno X2-45 (1537 - 1553, n=2) | |
| Ninkear S13, 16+1TB | |
| Microsoft Surface Pro 12 | |
| CrossMark / Responsiveness | |
| Microsoft Surface Pro 12 2026 | |
| Average Qualcomm Snapdragon X2 Plus X2P-42-100, Qualcomm SD X2 Adreno X2-45 (1299 - 1573, n=2) | |
| Microsoft Surface Pro 13 OLED | |
| Average of class Convertible (381 - 1985, n=48, last 2 years) | |
| Ninkear S13, 16+1TB | |
| Alldocube iWork GT Ultra | |
| Microsoft Surface Pro 12 | |
| WebXPRT 4 / Overall | |
| Microsoft Surface Pro 13 OLED | |
| Microsoft Surface Pro 12 | |
| Average of class Convertible (91.2 - 391, n=47, last 2 years) | |
| Alldocube iWork GT Ultra | |
| Average Qualcomm Snapdragon X2 Plus X2P-42-100, Qualcomm SD X2 Adreno X2-45 (117.3 - 225, n=2) | |
| Microsoft Surface Pro 12 2026 | |
| WebXPRT 5 / Overall | |
| Microsoft Surface Pro 13 OLED | |
| Microsoft Surface Pro 12 2026 | |
| Average Qualcomm Snapdragon X2 Plus X2P-42-100, Qualcomm SD X2 Adreno X2-45 (100 - 100, n=2) | |
| Average of class Convertible (65 - 122, n=14, last 2 years) | |
| Alldocube iWork GT Ultra | |
| Ninkear S13, 16+1TB | |
| Mozilla Kraken 1.1 / Total | |
| Alldocube iWork GT Ultra | |
| Ninkear S13, 16+1TB | |
| Average of class Convertible (270 - 1089, n=50, last 2 years) | |
| Average Qualcomm Snapdragon X2 Plus X2P-42-100, Qualcomm SD X2 Adreno X2-45 (447 - 490, n=2) | |
| Microsoft Surface Pro 12 2026 | |
| Microsoft Surface Pro 12 | |
| Microsoft Surface Pro 13 OLED | |
* ... smaller is better
| AIDA64 / Memory Copy | |
| Average of class Convertible (23880 - 161475, n=47, last 2 years) | |
| Alldocube iWork GT Ultra | |
| Microsoft Surface Pro 12 | |
| Ninkear S13, 16+1TB | |
| Ninkear S13, 16+1TB | |
| Microsoft Surface Pro 13 OLED | |
| Microsoft Surface Pro 12 2026 | |
| Average Qualcomm Snapdragon X2 Plus X2P-42-100 (49091 - 51307, n=2) | |
| AIDA64 / Memory Read | |
| Microsoft Surface Pro 12 | |
| Microsoft Surface Pro 13 OLED | |
| Microsoft Surface Pro 12 2026 | |
| Average Qualcomm Snapdragon X2 Plus X2P-42-100 (81838 - 82544, n=2) | |
| Average of class Convertible (19931 - 131960, n=48, last 2 years) | |
| Alldocube iWork GT Ultra | |
| Ninkear S13, 16+1TB | |
| Ninkear S13, 16+1TB | |
| AIDA64 / Memory Write | |
| Average of class Convertible (17473 - 216896, n=47, last 2 years) | |
| Alldocube iWork GT Ultra | |
| Ninkear S13, 16+1TB | |
| Ninkear S13, 16+1TB | |
| Microsoft Surface Pro 12 | |
| Microsoft Surface Pro 13 OLED | |
| Average Qualcomm Snapdragon X2 Plus X2P-42-100 (40774 - 42504, n=2) | |
| Microsoft Surface Pro 12 2026 | |
| AIDA64 / Memory Latency | |
| Ninkear S13, 16+1TB | |
| Ninkear S13, 16+1TB | |
| Alldocube iWork GT Ultra | |
| Average of class Convertible (6.6 - 536, n=45, last 2 years) | |
| Microsoft Surface Pro 12 | |
* ... smaller is better

* ... smaller is better
Disk Throttling: DiskSpd Read Loop, Queue Depth 8
GPU and Gaming Performance
The new Adreno X2-45 iGPU is limited to a maximum clock of 915 MHz and is the slowest version we have tested so far. It is around 20 % faster than the old Adreno X1-45 in last year's model. The iGPU is still perfectly adequate for daily tasks including high-resolution video playback, but gaming is problematic due to the low overall performance level as well as compatibility issues. Streaming services like Xbox cloud gaming or GeForce Now are better options if you want to play games.
| 3DMark 11 Performance | 5475 points | |
| 3DMark Fire Strike Score | 4310 points | |
| 3DMark Time Spy Score | 1559 points | |
| 3DMark Steel Nomad Score | 413 points | |
| 3DMark Steel Nomad Light Score | 1811 points | |
Help | ||
| Blender / v3.3 Classroom CPU | |
| Microsoft Surface Pro 12 2026 | |
| Microsoft Surface Pro 12 | |
| Ninkear S13, 16+1TB | |
| Average Qualcomm SD X2 Adreno X2-45 (693 - 1473, n=3) | |
| Alldocube iWork GT Ultra | |
| Microsoft Surface Pro 13 OLED | |
| Average of class Convertible (159 - 1473, n=47, last 2 years) | |
* ... smaller is better
| Performance rating - Percent | |
| Average of class Convertible | |
| Microsoft Surface Pro 13 OLED | |
| Alldocube iWork GT Ultra | |
| Microsoft Surface Pro 12 2026 | |
| Microsoft Surface Pro 12 -3! | |
| Ninkear S13, 16+1TB | |
| Cyberpunk 2077 - 1920x1080 Ultra Preset (FSR off) | |
| Average of class Convertible (8.22 - 79.5, n=48, last 2 years) | |
| Microsoft Surface Pro 13 OLED | |
| Alldocube iWork GT Ultra | |
| Microsoft Surface Pro 12 2026 | |
| Ninkear S13, 16+1TB | |
| Microsoft Surface Pro 12 | |
| Baldur's Gate 3 - 1920x1080 Ultra Preset AA:T | |
| Average of class Convertible (9.18 - 90.5, n=44, last 2 years) | |
| Microsoft Surface Pro 13 OLED | |
| Alldocube iWork GT Ultra | |
| Microsoft Surface Pro 12 2026 | |
| Ninkear S13, 16+1TB | |
| GTA V - 1920x1080 Highest AA:4xMSAA + FX AF:16x | |
| Microsoft Surface Pro 13 OLED | |
| Average of class Convertible (7.14 - 90.6, n=41, last 2 years) | |
| Microsoft Surface Pro 12 2026 | |
| Alldocube iWork GT Ultra | |
| Microsoft Surface Pro 12 | |
| Ninkear S13, 16+1TB | |
| Final Fantasy XV Benchmark - 1920x1080 High Quality | |
| Average of class Convertible (10.1 - 86.6, n=44, last 2 years) | |
| Alldocube iWork GT Ultra | |
| Microsoft Surface Pro 13 OLED | |
| Ninkear S13, 16+1TB | |
| Microsoft Surface Pro 12 2026 | |
| Strange Brigade - 1920x1080 ultra AA:ultra AF:16 | |
| Average of class Convertible (19 - 176.8, n=44, last 2 years) | |
| Microsoft Surface Pro 13 OLED | |
| Alldocube iWork GT Ultra | |
| Ninkear S13, 16+1TB | |
| Ninkear S13, 16+1TB | |
| Microsoft Surface Pro 12 2026 | |
| Microsoft Surface Pro 12 | |
| Dota 2 Reborn - 1920x1080 ultra (3/3) best looking | |
| Average of class Convertible (34.6 - 142, n=48, last 2 years) | |
| Alldocube iWork GT Ultra | |
| Microsoft Surface Pro 12 2026 | |
| Microsoft Surface Pro 13 OLED | |
| Microsoft Surface Pro 12 | |
| Ninkear S13, 16+1TB | |
| X-Plane 11.11 - 1920x1080 high (fps_test=3) | |
| Microsoft Surface Pro 13 OLED | |
| Average of class Convertible (19.1 - 76.7, n=47, last 2 years) | |
| Microsoft Surface Pro 12 2026 | |
| Alldocube iWork GT Ultra | |
| Ninkear S13, 16+1TB | |
Cyberpunk 2077 ultra FPS Chart
| low | med. | high | ultra | |
|---|---|---|---|---|
| GTA V (2015) | 105.6 | 84.7 | 37.7 | 18 |
| Dota 2 Reborn (2015) | 110.9 | 90.7 | 74.2 | 65.5 |
| Final Fantasy XV Benchmark (2018) | 47.5 | 24.9 | 14.1 | |
| X-Plane 11.11 (2018) | 47.3 | 36.3 | 31 | |
| Strange Brigade (2018) | 108.1 | 40.3 | 31.7 | 26.9 |
| Baldur's Gate 3 (2023) | 19 | 15.6 | 13.5 | 13.2 |
| Cyberpunk 2077 (2023) | 21.7 | 16.8 | 14.3 | 12.2 |
Emissions & Power Consumption
System Noise
The Surface Pro 12 is once again a passively cooled device, so there are no fan noises. We did not hear any other electronic noises (like coil whine), either.
| Microsoft Surface Pro 12 2026 SD X2 Plus X2P-42-100, Adreno X2-45 | Microsoft Surface Pro 12 SD X Plus X1P-42-100, Adreno X1-45 1.7 TFLOPS | Microsoft Surface Pro 13 OLED X2E-78-100, X2-85 | Ninkear S13, 16+1TB Ultra 5 115U, Graphics 4-Core iGPU (Arrow Lake) | Alldocube iWork GT Ultra Ultra 5 125H, Arc 7-Core | |
|---|---|---|---|---|---|
| Noise | |||||
| off / environment * (dB) | 25.1 | 24.9 | 24.9 | ||
| Idle Minimum * (dB) | 25.1 | 24.9 | 26.4 | ||
| Idle Average * (dB) | 25.1 | 24.9 | 26.7 | ||
| Idle Maximum * (dB) | 25.1 | 25 | 26.8 | ||
| Load Average * (dB) | 25.1 | 26.1 | 39.3 | ||
| Cyberpunk 2077 ultra * (dB) | 38.5 | 28.4 | 40.4 | ||
| Load Maximum * (dB) | 47.2 | 27.9 | 40.3 | ||
| Witcher 3 ultra * (dB) | 27.8 | 40.2 |
* ... smaller is better
Temperature
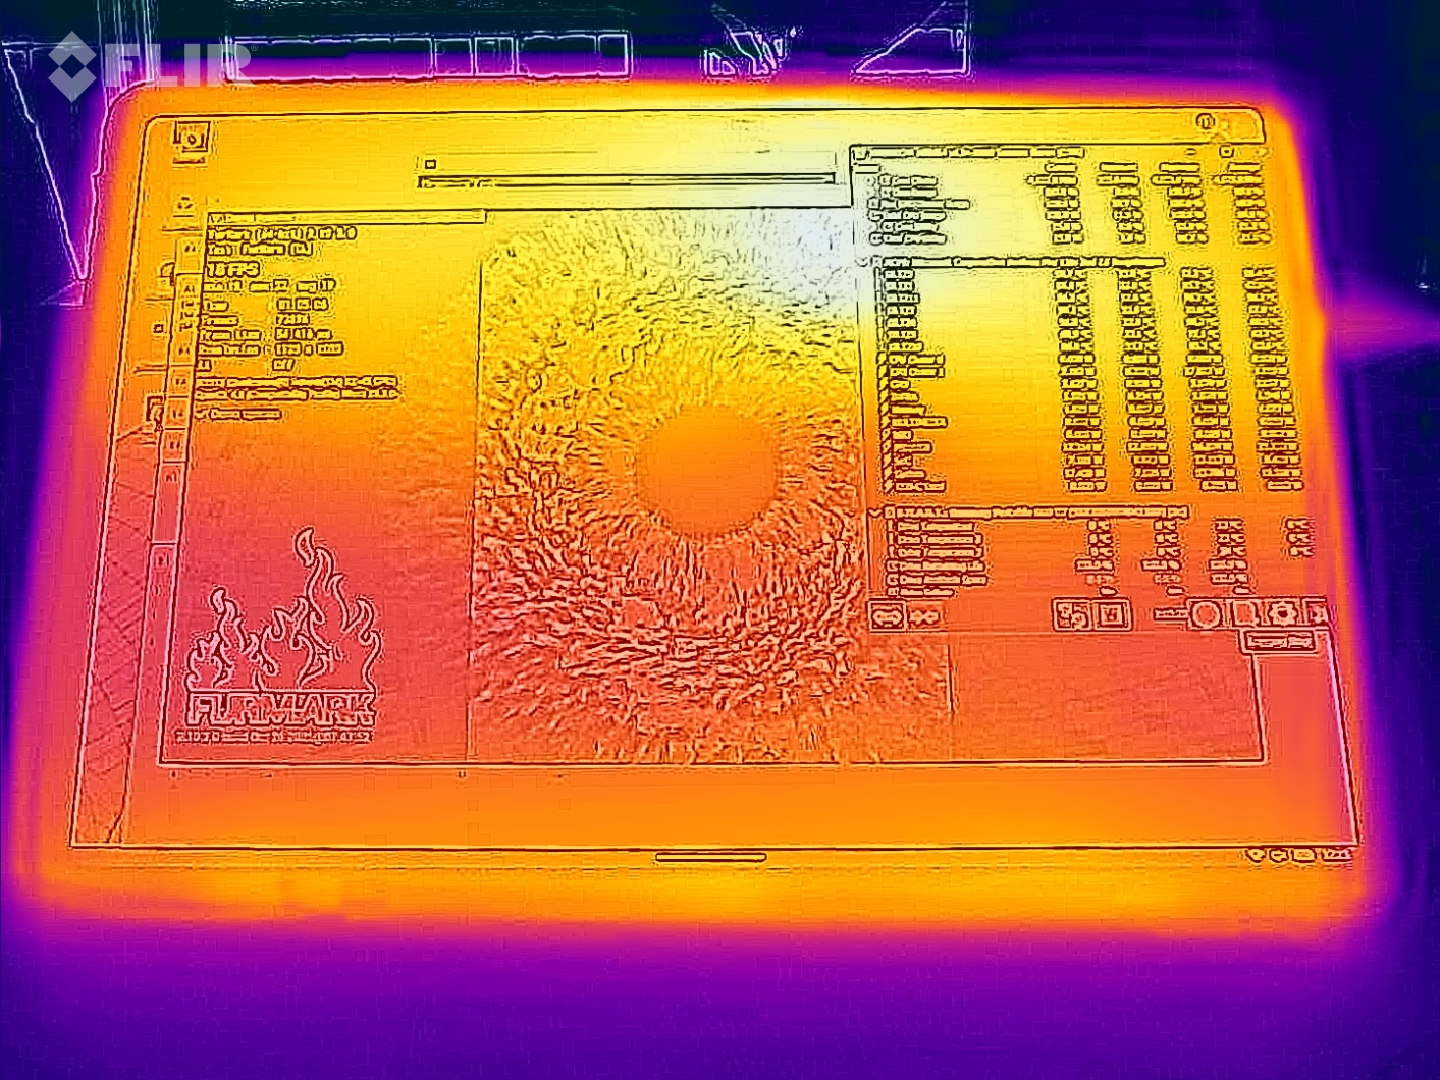
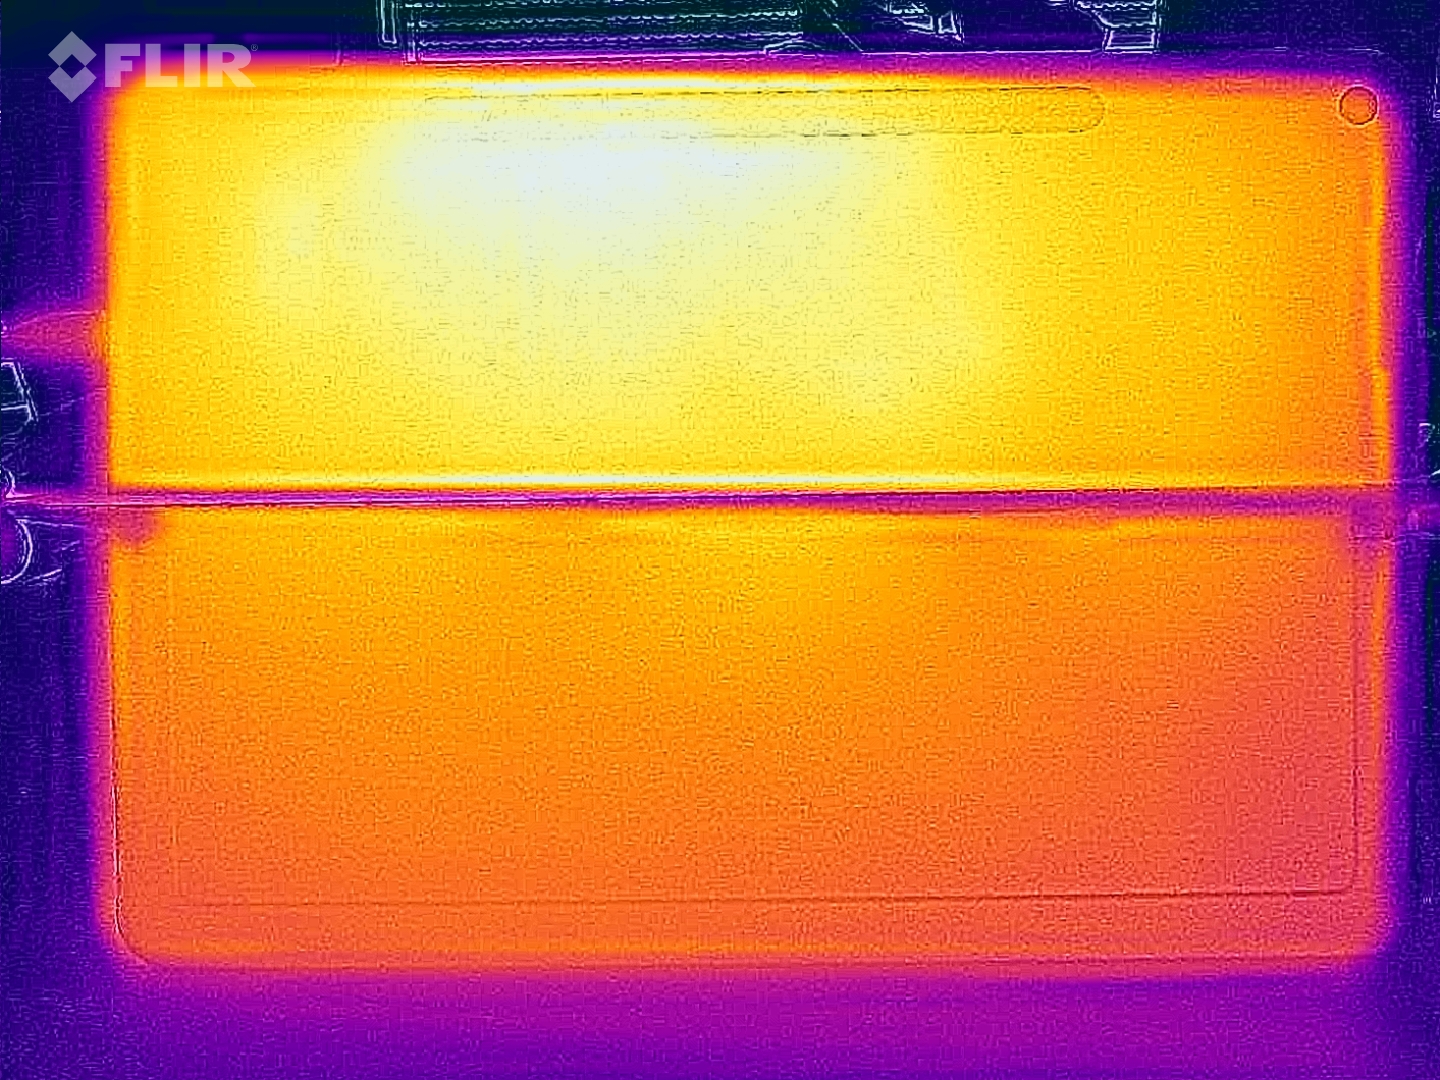
The surface temperatures are usually pretty cool and only warm up noticeably when you really stress the small tablet. During our stress test, we measured around 42-43 at some spots, which is noticeable, but not distracting. The new 2026 model is also slightly cooler than the previous version. During our stress test with combined CPU/GPU load, the Snapdragon X2 Plus SoC starts at 33 Watts, but quickly levels off at around 8 Watts.

(±) The maximum temperature on the upper side is 42.4 °C / 108 F, compared to the average of 35.4 °C / 96 F, ranging from 19.6 to 60 °C for the class Convertible.
(±) The bottom heats up to a maximum of 43.5 °C / 110 F, compared to the average of 36.9 °C / 98 F
(+) In idle usage, the average temperature for the upper side is 24.4 °C / 76 F, compared to the device average of 30.3 °C / 87 F.
(±) The palmrests and touchpad can get very hot to the touch with a maximum of 38.6 °C / 101.5 F.
(-) The average temperature of the palmrest area of similar devices was 28 °C / 82.4 F (-10.6 °C / -19.1 F).
| Microsoft Surface Pro 12 2026 SD X2 Plus X2P-42-100, Adreno X2-45 | Microsoft Surface Pro 12 SD X Plus X1P-42-100, Adreno X1-45 1.7 TFLOPS | Microsoft Surface Pro 13 OLED X2E-78-100, X2-85 | Ninkear S13, 16+1TB Ultra 5 115U, Graphics 4-Core iGPU (Arrow Lake) | Alldocube iWork GT Ultra Ultra 5 125H, Arc 7-Core | |
|---|---|---|---|---|---|
| Heat | -4% | -6% | -21% | -20% | |
| Maximum Upper Side * (°C) | 42.4 | 44.7 -5% | 43.1 -2% | 41.8 1% | 45.6 -8% |
| Maximum Bottom * (°C) | 43.5 | 45.1 -4% | 45.9 -6% | 46 -6% | 46.3 -6% |
| Idle Upper Side * (°C) | 25 | 26 -4% | 26.8 -7% | 34.5 -38% | 32.1 -28% |
| Idle Bottom * (°C) | 24.9 | 25.5 -2% | 27.2 -9% | 34.9 -40% | 34 -37% |
* ... smaller is better
Speakers
The stereo speakers are just average and lack punch. High tones are very clear though, which is an advantage for voices.
Microsoft Surface Pro 12 2026 audio analysis
(+) | speakers can play relatively loud (86.5 dB)
Bass 100 - 315 Hz
(-) | nearly no bass - on average 15% lower than median
(±) | linearity of bass is average (12.8% delta to prev. frequency)
Mids 400 - 2000 Hz
(±) | higher mids - on average 9.7% higher than median
(+) | mids are linear (6.1% delta to prev. frequency)
Highs 2 - 16 kHz
(+) | balanced highs - only 4.7% away from median
(+) | highs are linear (4.5% delta to prev. frequency)
Overall 100 - 16.000 Hz
(±) | linearity of overall sound is average (18% difference to median)
Compared to same class
» 40% of all tested devices in this class were better, 7% similar, 53% worse
» The best had a delta of 6%, average was 20%, worst was 57%
Compared to all devices tested
» 39% of all tested devices were better, 8% similar, 54% worse
» The best had a delta of 4%, average was 23%, worst was 136%
Microsoft Surface Pro 12 audio analysis
(+) | speakers can play relatively loud (82.1 dB)
Bass 100 - 315 Hz
(-) | nearly no bass - on average 17.4% lower than median
(±) | linearity of bass is average (10.7% delta to prev. frequency)
Mids 400 - 2000 Hz
(±) | higher mids - on average 5.1% higher than median
(+) | mids are linear (3.1% delta to prev. frequency)
Highs 2 - 16 kHz
(+) | balanced highs - only 3.6% away from median
(+) | highs are linear (4.1% delta to prev. frequency)
Overall 100 - 16.000 Hz
(±) | linearity of overall sound is average (15.6% difference to median)
Compared to same class
» 27% of all tested devices in this class were better, 4% similar, 69% worse
» The best had a delta of 6%, average was 20%, worst was 57%
Compared to all devices tested
» 24% of all tested devices were better, 5% similar, 71% worse
» The best had a delta of 4%, average was 23%, worst was 136%
Microsoft Surface Pro 13 OLED audio analysis
(+) | speakers can play relatively loud (84.9 dB)
Bass 100 - 315 Hz
(±) | reduced bass - on average 11.7% lower than median
(±) | linearity of bass is average (11.4% delta to prev. frequency)
Mids 400 - 2000 Hz
(±) | higher mids - on average 6.6% higher than median
(+) | mids are linear (3.5% delta to prev. frequency)
Highs 2 - 16 kHz
(+) | balanced highs - only 3.9% away from median
(+) | highs are linear (5.1% delta to prev. frequency)
Overall 100 - 16.000 Hz
(+) | overall sound is linear (13.7% difference to median)
Compared to same class
» 26% of all tested devices in this class were better, 5% similar, 69% worse
» The best had a delta of 7%, average was 21%, worst was 130%
Compared to all devices tested
» 16% of all tested devices were better, 4% similar, 81% worse
» The best had a delta of 4%, average was 23%, worst was 136%
Ninkear S13, 16+1TB audio analysis
(-) | not very loud speakers (70.2 dB)
Bass 100 - 315 Hz
(-) | nearly no bass - on average 19.8% lower than median
(±) | linearity of bass is average (12.1% delta to prev. frequency)
Mids 400 - 2000 Hz
(±) | higher mids - on average 5.6% higher than median
(±) | linearity of mids is average (8.7% delta to prev. frequency)
Highs 2 - 16 kHz
(±) | higher highs - on average 5.5% higher than median
(±) | linearity of highs is average (7.6% delta to prev. frequency)
Overall 100 - 16.000 Hz
(±) | linearity of overall sound is average (28.3% difference to median)
Compared to same class
» 86% of all tested devices in this class were better, 3% similar, 12% worse
» The best had a delta of 6%, average was 20%, worst was 57%
Compared to all devices tested
» 86% of all tested devices were better, 3% similar, 11% worse
» The best had a delta of 4%, average was 23%, worst was 136%
Alldocube iWork GT Ultra audio analysis
(±) | speaker loudness is average but good (73 dB)
Bass 100 - 315 Hz
(-) | nearly no bass - on average 22.6% lower than median
(±) | linearity of bass is average (8.3% delta to prev. frequency)
Mids 400 - 2000 Hz
(+) | balanced mids - only 4.1% away from median
(±) | linearity of mids is average (7.8% delta to prev. frequency)
Highs 2 - 16 kHz
(±) | higher highs - on average 5% higher than median
(±) | linearity of highs is average (8.6% delta to prev. frequency)
Overall 100 - 16.000 Hz
(±) | linearity of overall sound is average (25.6% difference to median)
Compared to same class
» 79% of all tested devices in this class were better, 5% similar, 17% worse
» The best had a delta of 6%, average was 20%, worst was 57%
Compared to all devices tested
» 79% of all tested devices were better, 4% similar, 17% worse
» The best had a delta of 4%, average was 23%, worst was 136%
Power Consumption and Battery Life
The new screen also consumes more power than the old model, which also affects the battery runtime, even though the Snapdragon X2 Plus SoC is more efficient. We recorded a Wi-Fi battery runtime of 14 hours at 150 nits and 8 hours at maximum brightness, which is around 40 minutes shorter than before. The maximum power consumption was 52 Watts at the beginning of our stress test, but quickly dropped to 18-21 Watts.
| Off / Standby |   0.13 / 0.4 Watt |
| Idle |  2.2 / 6.3 / 6.5 Watt |
| Load |
27.2 / 52.3 Watt |
    
| |
Key:
min: ,
med: ,
max: Metrahit Energy | |
| Microsoft Surface Pro 12 2026 Adreno X2-45, SD X2 Plus X2P-42-100, 256 GB UFS 4.1 Flash | Microsoft Surface Pro 12 Adreno X1-45 1.7 TFLOPS, SD X Plus X1P-42-100, 512 GB UFS 4.0 Flash | Microsoft Surface Pro 13 OLED X2-85, X2E-78-100, SK hynix PVC10 HFS512GEM4X182N | Ninkear S13, 16+1TB Graphics 4-Core iGPU (Arrow Lake), Ultra 5 115U, Netac NS1T0BSSD610 | Alldocube iWork GT Ultra Arc 7-Core, Ultra 5 125H, Netac NS1T0BSSD610 | |
|---|---|---|---|---|---|
| Power Consumption | 23% | -24% | -42% | -115% | |
| Idle Minimum * (Watt) | 2.2 | 1.2 45% | 4.8 -118% | 5.6 -155% | 8 -264% |
| Idle Average * (Watt) | 6.3 | 4.1 35% | 6.1 3% | 8.1 -29% | 13.1 -108% |
| Idle Maximum * (Watt) | 6.5 | 4.7 28% | 6.7 -3% | 11.1 -71% | 16.5 -154% |
| Load Average * (Watt) | 27.2 | 22.5 17% | 30.4 -12% | 40.9 -50% | |
| Cyberpunk 2077 ultra external monitor * (Watt) | 21.6 | 20.3 6% | 33.7 -56% | 26.3 -22% | 41 -90% |
| Cyberpunk 2077 ultra * (Watt) | 21.2 | 20 6% | 20.3 4% | 28.4 -34% | 41.4 -95% |
| Load Maximum * (Watt) | 52.3 | 44.5 15% | 60.3 -15% | 36.7 30% | 75.9 -45% |
* ... smaller is better
Power Consumption Cyberpunk / Stress Test
Power Consumption external Monitor
Notebookcheck Rating
Microsoft Surface Pro 12 2026
- 11/03/2026 v8
Andreas Osthoff
 Total Sustainability Score:
Potential Competitors in Comparison
Image | Model / Review | Price | Weight | Height | Display |
|---|---|---|---|---|---|
1. 86.2%  | Microsoft Surface Pro 12 2026 Qualcomm Snapdragon X2 Plus X2P-42-100 ⎘ Qualcomm SD X2 Adreno X2-45 ⎘ 16 GB Memory, 256 GB UFS 4.x | List Price: 1239€ | 688 g | 7.8 mm | 12.00" 2196x1464 220 PPI IPS |
2. 85.8% 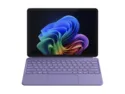 | Microsoft Surface Pro 12 Qualcomm Snapdragon X Plus X1P-42-100 ⎘ Qualcomm SD X Adreno X1-45 1.7 TFLOPS ⎘ 16 GB Memory, 512 GB UFS 4.x | List Price: 1460€ | 1 kg | 13 mm | 12.00" 2196x1464 220 PPI IPS |
3. 83.7%  | Microsoft Surface Pro 13 OLED Qualcomm Snapdragon X2 Elite X2E-78-100 ⎘ Qualcomm Adreno X2-85 ⎘ 16 GB Memory, 512 GB SSD | List Price: 1899€ | 882 g | 9.3 mm | 13.00" 2880x1920 266 PPI OLED |
4. 78.9%  | Ninkear S13, 16+1TB Intel Core Ultra 5 115U ⎘ Intel Graphics 4-Core iGPU (Meteor / Arrow Lake) ⎘ 16 GB Memory, 1024 GB SSD | List Price: 859€ | 870 g | 9.89 mm | 13.00" 2560x1600 232 PPI IPS |
5. 78.5%  | Alldocube iWork GT Ultra Intel Core Ultra 5 125H ⎘ Intel Arc 7-Core iGPU ⎘ 16 GB Memory, 1024 GB SSD | Amazon: List Price: 799€ | 870 g | 9.89 mm | 13.00" 2560x1600 232 PPI IPS |
Transparency
The selection of devices to be reviewed is made by our editorial team. The test sample was provided to the author as a loan by the manufacturer or retailer for the purpose of this review. The lender had no influence on this review, nor did the manufacturer receive a copy of this review before publication. There was no obligation to publish this review. As an independent media company, Notebookcheck is not subjected to the authority of manufacturers, retailers or publishers.
This is how Notebookcheck is testing
Every year, Notebookcheck independently reviews hundreds of laptops and smartphones using standardized procedures to ensure that all results are comparable. We have continuously developed our test methods for around 20 years and set industry standards in the process. In our test labs, high-quality measuring equipment is utilized by experienced technicians and editors. These tests involve a multi-stage validation process. Our complex rating system is based on hundreds of well-founded measurements and benchmarks, which maintains objectivity. Further information on our test methods can be found here.
 Add as a preferred source on Google


